| The House Energy Bill -- What You Can Do to Help Change Federal Energy Policy for the Better | The Oil Drum | The Anglo Disease - an introduction |
The Coal Question and Climate Change
Posted by Prof. Goose on June 25, 2007 - 9:52am
This is a guest post by Dave Rutledge, Chair for the Division of Engineering and Applied Science at Caltech, which has 12 departments with 75 faculty members and 500 graduate students.
Dave is fascinated by the possibility that the key to understanding the future of world coal production may be in the history of the mining areas in the northern Appalachians and the north of England. Dave is also interested in the question of how California will make the transition from fossil fuels to renewable fuels for electricity production.
At The Oil Drum, there has been much discussion of the modeling of future oil production and the reliability of reserve data. It is also understood that burning fossil hydrocarbon fuels increases the CO2 concentration in the atmosphere, and that this is likely to affect our climate. What about coal? Can we figure out how much coal is likely to be produced, and how quickly the coal reserves will be exhausted? How reliable are coal reserve numbers? What can our models for coal and hydrocarbon production tell us about atmospheric CO2 concentrations? About climate? It turns out that we can give answers to all of these questions, using the same Hubbert linearizations and normal curve fits that we use for oil.
The importance of these approaches to estimating future production is emphasized by this astonishing statement in the pre-publication version of the National Academy of Sciences Report on coal, released yesterday:
Present estimates of coal reserves are based upon methods that have not been reviewed or revised since their inception in 1974, and much of the input data were compiled in the early 1970s. Recent programs to assess reserves in limited areas using updated methods indicate that only a small fraction of previously estimated reserves are actually minable reserves.
I appreciate this opportunity to contribute a post to The Oil Drum. This site is the most important forum for the discussion of oil production, because of the vigor and depth of the debate. I would like to offer some calculations for coal production and climate change. I hope you that find coal as interesting as oil. Coal is the most important fossil fuel for generating electricity, and it is a major source of atmospheric CO2.
Oil reserves are rightly viewed skeptically at The Oil Drum, in large part because of fraud by the OPEC countries. Coal reserves are compiled by the national geological surveys, and unlike oil reserves, they are honest. However, recently Dr. Werner Zittel and Jorg Schindler and their Energy Watch Group have written an important paper “Coal: Resources and Future Production” that shows that there are major problems with the reliability of coal reserves, and indicates that the reserves may be too high. Coal is different from oil, and much of the intuition that we may have developed about oil from nights pondering TOD posts is wrong for coal. Finding oil is hard, and we have not found it all yet. In contrast, people knew where the coal was a century ago. Once oil is found, it is likely to be produced quickly, so much so that discovery history is routinely used to predict future production. On the other hand, there are large coal fields that are almost undeveloped. As an example, Montana has larger coal reserves than Europe, Africa, or South America, but it is producing less than 0.1% of that coal each year. Our estimate of future coal production depends a lot on whether we think that the people of Montana will get into serious coal production. Finally, in contrast to the situation for oil, the world market for coal is only partially developed. Most coal is consumed in the country it is produced in, and there are large differences in prices, even in the same country. For this reason, we will analyze production on a regional basis. I will apply the techniques to coal that are routinely used here for oil, and consider the consequences for future climate change. People who are interested in more details can get the spreadsheets with the raw data at my web site, with lots of additional figures and source links.
The authoritative source of information on climate change is the UN Intergovernmental Panel on Climate Change (IPCC), which is releasing its 4th Assessment Report this year. This is a mammoth undertaking, with more than 1,000 authors and more then 1,000 reviewers. The fossil-fuel contribution to climate change is considered in terms of 40 scenarios, each considered to be equally valid. In the assessment modeling, the factors for future fossil-fuel production are primarily population, policy, and GDP, and limitations in fossil-fuel supplies are not considered critically. Parts of the scenarios would strike most readers at The Oil Drum as preposterous. For example, in 17 of the scenarios, world oil production is higher in 2100 than it was in 2000. Even OPEC oil ministers do not make that claim.
Thinking about climate change also requires adjusting to the long time scales. At the Oil Drum, there is much discussion of whether the Ghawar field will decline next year. However, from the point of view of a temperature peak in the next century, it matters little whether we burn a ton of coal now or 50 years from now. This means that a policy that results in a ton of coal being consumed next year instead of this year does little good. Because of the long time horizon, we will use cumulative plots, which smooth out the year-to-year fluctuations. To start with a plot that you will probably recognize, let us consider the cumulative production for US crude oil, courtesy of the amazing data gnomes at the EIA. This is a terrific series that starts all the way back in 1859. On the same graph, I have a shown a normal curve, fit to the data. This is the bell-shaped curve from statistics class, plotted in cumulative form. The fit is done just by clicking the Solver button in Microsoft Excel, and it is absolutely perfect. I used 3-point symbols, which are the smallest ones I could see, and the symbols bury the fitted curve for over 100 years. We will see that we can also use cumulative normal fits for coal production.
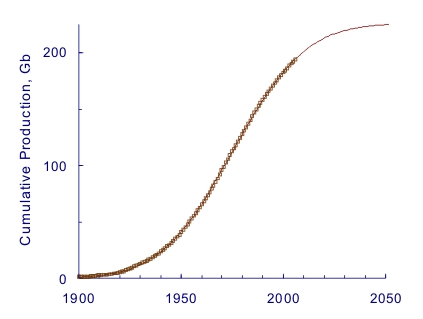
Figure 1. Cumulative US crude-oil production from 1859, plotted from 1900 on, together with a normal curve that is the least mean square fit (ultimate 225Gb, 10% year 1939, 90% year 2011). The projected remaining production is 31 billion barrels. Given current production levels of 2 billion barrels per year, the prognosis for US oil production is grim.
Often we do not have enough data to fit for remaining production this way. In these situations, I will use a Hubbert linearization to estimate the remaining production, like we often do for oil. Hubbert introduced this approach for modeling oil production in "Techniques of Prediction as Applied to the Production of Oil and Gas," in Saul I. Gass, ed., Oil and Gas Supply Modeling, pp. 16-141. National Bureau of Standards special publication 631. Washington: National Bureau of Standards, 1982. This is a great paper. It is difficult to find, but you can download it here (15MB file). Figure 2 shows a Hubbert linearization for world hydrocarbon production. The trend line is for 3.2 trillion barrels of oil equivalent (Tboe) remaining. We will use this number for our simulation of future atmospheric CO2 concentrations and temperature rise. This is 20% larger than the reserves given by the German resources agency BGR, 2.7Tboe. The BGR includes 500Gboe for unconventional sources. In contrast, the IPCC assumes that 11-15Tboe is available for production for its climate-change scenarios.

Figure 2. Hubbert linearization for world hydrocarbon production (total of oil, natural gas, and natural gas liquids), based on production data from the 2007 BP Statistical Review. Open symbols 1960-1992, closed symbols 1993-2006.
For coal, we start with the United Kingdom. The British production cycle is nearly complete, and it is substantial, equivalent in energy content to the cumulative Saudi oil production. There are excellent production records back to 1854, and there is even a good cumulative production figure for 1853. The Victorians were outstanding geologists, and there are good reserve estimates back to 1864. British coal even had a Hubbert. His name was William Stanley Jevons, and he was an economist. In 1865, he wrote a book, The Coal Question; An Inquiry Concerning the Progress of the Nation, and the Probable Exhaustion of our Coal-Mines , which should be read by anyone who is interested in coal or oil. Jevons wrote that even though the reserves-to-production (R/P) ratio was around 1,000 years, exponential growth would exhaust British coal in the 20th century. Jevons was right. In his time, there were more than 3,000 coal mines. Now the British are down to six major underground mines, with the last Welsh mine, the Tower Colliery, due to finish off its last seam next year. Figure 3 shows a Hubbert linearization for British coal. There is a good trend line, and the very first point in 1854 is near the line. We will see that the quality of the trend is in contrast to the reserves, which badly over-estimate remaining production throughout.

Figure 3. Hubbert linearization for British coal from 1854 to 2006, with a trend line for an ultimate of 27Gt. The peak production was 292Mt in 1913. The production for 2006 was only 19Mt.
The normal fit, shown in Figure 4, is more complicated than our normal fit for US oil. There are two pieces, one for production before the Second World War, and one afterwards with a higher ultimate. Why did this happen? It could simply be that economic activity increased after the war. Another possibility is technical change; strip mining started in Britain during the war. Yet another possibility is that it is a result of the coal mines being nationalized in 1947. This created strong political incentives to support coal production. I was an undergraduate student in England in the early 70’s when the coal miners brought down the Heath government. Even though the mines are privately owned now, the mining companies still receive government grants to help open up new seams.
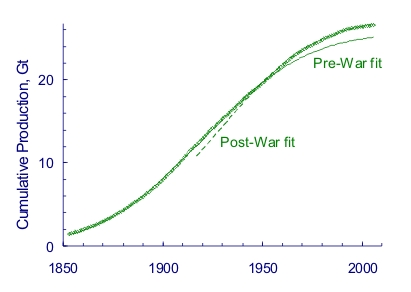
Figure 4. Cumulative normal fits for British coal. The pre-war fit gives an ultimate of 25.6Gt, with the 50% year in 1920. The post-war fit gives an ultimate of 27.2Gt, with the 50% year in 1927.
Now that British coal production is essentially done, we can compare historical reserves with the actual remaining production, which we now know. Jevons discusses a reserve calculation done in 1864 by Edward Hull. Hull made allowances for coal left in the pillars that stabilize the mines against collapse, for bands of coal around the outside to keep out water, and for areas where the seams became thin. Figure 5 shows reserve estimates made at different times, compared with a plot of remaining production. Notice that the reserves are way too high, and that they collapse near the end of the production cycle. This is a major problem if you want to use reserves to predict production. Reserves should be an indicator of future production. Unfortunately it appears to be the other way around.
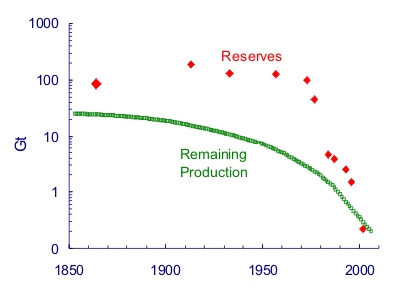
Figure 5. Reserves compared with remaining production for British coal. Note that this is a logarithmic plot, so the differences are larger than they may appear. The reserves are taken from the World Energy Council series of reports. These are hard to track down, but you can download them here (50MB).
Now let us consider the reserve history with the traditional R/P ratio. Figure 6 is a plot of the R/P ratio over time, beginning with Hull in 1864. The R/P ratio started at 900 years, and stayed above 500 years until a hundred years later. However, the R/P ratio collapsed in the 70’s, dropping almost 749 years in 1973 to 90 years in 1984. In the end, only 30% of Hull’s reserves were eventually produced. This underproduction is not an isolated error. On my web site, there are plots for Pennsylvania anthracite and Virginia bituminous coal. Pennsylvania anthracite has a single trend line with a single normal fit. Virginia bituminous has pre-war and post-war fits, like British coal. In each case, the remaining production was only 16% of the early reserves. And in other cases I have considered, where a clear trend exists, the remaining production is less than reserves. We will consider the reserves to be an upper limit on remaining production.
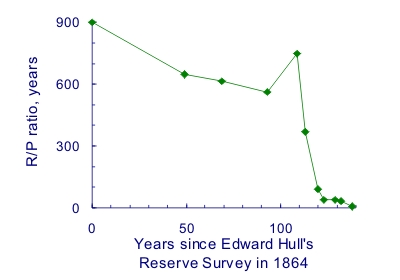
Figure 6. Reserves-to-production ratio for British coal. The R/P ratio has not been a good indicator of future coal production.
I approach the problem of estimating future world coal production by breaking the world up into eight regions, and estimating considering production in each separately. The regions are Australia, South Asia, East Asia, Former Soviet Union, Africa, Europe, South America and North America. North America is further divided into Eastern US, Western US without Montana, Montana, Canada, and Mexico. We look for trends, and if we find them, we will use them to estimate remaining production. If there are no trends, we will use reserves. Because of space limitations, I show plots for only two regions here, but the rest are on my site, along with the data sources. Figure 8 shows a Hubbert linearization for coal east of the Mississippi. The production data come from an outstanding USGS collection developed by Robert Milici, which gives production data by state back to 1800.

Figure 7. Hubert linearization through 2005 for US coal east of Mississippi, without Pennsylvania anthracite. Early closed symbols 1900-1940, open symbols 1941-1945, later closed symbols 1946-2005. There is a pre-war trend for an ultimate production of 20Gt, and a post-war trend for 40Gt remaining. The reserves are 96Gt, reported by the
EIA.
Figure 8 shows the Hubbert linearization for China. China accounts for 40% of the world’s coal production and is producing more than twice as much coal as the US. For 40 years, there has been a trend for 70Gt remaining, but in the last three years, production has gone through the roof. There may be a move to a new trend line underway. It is also possible that production will come back to the original trend line. During the Great Leap Forward from 1958 to 1960, reported production soared for a few years, but returned afterwards to previous rates.

Figure 8. Hubbert linearization for Chinese coal. Open symbols 1918-1961, closed symbols 1962-2006. The trend for 70Gt remaining compares with reserves of 189Gt, reported by the Chinese Ministry of Land and Resources. I am grateful to Sandro Schmidt of the BGR for sending me this reserve information.
The table below shows the results for the different regions. For South Asia, and Central and South America, there has been exponential growth in recent years, so there is no trend. For these regions, I used reserves, which are likely to be too high. For the former Soviet Union, there is the opposite kind of problem. Production still has not returned to Soviet-era levels. I used the trends from the Soviet era, which may be pessimistic. North America is a patchwork, with trends for the East (40Gt), West (25Gt), reserves for Montana (68Gt), and trends for Canada and Mexico (2Gt total). The world total is 435Gt, 1.6Tboe if we convert at the current energy density of 3.6boe/t. This is about half the reserves of 963Gt (3.5Tboe). Both are much lower than the amount that is assumed to be available for the IPCC scenarios, which is 18Tboe. It is possible that some of the trends will turn out to be too low, because of the possibility of switching to a new trend line, as the British did after the war. On the other hand, where we have used reserves, we are likely to be too high, and this will offset underestimates elsewhere. I am using my judgment to arrive at the solution, and your judgment may differ.
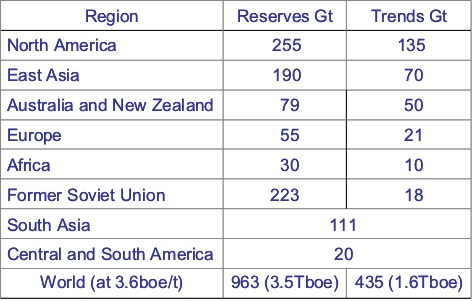
Table. Reserves vs trends for remaining production for coal. The reserves are taken from the World Energy Council 2004 report, except for China, where we used the reserves from the Chinese Ministry of Land and Resources by way of Sandro Schmidt, and South Africa, which has been reassessed recently
Figure 9 shows the cumulative plots for future-fuel production using the trends we have developed for hydrocarbons and coal, and with lms fits for the 10% and 90% years. The coal ultimate is about half the hydrocarbon ultimate.
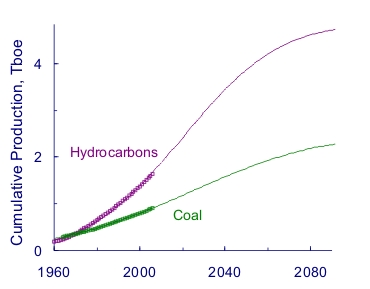
Figure 9. Cumulative fossil-fuel production with normal fits for hydrocarbons (ultimate 4.8Tboe, 10% 1975, 90% 2066) and coal (ultimate 2.5Tboe, 10% 1960, 90% 2088).
Now we are in a position to see what some consequences for climate are. We convert future hydrocarbon and coal production to atmospheric carbon emission using EIA coefficients and plot them as the Producer-Limited Profile in Figure 10, together with the carbon emissions from the 40 scenarios. The Producer-Limited Profile has lower emissions than any of the 40 scenarios. This would be true even if we calculated the emissions with the full coal reserves. Jean Laherrere was the first to call attention to this anomalous situation. He has made the point forcefully and repeatedly, to no apparent effect.
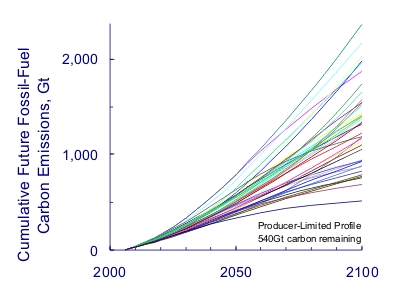
Figure 10. Future fossil-fuel carbon emissions for our Producer-Limited Profile, together with the 40 IPCC scenarios. The curves show a major defect of the IPCC scenarios - they are not defined past 2100. In many of the scenarios, fossil-fuel production has not peaked by then.
For climate simulations, I use Tom Wigley’s program MAGICC. Tom and his colleagues at the National Center for Atmospheric Research (NCAR) have performed a wonderful service by making this program available online, so that anyone can try out different scenarios. I modified his WRE profiles to use our fossil-fuel carbon-emission levels. The W in WRE is for Wigley, and the WRE profiles were developed to target specific CO2 levels. One advantage of the WRE profiles is that unlike the IPCC profiles, WRE profiles are defined past 2100. In addition to our Producer-Limited Profile, I define one policy profile called Super-Kyoto, where future fossil-fuel production is stretched out by 50% (Figure 11). I am imagining a future agreement that is more successful in reducing the rate of fossil-fuel consumption than the present Kyoto Agreement, but that does not change the total remaining production. The Producer-Limited Profile gives a peak of 460ppm in 2070, while Super-Kyoto gives a peak of 440ppm in 2100. These compare with the current level of 380ppm and the pre-industrial level of 280ppm.
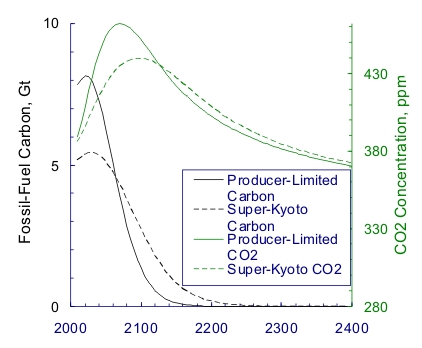
Figure 11. Carbon emissions and atmospheric CO2 levels. The atmospheric CO2 levels are calculated from MAGICC simulations.
Figure 12 shows the simulated temperatures. The maximum temperature rise for our Producer-Limited Profile is 1.8°C in 2150. The blue lower curve shows the part of the temperature rise that is associated with future fossil-fuel use. This is calculated by running the simulation with and without future fossil fuels, and subtracting. It turns out that the maximum temperature rise associated with future fossil fuel use is only 0.8°C, less than half of the total. This means that the contributions to the temperature rise from fossil fuels that have already been consumed, and from deforestation, and from other greenhouse gases amount to more than the contribution from future fossil-fuel use. The Super-Kyoto Profile does not decrease the maximum temperature. The reason for this is that the characteristic time for temperature change is much larger than the corresponding times for fossil-fuel exhasution. From a mathematical point of view, the system is an integrator.
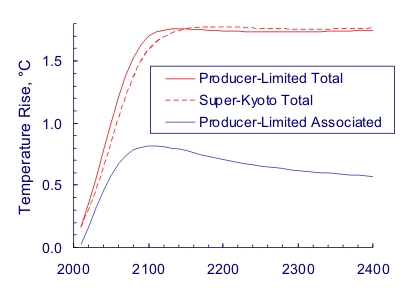
Figure 12. Simulated temperature rises from MAGICC simulations.
Based on these results, what conclusions do we draw? The projection for hydrocarbons is 20% larger than reserves, while the projection for coal is only half of reserves. Our Producer-Limited Profile has future fossil-fuel production that is lower than all 40 of the IPCC scenarios, so it seems that producer limitations could provide useful constraints in climate modeling. Stretching out production does not lower the temperature maximum. If we wish to reduce the temperature rise, we must bury the CO2 (assuming that it will not leak out for 1,000 years), or establish preserves for fossil fuels that prevent them from being produced. One possibility for fossil-fuel preserves would be US federal lands. One third of US fossil-fuel production is from federal lands, so remaining fossil-fuel production could be reduced substantially simply by letting the current leases run out, without establishing new ones.
Why are coal reserves high? In his book Hubbert’s Peak, Ken Deffeyes says this about the US Geological Survey, “When USGS workers tried to estimate resources, they acted, well, like bureaucrats. Whenever a judgment call was made about choosing a statistical method, the USGS almost invariably tended to pick the one that gave the higher estimate.” My theory relates to my sister-in-law, Nancy Yee. Nancy appraises apartments for a bank. If her estimates are too high, the bank loses money, and she loses her job. My suspicion is that no one in a geological survey ever lost her job for being optimistic about coal reserves
Could these projections be improved? Yes. I am still looking for coal-production histories for many countries before 1981, when the BP Statistical Review tables give out. The most important ones are the Soviet Union and South Africa. I would grateful if any readers could help me locate this data.
Contact
- Content: editors at theoildrum dot com
- Tech support: support at theoildrum dot com
License

This work is licensed under a Creative Commons Attribution-Share Alike 3.0 United States License.
If you are so inclined, our contributors appreciate your support at the link farms (reddit, digg, stumbleupon, and others) and Slashdot. We hope you will spread our work around and share it with others.
Thank you Dave,
For comparison sake, could you post the range of CO2 ppm and associated temperature rises for the 40 IPCC scenarios?
Or perhaps the average of the 40 scenarios?
Greg in MO
Hi Greg,
It would be terrific to do that. However, a major problem with the UN scenarios is that they stop in 2100. I asked Tom Wigley about this, and he indicated that people were unwilling to talk about government policies past 2100.
This is understandable, but has you can see, it is a problem, because the temperature peak happens after 2100. However, you can say roughly that for each Gt of carbon that I am off, the peak of the part of the temperature rise that is associated with future fossil-fuel burning will change by 0.0012 degrees Celsius.
Dave
Hi Greg,
I posted this chart in my post based on Hansen's paper "Implications of "Peak Oil" for Atmospheric CO2 and Climate". It's from the IPCC's Summary for Policymakers (2001).
The first time I was introduced to the concept of peak oil, I was giddy to the point of hysteria. Must admit a bit of giddiness at this moment. I know many on this site beleive peak oil is a bigger threat than global warming, but I can't help but think the 20-100 year time lag between CO2 release and maximum effect is a far less addressable than issues of increasing fossil fuel prices.
As many of you know, recent studies document a rapid acceleration (relative to recent estimates) of the rates of polar melting. Climate response to increased greenhouse gas forcing is not linear. Okay, the tipping points leading to rapid climate change are not currently understood - doesn't mean they are not there. My fingers are crossed.
Very interesting work. You might want to show the anthracite production plot; it is one of the classic production peak case histories.
In regard to hydrocarbons, I assume that you are talking about oil + condensate + NGL's + natural gas.
Following are some excerpts of posts I just made over on the Hubbert Linearization (HL) thread:
Pennsylvania Anthracite Coal:
http://www.geo.umn.edu/courses/3005/resource.html
Graph: http://www.geo.umn.edu/courses/3005/antracite.GIF
Your ELP program for personal action is appropriate even if CERA is 100% correct.
What is not to like about ELP? By living on half your income you may be much much happier than by living on the whole income. Also, by economizing, one can give away much more income, which I do at every opportunity to the Nature Conservancy.
Localization makes good economic sense regardless of what happens, and it can also help to build community--than which nothing is more important.
Produce, produce, produce. I can fix bicycles and make simple repairs to guns. Mostly now I produce words, but some of these can be of great value in hard times. For example, through family connections I stumbled upon a place in the continental U.S. which is probably as good as anywhere to survive a bleak post-Peak world. Of course I would be a fool to give this information away, but if the price were right (quite high) I might sell it.
I reckon Sailorman, that wily ol' devil, is fixin' to sell some peak oil rubes a wooden nutmeg!
Rubes beware!
Actually, I've been doing consulting since 1962 and am (so far as I know) the only one who offers a "no questions asked" money-back guarantee if the buyer thinks my report is not worth the fee.
Surprise, surprise, in forty-five years nobody has ever asked for a refund . . . .
Land prospecting for survivialists and peak oil doomers since 1962!!
Geez, I'm very impressed.
Am I the only one who thinks this smells a little ripe?
i.e. you trolling among the faithful on this board, hawking your leads.
Ewwwww, does this ever reek. Excuse me while I move up wind. The vultures gather.
I do not post nor sell my services on TOD. For your information, my first big wave of business was in October 1962, when we were closer to having TSHTF than any time before or since.
Fascinating stuff. Well, Don, count me among the few who didn't know you had been successfully profiteering off people's worst fears for decades.
HEY FOLKS, Y'ALL LISTEN UP! The world's gonna end, but if yer willing to pay up big I can give you a line on where to find land in the wilds so you and yer dear littl'uns can make it through. Few are going to survive the cummin' fire, but you can. "Straight is the gate and narrow is the way" as the good Lord sed.All you hafta do is hire the services of economist and author, Don Sailorman, surviving apocalypses since 1962. See info upthread for current opportunities before the fallout flies.
Remember, though these services will cost you very dear -- larnin' the whereabouts of sech land that won't be nuked or overrun by starvin' city folk -- it's worth it cuz nobody's been nuked that bought land on Don Sailorman's advice. Not once.
There, Don, I've promoted your business for you. What's my cut? ;-)
All my customers have survived all the apocalypses. Results guaranteed or double your money back;-)
Asebius, I hope you get banned for your constant personal cheap shots. This is not the only occasion I have seen you disrupt threads with personal attacks either. I see little of value in your trolling name-calling antics and that sort of crap is not needed here.
As for Don Sailorman, he has apparently sold information to people who were interested in risk management and who did not have the time to do the research themselves. At the time of the sale, those persons buying the information thought that it was good enough to cover the possible scenarios with which they were concerned.
Maybe you are too young to remember but the world has been to the brink of global thermonuclear war more than once. People thought about these things and took various mitigation steps.
Fortunately for us all, the risks against which they were planning never materialized. Just like the tornado shelter in the midwest or the hurricane shutters and seals for your home along the coast, you invest in these things and hope that you never ever have to use them.
It's the same thing with peak oil. We all assess the risk and then take whatever mitigation steps that we believe are necessary and which we can afford. It is for you and your kind that I fervently hope we do not have the sorts of scenarios envisioned by people like Lovelock or Hawking, individuals whose stature is so far above your puny trolling contemptible self that you are no more than a fly on the dung they drop. Indeed, I hope that Lovelock and Hawking are both wrong about the dangers facing our species, but I will take both of them seriously.
So shy don't you go away until you can stop playing the useless troll and add something worthwhile to the conversation. Belittling others is all too easy on the internet. Try to be better than that, if you can, Asebius. And if you cannot, then I hope Professor G sends you a nice "goodbye" email soon.
Ghawar Is Dying
The greatest shortcoming of the human race is our inability to understand the exponential function. - Dr. Albert Bartlett
Greyzone, you are truly the King of the cheap personal shot! I'm impressed how you manage to get one into every post too.
Worried someone is after your crown?
Greyzone:
-- Leanan, Drumbeat, June 19, 2007
http://www.theoildrum.com/node/2685#comment-203248
Then why don't you let the TOD staff decide what to do with Don Sailorman rather than just attacking him? Leave Don alone and I leave you alone. If TOD doesn't want Don here, they can make that clear and Don can either not post or refrain from posting about such topics. However, I am not aware that Don Sailorman has ever been told not to post by TOD staff.
Ghawar Is Dying
The greatest shortcoming of the human race is our inability to understand the exponential function. - Dr. Albert Bartlett
The Northern Anthracite coal belt was effectively destroyed by the Knox Coal Company in 1959 - not mined out. Here's the link:
http://undergroundminers.com/knox.html
I don't remember it, but my father took us to see it (he worked for Glen Alden Coal Co. in Ashley PA. at the time) the day it happened. Knox was ordered to stop mining under the Susquehanna by the State but the miners were ordered to continue "pulling pillars" and brought in the river. I did some digging a few months ago and found out that W.A. "Tony" Boyle was secretly one of the owners of Knox. When he was challenged for president of the UMW by Jock Yablonski, his entire family was murdered.
Now the Northern Anthracite Coal Basin is now called the Northern Antracite mine pool, with some areas water 600 feet deep.
Just thought I would add the comment.
Hi DL,
Great link. I had not heard about the destruction of the Knox mine. However, by 1959, Pennsylvania anthracite was 95% done, as you can see from the plot.
Does the MAGICC simulation include any feedback features like the release of CO2 and methane from unfreezing tundra and the release of methane hydrates? Without some handle on the extent of these it would be folly to assume the suggested limit to the warming caused by burning of all our fossil fuels.
The present CO2 level (May 2007 Mauna Loa seasonally adjusted) is 383.6 not 380
The model does not, and most models do not, because they cannot yet predict how that will unfold. Remember that Indonesia is up towards the head of the class for CO2 emissions because of forest fires, not industrialization.
Hi Nick,
Tom Wigley's MAGICC program was one of the programs used in the IPCC's 3rd Assessement Report. It includes some feedback, but as far as I know it does not include hydrates. I encourage people with access to climate simulation software who want to include more effects to try out the fossil-fuel production profiles in the spreadsheet at
http://rutledge.caltech.edu/
With regard to world-wide CO2 levels, it is not appropriate to quote more digits than is meaningful. The seasonal variation is about 5ppm.
Dave
Dave,
The seasonal variation is indeed about 5ppm peak to peak but it is anything but random. It is a very regular cycle largely as a result of northern hemisphere seasonal vegetation.
This cyclic variation can be taken out to give an adjusted curve with an apparently random component with an root mean square value of about 0.3ppm. This is the maximum meaningful accuracy to quote
Also note that human induced warming probably will trigger natural C02/methane emissions leading to further warming so anthropogenic source will probably play a decreasing role in the amount of C02 in the atmosphere as the planet moves to a new equilibrium point. And of course we have the issue of saturation of the various C02 sinks. We don't know for sure what these point are but any estimates of increases in C02 concentration if we saturate a major sink are probably incorrect. In general when the planet is in a warm climate phase C02 levels are up two twice what we are at today. Assuming a good bit of this was added after the natural warming cycle was started we are probably looking at closer to 1200 ppm over the next century or two before C02 levels begin to decrease again as this natural green house locks up carbon primarily in phytoplankton blooms caused by fertilization from the new large desert regions near the equator and excessive erosion from very intense storm systems the develop in such a hot house climate.
The key to understanding the final level is to determine exactly when/if/how and of the large carbon sinks will saturate and what the natural C02 levels are in a warming environment.
The oil we burn today was buried under similar conditions in the past.
I'm wondering - is the simulation just considering CO2, or CO2 equivalent? It looks like it is only considering CO2 only.
If you throw in CO2 equivalent, we're already at 440 ppm CO2 equivalent, or something similar. So this is important.
Dave, I think this is a great post, so please don't take what I say next to be a criticism of you - this is a generic grouse.
I have yet to find a source where all these issues are confronted with the proper in depth analysis. As noted, the IPCC scenarios are probably not at all realistic, given our hydrocarbon reserves. And often you see temperature predictions based on CO2, not CO2 equivalent, and the CO2 from forest destruction is not included, etc. It would be a huge service if someone could take the time and do a more realistic analysis of the two problems together, hydrocarbon depletion and climate change.
Hi Zeroworker2,
MAGICC considers lots of different gases. Here are the headings in the spreadsheet that MAGICC uses as inputs.
Foss CO2, Defo CO2, CH4, N2O, NOx, VOCs, CO, SO2,1 SO2,2, SO2,3, CF4, C2F6, HFC125, HFC134a, HFC143a, HFC227ea, HFC245ca, SF6
I only change the Fossil fuel CO2 inputs in the WRE scenarios and leave the rest the same. Your instincts are correct; the others are important. If you look in Figure 12, future fossil-fuel burning accounts for less than half of the total predicted temperature rise.
Dave
Excellent post. I look forward to digesting it more thoroughly and maybe asking some questions.
Interesting comments in Pravda:
http://english.pravda.ru/russia/economics/93835-0/
Russia to reform national economy to get rid of oil dependence
Dave,
I was wondering what your projections for coal imply for the date for peak coal production, barring big changes in world priorities for resources.
It seems to me that peak coal would by theory come when 50% x 2.5Tboe = 1.25Tboe is produced. If we are at 0.9.0 Tboe now, the graph suggests 1.25Tboe comes about 2020 or 2025. Is this approximately correct?
Also, your world calculations seem to be done using a constant energy density of 3.6boe/t for coal. Wouldn't the energy density for coal be falling, if the higher energy density coal is mined first? Any thoughts on the potential impact of the future lower energy density on the reserves in Tboe?
Hi Gail,
Great comments.
With respect to a peak in coal production, it is too early for me to feel comfortable predicting peaks. However, a starting point would be the calculation you did, or the 50% point for the normal curve, which is 2024. This is in the spreadsheet at
http://rutledge.caltech.edu/
With respect to the energy content, my intuition was the same as yours. However, if you look at the energy content history in the BP Statistical Review, which goes back to 1981, it is quite stable. It has actually risen about 3% since then.
I am still looking for coal-production histories for many countries before 1981, when the BP Statistical Review tables give out. The most important ones are the Soviet Union and South Africa. I would grateful if any readers could help me locate this data
ORNL has an excellent data base (expressed in tonnes of carbon) for solid, liquid and gaseous FF use by nation by year. Anthracite and lignite will, or course give different values if measured in raw tonnes vs. carbon tonnes.
I found the WW II sequence for Switzerland fascinating and have used that data to show a industrialized Western democracy that functioned without oil (An average Swiss used less in 1945 (all year) than an average American uses in a day).
Unfortunately, their server appears to be out ATM.
I am working on a "Magnum Opus" of what an economic non-GHG North American electrical grid would look like.
Some details that would apply to California would be to rework geothermal fields for greater peak capacity and lower off peak/high wind generation. Like wise biomass and landfill gas.
The "core" approach would be about 40% of North American MWh generated in the "Wind Export Belt" from Alberta & Manitoba to Texas, with HV DC "triangles" connecting wind, pumped storage and large loads. Local nuclear plants (perhaps 23% of MWh) would supply much of the base load with local solar (thermal is SW deserts and PV) and local wind helping reduce dependence on imports and pumped storage.
In an ideal situation (and I propose less than ideal) nuke would cover the 2 AM to 6 AM load on a calm, mild night with modest exports to pumped storage. And at summer solar noon (~1 PM due to DST), Solar plus nuke would cover local demand with modest exports to pumped storage. Early Morning, Afternoon and Evening demand would draw on pumped storage plus local wind & hydro plus wind & hydro imports.
The HV DC polygons# would be interconnected (a spine from Canada to Texas in the Wind Export Belt would be a major link). The Wind Export Belt could shift from East to West Coasts. 10 GW HV DC lines might be the standard.
I stole a number of ideas from a Grand Inga presentation (what to do with a fairly steady 44 GW of hydropower ? Power most of Africa :-)
Best Hopes,
Alan
#Polygons so that a break at any one point would not cause dramatic power losses.
Hi Alan,
Thank you for your comments, and the Oak Ridge data lead. I will be interested in seeing your Magnum Opus. The direct sunlight in the Southwest is a wonderful resource for our future, and the new Nevada Solar One plant is a great start.
Dave
I would like some feedback on assumptions that I am troubled by.
I am assuming that North American demand will be 80% of 2004/5 demand. This is after population growth and a major switch to ground-loop (geothermal) heat pumps for heating and cooling. Major and near universal insulation retrofits close to German standards.
I am also assuming that "we" could reach the 90% mark on non-GHG in 20 to 35 years with "commercial urgency". The next 8% will take at least another decade and the last 2% will be "difficult".
FF backup for unusual years. Former coal fired plants that will burn charcoal as first and coal when that is depleted.
I see solar economics as having trouble competing with wind for bulk power. Currently (by total GWh) 4% solar PV, 3% solar thermal. Solar thermal exclusively in the desert SW.
Any thoughts ?
Best Hopes,
Alan
About Solar power, I think you are under-evaluating its potentials. Check this site and go down to the post named The Glittering Future of Solar Power:
Prognostication of Photovoltaic Capacity Extrapolated from Historical Trends.
It's a very interesting article that explains a lot about the real potentials of these technologies. The building of a solar infrastructure may well climb down to economical competitiveness even sooner than the author implies, given Peak Oil and eventually Peak Coal. A realsolar "boom", given enough marketing and political will, as well as enough industrial capacity, could come true within the next ten years.
Before reading your link, I generally agree. 7% of total North American MWh is a *LOT* of solar power (4% PV spread out mainly in southern areas and 3% solar thermal exclusively in desert SW US & Mexico).
But IMVHO, wind is ahead and likely to stay ahead of solar, both in economics and and installed base. Solar PV is not, IMHO, ever going to be economic in Pennsylvania, Oregon, British Columbia, Nova Scotia, etc. Solar PV is limited to more southerly areas or more northerly areas with clear skies (south & clear is even better :-) And limited to daytime (many days peak is around dusk).
I am counting on a/c shrinking due to 1) more insulation and 2) more efficient HVAC equipment (ground loop heat pumps) in many cases) so the time offset match of Solar PV to load will shrink.
Right now I have 52% wind and 7% solar by total MWh (7.4 wind MWh for every solar MWh). 24% nuke, 19% hydro (new microhydro in US, all available in Canada, damage tourist value of Niagara Falls), geothermal, biomass, plus LOTS of pumped storage (20.5% in, 16% out by total MWh).
Well, I could counter your ideas, but I really believe that the blog that I've linked to is way better doing it than myself.
Just some keypoints of it so that some passerby can look at them:
1. Wind is very very good. It's growth is almost as staggering than PV's, being the general difference that it's already very cheap (unlike solar). But it has a problem: the "NIMBY" aspect (Not In My Backyard); few people will want a 300 feet turbine fleet near their homes. Solar PV's and Thermal doesn't have this issue. With the right design and marketing it even turns out a very good-looking (silent) roof;
2. Given geometrical growth in technological breakthroughs and price decreases in PV's, geography doesn't make too much of a difference in the long-term when PV's get to 0.05/0.10$/w (relative to present prices). See the link for further info;
3. Intermitencies are a problem both for solar as for wind. You claim that daytime is the only time when solar hits, but it is also when we use energy the most. Currently we waste a lot of power at nights;
Conclusion: I believe that given the current trend of an incredible growth and learning curve of solar energy, while given a much more appealing form (discreet) and silence (and very portable, scalable product), it is one of the most appealing energy sources of the future. If wind is leading the way is because, like hydropower before it, it has reached economical status long before solar power. While hydropower comes at 0.01$/w, solar still seats itself in the 5$/w. Sounds expensive? Sure, and that's the main reason for it to be so small. But ten years ago, we were looking at 50$/w. The first 70's generators were in the order of millions of dollars solar panels. So the future is bright for solar.
Great post Dave.
The UK Government's Chief Scientific Adviser, Prof Sir David King had this to say about coal and climate change on Tuesday 12 June 2007 (link)
So there we have it - "several hundred years" and "1,500 parts per million". :(
Perhaps you could write to him?
Chris
Worth knowing Sir David King is a South African (came to the UK to do his Phd in his 20s). He will know a lot about Sasol.
I doubt he has a fully informed view of coal reserves.
*but*
I'm not persuaded that we are anywhere near 'peak coal'. Our reserve figures may be dodgy, but this is hardly a scarcer material, geologically.
If we were, coal wouldn't be 1/5th or 1/6th the price (in terms of energy value) that gas or oil is.
A lot depends on how much you are prepared to spend to mine it, and how highly you value the lives of the miners.
US Appalachian Coal has become less important because of the sulphur content regulations (US power emissions), which Wyoming Coal meets (albeit with lower thermal value). Similarly British Coal died because cheap foreign coal was available, and the 'dash for gas' occurred.
One shouldn't ignore the role of politics in this. The coal miners brought down the Heath government. The next Tory government (Thatcher) was determined that this would never happen again. So they engineered the destruction of the coal miners.
Amazing to think as little time ago as WWII, Britain had over half a million miners.
Interesting article about which I'm not qualified to comment. However I do think that when you say
you are being rather generous or optimistic. I doubt that the people of Montana will have much say in whether their coal is mined. Much more powerful external national and corporate forces will make that decision for them.
People will be saying "how did our coal get under their hills?"
Hi Oregon7,
Other people more knowledgeable than me can comment, but I think that the people of Montana already have had a lot to say about it. Historically, Montana has taxed coal mining more heavily than its neighbor Wyoming, which produces more than ten times as much coal. In addition, Montana has not had the extensive railroad development that would be necessary to support coal production on the same scale as Wyoming's,
Dave
Hello Dave,
I watched your video presentation with great interest. I see that you have written up that material here. I'm glad you did. This is the graph of interest to me.
Obviously, we need to talk about how we define hydrocarbons. Does this include the tar sands of Canada (and elsewhere)? Does this include the Orinoco extra-heavy oil? Does this include other heavier (lower API) oils? Does it include oil shales? Does it include undiscovered or prospective resources such the large natural gas plays assumed to be in the Arctic? At the riskier, "far out" end, does it include methane hydrates?
The point is this: As the peak of oil production comes and goes, and as natural gas does the same sometime later, people are going to become ever more desperate in a fossil-fuel constrained world. I assume they will want to exploit anything they possibly can. The argument shifts from a rather large hydrocarbons resource base to whether it will ever be economic to exploit those resources. In the past, we've spent a considerable amount of time debating those issues, frequently talking about the EROEI (net energy returns) for various hydrocarbons (and biofuels like corn ethanol or palm oil biodiesel).
I can easily see future situations in which we are looking at the low end IPCC SRES scenarios, but not the high end ones. The latter are looking more and more unlikely. It has been quite a shock for me to realize this.
With respect to climate change, the lower scenarios where we might get "only" a 1.5° C temperature rise are still pretty scary. The problem is that we don't know enough about effects on the carbon cycle via positive feedbacks e.g. melting permafrost, rainforest deforestation, peat forest destruction, etc. Some have used the fossil fuel resource depletion argument to diminish the importance of climate change caused by greenhouse gas emissions. That's a shame, because we should all be on the same side of these issues — there is no incompatibility. What is happening in the Arctic right now is enough to scare the pants off anyone who is paying attention. All solutions to peak oil and climate change start with reducing fossil fuel consumption.
Thanks again for your excellent presentation.
best,
Dave Cohen (TOD contributor emeritus)
Hi Dave,
Thanks very much.
In this context, hydrocarbons is just the sum of the oil and gas worksheet cells in the BP Statistical Review.
Dave
The production data for the UK is heavily influenced by politics. After WW2 and the nationalisation of the coal industry in 1947, coal was sold below cost. Mechanisation of the coal industry was accelerated and after the election of a labour government in 1964, the chairman of the National Coal Board (NCB) was Lord Robens, a very heavyweight labour politician.
An artificially high production target of 200 million tons per year was established through pressure by Robens and the National Union of Mineworkers (NUM) which was very influential in the Labour Movement. At this period Schumacher (of Small is Beautiful) worked for the Scientific Department of the NCB - as BTW did I having trained as an underground worker to escape any risk of military conscription. Schumacher provide lots of the statistics advocating coal as the fuel of the future.
After the NUM victory in the 1974 miners’ strike, the Tory Party
were determined on revenge and in the early 1980s Thatcher’s Government provoked a strike for which they were well prepared. The miners lost and the coal industry was savagely reduced Nobody at that period claimed there was a shortage of coal reserves in the UK. Instead it was claimed that oil and gas or even nuclear were cheaper than coal which was only true if one ignored the military cost of middle east oil and the cost of cleaning up dead nuclear power plants.
Schumacher’s estimated that the UK would still has lots of coal reserves for the next 200 years although some will have been sterilised by closures of all but a few collieries after the defeat of the NUM. .
The problem now for the right in the UK is that to expand coal output would be interpreted as an admission that Saint Margaret Thatcher got it wrong because she attached higher importance to class war than national economic wellbeing. New Labour, who also pray to St Margaret, share the problem and the Social Democratic part of the Lib-Dems supported Thatcher’s colliery closures. The economic arguments for coal especially with sequestered carbon dioxide are simply ignored in the UK.
Unless you can produce evidence that Schumacher was wrong, the UK analysis is way off and this will cast doubt on the other regions.
Hi,
Thank you for filling us in on the interesting details of the political history of coal production.
The UK, like most countries, lists its coal reserves every three years with the World Energy Council. The current reserves are 200Mt, less than one year's production in earlier times.
Dave
The context of how these UK reserves are estimated is very important. The earlier poster's political analyis is spot on. There was never any claim that the UK's coal reserves had been exhausted, simply that they were uneconomic. Specifically that imported coal, from Australia was far cheaper.
I have a suspicion that a big reason for the dramatic decline in the size of the UK's reserves was because of a change in evaluation of reserves from a simple volumetric basis to an 'economically recoverable' basis. The reason for the collapse in reserves would then have been the rising cost of wages in the UK in the second half of the last century, the same reason we lost our cheap manufacturing base.
The link below gives some serious food for thought with regard to the death of UK coal mining.
In the UK, the 'Dash for Gas' has exhausted our natural gas supplies, we now are net importers, from Norway and soon the Middle East.
Our nuclear power stations are at the end of their useful lives, and given how crowded and politically green our country is, new nuclear seems unlikely.
So a forthcoming shortage of power, and rising prices of imported coal have increased the available reserves.
So we are reopening up our coal mines, though using lots of newly available Polish miners because they are cheaper.
http://icwales.icnetwork.co.uk/0100news/0200wales/tm_headline=hain-heral...
As somebody who also does statistical analysis, I find your work very impressive. But there is clearly a major mismatch between the straight line on your UK Hubbert analysis, and the fact that private commercial companies are opening new coal mines in South Wales.
The detailed meaning of 'UK Coal Reserves' needs to be addressed in some detail before your analysis can be considered trustworthy.
It's interesting that Russia is suddenly so desperate to increase their coal production, in much the same way that the UK is considering increasing coal production--makes one wonder if the Russians have the same problem as the UK.
The coal rush is on. The first response to peak oil of every industrialized nation is going to be to shovel as much coal at the crisis as possible, as quickly as possible. So I wouldn't be suprised if the the UK tries to relaunch its coal industry. But it's hard for me to believe that UK coal depletion is purely a political phenomenon, divorced from geology.
Westexas,
Various recent articles from the Russian news agency FC Novosti highlight some of the energy issues Russia is dealing with. Their economy is booming and along with it demand for electricity. If my memory serves me right, Moscow is aiming to meet a 67% increase or so in Russian electricity demand/production by 2020.
The Russian electricity monopoly Unified Energy Systems (UES) has been told by Gazprom it is not getting any more gas i.e. no increases in current supply - production is flat and it is supplies to Europe that fills the Gazprom coffers. Russia has begun a massive expansion of its nuclear power stations, but it will take a few years before they come onstream. That pretty much leaves coal to meet the increase in electricity demand now. As you say, not unlike the situation in the UK in fact.
I haven't looking into this in detail, the majority of Russian coal is in west Siberia, which is only linked by one rail line? If so, then shouldn't a #1 priorty be to build some railways across Siberia -- have you seen anything concerning new transportation infrastructure?
Hi Kagiso,
Thanks for your information on Aberpergym. Aberpergym has been running only about 1/4 Mt per year (1% of the UK total), with reserves of only 4Mt. It does not qualify as a major mine. The HL plot scale is 27Gt, so we would not see Aberpergym on it, with or without the new pits. We could make the same comparison for employment with the 100 new miners. I am sure that these jobs are important to them and their families. However, at its peak, the UK coal industry employed a quarter of a million people.
We need to distinguish reserves, which by convention do take the economics into account, from resources, which do not. It would be precise to say that the UK resources have not been exhausted.
Dave
New nuclear might seem unlikely in today's era of what is still cheap oil. The trade offs will seem quite different once it is clear that this era is at an end.
Hello DaveR - thanks for an interesting post - I'd guess we'll be having more on coal in the coming weeks.
I need to echo the comments of TheRedBarron and caution that top down analysis such as Hubbert is really only applicable where a natural resource is depleted following a commercial exploitation history. UK coal is far from that.
St Maggie took on the miners in 1984 and this lead to one of the most bitter industrial disputes in UK living memory. TRB hasn't got the whole story IMO as in 1984 North Sea oil and gas production was just getting up a head of steam, providing the UK with an alternative energy source out of the control of these bothersome miners.
Another factor at this time was accusations from Scandinavia that acid rain eminating from UK coal fired power stations was killing all their trout. So began the dash for gas - and the blowing away of this priceless UK resource.
The main point is that the decline in coal production since 1984 is related to political intervention and the desire to allow the illusion of market forces to rule the day. I believe that deep coal mines were shut because they could not compete with natural gas or surface mined coal from S Africa and Australia. How much coal is left - I imagine we may need to resort to the British Geological Survey for that answer. I believe it is considerably higher that the "almost done" suggested in you're post - but to be honest I don't know the answer. But I'd predict we hear news of deep coal mines being re-opened within the next couple of years - I don't think the UK will be able to sustain this trade defecit and will be forced to expand indigenous energy production.
PS we are about to enter the Brown - Bush era :-))
It's nice to see my fellow Brits do their patriotic duty and stick up for the UK coal industry, and also they get a chance to show their left-wing political credentials. But the fact is, the UK coal industry is virtual dead, and will not be revived.
Figure 3: U.K. Coal Production 1877-2000 and Hubbert Curve
(You can see the post-war production increase here)
Maggie Thatcher and other political machinations may have altered its decline, but its been on an inexorable decline since peaking. If we believe Hubbert theory also applies to coal, and I think we do, then nothing is going to change that.
hahahahahhahahahahahah
Ha!
Peak year looks something like 1910 - the golden age of steam. The point is that since 1960 coal use has been substituted with oil, natural gas and nuclear energy. Without a proper bottom up analysis of what is left in the ground, this decline means very little IMO - but as I said above I don't know the answer to UK coal reserves.
Oddly, if you look at figure 4 above or the power point presentation (slide 27), post war production was higher than predicted from the pre war production. Just the opposite if coal was cut back to make room for oil. Wierd. Perhaps instead of oil replacing coal, it somehow subsidized coal production?
I'm just making this up, but from memory (and my memory starts around 1962):
There used to be 3 principal uses for coal in the UK:
Power generation
Domestic heat
Railways
In the 1960s the UK rail network got decimated and what remained got converted to diesel or electric - that use for coal gone forever.
The domestic heat part got decimated cos of air quality issues - and along came nat gas to take its place.
Power generation survived but got squeezed by nat gas and nuclear (as did oil fired power generation and industrial use of oil on the back of the 1970s oil shocks).
So I remain to be convinced that the decline in UK coal production is not in part related to demand - which if you look at my chart is showing signs of picking up again.
It appears though that coke is imported for steel production in the UK. If there was adequate domestic coal, surely that would be unnecessary?
Ah yes - forgot about steel production. Coke requires highest quality coal - which is mainly mined out in the UK. If you look at my chart you'll see that the UK now has a deficit between coal production and consumption - i.e. we're importing. There's also a problem with the high sulphur content of UK coal - but rest assured when the trade deficit hits £100 billion per year - we'll be doing everything humanly possible to boost indigeneous energy production - and subsidies work wonders for economics.
But an interesting point about coking coal - when that runs out steel production will be stuffed!
I agree with your above ground factors (I have seen 80 year old piles of coal sitting by heating boilers now powered by NG). But that is exactly what makes figures 3 and 4 above (HL of UK coal) so odd and sets off my engineers intuition.
We know from doing HL plots on cartel oil producers that reduced production can give a signal of reduced URR. So if coal was displaced by oil and NG (as we both agree would be logical) then what we should see is a post war drop in the HL pointing to a lower URR than the pre war trend.
Instead we see just the opposite. Post war we get a burst of mining production that would have pushed up the reserve estimate. And then production nose dives in just the last few years. Actually, it is behaving just like a modern pressurized oil field. It overproduces, giving us a HL that predicts double URR, and then suddenly drops in production at the end. Interesting.
(oh, hey, Memmel, you wanted some data showing technology does not help URR. Go for Yibal).
Yes Yibal is the poster child. But more than one field would be useful. Considering the extensive use of advanced extraction methods I'm bothered by the crashing aspect.
When iron ore runs out (or gets too hard to extract) steel production will be "stuffed" anyway. Fortunately steel is very easy to recycle.
Mmm, yes. My local paper reports that a BC mine is planning to expand coal production from 520,000 tpy to 1.3 million tpy. This is thermal coal destined for China.
It's hard not to have reservations based on the role of declining demand after the 1950s on the shape of the R/P curve. Even if R is based on official reserves, there hasn't been much incentive until recently for countries to put effort into updating them. Given the confusion of reserves with resources, the accuracy of the official figures must be all over the map and it's nice to have an informed view.
I particularly appreciated the observation on the position of production-limited emissions below all the SRES scenario forecasts and look forward to this appearing eventually in the peer-reviewed literature.
The SRES hasn't been updated since 2000. Given the criticalness of understanding how we should deal with climate change, this seems hard to understand. I commented as much on realclimate.org, and didn't get much response.
In fact, the more I read, the more convinced I am that there's actually a stronger case for the need to start replacing FF-based energy with alternative sources on the basis of declining availability than for the prevention of global warming (which is already a pretty strong case!).
In fact it may be a reason not to be overly concerned about China - they must be well aware that at the rate they keep using up more and more fossil fuels, they are going to get to a point where they're not longer cheap and easily available very quickly.
on domestic heat
Worth remembering that we used to gasify coal, to produce 'town gas' which was piped to houses and businesses.
It's for that reason the UK still has 'gasholders', magnificent pieces of Victorian ironwork, holding large amounts of natural gas in inflatable bellows.
The underlying (iron) pipeworks won't take the pressure of a modern PVC piped gas system, so we have to hold the reserve gas in storage, rather than in the pipes.
Ah, "the coal age didn't end for lack of coal". Where have I heard that before? ;)
That's true, but it's a chicken and egg question. Which came first, declining (and more expensive) coal production, or cheap oil/gas/nuclear?
In fact it was the former. The spur for the nuclear programme, and the "dash to gas" was increasingly expensive coal, and oil shocks of the '70s. I have seen many attempts to spin declining UK coal production as something other than classic Hubbertian resource depletion, but it's just revisionist history.
Once a resource has peaked, it becomes less available and more expensive. This is Hubbert 101. It's strange, because in a place where we champion Hubbert's theories there is a state of denial about our UK coal depletion. Why is it so hard to admit?
I'm sure it is not to hard to dig up the figures for UK coal consumption, but at least until 1990 the majority of electricity production was still from coal.
As for the history:
Electricity Restructuring and Privatization in the United Kingdom
Also note that other countries that have significant coal reserves which can be economically exploited e.g. US, China and Australia have all increased coal production despite the alternatives being available. Cheap oil has enabled coal production to increase where possible, rather than reduce it.
The reason the UK (and other European countries) have substituted for coal is because we literally ran out of economically exploitable reserves. The reserves we have left are equivalent in terms of EROEI to tar sands. There may be millions of tonnes down there, but it's barely viable to extract.
Very much in agreement. The economic reasons for the decline was cheaper alternative energy sources and increasing labour costs. So the decline in economically viable coal was dramatic.
I remain unconvinced that this is true in the current economic situation:
http://www.cv81pl.freeserve.co.uk/burtongreen-superpit.htm
http://www.minersadvice.co.uk/images/mines-prospects.jpg
I think your work is excellent. But your conclusions on decline rates use the UK as a prime example. It would be a shame if they were debunked by somebody with access to better data.
Hi Euan,
Thanks very much. To reinforce the point that Bob Cousins makes, let's blow up the far corner of the HL plot for UK Coal (Figure 3) to pick up the last ten years. It is still going down at 10% per year, with a trend for 200Mt remaining. And it is easy to see why, when you look at the reserves listed in the report UK Coal Production Outlook: 2004-16 at
http://www.dti.gov.uk/files/file14151.pdf
The mines are running out.
Dave, thanks for this and the link to dti report. This has been a great thread for me cos I and many others are learning about UK coal.
I've no problem accepting that 200 Mt is the reserves number for the 12 or so operating mines in the UK. In fact, if you look at Table 3.1. of the DTI report (p6) you see that the independent estimates are somewhat lower than the mine operators estimates.
The unknown factor for me is how much coal was left in mines that were shut and how much coal is there in undeveloped seams? See comments of kagiso.
It's also worth noting that old definitions of reserves need to be treated with caution - I think kagiso mentioned coal basin resources versus economically recoverable reserves. I really wonder if the UK authorities (DTI and BGS) know what the latter figure is. Good debate!
Hi Euan,
Hull was close to our modern definition of reserves in 1864, and his 85Gt came closer to the mark than any survey before 1984. For the last thirty years the total UK resources have usually been listed as 190Gt. In the latest World Energy Council surveys in 2001 and 2004, the UK did not report resources. I think that the problem is that people have traditionally thought of resources as a quantity that converts to reserves, and that is why people were interested in resources. But it appears that the process actually proceeds in reverse. Reserves get converted to resources. When that starts to hapen, people understandably lose interest in resources.
Dave
Euan,
Where do the data/forecasts on the UK current account come from? Because, if you believe this then shorting Sterling against (say) the Yen is probably going to be the best way to make money from Peak Oil over the next 2 years. That is if your leftie politics would allow you to do such a thing :-) George Soros, except based on Peak Oil. I'd be very grateful for a pointer on where the numbers come from.
Regards,
Cuchulainn
Comrade Cuchulainn:-)
The actual data on my chart are official government statistics found here:
http://www.statistics.gov.uk/cci/nscl.asp?ID=5819
I used table 300570782. So if you are a UK resident and want a reason to panic these are official figures. IMO this is bubble equity from real estate spent on imported manufactured goods - made cheap by the petro £.
The oil forecast is "Mearns2" found here:
http://www.theoildrum.com/story/2006/11/19/135819/75
and here:
http://ior.senergyltd.com/issue13/talking-point/
and this corresonds with the lower end of the DTI official forecast range.
The gas forecast is the actual DTI median forecast found here:
http://www.og.dti.gov.uk/information/bb_updates/chapters/Section4_17.htm
Forecast prices and exchange rates are very tricky. The oil price is increased steadily to $160 / bbl in 2012 and gas prices by 5% per annum - and as everyone knows its impossible to forecast prices meaningfully.
I'd certainly been thinking about getting out of Sterling denominated investements - but its a very tricky issue. Buying Euroland property is one option.
I lived in the UK for a while, and the public was always told that there was a 200 year supply of coal. Nothing was ever said about the cost of mining the stuff.
What I think the UK public wasn't told about was the difficult nature of the remaining coal resources. One of the remaining UK mines is bringing it up from 2000ft underground. That might be the world's deepest coal mine. Another mine was mining coal from under the ocean. I think it said that the miners could hear the waves breaking over their heads.
The UK reserves chart you presented seems to fall off a cliff starting in 1980. That coincides with the election of the Thatcher government. I suspect that Thatcher changed the way that the reseves were calculated. Thatcher went on to break the miners union, and privatise and deregulate the electricity industry and the coal mines. The newly privatised companies invested in the new combined cycle generating technologies, which used gas turbines and were gas fired. This was cheaper than digging up UK coal, and the coal industry has been in steep decline ever since.
In my opinion the decline of UK coal was due to the arrival of cheaper alternatives like North Sea gas. It was more to do with economics than a shortage of resources.
I'm wondering if a similar thing happened with Pennsylvania anthracite. Heating with coal means taking the ash out every morning, which is a messy and unpleasant job. Oil or gas fired heating is so much more convenient.
Peak oil is different. There are no good alternatives to gasoline, diesel and jet fuel. Biofuels are problematic. Coal to liquids could work, but global warming may rule it out. This might be the first time since the Industrial Revolution began that we run out of a major resource without having a replacement.
In my opinion the decline of UK coal was due to the arrival of cheaper alternatives like North Sea gas. It was more to do with economics than a shortage of resources.
I believe the point is that in geophysical reality, you can't separate economics from the facts about the distribution of resources.
If resources had been extremely easily extractable---due to geophysical reality---they'd be more economical than North Sea gas, drilled from under the sea, after all.
Same with oil.
That's the whole point about the depletion curves---the effect of economics is in there, but geology drives the economics in ways that people are usually reluctant to admit.
The reserves are now defined as coal seams that are « economically exploitable ». Let me give you an example. I was trained at Betteshanger Colliery in Kent, England. In 1984 Betteshanger had enough reserves to last 100 years. After the defeat of the NUM, the miners at Betteshanger were sacked and concrete was poured into the shaft. The coal is still down there. But to get it up one has to
Sink a new, deep shaft.
Build miles of underground roadways.
Recruit and train colliery managers, deputies, shot firers, miners, transport workers etc..
Rebuild the railways to move coal to the power stations also to be built.
Etc, etc, etc.
Not economical NOW so the coal below Betteshanger is no longer counted as reserves even though it is still there. But when the worldwide peaks in both oil and gas production are recognised, who is to say whether deep-mined UK coal production will become again « economical« . The reserve data for the UK are « political numbers » not « geological numbers » .
In the 1960’s Schumacher was pointing out using that over the next 200 years oil would make a very minor contribution to UK and world energy consumption. Over the long term coal would be king. Clearly he was correct. I have archives of Schumacher’s data but unfortunately they are in another house. I will look for them and forward them.
I strongly suspect that Betteshanger Colliery could only have produced coal for a 100 years more at an economic loss.
Per memory (and you are much closer) most British coal mines were operating at a loss in 1984, so what they were producing was not economic reserves. The next days production should not have been counted as reserves, since it could only be produced at a loss.
Best Hopes for British Wind,
Alan
Short term profitability was largely irrelevant to energy sector planning except to the privately owned oil companies who wanted the fastest flow rates from the North Sea to maximise their return on investment. UK coal was nationalised in 1947 so that it could run at a loss as a form of public subsidy to UK private manufacturing industries. After nationalisation the National Coal Board was even importing coal at world market prices and selling on at much cheaper UK internal prices - a complete contrast to what US oil companies are now doing.
To summarise the pre-Thatcher policies :
a) coal reserves had greater long term potential for UK energy production than any other source;
b) wholesale colliery closures would sterilise reserves and destroy the coal mining infrastructure - including education and training of future generations of miners;
c) an alternative strategy was to slow down the rates of consumption of North sea oil and gas while maintaining a coal industry of sufficient size to permit coal production to be ramped up again when the North sea oil eventually ran down.
The Thatcher government didn’t care about short term profitability either. For example the great midlands power stations were linked to collieries by special « merry-go-round » trains designed to pickup coal from bunkers at the pitheads and deliver directly to the power station coal crushers for burning. With the change of power in 1979, the power stations took years to built up huge stocks of coal at great cost in both manpower and interest charges. Laws were passed to make « secondary » industrial action illegal - for example, train drivers or dockers refusing to handle coal. Then the National Union of Mineworkers - Thatcher’s « enemy within » was broken with collateral damage being the destruction of the UK coal industry.
If the alternative had been adopted the UK would NOW have a working coal industry and plentiful reserves of North Sea oil and Gas and more time to ramp up on sustainable energy production. Instead the UK has a balance of payments crisis building and no realistic way to increase coal production to compensate for North Sea declines in the short term. They are asking the French to help them build nukes. The French will agree and the French will build nukes but I bet those nukes will be in France and the UK will finish up importing electricity by wires across the channel at whatever price the French choose until « exportland for electricity » cuts in .
UK coal was nationalised in 1947 so that it could run at a loss as a form of public subsidy to UK private manufacturing industries
An incredibly inefficient (and wrong headed) way to subsidize "private manufacturing" !
A much better choice would have been gov't guaranteed loans, subsidized training, fast depreciation, etc. More bang for less buck (err pound) !
You have convinced me that coal mining in the UK was, is and will be uneconomic. Once the last 12 mines close, a handful of new ones may open, and that will be it.
Best Hopes for British Wind,
Alan
I don't know whether subsided energy is a good or bad development tool. But France still does it. All those municipal tramways that you love are powered by subsidised electricity.
Dave Rutledge has presented hard data, historically verifiable data, that demonstrates that reserve estimates are not to be trusted.
I would counter that it is incumbent upon you to make the case as to why your chosen reserves "saint" (Schumaker) should be trusted instead of the actual data. If these reserves exist, then why are they not reported annually?
In fact, that is of even more importance to peak oil than the rest of the assessment. It demonstrates clearly that reserve estimates late in the lifecycle of a finite energy resource are not to be trusted and further, that the reserve estimates earlier in the lifecycle are more likely to be closer to the actual values.
Ghawar Is Dying
The greatest shortcoming of the human race is our inability to understand the exponential function. - Dr. Albert Bartlett
When Schumacher discussed coal reserves he was concerned with reserves in seams thick enough to mine with the available or planned technology. In the 1960s that was tens of billions of tons (US billions). Dave uses a current estimate of about 200 million tons of UK reserves. Clearly different things are being measured. I believe that HL should be applied to reserves that can be physically extracted and that Schumacher’s measure is the correct one . That’s why I expressed reservations about his UK conclusions.
Schumacher was not a saint. He left Germany in the 30s to study economics at Oxford and taught Economics at Columbia University. He was Economic adviser to the National Coal Board from 1950 until 1970.
I have my archives now and in summary he thought that extractable world coal reserves were 7 times greater than oil/gas reserves, at 40-50 Q where Q is 10*18 BTU. In the 50 years between 1950 &nd 2000 he expected world coal production to be 2.5 Q, oil to be 6.5Q, others to be 0.7 Q giving a total of 9.7 Q . He also gives UK coal reserves in the early 1960s as 6000 million tons, boreholes and searches find several times annual production in each year.
He concluded "that the continuance beyond the year 2000 of of the modern way of life in the highly developed countries of the West is virtually certain to depend upon coal and it is therefore thye in,escapable duty of the present generation to ensure that the coal industry is cautiously and sensibly preserved in the meantime.
Dave's data is quite different from what the UK, european, and international coal experts have thought for the last 50 years.
« there is no substitute for energy. The whole edifice of modern life is built upon it. Although energy can be bought and sold like any other commodity it is not like « any other commodity » but the precondition of all other commodities. It is a basic factor with water, air, and earth
Unlike air, earth, and water which are regenerated, non-renewable coal , gas and oil are taken from Nature’s larder without possibility of renewal The world reserves are undoubtedly very large but the fact remains that they are a once and for all endowment which cannot be increased ut only diminished. It dealing with matters of fuel and energy the concept of conservation has to be kept clearly and tenaciously in mind.
This is our kind of economist.
Can I just wave my hand in a non-authoritative manner and mention the 'law of receding horizons' in relation to the argument given in the past that once the deeper mines were closed it would be uneconomic to re-open them.
I think, based on uninformed conjecture, that the UK mining industry is no more capable of ramping up production than the UK nuclear industry, and for the same reasons ... doubtful returns in the face of a depression, and a depleted and aging technical base. RJB's accounts show a halving of the wage bill between end 2005 and end 2006. Scotland has no coal mines open since Longannet closed, flooded, in '02. Could we do it even if the political will was there?
I'd also mention that the same reasons "lack of investment", "political interference" are given for the decline in North Sea oil production. We know what the real reason is.
The claims about "new oil discoveries" and "new pits opening" - which both transpire to be insignifcant - are also uncannily similar. Peak Coal denial looks very similar to Peak Oil denial.
The Law of Receeding Horizons... Isn't that what Tainter writes about where production has gone so far past declining marginal returns it's into declining absolute returns? It seems very closely tied.
cfm in Gray, ME
Hi Lanterne rouge
We were talking about that law at our last meeting in Coventry. I am very much in agreement with you that the costs of reopening these mines will go up just as energy prices go up, - because energy prices have gone up! Therefore, they may not ever approach economic viability.
Carbon - Coventry, UK
What a pity: Longannet in its heyday was the most productive colliery in Britain. I once met the colliery manager and asked him the secret. « Simple » he said. Longannet is a drift mine ( meaning there is no shaft), men can walk in and out. So my rule is that whenever a face has cut two strips the men can go home. Few other UK faces delivered two strips every shift but Longannet did sometimes in 5 hours instead of 7.
I suspect the coal assets are still largely there but the tradition of mining has gone. Coal miners I worked with are devering bread now and stacking supermarkets. the mining communities are irreplaceable IMO.
Dave,
Thanks for the great article. Question: from the book "Big Coal" the production method of Montana's coal is to essentially blow up the ground and then collect the coal off the surface, and this is the most efficient production method, according to the book. Wouldn't other areas (large areas of Canada and Siberia) also be able to "mined" in this fashion? So far coal estimates for Canada and Russia are not very
large according to the USGS.
I am also wondering if the USGS is biased in underestimating Canadian and Russian coal reserves, as they are not part of the US. From the "eyeball" test the geology and terrain of Canada and Russia seem to be similar to Montana, but I have not done seen or done a detailed study.
I noted only approx. 30 million Russians live in Siberia so probably not too much detailed exploration there.
Thanks again.
Hi Buckler,
Most people use the World Energy Council reserves, which are provided by each individual country. My guess is that very few of them are pessimistic. Canada's reserves are only 8Gt. The Rocky Mountain coal fields peter out as you go north in Montana.
On the other hand, Russia's coal reserves are colossal, 189Gt, and are primarily in their Siberian coal fields. The Russians have not shown much enthusiasm for getting it out, which is understandable.
Dave
Great thanks.
Go Beavers!
Glad to hear from a Techer.
Dave
The major implication of this is not so much the limited temperature increase as official denial of a looming coal peak. Australia can't seem to dig up coal fast enough and will use coal fired electricity to power desalination plants. If China's coal peak is imminent (per recent Jerome a Paris article in TOD) then no doubt Australia will help them out. The early warning signs seem consistent with accelerated depletion. Governments have to start looking at possible time paths for population, energy and water use and decide which combinations are achievable. Right now the policy is for more babies and more coal mines.
Thanks Prof. Rutledge for this excellent article. Here are the remarkable conclusions I draw:
1. Coal reserves are far less than thought.
2. Coal is going to run out more-or-less alongside petroleum/NG.
3. While "there will always be oil, it will just get more expensive", for practical purposes (such as running an advanced industrial civilization) fossil fuels will disappear.
4. We can argue timing, but essentially oil, coal, NG are gone 100 years from now +/- 50 years.
5. Fossil fuel contribution to future CO2 in IPCC models is quite on the high side. The IPCC models need to be redone with better estimates of available fossil fuels -- and run for well beyond 2100 to see the full temp effect.
6. If we only slow the rate of fossil fuel use (the Super Kyoto plan), the temp rise still occurs, just a few years later (its an integral!).
7. The only real way to prevent CO2 release is sequestration or better yet keep the fossil fuels in the ground (good luck with that!).
8. Absent some crash programs for renewables (or temporary reprieve via unconventional fossil fuels), civilization must get by on a small fraction of the energy it now uses (and in far less convenient forms).
Personally I draw the additional conclusion that
9. Global warming / climate change could be a red herring, causing us to focus on the wrong problem (see #6 above).
Looked at in the right way however, global warming and peak oil should both lead to the same conclusion, ie. #8 above.
A modeling question: Can this prospective data set for fossil fuel production be profitably used to improve the World3 model of the Limits To Growth book? They explain in their book that they stay away from detailed modeling of any one area, to avoid "false levels of detail". However, if we are getting a better idea of future energy production, perhaps those models and scenarios can be improved?
Hi Relocalize,
I should have asked you to write the conclusions. You did a great job, better than I did.
Dave
Thanks for your post, very enlightening.
I notice however that your conclusions are quite conservative. Your estimate of ultimate recoverable production ends up being about half of the official reserve figures. Yet you indicate that real-world production turns out to be 15-30% of estimated reserves in many regions.
So you could be overstating the amount of remaining recoverable coal by 100%.
And the actual possible contribution of remaining coal reserves to global warming could be less than half a degree?
If we are to believe in things we cannot see or touch, how do we tell the true belief from the false belief?
It has occurred to me recently:
Back when the coal beds were laid down the world was 5-6 degrees warmer, and CO2 levels were 1500-2000ppm. If we were to burn every scrap of hydrocarbons ever produced, we would expect the temperature to return to previous levels - about 6 degrees warmer.
Any talk of a runaway greenhouse effect is absolute rubbish, because we know it didn't happen even with CO2 levels 5 times higher than today. It can't happen, even if we burn all the fossil fuels, because we can't get to a higher level of CO2 than originally existed when the fossil fuels were created.
But can we burn all the fossil fuels? Of course not. We can't even expect to find them all. What about the coal that's buried 10km down? The coal under the sea bed offshore? The crappy coal mixed in with layers of other rock hidden under a kilometre of overburden? The coal with low energy content that isn't worth mining?
I'd be suprised if we ever managed to find and burn 30% of the worlds fossil fuels.
So a 2 degree temperature rise is believable - but where would the carbon come from for anything greater?
If we are to believe in things we cannot see or touch, how do we tell the true belief from the false belief?
Except that anthropogenic climate forcing is more than just the CO2 emissions from releasing previously locked-up carbon. Human industry and even agricultural practices have significantly rearranged the chemistry of above-ground minerals and chemicals, so that atoms that were previously bound up in harmless arrangements are now rearranged to form gases that have unnaturally high greenhouse trapping capabilities. Cutting down forests has reduced the planet's CO2 absorption capacity, and other land use changes have had a net forcing effect on climate.
From memory the IPCC report concluded that burning fossil fuels was only responsible for about half of anthropogenic climate forcing, presumably meaning (extending your logic) that if we did manage to burn them all, AND continue our other practices, we could be looking at 12 degrees warming in total. Obviously that's not going to happen, but if it did, it's too hard to say for sure that it couldn't somehow trigger a runaway greenhouse effect. And I would think a runaway greenhouse effect could in principle be triggered by more than just a simple temperate-tipping point - it could also be caused by an excessively quick rise in temperature. Further, with or without mankind's activities, the biosphere's composition now compared to 200 million years ago is significantly different - for all we know, it may be capable of absorbing far less CO2.
So forget about fossil fuels. They've not the problem.
Stop burning down the bloody forests
If we are to believe in things we cannot see or touch, how do we tell the true belief from the false belief?
We intelligent ones have created fluorocarbons, a GHG that never existed before. We should get back to 1960 levels by 2400 or so since we are phasing them out.
We can create a "methane burp" that does more GW than CO2. Methane is short-lived (less than a decade half-life), so things should cool down a generation after the methane burp.
You may be right VERY long term, in geological time frames. But even a century is a LONG time for civilization and me personally.
Best Hopes for minimal GW,
Alan
When the CO2 was 2% of the air, the sun was a little less bright compared to now. That would mean that a higher amount of CO2 compared to now would have to be in the air to make the temp the same as now. If we burnt all the fossil fuel, the 2% CO2 would make for air that'll cause us (and animals) to breathe more heavily as CO2 builds up in blood. I'd invest in oxygen bar equipment companies in that case as people would want relief from the emphysema-like breathing symptom.
Worse, even without global warming, a "creamy nougat" of oil would cause "peak air" and our own suffocation! An atmosphere of 15% oxygen and 5% CO2 would be extremely unhealthy. You do NOT want a "creamy nougat" of oil!
We must get over our addiction to fossil fuel, one way or another. Start building the solar and wind power plants!
Petrol prices high enough yet? Just wait!
DaveR, I'm glad I understood the article to some extent. It really does seem like big news to me if this can be verified by other researchers... That we essentially won't have coal to rely on to pull us through beyond where the oil would be truly "running out" in 100 years or so.... That all the focus on reducing GHG for GW/CC may be completely wasted effort...
Is this any way to run a civilization? Shouldn't this be at the top of everyone's agenda in government and industry? And if the early effects do come as soon as some here are predicting.... yikes! I continue to be amazed and dismayed that these ideas are so hard to discuss with people. People I know just don't want to think about it.
It just seems so clear to me that the only responsible, moral position is to look on the remaining fossil fuels as a gift to be passed on to our children; that the only responsible way to use fossil fuels today is to build renewable infrastructure that can last for 100's of years. The Romans built amazing aqueducts that still stand.
The permaculture folks have as one of their ethical principles something they call "transitional ethics". It basically means that it's OK to use limited fossil fuels today to create some permanent infrastructure for tomorrow. The classic example is a bulldozer creating a swale to catch rainwater.
(Of course my personal lifestyle doesn't match up with the fine words above.)
The Swiss are digging a series of three tunnels (56 km, 20 km and 15 km from memory) to create a flat straight railroad between Zurich and Milan under the Swiss Alps. When finished, pax will travel at 240 kph, specialty freight at 160 kph and regular freight at 100 or so kph on (hydro) electricity.
Railbed and tracks are designed to last 100 years before major refurbishment. The tunnels themselves will last "as long as humanly possible" with no shortcuts.
Much of the power to drill these tunnels is electricity (1/2 hydro, 1/2 nuclear in Switzerland, except the railroads which are 100% hydro) but also substantial fossil fuels..
The Swiss plan to eliminate trucks over the Alps via taxation and provide this route and another (Bern-Milan with a new 20+ km tunnel) as alternatives.
Massive 20 or so year project !
Best Hopes for Long Lived Infrastructure,
Alan
Next door neighbor owns and lives in 3 story brick 1850s-1870s apartment (5 units). He is a contractor and is doing a variety of repairs and improvements before condoizing the building. He was repairing porch (a 1900 add-on he thinks). Poor quality job that needs replacing after just 100 or so years ! He will do it RIGHT ! this time ! Not at all like the workmanship elsewhere in the building.
A very cool idea. If you look at the way LTG models resources and the shape of the EROI curve, they are very similar.
There are two interactions. One is that the energy supply gets lower (peak and EROI reduction) but the second is that ore bodies get more dilute and require more energy to get the same amount of ore. Where these two curves cross over = peak industry. So we would need the ore body side. But it might be enough to assume constrained ore resource and just model energy. You can order the model on a CD from amazon.com
Jon Freise
Analyze Not Fantasize -D. Meadows
DaveR,
Thanks for a very interesting post. Particularly with marrying fossil fuel depletion to global climate change.
James Hansen goes some way in this direction but you've followed it through to it's logical conclusion. I suggest you write it up as Scientific Paper and submit to a journal to get this aspect of the debate out into the general Scientific community.
All that said, I'm sceptical about the coal resources. It seems to me that many coal fields are in the "un-economic" phase now because they're competing against the best coal reserves in the world.
Australia can't contribute more than a small fraction of just China's demand for coal which has already resulted in the international traded price of coal increasing with more increases likely in the future.
If there was no political constraint on coal production, the natural effect would be to rework old mines, open new mines etc. We've seen the gold industry go through several phases of this already and gold production in 2007 is 5-8 times greater than the turn of century even though the grades mined now are far lower than in 1900.
Of course there are already significant political constraints on coal and it appears likely that heavier political constraints will be placed in the future. Further price rises make alternative energy sources much more competitive, so maybe the depletion curves you show will pan out.
In any case you make a very interesting point that should be placed amongst the IPCCC scenarios.
I would love to see a peer reviewed paper like this. A few years ago I presented the following poster at a climate change conference for California. Had some interesting conversations around it, but I am sure some thought I was kooky. This is just the title and abstract, the poster was full of graphics.
From Economics to Climate: An Ecological Perspective on Economic Models for Carbon Emissions Scenarios
Dr. Jason Bradford
Missouri Botanical Garden and U.C. Davis
jcbradford@ucdavis.edu
Abstract. Regional climate models rely on global climate models for their boundary conditions. These global climate models typically receive inputs from neoclassical economic and human demographic models for calculations of future greenhouse gas emissions. In contrast to climate models, which are biogeophysically-based systems models that incorporate time-delayed feedbacks and non-linear dynamics, the economic and demographic models that underpin the Intergovernmental Panel on Climate Change (IPCC) are price-based equilibrium models. Furthermore, the entire IPCC metamodel is a "vertical" Integrated Assessment process that does not allow feedbacks from "Impacts" submodels (as in IPCC Working Group II) to the economic and demographic submodels (as in the SRES reports). The methodological and structural flaws in both SRES models and the IPCC metamodel leads to unresolved absurdities in the IPCC reports, such as world GDP growing 7-15 times larger than today while climate change effects become potentially catastrophic.
Alternative economic and metamodels are available, and they give very different scenarios for human population, economic output, atmospheric chemistry and climate dynamics. Two of these models are mentioned here. The Global Unified Metamodel of the Biosphere (GUMBO) is based on ecological economic principles. The Global Systems Simulator (GSS) is based on biophysical accounting of stocks of natural and built capital, and detailed demographic tables. Both of these models differ from neoclassical economic models in crucial ways. First, their "preanalytic vision" places the human economy as a totally dependent subset of the Earth system, meaning that the material growth of the human economy is limited. Second, their macroeconomic models use true biophysical accounting of the stocks and flows of life sustaining elements and processes, rather than monetary abstractions.
It is recommended that Californian climate change scientists and policy makers consider these alternative models--both to produce global boundary conditions for regional climate models, and as examples of proper metamodeling principles for regional Integrated Assessments.
The Galactic Empire is in peril. Trantor will fall. It is predicted by the mathematics of Hari Seldon. An era of barbarism will ensue. Where is The Foundation?
Makes me wonder if 'Psychohistory' might be an apt, new catch-phrase to sum up the 'Oil Years' or the 20th century..
HI!
Newbie here, and admittedly pretty ignorant about this subject. Great website, tons of information, and I appreciate it!
I'm gonna lurk for a while until I get my head around this....Thanks for all yinz do here,
Regards,
Scott
"Oh bother", said Poo, as he chambered his last round
This is a great post and the thread has some very good stuff also. Many thanks to Dave Rutledge.
Some points I’d like to make:
. Why do you use the Normal curve on Cumulative plots and then an Hubbert curve for modeling? The good performance of the Normal for the US is probably an artifact of the Alaskan cycle; using just the Lower-48 the Hubbert curve fits much better.
. In your scenarios there’s a 50 year lag from the emission peak to the concentration peak for the Producer-Limited scenario and about 75 years for the Super-Kyoto scenario. This is in clear contrast with the scenarios presented by James Hansen, were the that lag is about 20 years. Why do you think this is so?
. As you can read here Hansen also sets 450 ppm as a threshold from which the temperature will rise above 1º C and things get out of control. On both of your models, in spite of none breaching markedly the 450 ppm threshold, temperature rises almost 2º C. Again what you think is making that difference.
Anyway we can definitely throw the IPCC scenarios overboard.
Dave I hope to continue seeing you by at TOD, your work and comments are surely a valuable contribution.
Hi Luis,
Great comments. Climate models compare their models in the same way people predicting peak oil compare their predictions. For the delay between the emissions peak and the CO2 peak, I do not know the answer. James Hansen has a different model for fossil-fuel emissions and a different CO2 model, and this could be the reason for the difference. For temperature rise, there is an additional factor. Tom Wigley's WRE models represent business-as-usual for all of the other greenhouse gas components except fossil-fuel consumption. This is a conservative way to do the calculation, but it might make the total temperatures higher than others might calculate with the same fossil fuel profile and other greenhouse gases reduced. This is one of the reasons that I plot the temperature rise due to future fossil fuel use separately.
My experience is that normal curves usually work better than sigmoid curves. In this situation, using the words Hubbert Linearization for a rate plot is a little confusing, because normal distributions curve a bit on a rate plot. The rate plot for US oil from 1900 to present is shown below, together with the normal fit. US oil looks normal from the very beginning.
Nice graph, thanks for you answers.
Do you know the work of Adam Brandt on curve fitting? He has done some interesting things, read it here.
As for the emission models, I myself don't know much about it, I never studied it, but it is strange to have such different results between these two.
Hi Luis,
Adam's work is terrific. Adam and I have talked about these issues quite a bit. People are usually not surprised that oil production fits normal curves well, because for oil, production mirrors discovery, which has a random component to it. The tougher question is why coal production also fits normals. People are not busy looking for coal. They know where it is. I think that the answer is related to many of the comments on this post. Each new coal seam that is opened up in the hundred thousand coal mines in the world is the result of an independent economic decision with inputs from a small group of mining engineers, mine managers, bankers, and owner representatives. I think it is the independence of these many decisions that gives the normal curves.
Cool! That the exponential non-symetrical fits best would explain the little up-leg that is seen in HL plots just before a major region peaks.
Hi gTrout,
Yes. You can see it in the post at the beginning of the thread in Figure 3, which is the Hubbert Linearization for British Coal. Also, in my slides at
http://rutledge.caltech.edu/
most of the HL plots are compared with normals because they look better that way (World hydrocarbons,UK coal, PA anthracite, VA bituminous, East of the Mississippi, West of the Mississippi). The big exception is China, which looks linear to me, and which may be on a transition to a new trend anyway. China is also different, because in the early stages, it was a planned economuy.
Dave,
This is a good piece of investigation!
It shows us that we will not fisher-trops our way out of conventional peakoil here....
But the biggest problem by far with climate change is that there exists some positive feedback loops in nature:
-melting ice create bigger surface of ocean, absorbing more sun radiation, causing more melting.
-melting peat-bogs release Gigtons of CO2 in the atmosphere, creating more heating, more peat-bog melting.
-at raising temperatures forrests start to rot and release CO2. Other forrests ignite, creating more CO2 and heating.
-oceans, now still an CO2 sink, start to acidify. Once a treshold is passed, the oceans die and start to emit CO2.
-not to mention the possibility of the release of methane hydrates from the ocean floors.....
That is the big danger here with climate change.
So the modelling of temperature rise should not be done with the estimation of oil, natgas and coal to burn, but should take these positive feedback loops into account.
That is why we should be really afraid of climate change!!
What is your opinion on this matter?
Roger From the Netherlands
Hi Roger,
MAGICC has feedback elements in its models. I defer to the climate modellers on the question of what levels of temperature rise to be concerned about and how to do the modelling. However, I would like them to think more critically about the fossil-fuel inputs that they use in their models.
Hi Dave,
True, we must leave the modelling to the modellers.
But looking at the MAGICC graphs, there is a near-linear relation between FF-inputs and CO2 levels in the atmosphere. This suggests that positive feedback loops (if indeed incorporated in the model) only contribute to very small amounts of extra CO2 input in the model.
While there are studies that clearly state this (see: http://www.sciencedaily.com/releases/2006/05/060522151248.htm and: http://www.ecobridge.org/content/g_fbk.htm ) how can we take this model serious if the positve feedback loops are not relevant in this model?
What I suggest is that once tresholds are surpassed, no extra FF-input is needed to rice temperatures on earth to very high levels. This has happen before in the history of the earth. And in those cases, no man were around buring Coal!
Roger From the Nethelands.
Hi Roger,
Thank you for your comments. We need to make sure to make a distinction between feedback and linearity. They are different. Linearity means that if we scale the input, the output scales by the same factor. An example of a violation of linearity would be a threshold.
Feedback refers to part of the output acting as an input. The overall effect can be to increase the output (positive feedback) or to reduce the output (negative feedback) in comparison with the situation where the feedback is prevented. This does not have anything to do with linearity; it simply changes the ratio of the output to the input.
Even in non-linear systems, the response to modest fractional changes in inputs is often near linear. Fossil-fuel burning amounts to 7Gt of atmospheric carbon per year. This compares with total atmospheric carbon of 750Gt. Also, the normal scale of the exchange of carbon between plants and the atmosphere, and the ocean and the atmosphere, are each about 100Gt per year. MAGICC's predicted peak of 460ppm in 60 years would be a 20% increase on today's levels.
Hi Dave,
Thank you for your answer and the numbers on CO2.
Your statement suggests that the CO2 input into the system by burning FF only has moderate effects, even if one takes some positive feedback loops into account. This due to the fact that the input per year only 1% is of the whole system and the fact that the input is only 7% of the natural carbon cylce.
But this is all stated and correct WITHIN the system.
The point I'm trying to make is the real possibility (supported by many scientific research mentioned above)
that by the FF input, the system itself changes in such a way that it releases extra CO2 on its own, even without additional FF input, until a new stable system has evolved (one not preferable by humas..)
If this happens, the MAGICC model will not be valid anymore, because the system where the model is based upon has changed profoundly. And thus the model cannot predict the future anymore.
Roger from the Netherlands.
Hi Roger,
MAGICC was one of the programs used in the 3rd UN IPCC Assessment on climate change, and it was designed to model CO2 for scenarios with much higher carbon emissions than our Producer-Limited Profile, including each of the 40 UN IPCC scenarios, which all have higher emissions. Chris Vernon provided graphs for these at the beginning of this thread, and they go up to CO2 levels of 1000ppm. The CO2 rise for these is 9 times that in our Producer-Limited Profile. This means that we are on the very low end of the range of carbon emissions and CO2 levels MAGICC was designed for.
A couple of days have passed since this post and the 6C warming camp has not responded.
If 2C is the max with FF economic depletion I think the debate needs to be reframed on how best to use what coal remains.
You just didn't notice them.
See the remarks above on the distinction between economic reserves and geological resources, e.g. in the UK.
Interesting story. It seems the obvious task now is to publish this in a reputable journal since I would presume this to be a prerequisite to gaining the attention of climate modellers. Any plans?
Hi M,
Good question. A major purpose of submitting to a journal is to get thoughtful, critical feedback from reviewers. For this purpose, an author could not do better than here at The Oil Drum.
I totally agree. I did it and it really helped my paper :-)
Here's a link to a big pdf file about the reserves at the remaining deep mines in the UK.
http://www.dti.gov.uk/files/file15982.pdf
They divide things into reserves, resources and mineral potential.
I'm amazed by how deep the mines are. They're bringing coal up from 2-3000 ft down.
The deeper the pit the higher the temperature. In the Kent coalfield pits like Betteshanger were 3000 feet deep and it was common to see face workers wearing a safety helmet, safety boots, and a smile. Women were not allowed underground in UK collieries (superstition and Puritanism) , unlike France where Zola’s « Germinal » describes the goings on.
Another side effect of heat is that the normal solution of covering ones eyelashes with Vaseline did not stop coal dust accumulating there. I used to go up to London every Friday afternoon and return early Monday morning. On the Friday evening tube from Waterloo to Hampstead, people thought I was wearing mascara and gentlemen used to smile at me. Had I been so inclined my social life would have been busy. But this was « swinging London » where , as the poet put it
« Sex was invented in nineteen sixty three
Between the Chatterley trial and the Beatles’ first LP »
In Hampstead a coal miner was treated as though he were D. H. Lawrence himself.