| How to Address Contrarian Arguments - part I | The Oil Drum: Europe | USGS WPA 2000 part 1 - A look at expected oil discoveries |
The architecture of UK offshore oil production in relation to future production models
Posted by Euan Mearns on November 30, 2006 - 12:40pm in The Oil Drum: Europe
In the wake of last week's $1000 attempted debunking of the peak oil hypothesis by CERA, I felt it was time to examine CERA's powers of prediction in relation to real world, deterministic data.
This article is going to be in two parts. This week I am going to look in detail at the architecture of UK oil production since 1975 and on this basis provide a combined top down and bottom up forecast for UK oil production to 2012, incorporating future production data kindly provided by Rembrandt Koppelaar. Next week I will look at other production models produced by CERA (pdf), Kemp, Koppelaar and the UK Department of Trade and Industry (DTI) in relation to my own forecast produced here which is called Mearns2.
The starting point of this exploration of the architecture of UK offshore oil production is to look at the stacked field production history from 1975 to 1999 - which was the peak production year (Figure 1).
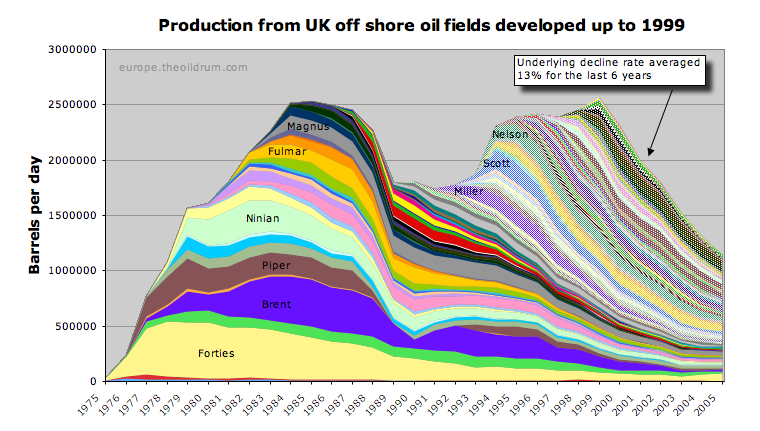
Figure 1. The stacked production profiles for all UK offshore oil fields from 1975 to 1999 - the year of UK peak oil production. Fields brought on production since 1999 are not shown. Note that without new fields, the underlying rate of post - peak decline is 13% per annum. Click on chart to enlarge (applies to all charts).
Note that the production peak for the offshore fields is 2.56 million bpd, well short of the 2.91 million bpd recorded in the BP statistical review and other sources for 1999 UK oil production. There are two main reasons for this discrepancy. Onshore fields accounted for 90,294 bpd in 1999. There was also 1959 thousand tonnes of condensate (45,620 bpd) and 6880 thousand tonnes of NGL (216,767 bpd) produced in 1999 that arrived at pipeline terminals, and that are not allocated to specific fields. This adds up to 2.91 million bpd.
DTI conversion factors used:
1 tonne = 7.5 barrels of crude oil
1 tonne = 8.5 barrels of condensate
1 tonne = 11.5 barrel of NGL
UK offshore oil production has twin peaks - 1985 and 1999 - the latter being the all time peak year. There are two main reasons for this rather unusual oil production history:
- The first peak is built on the back of giant fields - Forties, Brent, Piper and Ninian. The oil price crash of 1986 led to a slowing in investment, the postponement of several new field developments and a hiatus in exploration, which in turn led to a bi-modal discovery history.
- The Piper Alpha oil rig explosion of 1988 that led to lost production from this hub for 4 years, and reduced production from a number of fields while sub-sea control valves were fitted to production wells in wake of this disaster.
In 1985, the first peak year, there were 32 fields on production.
In 1999, the second peak year, there were 136 fields on production.
By 1999, production from the first series of giant fields had declined to less that 500,000 bpd (Figure 1). The second production peak was produced by the Miller, Scott and Nelson Fields, supplemented by numerous smaller field developments.
Figure 1 does not show any of the new fields developed since 1999. There are 48 of them and these will be discussed below. Excluding these new fields for the time being gives a picture of the underlying rate of production decline.
From 1999 to 2005, the average underlying rate of production decline = 13% if new field developments are excluded
It is worth pondering for a moment to consider what exactly this means. The 136 fields on production in 1999 have not just been neglected.
- Companies will have in many cases been pursuing vigorous secondary oil recovery programs.
- There will have been a large number of infill wells drilled from platforms.
- There will have been scheduled and unscheduled breaks in production for maintenance.
- Some fields, like the once giant Forties Field have undergone significant refurbishment, investment and redevelopment (see below).
- Fifteen fields have ceased production!
All of this activity is captured by this average 13% decline rate. To change this decline rate in future will require a change in the level of activity. For example, if future EOR projects are to slow this rate of decline, it is the increase in the number of EOR projects over the last 6 years that will count, weighted for field size and effect. If the number of EOR projects falls, then underlying production decline may accelerate.
The Forties Field refurbishment: In 2002, Apache Corporation bought BP's majority share in the Forties Field and initiated a major program of field refurbishment and redevelopment. This has led to an increase in production and reserves. In 2003, Forties produced 2.4 million cubic meters of oil and this was boosted to 3.9 million cubic meters in 2005 - an increase of 63%. Very well done Apache! This is held up as a shining example of future North Sea prosperity by The Optimists. The negligible impact this has had on UK production is easily seen in Figure 1. Furthermore, the signs are that Forties production is once again declining - 2006 monthly average (Jan to July) = 309,000 cubic meters compared with 328,000 in 2005.
The Impact of New Fields on Production
There is quite a buzz around UK production forecasts for next year because the Buzzard Field is due to come on stream late 2006 / early 2007. This was the last giant oil field to be discovered in the UK - the result of imaginative exploration geology and geophysics by Encana, who subsequently sold out to Nexen - the current field operator.
But before looking at Buzzard lets take a look at how new field developments since 1999 have impacted production in the time frame to 2005. Forty eight new fields have come on stream since 1999, and 5 of these are sizeable developments - Bittern, Shearwater, Blake, Elgin and Franklin (Figure 2).

Figure 2. 48 new UK offshore oilfields have come on stream since 1999. Peak production from those fields was just over 500,000 bpd in 2003.
These new fields tend to be relatively short lived compared with the giant fields developed in the 1970s (Forties, Brent etc) and the large fields devloped in the 1990s (Miller, Scott and Nelson), resulting in a peak 2 to 3 years from the start of their production. There are two main reasons for this:
- A number of these fields are high pressure, high temperature (HPHT) gas condensate fields (Shearwater, Elgin, Franklin etc). These are deep, very hot and very high pressure reservoirs, technically difficult and very expensive to drill. They are developed using a small number of wells, and production is via natural decline in the first instance. So, once pressure begins to drop so does production.
- Small fields that have a short field life. Some fields that have come on since 1999, have already ceased production.
In Figure 3, I have summed the production from these 48 new fields (Figure2) and added them on top of the stacked field profile from 1999 (Figure 1). This shows the impact that all this new field activity has had on UK production. The underlying rate of decline (13%) is reduced to 7.6% the actual average rate since 2000. Note how the production from Bittern (2000) Blake, Elgin and Franklin (2001) result in a shoulder on the decline curve (Figure 3). All this new oil (condensate) only managed to arrest the decline for one year - an important point to remember when we come to consider the impact of future new fields on UK production.

Figure 3. Adding the 48 new fields that have come on stream since 1999 (Figure 2) on top of the underlying stack of fields shows that the impact of all this new field development activity has been to reduce the average annual rate of decline from 13% (Figure 1) to 7.6%.
Production Forecast - The Impact of Future New Fields
In an earlier post, I provided a forecast for UK oil production based on the simple assumption that future new fields would have a similar impact upon production as past new fields and that this would result in future production following the 7.6% decline curve discussed above. That earlier forecast is labelled Mearns 1 on charts and the new, more refined model that I present here is labelled Mearns 2. It will be seen that the net result between these two models is insignifant by 2012.
The starting point for this modelling exercise is to consider what would happen to UK production if no new fields were developed from 2006 onwards. If this were to happen, oil production decline would accelerate as it has already been shown that it is only the continuous development of new fields that has maintained decline at 7.6% as opposed to the underlying rate of 13%. In this forecast, it is therefore assumed that in the absence of new fields, decline would revert to the underlying rate of 13% - shown in orange in Figure 4. An accurate assessment of the underlying rate of decline is a significant uncertainty in this forecast model
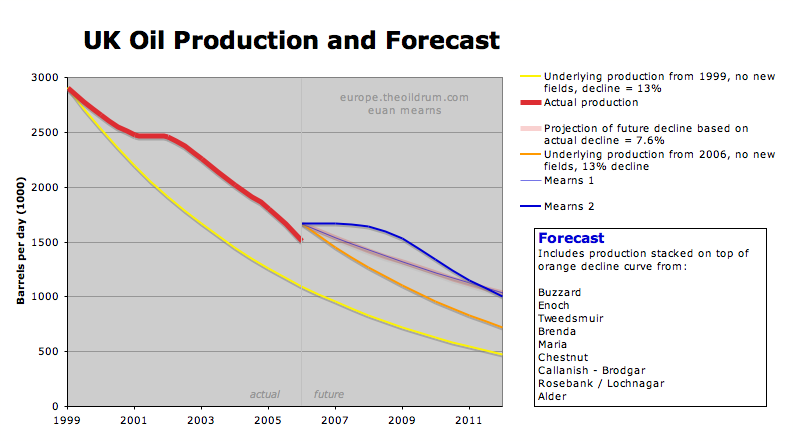
Figure 4. UK oil production forecast. New oil production is represented by the area between the blue forecast line and the orange line that represents underlying decline. The 2006 actual production figure is the average for Jan to July and is probably biased low by production shut down for Summer maintenance. See text for further details.
The second thing we need to do is to compile a forecast of new fields that are scheduled for development in the forecast period to 2012. Rembrandt Koppelaar kindly leant me his UK new fields data base and these fields along with their forecast production rates are shown in Figure 5.

Figure 5. UK new oil fields due to come on stream between 2007 and 2012. There will no doubt be a number of smaller fields developed that are not shown here, but these are unlikely to significantly influence future production which will be dominated by the larger field developments.
The production forecast (blue line in Figure 4) is then constructed by adding the forecast production (Figure 5) on top of the underlying decline (orange line in Figure 4).
Some key observations:
- This forecast produces a broad shoulder on the decline curve in 2007 / 8, somewhat analagous to the shoulder seen in 2001. The big new fields - Buzzard and Rosebank / Lochnagar, are large enough to arrest decline for a couple of years, but are not large enough to get production rising again. As we shall see next week, all other forecasts show production rising, significantly in some cases, in 2007 / 8.
- The peak production from these new fields will likely be reached in 2009 at just over 400,000 bpd. This is marginally lower than the 2000-2005 fields which peaked at around 500,000 bpd. Taking into account the fact that current production is now lower than in the past, it follows that the future new fields (400 kbpd) should have a similar affect on arresting decline as did the past new fields (500 kbpd).
- By 2012, production settles back onto the 7.6% decline curve - and at this point the Mearns 1 and 2 forecasts are the same.
It has to be noted that this forecast is dependent upon the timely delivery of new projects. The signs are, however, that rig and manpower shortgages may lead to delays. A recent press release on the Rosebank / Lochnager project sent to me by Rembrandt:
A shortage of rigs has delayed Chevron Corp's drilling plans for its potentially large UK deepwater Rosebank/Lochnager oilfield, a Chevron spokeswoman confirmed yesterday. Chevron had planned to drill appraisal wells at the field this year, but now intends to drill several wells starting in the first quarter next year. "We have suffered like everybody else and now have a drilling programme for the first quarter of next year."
Rig shortages have been a problem globally this year as producers ramp up exploration activity to meet rapidly growing oil demand growth. Drilling has been spurred on by record prices of crude oil, and rig costs have risen sharply.
For those interested in following forecasts, here are the numeric data for Mearns 2. This nominally includes crude+condensate+NGL. The start point is the 2005 average less 7.6%:
year bpd (1000s)
2006 1671
2007 1672
2008 1644
2009 1528
2010 1342
2011 1148
2012 1003
Note that the start point for Mearns 2 is bit higher than current 2006 production. The production figures to July are biased low by production being shutdown for summer maintenance and I am hoping that the 2006 average will rise as the year unfolds.
Impact of new fields on production
As already mentioned, all production models for the UK show production rising in the years ahead in anticipation of new production from the mighty Buzzard Field.
In Figure 6, the impact of new fields on production are shown for the years that they came on stream. In general terms, this shows that production from new fields is not that important in the year that production starts and this was particularly the case from 1975 to 1990. Most of the benefit from new fields came in subsequent years as production built towards plateau.
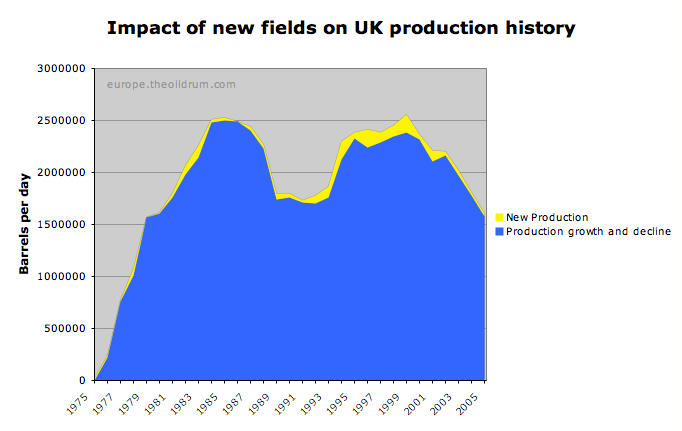
Figure 6. Production from new fields in the year that production started. During the 80's most of the benefit from new fields came in subsequent years as production built. A change in working practice during the 90's made the impact of new fields more immediate. See text for more details.
From the mid 1980s onwards there was a significant change in field development practice. Prior to that, oil production platforms would be installed, and the laborious process of drilling production wells, and hooking these onto the platform would begin. This meant that production the first year would be relatively low and production would build gradually to plateau over a number of years. From the mid 1980s onwards companies started to "pre-drill" production wells using semi-submersible or jack-up rigs on a routine basis, so that when the production platform was installed it was possible to attain higher production levels from a number of "pre-drilled wells" early in field life - a very important factor in field economics. Furthermore, there was a shift towards using floating production systems and sub-sea developments tied back to existing infrastructure and this led to the acceleration in new field developments seen in the second half of the 1990s (Figure 8). Figure 6 shows that the 1999 production peak was in fact an artefact of these working practices, with a large number of new fields, with pre-drilled wells coming onto production.
This is significant with respect to Hubbert bell curve systematics. If, for example we look at the UK Nelson Field, we see that it hit production plateau the same year it came on stream. And since then it has been a story of decline. The field development practice of maximising production early in field life not only led to the 1999 production peak, it will also have contributed to the more rapid than expected UK production decline. Fields like Elgin, Shearwater and Blake that came on stream just 5 years ago are not building towards a production plateau - they have already started to decline (Figure 2).

Figure 7. Production from the Nelson Field. Production reached plateau in the first year and began to decline after three years.
Finally, if we look at the number of producing offshore oil fields in the UK (Figure 8) we see that the number has risen steadily since 1975 but the rate of increase is slowing.
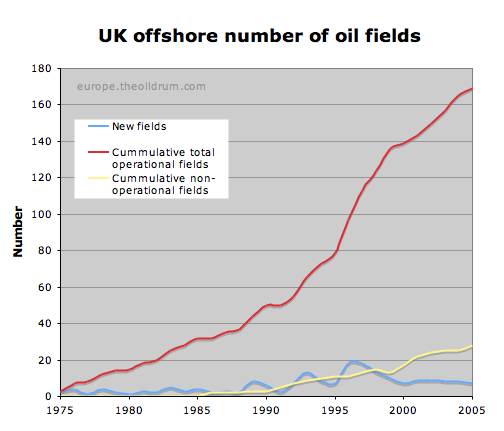
Figure 8. The number of operational UK offshore fields.
The numbers of new fields being developed peaked in 1996 / 97 at a rate of 18 new fields per year. Since then the number of new fields being developed has tailed off significantly (Figure 8) - despite high oil price - and all the while the number of non-producing and decommissioned fields are growing. In the UK North Sea, the industry is in a position of having to run flat out to sustain the decline rate at 7.6% per annum. Should the industry pause for breath, decline will accelerate.
Other production forecast models for the UK
The reason for looking into UK oil production in such detail is to try and provide a benchmark against which to compare the work of others. Much of the controversy surrounding the peak oil debate is centred on forecasts of what different people think is going to happen in the future. Very different views are expressed by professionals who are to a large extent looking at and analysing the same data set.
I am very aware, that what I have produced here as Mearns2 is a forecast that is subject to uncertainty and that it is open to debate. Whether or not my work presented here should be considered more or less valid than the work of others is up to my peers to decide.
The sands of time will of course be our judge. In 2 or 3 years time we will have a clearer picture about who made the right assumptions in compiling production forecasts for the North Sea and The World. That of course is 2 or 3 years less time for our political leaders to initiate meaningful programs to mitigate the consequences of peak oil.
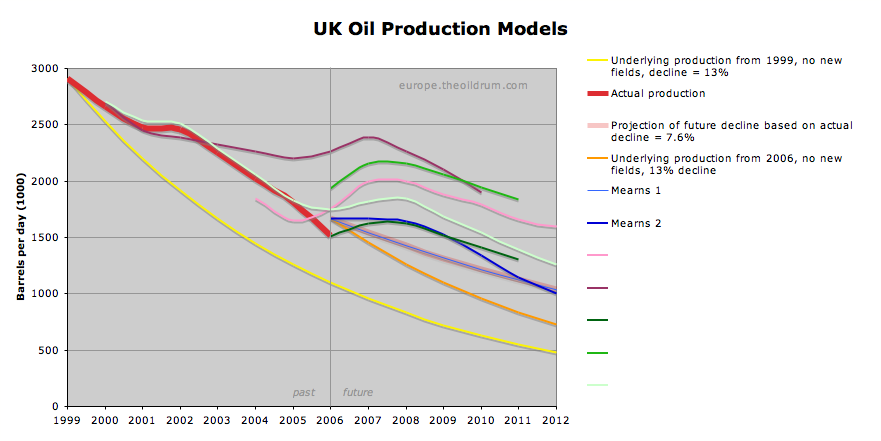
Figure 9. Future production models for the UK North Sea.
Note that on this compilation of production models, Mearns2 provides the lowest production outcome for 2011 / 12. Is this pessimism or is this realism? It is also worth noting that one model has 2.25 million barrels per day production for 2006, that is 700,000 barrels per day higher than actual production - is that realism? A full discussion of these production models will be the subject of my next post.
Euan MearnsTOD Europe Contributor and Geologist with 20+ years experience
Would posters please note that I would welcome comments about the validity of the data presented and my forecast. Please refrain at this stage from commenting on the other models (Figure 9) as these will be given detailed scrutiny next week.
The architecture of UK offshore oil production in relation to future production models
PDF version
51 comments
The architecture of UK offshore oil production in relation to future production models
PDF version
51 comments
Personnel
Editors
Contributors
Peak Oil Primers
Archives
- November 2010 (3)
- October 2010 (6)
- September 2010 (4)
- August 2010 (7)
- July 2010 (6)
- June 2010 (7)
- May 2010 (2)
- April 2010 (8)
- March 2010 (4)
- February 2010 (6)
- January 2010 (3)
- December 2009 (5)
- November 2009 (8)
- October 2009 (12)
- September 2009 (6)
- August 2009 (5)
- July 2009 (11)
- June 2009 (8)
- May 2009 (16)
- April 2009 (10)
- March 2009 (7)
- February 2009 (10)
- January 2009 (15)
- December 2008 (9)
- November 2008 (9)
- October 2008 (9)
- September 2008 (13)
- August 2008 (10)
- July 2008 (14)
- June 2008 (23)
- May 2008 (16)
- April 2008 (12)
- March 2008 (16)
- February 2008 (9)
- January 2008 (13)
- December 2007 (13)
- November 2007 (16)
- October 2007 (22)
- September 2007 (8)
- August 2007 (9)
- July 2007 (16)
- June 2007 (8)
- May 2007 (7)
- April 2007 (7)
- March 2007 (10)
- February 2007 (10)
- January 2007 (12)
- December 2006 (9)
- November 2006 (15)
- October 2006 (4)
- September 2006 (5)
- August 2006 (5)
- July 2006 (9)
- June 2006 (5)
- May 2006 (10)
- April 2006 (9)
- March 2006 (13)
Vital Trivia
License

This work is licensed under a Creative Commons Attribution-Share Alike 3.0 United States License.
I believe Piper Alpha was 1988. Other than this very minor quibble, an excellent posting. I had no idea UK was going to be producing so much new oil in the next few years. I can see why some commentators are saying UK NS oil production will increase, forgetting that the underlying decline rate is even bigger than the expected boost from new oil fields.
A great article Euan and many thanks for putting some flesh on the oil production bones.
http://oilrigwork.netfirms.com/Accidents.htm
It reminds me of a Skrebowski remark about the end of a war being fought by old men and young boys.
RE - logistic curve - can I send you my spread sheet for some curve plotting tuition?
The parameters of the loglets are the following:
Loglet 1 Loglet 2
URR 7.921 16.85
Dt 10.256 19.338
Peak Date 1984.4 1998.7
Details about the Loglet analysis here.
Consequently, the decline will be slow near the mid-point and will accelerate toward K when Q tends toward the URR.
2. If you have another dataset, I can give new estimates.
P.S.: have you received my last email from yesterday?
repost of my donation to the REDDIT tipjar:
---------------------------------
This is an excellent statistical analysis--no argument from me. The UK oil production 'cake' was baked a long time ago with the production of the major fields, the new production is nothing more than a very thin 'icing' on the rapidly deflating cake.
Read it and weep, boys & girls, then let's meet to discuss conservation and a paradigm change to our coming postPeak future. Or would you prefer to keep your head in the sands until the last moment, then finally popping your head up just in time to receive that exclusive 'razor-sharp swing' with Nature's Grim Reaper?
Please add comments so we can boost this posting to #1 on the REDDIT hit parade to spread this Peakoil message to as many as possible. Thxs.
Bob Shaw in Phx,Az Are Humans Smarter than Yeast?
I don't expect you to answer those questions, Euan, but I ask them as seed material for further discussion.
The UK produced an average of 1.65 mbpd in 2005. 1.5 mbpd so far in 2005. Based on the last few months and rcent decline rates, I'd guess 1.2-1.4 mbpd for 2007. Yet I see no lines in that range crossing 2007.
Also, your offshore stack graph shows about 1.2 mbpd for 2005. Does this mean .45 mbpd are onshore?
Tell me what you think. How much for 2007? I don't care about 2008.
The 2.25 mmbpd number on the final models chart is an optimists inflated view of reality that I will discuss in some detail later this week.
The giant Buzzard Field, due to start production any week now, with 8 pre-drilled development wells, will IMO arrest UK decline in 2007 - this new production will be sufficient to offset the underlying decline, therefore, 2007 production will be the same as 2006 - whatever that number turns out to be.
2006 production figures are still up for grabs - latest published monthly figure is for July, that is baised down by summer maintenance.
As for offshore stack - you need to look at Figure 3 and not Figure 1 (which excludes 48 new fields that came on since 2000). The onshore fields contributed 34,664 bpd in 2005.
My forecast for 2007 UK production (nominally crude+cond+NGL) is 1.67 mmbpd - as detailed in the table in the article.
Again, nice work. Talk to you soon. And lay off the red wine. I downloaded Cohen's Greatest Hits, BTW. I like it. Very Bob Dylanesque, if that's a word. I'm sure Cohen fans hate to hear that. Any particular albums you can recommend?
Cohen's 'Live Songs' is my favourite of his. I've lots of Dylan's live stuff, his 1966 is most interesting. Ever listened to Roy Harper? Or, more freaky, Van de Graaf Generator? Sandy Denny is my favourite female voice.
Explanation of Figure 9 later this week - another 3000 words I'm afraid.
And you had a typo!
More generally, your first graph is the truly scary one. A consistent 13% decline for existing fields over 6 years is hard to ignore, and may be likely to be mirrored in many other recent and expensive to develop and produce fields around the world. Cantarell will be interesting to watch over the next couple of years: will it be nearer the UK 13% decline or a more moderate, perhaps 8%, one?
Your comparison of others' UK forecasts in part 2 promises to be very interesting.
When people see a lower estimate they tend to see it as a <5% (2 standard deviations) probability, ie. most unlikely to happen and not worth political consideration. Oh dear! With the imminent US recession and likely decline of UK oil and gas revenues the UK economy will be looking at a hard economic landing before long. In a few years I think we will have wished we joined the Eurozone, that window might be fast closing. I have spoken about the 'climate change trojan' before:
http://theslide.blogspot.com/2006/05/peak-oil-8-climate-change-trojan.html
But, sadly, my guess is they haven't really understood... yet.
Yes, the GBP is in a very dangerous place just now. US$ will crater soon and we are forex-ly between them and the Euro. My guess is if we don't commit to the Euro within the next 18 months, maybe, we will have even harder times than otherwise, even if the current economic order persists (unlikely). The Euro would provide some insulation, Russia and China need Euroland, they both know the US is likely to soon become a basket case. China want to hold the 2008 olympics before they foreclose on the US$ but I think they may be getting twitchy on holding out that long. Twitchy chinese make me nervous.
What is most worrisome overall is the increasing validation of
double digit decline ratesafter Peaking. Yibal, Oman was double-digit, Pemex has publicly admitted to 14% for Cantarell in Campeche, Mexico [TODer Westexas suggests it might actually be much higher going forward], andGhawar will be xx%...???Yikes!!Will the postPeak global production 'tail' be long and thick, or very steep and short?
Bob Shaw in Phx,Az Are Humans Smarter than Yeast?
So you have no appreciation of metaphor or art and I wonder if you have any appreciation of energy issues?
if so, i agree, jerk off elsewhere
Hello fellow corrado driver, mine's a 1991 16v. Yep, a nice car, almost a rational Porsche, they stopped making them cos they cost more to make than they felt they could sell them for, a classic, show me a windy road and I will thrill or petrify you depending on your personal psychological profile. I've been lucky with mine, it has never failed on me in 12.5 years. Sadly I will soon replace it with a diesel van that is more appropriate for my coming nomadic life. That will be a tearful day.
The UK is also in competition for rigs with other areas where the returns may be perceived to be higher. Rig rates have also run up to $200,000 / day - so companies will think twice about drilling small prospects at such high costs.
UK production could be boosted with another 50 rigs - and the manpower to operate them, but that ain't going to happen for a number of years. It might happen with oil sustained over $150 / bbl.
At (say) 150 US / bbl, the market exists for discovering and developing fields, but at 150 US /bbl, would you not rather find a 1/2 billion field somewhere else? Perhaps where the entry costs are less? The downside is of course that the huge find may be sabotaged by unknown factors ranging from Nationalisation , war, terrorism, tax changes, weather etc.
Now that is not to say that the North Sea will not remain bouyant for the forseeable future, but when you have limited resources in men and equipment, then it makes sense (for an operator) to gamble those resources on a potentially big find elsewhere.
The North Sea - (at present at least) is blessed with a reasonably good infrastructure in a relatively small geographic area and reasonably well understood fiscal risk structure. Opportunities are small, but the corresponding risk is also small.
The North Sea Basin will have to compete for access to equipment and personnel like any other area until supply of kit and personnel balances out.
Our elephant in the room is the impending retirement of about 25 % of the workforce in the next 5 years.
I want to buy stocks in European renewable energy companies. Specially solar photovoltaic, and Spanish. ¿Any recommendations?
¡Thanks to all for all the great work!
Global CO2 emissions.
Globalisation.
Are we together on this?
OR
How can I make a profit?
Be patient - you can have their teeth and their watches.
You are sick.
¿What would I want their watches for?
8o)
Seriously, if it comes to that, then my money in the bank is as worthless as any stocks I buy.
Buying stocks is a way to lend money to the guys that are doing the right thing, and getting some of the profits, if any. I think that solar photovoltaic cells are both the right thing and highly profitable.
I have money in microcredit lending in Africa too. I put my money where my mouth is.
Your basic prediction, as I stand it is based on the assumption that production from existing wells will continue to decline at the historic rate of 13%. Looking through the DTI site I came across a chart that gives projected decommissioning of UKCS infrastructure.
It shows a rapidly growing number of installations to be decommissioned in the coming years. It only gives the number of installations and not he previous production volumes but it does seem to indicate that decline from existing fields might start to accelerate.
I suspect already that my Mearns2 forecast will prove to be too optimistic - but I at least will revise this down in future.
Euan