A Different Way to Perform the Hubbert Linearization
Posted by Sam Foucher on August 18, 2006 - 11:34am
A quick post about a different manipulation of the logistic differential equation. By using the first derivative, we get a new way to perform the Hubbert linearization. Some results are given on Norway and the US oil production.
[Updated by Khebab on 08/18/2006 at 02:36 PM EDT] After some thinking, I came up with a simple way to combine the two linearizations (see text below).
[Updated by Khebab on 08/18/2006 at 02:36 PM EDT] After some thinking, I came up with a simple way to combine the two linearizations (see text below).
The
logistic differential equation relates the production P
to the cumulative
production Q
as following:
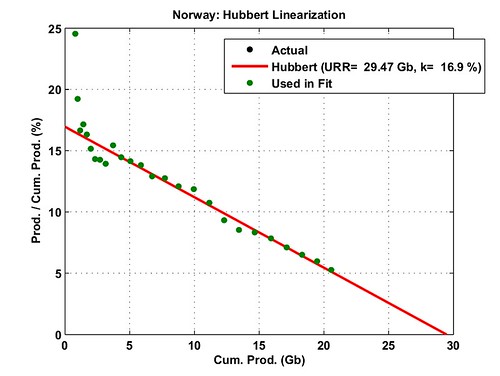

Fig. 1- Standard Hubbert linearization (top) and resulting logistic curve (bottom). The peak date is determined by matching cumulative productions for the last year. (data from BP 2006, all liquids excluding refining gains). Click To Enlarge.


Fig. 2- Hubbert linearization on the production annual increase (top) and resulting logistic curve (bottom). The peak date is determined by matching cumulative productions for the last year. (data from BP 2006, all liquids excluding refining gains). Click To Enlarge.

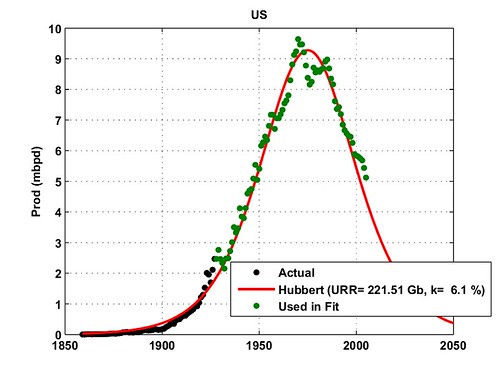
Fig. 3- Standard Hubbert linearization (top) and resulting logistic curve (bottom) for the US. The peak date is determined by matching cumulative productions for the last year. (data from the EIA, crude oil only). Click To Enlarge.


Fig. 4- Hubbert linearization on the production annual increase (top) and resulting logistic curve (bottom) for the US. The peak date is determined by matching cumulative productions for the last year. (data from the EIA, crude oil only). Click To Enlarge.
A few comments:


Fig. 5- Hybrid Hubbert linearization combining the production annual increase (blue points) and the standard P/Q representation (black points), the resulting logistic curve (bottom) for the US. The peak date is determined by matching cumulative productions for the last year. (data from the EIA, crude oil only). Click To Enlarge.
Other stories on TOD about the Hubbert Linearization here. The Datasets used in this post can be found here.
P=dQ/dt=KQ(1-Q/URR)
dP/dt=(dP/dQ)(dQ/dt)=(dP/dQ)P=K(1-2Q/URR)P
(dP/dt)/P=K(1-2Q/URR)
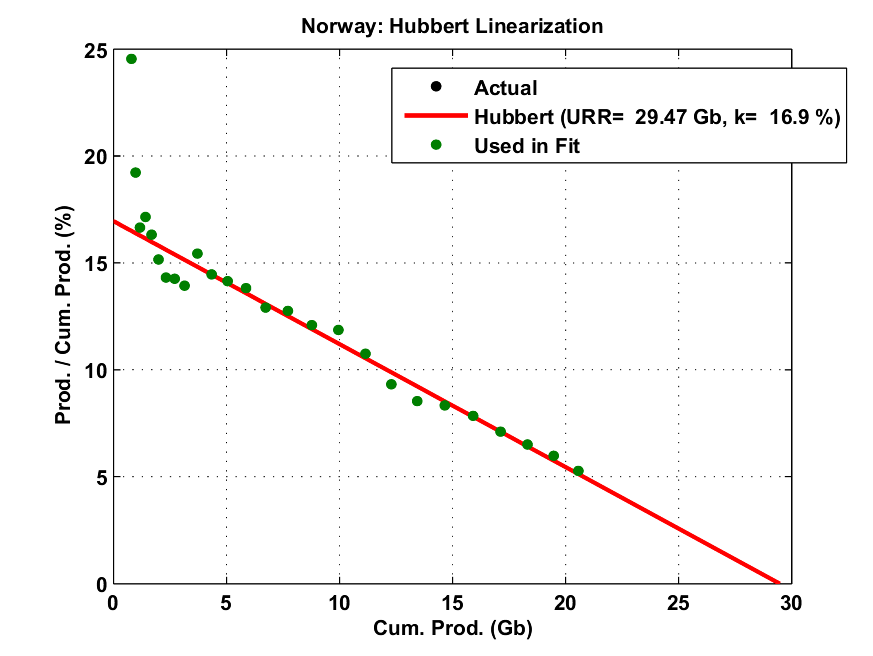
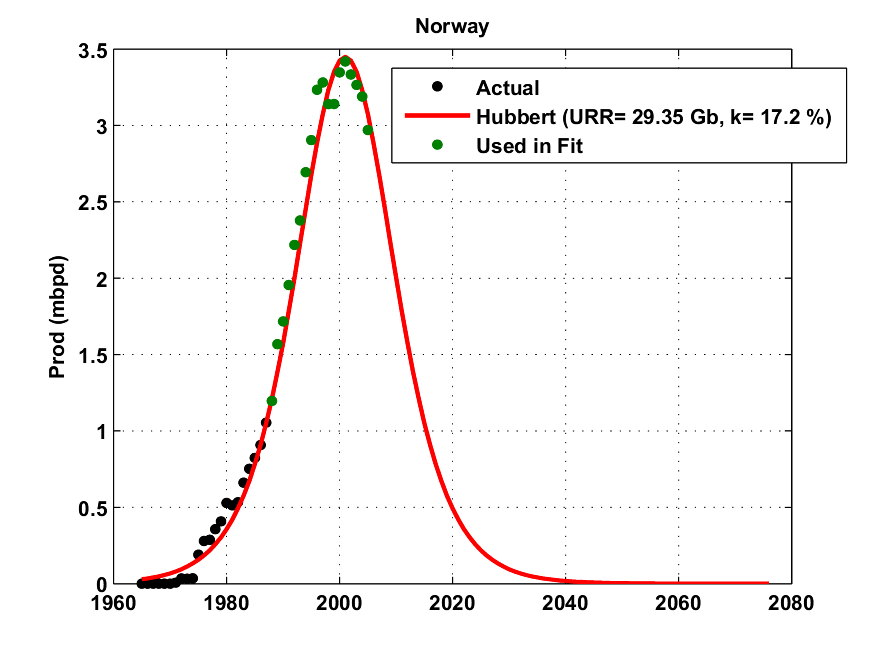
Fig. 1- Standard Hubbert linearization (top) and resulting logistic curve (bottom). The peak date is determined by matching cumulative productions for the last year. (data from BP 2006, all liquids excluding refining gains). Click To Enlarge.
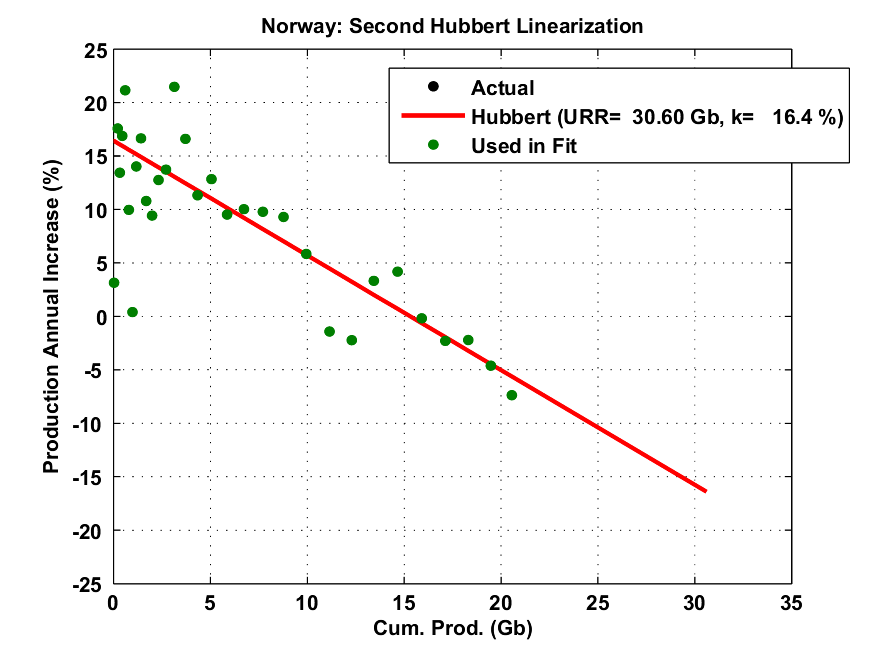
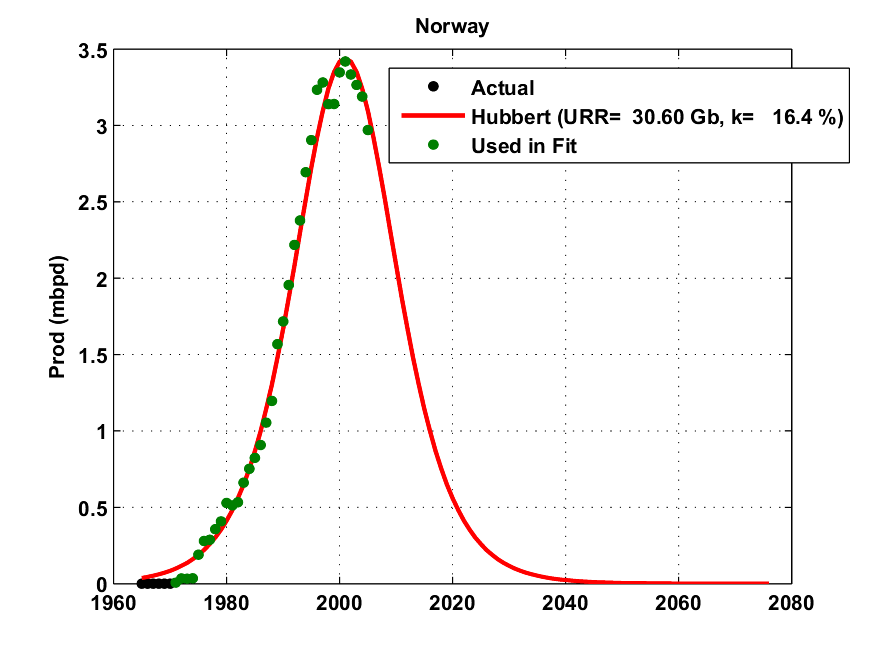
Fig. 2- Hubbert linearization on the production annual increase (top) and resulting logistic curve (bottom). The peak date is determined by matching cumulative productions for the last year. (data from BP 2006, all liquids excluding refining gains). Click To Enlarge.
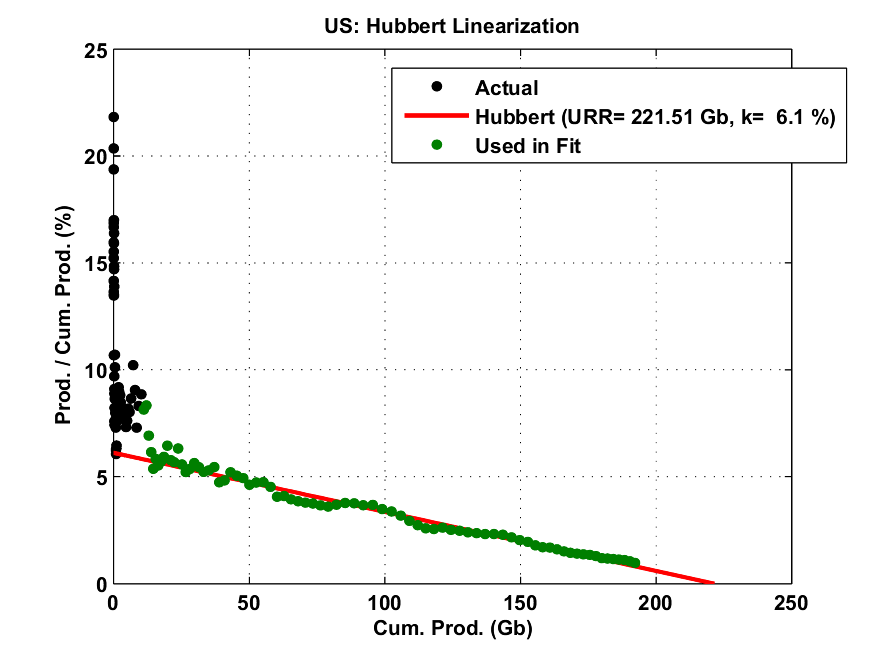
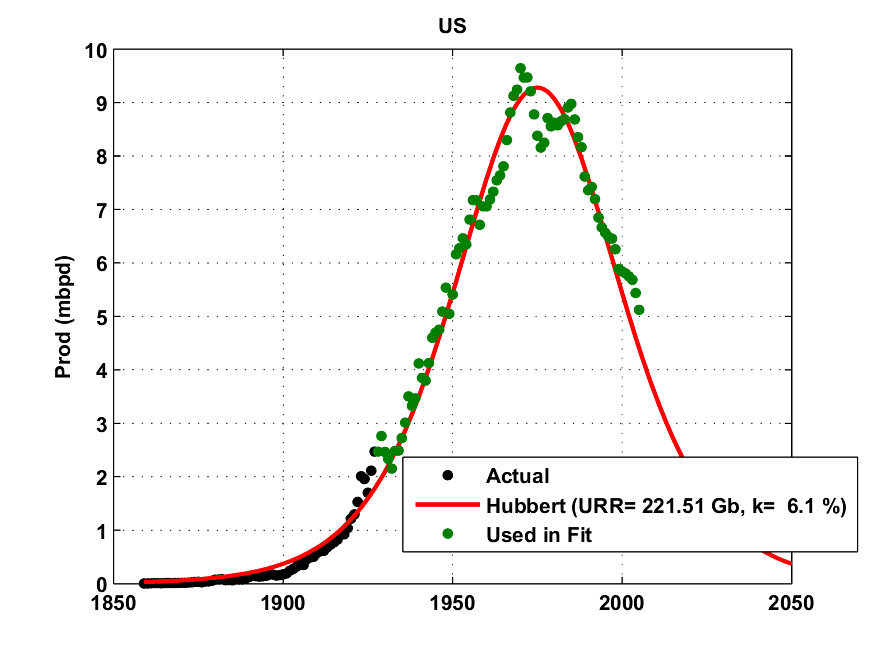
Fig. 3- Standard Hubbert linearization (top) and resulting logistic curve (bottom) for the US. The peak date is determined by matching cumulative productions for the last year. (data from the EIA, crude oil only). Click To Enlarge.

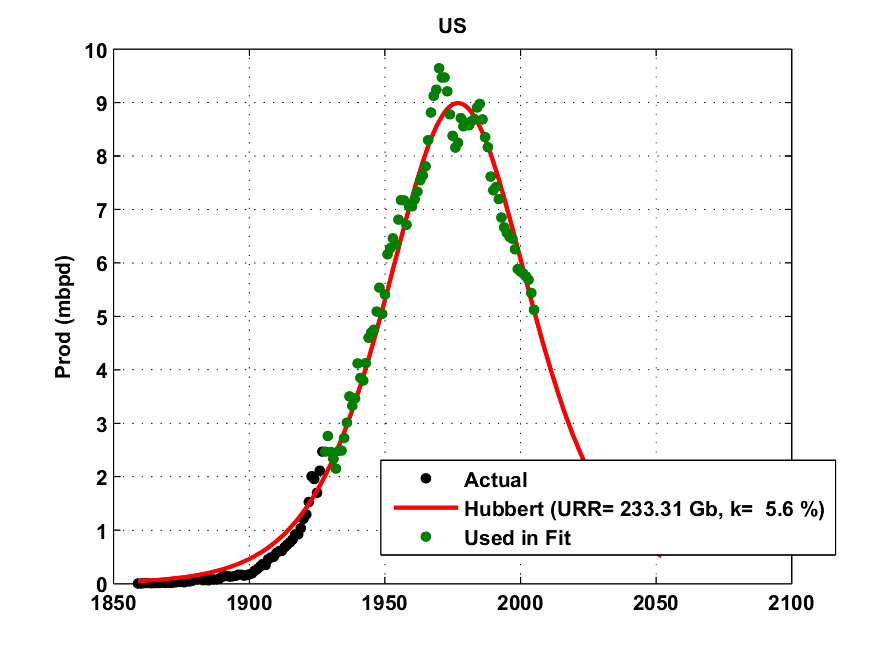
Fig. 4- Hubbert linearization on the production annual increase (top) and resulting logistic curve (bottom) for the US. The peak date is determined by matching cumulative productions for the last year. (data from the EIA, crude oil only). Click To Enlarge.
A few comments:
- this approach is much more sensitive to noise because of the use of the production first derivative and seems to give more reliable estimates for the URR than for K.
- the data representation is more symmetric compare to the standard HL approach which is very sensitive to noise for low cumulative production values (therefore, early production data points are generally excluded).
- the two HL techniques could be combined.
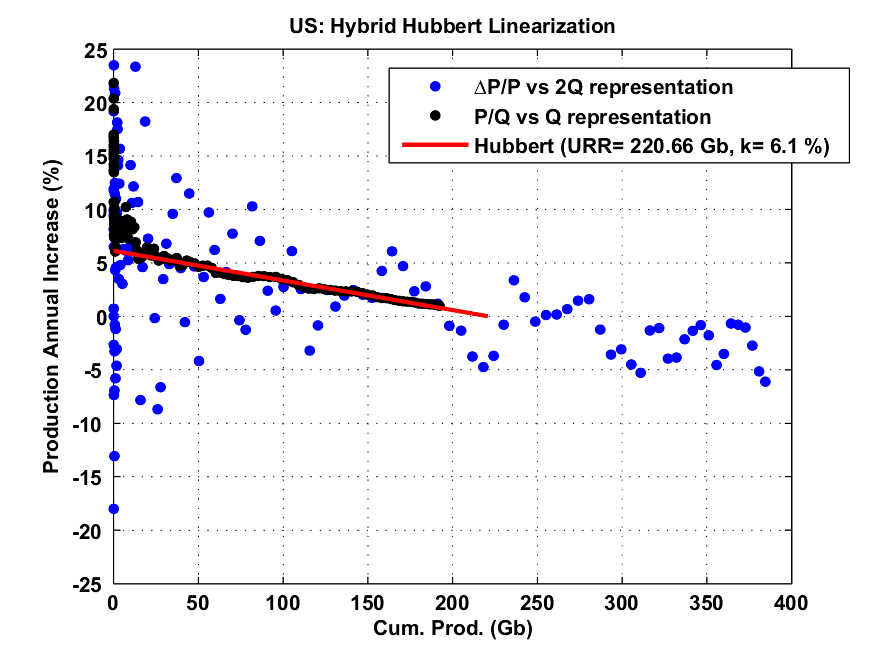
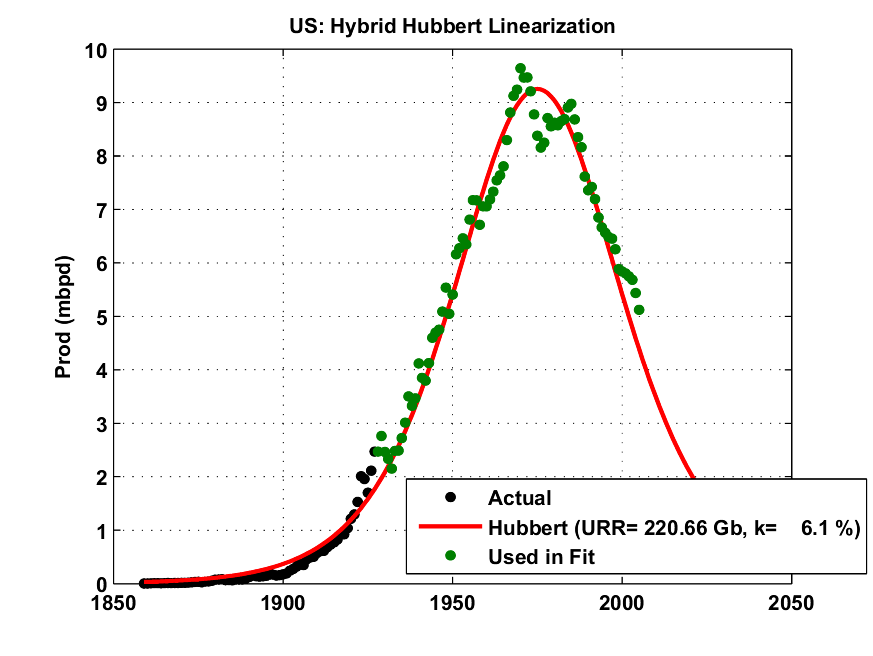
Fig. 5- Hybrid Hubbert linearization combining the production annual increase (blue points) and the standard P/Q representation (black points), the resulting logistic curve (bottom) for the US. The peak date is determined by matching cumulative productions for the last year. (data from the EIA, crude oil only). Click To Enlarge.
Other stories on TOD about the Hubbert Linearization here. The Datasets used in this post can be found here.
“We can't solve problems by using the same kind of thinking we used when we created them.”
—Albert Einstein
Contact
- Content: editors at theoildrum dot com
- Tech support: support at theoildrum dot com
License

This work is licensed under a Creative Commons Attribution-Share Alike 3.0 United States License.
P(2013)= 83.62 mbpd
P(2005)= 81.1 mbpd
Pumping the fear factor out of oil
As more production comes online over the next few years, prices may ease by as much as $20 a barrel.
http://money.cnn.com/2006/08/18/news/economy/oil_fear/index.htm
Peak Oil Passnotes: Supply 'Cushionitis'
By Edward Tapamor
18 Aug 2006 at 11:49 AM EDT
PARIS (ResourceInvestor.com) -- You have seen what Resource Investor was mooting about the oil market last week, basically come true. Oil has actually fallen a little faster than we expected - to around $71 - but it still has an important couple of barriers to break before it goes really wild to the downside. So let us take a little look at some recent history and see if we can figure out why.
On April 21st the Nymex WTI price reached $75.17 on the back of worries over Iran and general supply tightness. By June the Nymex WTI was at $69 before it set off on its latest run. In other words it had hit a strong high before falling back. It then surged back once more to hit $78.40 on July 14th before dropping off once again. Then we reached an odd moment a few days ago, on August 7th when some genuine myopic hysteria set in around the crude markets.
Brent crude had broken up past the WTI by August 7th as supplies of Brent became constrained by declines and increasing seasonal demand, pushing up past its historically higher-priced relative. The price was spurred by a number of reasons, not of which were crystal clear. One being the Israeli attack on Lebanon, others being the problems in Nigeria and the first signs of the difficulties for BP [NYSE:BP; LSE:BP] at Prudhoe Bay.
At the time we pointed out that although significant these events were underpinned by the - now seemingly age old - supply cushion absence. As there was no supply cushion the market had driven itself into hysteria. The Prudhoe Bay outage was not that significant although it was not helpful. Lebanon did not produce oil even though indirectly the invasion was about energy being a proxy war between the U.S. and Iran. Nigeria was going on the same as it has been in recent months.
Brent boomed up to an all time record of $78.64 intraday and $78.30 at the close with the WTI chipping in at a healthy $77.05 at the end of trading.
Now just 10 days or so later Nigeria actually seems to have got worse, armed men stormed a bar in Port Harcourt (who calls a bar Goodfellas in a place like that?) although the short-term outage at Nembe Creek of around 180,000 barrels per day has been restored. Meanwhile the Lebanon situation is still not really impacting oil and its supply. BP on the other hand has managed to keep somewhere around half of its Prudhoe Bay output online, even so you will note that is a loss of some 200,000 barrels per day. A loss is after all a loss.
Yet we are seeing the WTI hit exactly $70 intraday, some seven dollars off its high in around eight days active trading. Brent is around $72. A big, big move to the downside.
There is one other reason, Goldman Sachs. They are not excited about the new gasoline contract for - cough - reformulated gasoline blendstock for oxygenate blending or RBOB. New regulations in the U.S. have meant that RBOB is replacing methyl tertiary butyl ether (MTBE) in gasoline. Sachs are not about to risk a load of cash on this new contract so they have simply stopped playing.
The result of such a big player leaving the table is that there is no liquidity - or relatively little - in the gasoline market. This has pulled down the price of gasoline which has impacted on the price of crude. So the combination of events, Lebanon ceasefire, Prudhoe Bay, staying half-online, Nembe Creek being repaired and RBOB illiquidity have stuck a knife in the gut of the oil price. Then we hear stuff like this.
"Some of the factors and disruptions that helped drive us to very high levels have been resolved now," according to a statement by from Eoin O'Callaghan at the French bank BNP Paribas.
No they have not.
Lebanon is not resolved, Nigeria is not resolved, Prudhoe Bay and BP's general behaviour is not resolved, Iran is still awaiting the outcome of its nuclear enrichment programme and demand is still healthy. What has happened is the market has seen a great time to take a big chunk of profits. A breather. That is all.
If we were smart guys we would open a book on the first "Oil Makes Dramatic Surge" headline. No doubt you will see it in the next sixty days. We will be told all the stories about collapse, markets imploding, frenetic activity on the trading floor and `peak oil freaks' will be telling us to ride Oxen to work. Then we will do the same dance all over again. Isn't energy great?
Did we burst your dreamy life? Have you read just enough about it to be only scared? Do you really think that CNN is not selling ads to : car, insurance, housing, bank and oil company so they can stay "impartial"
They dont want to tell you the truth, you cant handle the truth, the economy and those company either.
Oil = finite ressource
No matter what you think.
Hubbert Linearization is technique developped in 1956 and used since then to calculate the production of whole region or country.
Oil at 20$ may be next door but in that case we will have suffer a very deep, profond and large depression.
Unless you dont have some math background, you cannot increase oil consumption very much because of exponential growth. I suggest that you take a look at this presentation by prof Albert Bartlett you will see what we mean.
Again, we are very sorry to have woke you.
You should have taken the blue pill.
ohhhhhh, it's the great CNN conspiracy that has allowed oil prices to fall...somebody thank thme for me....and the Bloomberg conspiracy I bet kept them from going to....where...$200, $150 a barrel this past summer as was predicted by so many of the catastrophephists....somebody REALLY thank them for me! (By the way, as much as I admire them, why don't you all have a field day of ridicule when Simmons or Pickens blows predictions at least as bad as Yergin does? Fair is fair....this year everybody blew it....)
Yes oil is a finite resource, but that frankly don't tell us shiit...(quick,name something on Earth that is not a finite resource except for hungry mouths of beasts to feed, including us....ain't that a paradox?), but just being finite does not tell us HOW MUCH is out there, now does it?
"... we are very sorry to have woke you." Cute and humorously snide, but don't worry about waking us....some of us are a helll of a lot more awake than you give us credit for....
(now I am just waiting for that great MSNBC conspiracy to kick in so the prices will really come down....how'd a thought that bringing prices down could have been this easy? :-)
Roger Conner known to you as ThatsItImout
-best
But that does not seem to be of concern at TOD, 99.98% of the posts are about, when THIS particular Peak Oil will happen, brainstorming about technical "solutions" by mostly technologically ILLITERATES, anecdotes and gossip about life in the US (not so bad, entertaining at least) and endless haggling by Peak Deniers.
"Of course the only true problem is GROWTH in a finite environment!"
Maybe, but at the end of the day, that's biting off more than I can chew.
If I ruled by fiat, and everyone would obey my command to cease fornication (because after all, birth control pills require energy to make!), then maybe growth would cease.....but since I don't and everyone won't, it's a bit of a moot point, isn't it? Growth, like change, has probably been going on too damm long....but nobody knows how to make either one stop.
You say, "99.98% of the posts are about, when THIS particular Peak Oil will happen, brainstorming about technical "solutions" by mostly technologically ILLITERATES. That's actually not a bad overview. I have learned a couple of things since I came here:
- Everybody's a damm physicist! I didn't know we had so may physics genuises in the country, until every other post I read ended every debate about all the things that could not be done (half of them already being done somewhere) with the flat and knowing assertion, "the physics proves it" or "it's in the physics"....that second one has the cool resigned detachment of the old Bruce Hornsby song..."That's just the way it is....some things will never change.....", and then he takes the counter point, "but don't you believe it..." I prefer to take the counterpoint.
- Despite the fact that no one knows exactly how much oil and gas there is, or exactly how to define it, everybody knows to the day when we are going to peak! Astounding that! Both the optimists and the pessimists have this in common! Even the Dan Yergin's, despite having no idea whatsoever how much gas and oil is actually out there, completely relient on other people's word, says, we have plenty for the next decade! While the pessimists like Deffeyes who says that HL (Hubbert Linearization) is holy writ, even though Hubbert Linearization is based entirely on known URR (Ultimate Recoverable Reserves) when confronted on lack of any real knowledge of world URR by anybody, he changes gears and says, "Well, it's production that counts, reserves mean nothing! You can't pull up to the pump and fill up you car with reserves!" What do the optimists and the pessimists have in common? Despite having no idea how much is there, and what exactly counts (crude oil, all liquids, which of course makes nat gas interchangable with crude oil....despite another poster on TOD who recently shut his ears "hear no evil" fashion, "I have heard too much about bottled gas, there seems to be bottled gas everywhere!"...yep, the world is a confusing place!
- Despite everyone, EVERYONE saying "peak is not "running out!", when they talk you can hear they all have a mental picture of running out, right to the last drop!
Someone says "perhaps we can build windmills", they reply, "that takes oil" as though there won't be a pint left! Someone says, "perhaps we can build electric cars", they reply "that will take oil to produce them and the batteries".....what, won't there even be a few gallon?" Medication? "Big dieoff is coming, medication takes oil." Now, exactly how many tons of the oil consumed in the world, exactly what percent of the total tonnage goes to production of medication? (I am leaving aside the fact that many medicines and chemicals are made with natural gas processing for the moment, I love it when people on here will scream about how oil is used to make fertilizer! Well, actually, it's natural gas....but back to the point....) You mean that if we reduce the waste burning of crude oil, there still won't be even enough for medicines that actually use it in their production?You mean if everyone drove a 2 cylinder tin box like a Citreon 2CV, we would still run clear out, and be as Deffeyes says, "Stone age by 2030", or thereabouts? Does "Peak Oil" really mean a Fred Flintstone world?
The view of the world is sometimes childlike....growth is the problem, tell them to stop! and they will.....Technology? Go home and tell you daddy technology is BAD! It is a BAD THING!! If he is trying to develop technology, he is a BAD MAN! Don't let him fool you, and say it's efficient, it is still technology, and will use energy, and we will be OUT, it's BAD! He is an evil DENIER! Life in the U.S., it is a BAD THING!! It must stop, many must die! Then some will go on and do the right thing....with no TECHNOLOGY, the BAD thing that messed up the world!!
As you say, not so bad, entertaining at least, or at least it would be if it were not so sad, and the problem is far too serous, too complex, too much in need of sophisticated acceptance of real ideas, real modern maturity.
We are not as much paying the price for wasted energy, we are paying the greater price, as we knew we someday would, for wasted talent, preperation, mental ability to design, to concieve of more than yes/no, and to think in terms of multiple, interlocking options and confluent ideas. We are frankly stumbling in the dark, blind but hoping to pass ourselves off as "seers" who will lead the "ILLITERATES", the "screaming monkeys" and the "sheepies" out of the dark. Such are the terms we use to win over our disciples. That alone should tell you volumes.
Roger Conner known to you as ThatsItImout
You may prefer starving to choking but both are an ugly death.
every other post I read ended every debate about all the things that could not be done
"every other", yes, but the OTHER half was all about the miraculous solutions.
Just as unsubstanciated, illiteracy comes both ways.
The view of the world is sometimes childlike
To the point, but nobody is compelled to share so much optimism.
growth is the problem, tell them to stop! and they will...
Of course not, this is my point, telling won't do :
- Enforcing, not politically correct and LOTS of trouble, struggle, strife, unanswerable messy arguments.
- Die-off...
Go home and tell you daddy technology is BAD! It is a BAD THING!!
Are you speaking to me?
I thought I cleared up this in our previous discussions.
to pass ourselves off as "seers" who will lead the "ILLITERATES"
TPTB have been doing a hell of a job leading the illiterates , too bad the looming difficulties are WELL BEYOND THEIR SKILLS, in spite of the high appraisal they have of their capabilities.
we are paying the greater price, as we knew we someday would, for wasted talent, preperation, mental ability to design, to concieve of more than yes/no,
A "price", yes, ignorance can be remedied AT A COST, stupidity cannot.
What is the ratio between these 2 impediments, and, hoping for the best, can we bear the cost?
Todd
As an aside, I will be giving 2 conferences september 23 in Metabetchouan (Lac Saint-Jean). One in the morning regarding peak oil and one in the afternoon regarding solutions.
I know it's gone a be a bit far from you, but I wanted to let you know.
The local newspaper is going to produce a series of articles also. I hope regional, then national will pick it up.
Anyway, it's gona be fun.
We know that the old method was 99% accurate (using only production data through 1970) in predicting post 1970 cumulative Lower 48 production, through 2004. How about if you did the same thing with the second method?
For the Lower 48 case history that I cited, Khebab just used the production data through 1970 to generate a predicted post-1970 production profile (using HL method #1). The cumulative post-1970 Lower 48 production was 99% of what the HL method predicted that it would be.
Since the world is now about where the Lower 48 was at in 1970, this has obvious implications for world oil production.
One of the problems with the conventional way of graphing the HL fit is that the y axis variable (P/Q) is a function of the X axis variable (Q). This is why the variability in the data appears to smooth out with increasing Q. This alternate way of graphing the data does not have this problem and so we see the variability seems much greater but uniform. That is actually a good thing if you are performing a least squares fit. I've never delved too deeply into how people are doing a hubbert linearization fit, but it is not strictly apropriate to use the least squares fit on the P/Q versus Q data.
So good work Khebab, this alternate graphical form of the logistics curve does show the actual variability inherent in the data and is thus a much more informative graphical representation of the hubbert logistics model.
The standard least-square fit assumes gaussian distributed residuals which is not the case for the HL (probably a more heavy tail distribution). I always use a robust fit technique based on robust statistics which is recommended in case of contaminated residuals by outliers.
I am struck by similarity of both equations:
(dQ/dt)/Q=K(1- Q/URR)
(dP/dt)/P=K(1-2Q/URR)
I understand all the details, but somehow I know that there is something deeper that escapes me. I'll think about it.
I have some questions/comments:
What do you use dP/dt=P(t)-P(t-1) or dP/dt=(P(t+1)-P(t-1))/2? (you favor the second one so I suppose that's the one, don't you?)
It is really nice to combine both methods in the same picture for comparison. But, what I would favor is to draw two lines, one for each method.
To combine all points of both methods and then draw only one line (your hybrid method) seems odd. I understand why you want to do this: you want to compensate the low sensitiveness of the tail of the first method with the noisy second method. But you put too much weight into the left side of the plot, where most of the points are. Anyway, its a very nice idea worth considering.
Well, I also wanted to tell you that I really like your plots: the text is of the right size, the legend is very clear and informative, the dots are just the right size. I mean, I really dig your plots. What program do you use? Do you have to fiddle a lot to make each one? Or is it quite automatic?
I love plots. I am a very visual person. I use Mathematica but I don't like the style it outputs and so I have to export the plot into wmf and then change font size, the labeling, etc with Flash or Power-Point. Very time consuming. At some point I have to customize the style of the plots Mathematica outputs into something I like. But it is not trivial.
Thats all for the moment.
This is first ever post, so forgive me if this question seems uninformed, or it's been asked here before. My question is that, since Michael Lynch has pointed out that URR is a variable factor (subject to technological extraction improvements), then even if we had solid data any curve fitting chart underestimates actual peak?
The Hubbert method has done equally well in other cases too. And as westexas fondly points out, the world is at 50% of possible production eevn as we sit here now. EOR has promised to increase recovery and thus reserves all along, yet it has not really done that. Beware what Michael Lynch has to say.
Since technological improvement is not something that is going to suddenly 'kick in' in the future, but rather has always been occurring, isn't there an effect for technological improvement already in the past data, causing the currently predicted URR result?
To the extent that curve-fitting techniques are meaningful, I think it is reasonable to suggest that they capture future technological advances by including the yield of past breakthroughs (and implicitly extrapolating those).
dQ/dt=kQ(1-Q)
As Q increases, the rate of extraction improves through technological and economic progress.
Of course one could also assume corrections:
dQ/dt = k(a+bQ+cQ^2)*(1-d*Q-e*Q^2)
etc..
and fit for a,c,c,d,e.
However the first order approximation kQ(1-Q) appears to work rather well for many Oil regions.
Not that there's anything wrong with that.
What does your question refer to?
I favor the second one.
There are probably many ways to combine the two representations. I'm not sure which one is the more convenient. I was just exploiting the fact that we are trying to estimate the same linear equation in both representations.
I use Matlab for the computations, I save the charts in eps format (encapsulated postscript), then I open the files with PaintShopPro (at 150 dpi resolution) and finally save them in a .png format.
I would like to streamline the process of making my plots look nice, otherwise I get lazy and just not do as many.
So, basically I am trying to learn some tricks from you.
Thanks
I this vision of a sweaty geeky Roberto hunched over his computer staring at the screen.
Graph porn!!!!!!
No offence R, I am sure that you are a studly mathmatican/astronaut/spy/explorer type, sort of like 007, Han Solo and Arnold rolled into one.
If you start with the original model (I use different letters to avoid confusion)
dy/dt = c y
with c a model parameter, not necessarely constant.
That would be an exponential model if c is constant, and decreasing if c < 0
Next thing to do, is to choose c. By tuning c, you can refine your model.
Simplest idea would be: c is linear in y: c = a + by
dy/dt = (a + by)y
with a, b constants. This gives you the logistics curve, if b is negative.
However, you can choose c whatever you want.
c = c(y)
or even
c = c(t,y)
This is what is happening to the prudhoe pipeline, for instance, but that's a bit far fetched.
For instance, you can choose
c = a e^(-bc)
with a, b constants. But there are many options.
First step would be to make a graph of c, then try to model c as a funtion of time and y.
Just my 2 c's
In the po discussion, people are very much focussed on the URR and the point where you have used up half. Because that's where the peak is.
That's all very nice, but this is the result from chosing the logistic model. There is no physical law that says so, it's a mathematical artifact.
From the hl pictures, it looks like a reasonable approximation, but I don't know if it is actually true. Some of this data is decades old and then the old technology argument comes up: what if the urr is dependent on technology (and thus on time)?
Well, just for arguments sake.
In a nutshell, the decline of the big fields trumps technology. In the US we have tried everything. The only production bump came from Prudhoe Bay, which has long been in terminal decline.
The North Sea and the Lower 48, based on the HL method, peaked at the same stage of depletion--29 years apart--so much for better technology.
The problem is fields like East Texas, which has a 99% water cut. East Texas is now where the top producing fields in the world are now headed. We have credible reports that all four of the largest producing fields in the world are now declining. Trying to reverse the decline, once the old large fields start downhill, is like trying to stop an avalanche by grabbing rocks and throwing them back uphill.
Accurately forecasting actual production levels is a problem, but the HL method was quite accurate in predicting cumulative production in the Lower 48 and Russia. Khebab used the production data through 1970 for the Lower 48 and through 1984 for Russia, to predict post-1970 and post-1984 cumulative production through 2004 for these two regions. Lower 48: 99% of HL; Russia was 95%. I think that Russia hit the 100% mark in 2005, and the EIA is now reporting declining Russian production (since December). You can see the obvious implications for the world.
This comment might seem strange at first, but consider the possibility that URR may decline in a post peak environment.
URR doesn't just mean the total amount of oil in the ground, it is the amount we can reasonably expect to extract. There may be many reserves which have already been booked which will turn out to not be extractable in the context of higher costs, significantly decreased demand (as a result of higher oil prices), and even increased geopolitical risk of operating in various provinces.
This argument can even be used in relation to technological innovation: The previous growth in URR has occurred to some degree based upon improvements in technology, however, in a post peak environment, it is possible that there will be less resources available to develop technology, so current reserve growth expectations might me overblown for this reason.
It's important to remember that while OOIP discovered logically must monotonically increase, this is not the case for URR discovered.
Marginal reserves booked today would at that point be questionable. Reserves that don't appear to be 'stranded' with today's cost structures (or projected cost structures) may later appear to be 'stranded' in the face of fundamental shifts in the cost structures of these businesses. Shortages of key resources (eg. steel), equipment (eg. rigs), and personal (with experience) may mean potential shifts in cost structure are more likely.
You may be right that est. URR will grow into the future. I think that's probably likely. I'm just suggesting that it is incorrect to exclude the possibilty that est. URR will shrink in a post peak environment. It's definitely possible. One of the many unknowns.
Both prerequisites can be argued pro and con. However, then you would use the Gauss curve, not the logistic curve. I'm not sure how well the data fits a bell curve. The logistic curve seems to fit pretty nicely.
That would indicate that something else is going on.
One thing we should do is analyse the lin fit, i.e. a stability analysis to see how predictable / stable this is.
Maybe you can explain (i.e. fit) the technology argument: to explain the CLT contradiction is maybe to fit in technology, i.e. fit also vs real GDP. See how much that explains.
- Fit the production curve vs a bell shape and GDP (take the log)
Actually, come to think of it, it would nicely explain the technology argument.
to yours ;-)
This is a bit off topic because I will talk about another way to look at a Hubbert curve. That is
through the cumulative vs production plot, which I like a lot. The Hubbert curve becomes a
parabola that passes through the origin. I then fit a parabola and estimate URR for US (with
Alaska).
In the next plot I see what happens to the URR when I take data from the beginning of production
till a certain year Y. When Y approaches 2005 then the predicted URR tends to settle down to the
figure found in the prior plot.
In this second plot it is very clear that when the dots cross the dashed line they tend to
stabilize to an expected URR, but not before that. Crossing the dashed line means that cumulative
production has passed half the expected URR at that moment.
In summary, it looks like the cumulative vs production plot is not good for predicting URR before
the peak year (and therefore predicting the peak year), but after you passed the dashed line it seems that you
have a pretty good approximation.
The data from 1857 till 1958 is from "API Facts and Figures Centennial edition 1959" (thanks to
Laherrere and Stuart). For 1959-1964 it is from "Twentieth Century Petroleum Statistics 2004" of
DeGolyer&MacNaughton. And for 1965-2005 it is from BP Statistical Review of World Energy
I have the corresponding plots for almost 50 countries. If you want any in particular just ask.
First US

Let's try Norway:
And finally Rumania:
Saudi and Mexico of course, but put that in a more recent thread.
Everybody will LOVE it.
It's interesting to see all the wild corrections in those 'expected' plots, tho' :-)
The original HL usually gives a very straight line (which is visually nice), but almost any strange production curve will give you a line. The perfect case is the FSU: it has a huge collapse of production after 1989 and this becomes a very little ditch in the original HL.
The original HL in my opinion is not so reliable. Or to put it in another way, it is important to have several methods to check. That's why Khebab's method is useful. Each one has its pros and cons.