Drumbeat: September 8, 2012
Posted by Leanan on September 8, 2012 - 11:21am
The Repricing of Oil: Traditional pricing dynamics no longer apply
If oil prices can’t fall that much because of the cost of marginal supply and overall flat global production, and if oil prices can’t rise that much because of restrained Western economies, what set of factors will take the oil price outside of its current envelope?Those who still don’t understand the past ten years cling to the antiquated view that prices will eventually return sustainably to levels of 2002 in due course. They believe that a great volume of new global oil production will start to appear and prices will be driven back to the cheap levels of last decade. Many who take this view also believe that market manipulation and inflation largely account for the high price of oil and that once reflationary programs like quantitative easing (QE) come to end, the price of oil will lose its speculative bid.
Oil Rises as Jobs Report Stokes Stimulus Speculation
Oil advanced for a third day as U.S. payrolls increased less than expected in August, raising speculation that the Federal Reserve will boost stimulus measures to spur economic growth.Prices gained 0.9 percent after the Labor Department reported the economy added 96,000 workers last month, less than the 130,000 median estimate in a Bloomberg survey of economists. The Federal Open Market Committee will meet Sept. 12-13 to discuss monetary policy.
Vehicle fuel economy up for the first time since March
(Phys.org)—Fuel economy of all new vehicles sold in the United States is up for the first time in five months, say researchers at the University of Michigan Transportation Research Institute.
The lengthening life of your ride
(Money Magazine) -- More and more, people are in a committed relationship -- with their wheels.The average age of cars and light trucks (SUVs included), says Experian, is now 11 years -- double the age in 1970. Driving this: higher quality and, lately, a poor economy.
Plus, as auto historian John Heitmann notes, buyer frenzy about new tech and dramatic model changes isn't at the car lot anymore; it's at the Apple Store.
Mexico's outgoing president calls for oil reform
(Reuters) - Mexico, the world's seventh-largest oil producer, needs to change its oil exploration laws to boost output by allowing foreign oil firms greater access, outgoing President Felipe Calderon said on Saturday.Mexico's oil industry is dominated by state monopoly Pemex and private companies have limited access to the market. The country faces a key test as production has fallen sharply in recent years and Pemex risks becoming a net importer of crude within a decade.
Gulf, Iran Say Oil Stock Release Talk Politically Motivated -Source
DUBAI--Gulf oil producers Friday joined Iran in dismissing any talk of U.S. oil stockpile release as politically motivated, not market driven, a rare display of agreement between both sides.New speculation emerged Thursday that the U.S. government may tap into its emergency oil stockpiles, after prices rose back above $110 a barrel in recent weeks.
What's to blame for lost coal jobs
The coal industry is indeed facing some tough times, and increased regulation is partly to blame. But its woes go beyond Obama's policies.The main culprit behind coal's current troubles is natural gas. Utility companies are increasingly ditching coal in favor of cheaper, cleaner natural gas, which has hit near record-low prices.
Official: Iran, Turkey agree to transfer Turkmen gas to Europe
Iran and Turkey have agreed to transfer natural gas from Turkmenistan to Europe, the National Iranian Gas Company's managing director Javad Owji stated.The Mehr news agency quoted Javad Owji as saying that tantamount to the volume of natural gas which is projected to be exported to Europe via Turkey, Turkmenistan will transit its gas via Iran to Turkey.
Russia, Japan back LNG; could delay export pipelines
VLADIVOSTOK, Russia (Reuters) - Russia and Japan signed an agreement on Saturday to develop plans for a $7 billion (4 billion pounds) liquefied natural gas plant on Russia's Pacific coast, potentially delaying gas export pipeline projects to neighbouring China and South Korea.
Russia and Japan Move Forward on Major Natural Gas Deal
Gazprom already sells natural gas to Japan, but another major deal would further reduce Russia’s reliance on Europe as its primary market.In a statement, Mr. Miller said that the Asia-Pacific market was “the most capacious in the world” and that within the next few years, sales by Gazprom to Asia would exceed its sales in Europe, where the company fills roughly a quarter of the continent’s demand.
Qatar wants to raise Shell stake to 7% - report
Qatar wants to become the biggest shareholder in Royal Dutch Shell by raising its stake to 7 percent to strengthen its ties with the oil company and further invest its wealth in western assets, a report said on Friday.
Nigerian airline collapses as industry struggles
The collapse and the mass firing of about 800 workers at Air Nigeria comes as only four domestic airlines are currently flying in Nigeria, down from nine flying at the start of this year. The dramatic decrease highlights the current turmoil of the nation's troubled aviation sector.
Deutsche Bank Faces Fine for U.S. Power-Market Manipulation
Deutsche Bank AG’s energy trading unit faces a $1.5 million fine and must give up $123,198 in profit for allegedly manipulating U.S. power markets, the Federal Energy Regulatory Commission said.
Enbridge 'doesn't want a spill,' executive says
The executive spearheading the Northern Gateway pipeline says Enbridge knows it needs to do more to convince the public the project is safe and that the company will clean up if a spill occurs.
EU study sparks regulation debate over ‘high-risk’ shale gas
Tough new regulations could be slapped on the shale gas industry if the EU acts upon legislative and environmental failings identified in its most comprehensive analysis yet of the sector, due to be released today [7 September].Shale gas drilling poses a ‘high risk’ to human health and the environment that is worse than that posed by other fossil fuels, according to a 300-page report prepared by the EU's environment directorate. It is also currently unregulated.
Test Drive: Electric Focus EV is appealing, but practical?
There's nothing wrong with electric cars that three times the driving range at half the price wouldn't cure.
Life Without Indian Point, Redux
The consequences of running the Indian Point nuclear reactors or shutting them down run from easy-to-spot to hard-to-calculate.Is a serious accident plausible? Would retiring the reactors open the way for alternative sources of electricity that pose a lower safety risk? Or simply ensure an economic blow?
More than 50 million Americans short of food
NEW YORK (CNNMoney) -- More than 50 million Americans couldn't afford to buy food at some point in 2011, according to federal data.Children in some 3.9 million households suffered from food insecurity last year, with their families unable to provide them with adequate, nutritious food at times.
US, Canada sign Great Lakes water quality pact
TRAVERSE CITY, Mich. (AP) — The U.S. and Canada have approved an updated version of a 40-year-old pact that commits both nations to protecting the Great Lakes.Environmental Protection Agency chief Lisa Jackson and Canadian Environment Minister Peter Kent signed the Great Lakes Water Quality Agreement on Friday in Washington, D.C.
At One With the Earth, and the Clients
The skeleton of the straw bale house has risen with remarkable speed. In little more than a week, we framed out the walls and almost finished the roof. Now there is no doubt that a house is coming into being, although at this point it is not obvious that it will be anything out of the ordinary. The trained eye will notice the lack of the evenly spaced studs that are normally needed to hang drywall, as well as the presence of a second set of wooden sill plates to support the inside edge of the 18-inch-thick straw bales.
As Coolant Is Phased Out, Smugglers Reap Large Profits
Under an international treaty, the gas, HCFC-22, has been phased out of new equipment in the industrialized world because it damages the earth’s ozone layer and contributes to global warming. There are strict limits on how much can be imported or sold in the United States by American manufacturers.But the gas is still produced in enormous volumes and sold cheaply in China, India and Mexico, among other places in the developing world, making it a profitable if unlikely commodity for international smugglers.
Obama Counterpunches on Climate Change
Mitt Romney, the Republican presidential nominee, took a not-too-subtle jab at President Obama in his convention speech last week, mocking Mr. Obama’s soaring 2008 campaign language about rolling back the rising seas and healing the planet. Mr. Romney’s gibe drew thunderous applause from the Republican delegates, many of whom express doubt about the existence of climate change.Mr. Obama jabbed back on Thursday night in his acceptance speech while detailing his energy program, which includes increased investment in renewable energy and higher mileage standards for vehicles.
New Zealand court rejects global warming challenge
New Zealand's High Court on Friday dismissed a challenge launched by climate change sceptics against a government research agency's finding that the temperature had risen in the past century.The court backed the science that led the National Institute of Water and Atmospheric Research (NIWA) to conclude that New Zealand's climate warmed almost one degree Celsius (1.8 degrees Fahrenheit) between 1909 and 2009.
The driest season: Global drought causes major worries
In much of North America, July was the hottest month since such a record was first taken. Crop yields have fallen sharply; thousands of livestock have been lost.The Midwest has suffered its worst drought in 56 years, and the International Grains Council has cut its forecast for the U.S. maize harvest by 25 million tons.
Study: Hurricanes whip up faster in warming world
(LiveScience) Global warming may fuel stronger hurricanes whose winds whip up faster, new research suggests.Hurricanes and other tropical cyclones across the globe reach Category 3 wind speeds nearly nine hours earlier than they did 25 years ago, the study found. In the North Atlantic, the storms have shaved almost a day (20 hours) off their spin-up to Category 3, the researchers report. (Category 3 hurricanes have winds between 111 and 129 mph, or 178 and 208 kph.)
"Storms are intensifying at a much more rapid pace than they used to 25 years back," said climatologist Dev Niyogi, a professor at Purdue University in Indiana and senior author of the study.
Contact
- Content: editors at theoildrum dot com
- Tech support: support at theoildrum dot com
License

This work is licensed under a Creative Commons Attribution-Share Alike 3.0 United States License.
Strongest Cornucopian Argument I have heard
Bakken fracing is just the start of a trend to extract oil from source rocks rather than from traps. Expensive, yes, but *LOTS* of oil is still trapped in the source rocks.
I do not know enough geology to reject this argument out of hand. High darcy source rock ("loose" rock) will see most of it's oil migrate out. Fracing will do little good there.
But "tight" source rock (low darcy) ? Perhaps full of oil where little has migrated ?
Many source rocks, after letting the oil out to migrate, may have subsequently been cooked into NG & asphalt. But what % ?
Any comments from the rock lickers ?
Alan
Hydraulic fracturing was invented over 50 years ago and the Bakken Formation was found over 50 years ago. What is allowing it to be developed now is the high cost of oil. However, it is a very costly play, with a per-barrel cost probably in the same range as Canadian oil sands, and an EROEI that is probably also in the same range as oil sands. It's something of a marginal exercise.
Americans get focused on the Bakken and assume that it represents some kind of global trend. That's not true - few other oil-producing countries have the free-enterprise economy and aggressive privately-owned oil companies that make development of the Bakken possible.
Mexico, for instance, has a similarly difficult oil field - Chicontepec, that it is relying on for its future oil, now that production from its supergiant Cantarell field has collapsed. The American oil companies now developing the Bakken would probably have similar success with Chicontepec, but the Mexican constitution forbids foreign oil companies operating in Mexico. PEMEX, the government-owned oil company, is having approximately zero success developing Chicontepec. Mexico will probably become a net oil importer in a few years.
And while the Bakken and similar developments in Texas are providing a useful increment of production to the US industry, pundits have failed to notice that production from Prudhoe Bay in Northern Alaska, the biggest oil field ever found in the US, is only producing 1/4 of the oil it did a couple decades ago. It is on a steady downhill slope to its ultimate demise - which may be only a few years in the future.
Production from the North Sea oil fields is in steep decline, and the big Gulf of Mexico fields that have provided much of US production in recent years are due to go into similarly steep decline soon, if they haven't already. The high costs of offshore production don't allow the kind of rapid and intensive development of marginal plays that onshore locations like North Dakota allow. Oil companies run offshore wells at their maximum flow rates for as long as the flow stays high, and then abandon the oil field when it drops. The economics don't tolerate low flow wells.
The cheap oil of the post-WWII era largely came from the Middle East, where most of the world's conventional oil is found. Once the huge Arab oil fields go into terminal decline, which they will sooner or later, world oil production will go into decline. Developing resources like the Bakken Formation and the Canadian oil sands will put a "fat tail" on the production decline curve, but they can never be developed fast enough to cause it to go up again after the slope becomes steep.
The Cornucopeans need to clean their glasses and take a closer look at the big picture. Sure, they will always be able to buy all the oil they can afford, but at future prices that may not be very much oil.
I agree with the gist of your post but I would add a few things.
Even if the techniques are old, the mastering of them in recent years have been quite spectacular.
If we take Bakken as discussed above(and below, by me), then you have a situation where some of the oil companies don't even need to disassemble their oil rigs anymore since they've built them in a way so that they can be moved.
That in turn has meant that the process of drilling test wells have greatly quickened. We're talking a 200 % increase in the speed of test wells per day over just the last five years.
Another point, tangental but not directly related to Bakken, is the plateau of drilling costs for offshore oil.
In the past half-decade, the costs increased a lot, but the funny thing is that today the drilling costs for ultra-deep per barrel is not that much higher than more shallow offshore.
Of course, part of this is because the oil fields that are being drilled in ultra-offshore are so much bigger to justify the capital costs requires, so that pushes the costs down. So while the recovery rate hasn't increased that much(the industry now hails 45 % as something to celebrate), the costs and the way the technology is used has indeed both improved and gone down in price.
Technology isn't a magic fix, but it's likely to smoothen the slope downwards, not save the day.
I would also challenge this statement that RMG has made:
By success, do you mean gaining a quick buck and losing it in the long term?
Where is the real production flow rate analysis for the Bakken?
By "success" I mean actually being able to get oil out of the ground. That is one of the strengths of the American oil industry, to actually produce oil from difficult fields at a reasonable cost (i.e. comparable to OPEC).
By contrast, the Mexican oil industry (i.e. PEMEX) is unable to get much oil out of its Chicontepec field at all, never mind at a reasonable cost. This creates a huge problem for Mexico because its government depends on oil to provide a large portion of its revenues.
Mexico was turning into a classic Petro-State, with the government simultaneously subsidizing oil consumption and spending money freely on government services without increasing taxes, and now that is rapidly coming to an end. Mexico will likely become an oil importer in a few years. It's not going to be a fun time to be Mexican.
Bakken is not a success by previous measures. The oil production flow starts declining immediately for each well.
People ought to stand back and understand the significance of this observation. There is no plateau or maturation increase, and definitely nothing even close to resembling a classic Hubbert peak.
The scale of the Bakken extraction will look completely different than past expectations. As long as there is an exponential increase in new sites, the production will appear increasing. However, as soon as that levels off, the decline will immediately set in.
That's what the math analysis says: http://theoilconundrum.blogspot.com/2012/05/bakken-growth.html
Any "success" is that of a stop-gap measure. I have a leaky gas tank so I patch it with some duct tape. I call that a resounding success because I have temporarily fixed the problem. But in reality, I haven't.
So the USA uses better duct tape than Mexico. Whooo-hooo.
Is the Bakken play being subsidized? Since everyone and their dog has qualified energy independence as a national security issue, why not take it out of the military budget?
EIA data for Alaska + North Dakota (C+C):
1/12: 1.15 mbpd
6/12: 1.15 mbpd
As I have frequently pointed out, the Texas natural gas well model is a cautionary tale. A common data source, the RRC, shows steady year over year increases in annual Barnett Shale gas production, but total Texas natural gas well production started declining in 2009. In other words, increasing production from shale gas plays in Texas could not keep total Texas natural gas well production on a continuous upward slope.
And the EIA shows that total US crude oil production has been between 6.2 and 6.3 mbpd for February to June, 2012, inclusive.
Running harder to stay in the same place. Once upon a time not to far away alaska produced somewhere around 2 mbpd.
No, Bakken oil is not on par with Canadian oil sands, neither in cost of production nor in quality. The tight oil in the Bakken is ~40° API light, sweet crude, not ~10° API extra heavy bitumen, and the cost of production is significantly less than that of the oil sands as well.
Bakken Boom to Squeeze Oil Sands Margins
From the various sources I've come across over the last few years, I'd put break-even cost of production closer to $50-55/bbl in the Bakken, and the economics will improve considerably for producers as more transportation capacity comes online.
The higher price the sweet, light Bakken crude commands certainly helps the economics of it. There are a lot of refineries who can run Bakken crude with no modification, while they would require major upgrades to handle Alberta bitumen.
However, I'm following the Rune/Rockman dialog below, which seems to indicate the production of newer Bakken wells is poorer than older Bakken wells. If this is the start of a trend, it predicts a steep rise in the per-barrel costs of Bakken oil, which does not look good for the future.
The trouble with conventional oil is that companies are always on a tread mill which is running faster and faster. Eventually it runs too fast and they begin to fall off it. It's the old "Red Queen" effect.
In oil sands production, the treadmill is much steeper and has a high barrier to getting on, but it is running at constant speed, or even slowing down as technology improves. Companies have trouble getting on the treadmill, and struggle for a while initially, but once they have been on it for a while they find they are passing the companies on the conventional oil treadmill.
Suncor, which built the first oil sands plant in the 1960s is now the biggest oil company in Canada, while a lot of the conventional oil companies are gone. I used to work for a few of those companies which are gone now.
Rocky - Do you buy the rapid drop in initial 12 month cum that Rune's data is indicating? I trust Rune's data but I've never seen such a drastic drop in productivity in my career. It's over a rather short period so I wonder if it might be a statistical fluke. But it does cover 100's of wells so that doesn't seem very likely. If you had asked me how long I would expect to see a 25% drop I would have guessed 4 or 5 years...at least. I wonder if this is an indication of how relatively small the Bakken sweet spot may be. It would also imply that Bakken economics are becoming much more sensitive to even modest decreases in oil prices.
Hello ROCKMAN and RMG,
I decided to hang along a little longer on this thread.
I have no bias with regard to shale or oil sands. I am strictly (and has always been) a numbers guy, show me the numbers and I will form my own opinions. It is hard to argue against numbers.
I have pointed to the sources that data was compiled from and nothing is better than having a third party verify the numbers. I went to great lengths to make sure that the quality assurance system was diligent. Of course in a process involving huge amounts of data some bugs occur, these were few and due to missing character(s) on the well identifications.
I had no idea of what to expect (actually I was expecting growth in well productivity). The data was sorted in several manners and presented in several manners and they show an unquestionable decline in well productivity.
For wells starting to flow as from August 2011 and later (that presently has less than 12 months of reported production) there is no sign of the reversal of this trend.
For the studied wells in Sanish the decline in well productivity was around 40% over a year. Brigham’s wells (all of them which are spread over a huge area) showed a decline of around 10% in well productivity over a year.
Marathon’s wells show some gain in well productivity.
Overall the decline in well productivity was around 25% in one year.
So in light of this it becomes interesting to read that Marathon has decided to cut down on their activities in Bakken.
So did Occidental
There is a saying that goes like; “Do not listen to what he says. Look at what he is doing!”
Rune
Rockman, I really don't know. I didn't like the rapid run-up in production from the Bakken because it didn't look sustainable, and I don't like the fall off in well production because it might indicate they have already drilled all the "sweet spots" and might have nothing left except not-so-sweet spots.
Time will tell, but as you have no doubt experienced, some fields can go south in a very short period of time, if the geologists misunderstood the nature of them. (And by south, I don't mean to Texas).
I worked for a company that had a major gas field water out on them in six months. They spent hundreds of millions drilling wells, they turned them on, they produced huge amounts of gas - and then some of the wells started producing water. Six months later, all of the wells were producing 100% water. The geologists never did explain what went wrong. The company just abandoned the field, salvaged all the equipment, and walked away.
The Bakken won't be like that, but the geologists may have overestimated its potential. Initial flow rates are not always a good indicator of ultimate production.
Rocky/Rune - Thanks for hanging on to the thread. I don't know if folks are paying attention to us number crunchers but Rune's analysis may be the most important news we've seen about the Bakken since the start of the upswing in activity. Granted a lot of the future production rates some have offered are based upon ever increasing drilling. But the math used seems to always assume no change in productivity over time. And based upon that assumption they project continued robust drilling. Assumptions based upon assumptions...I'm sure we've all seen where that can lead sometimes.
I understand about field development turning sour quickly...we've all had that happen to us. Like my tale of my first 5 offshore "development" wells being dry holes. But these were individual conventional fields and not trends. OTOH the Bakken isn't a new trend despite all the hype in the last few years. Rocky knows it much better than me but looking at a map of the older vertical wells indicates that the sweet spot had been fairly well delineated by the time hz drilling kicked in. In an odd way the situation may be more analogous to the hz redevelopment of Ghawar Field: initially a nice bump up in well productivity but once done it's done. And the bump only last as long as the initial high rate wells last.
The announced slow up in Bakken drilling may be a combination of operators seeing the diminishing productivity and the recent softness in oil prices. This may have pushed us closer to economic limits much sooner than many would have projected. I'll wait a couple of months and update the initial 12 month cum vs. time stat for the Eagle Ford. I'm hearing the same "let's go slower" chatter from operators in this trend also. Maybe the ones with poorer acreage positions are beginning to see the economic limits on the horizon.
Small quibble here Alan. Very deep source rock, or even very deep reservoir rock will, if the temperature is hot enough for long enough, will cook everything into natural gas, but not asphalt. Asphalt is at the opposite end of the spectrum from methane. Methane is the shortest polymer and asphalt is the longest. Or more correctly "asphalts are the longest" because all asphalt polymers are not the same length, they vary.
Natural Asphalt Asphalt is found in nature wherever crude oil seeps from the ground. Many early roads used mined natural asphalt for pavement. Asphalt is the heaviest fraction of petroleum, left behind when the more volatile compounds evaporate.
Ron P.
My understanding is that prolonged heat & pressure will transform oil (say C12H26) into CH4 and long chain asphaltenes, many with double bonds.
If I am wrong, let me know.
Alan
asphaltenes are derived from kerogens at the same time oil is formed from kerogens.
They have large molecular masses - 500 - 1500 or more, so contain of dozens to a hundred or so carbon atoms,
mostly in rings,
with few/no linear structures except at the edges.
http://en.wikipedia.org/wiki/Asphaltene
some images:
http://tigger.uic.edu/~mansoori/Asphaltene.Molecule_html
http://unit.aist.go.jp/energy/afg/asphaltene/Chapter4str.htm
search "asphaltene structure" for more.
http://en.wikipedia.org/wiki/Kerogen
An alkane like you mention will not tend to form a ring under (mild) thermal cracking,
it would tend to form a shorter alkane and an alkene (double bond).
(and with water present, would tend to also form shorter alkanes + CO2).
Thermal formation of rings from alkanes requires catalysts,
or, high temperature (850 deg. C) and rapid processes:
http://en.wikipedia.org/wiki/Benzene#Steam_cracking
thence
http://en.wikipedia.org/wiki/Steam_cracking#Steam_cracking
I never realized those asphalt molecules were that big. They are hugue. Do they even float? They must be a solid lump in room temperature.
I've never experienced asphalt fresh out of the ground, but the stuff they sell in 50 LB blocks for roofing cleaves like glass when dropped.
Interesting science: Tar is a very slow liquid: http://www.geekosystem.com/watch-tar-drip/
Many of them in fact do NOT float - density upwards of 1.2 g/cc. (water is 1 g/cc)
And by themselves, they are solid at room temps.
This PDF from Schlumberger, (originally they're French - pronounce it "SHLUM ber JAY")
a large oil field services company, has pictures of clogs and isolated asphaltenes, and more info.
www.slb.com/~/media/Files/resources/oilfield_review/ors07/sum07/p22_43.pdf
Asphaltenes are often problematic in the oil business.
They can clog formations ("tar mats"), production strings, pipelines and refinery equipment.
Often it requires chemicals injected into a well or pipeline to avoid premature clogging.
As the light/sweet easy oil is used up, it becomes more expensive to deal with asphaltenes.
The molecules tend to be flat, like mini-sheets of graphite, so the central "island"s
tend to stick together due to the de-localized 4th valence electron. (Carbon has 4 valence electrons, so when in a hexagonal structure like polycyclic aromatic hydrocarbons, only 3 are in a conventional covalent bond, so the 4th is spread out above and below the bonding plane into a "pi" orbital. These will also have a weak attraction between planes and to other things, but strong enough to make a mess in a pipe - like on pg 41 of the above pdf.)
The Oilfield Review is an interesting technical journal Schlumberger publishes in English, Spanish, Russian and Chinese.
Not too technical, but lots of details for the curious.
http://www.slb.com/resources/publications/oilfield_review.aspx
http://www.slb.com/resources/publications/oilfield_review/en.aspx
Alan – First, let me kick the revisionist historians to the curb: “Bakken fracing is just the start of a trend to extract oil from source rocks rather than from traps.” We’ve been producing from source rocks for many decades. At one time the Austin Chalk play in Texas was the hottest play in the US even when it was being drilled vertically prior to horizontal drilling taking off in the trend. I went to my first seminar on this subject over 30 years ago. The shale plays are hot today for the same reason the AC got hot: a surge in the price of oil.
“Perhaps full of oil where little has migrated?” Very true. The very nature of the rock allows for a relatively low percentage to be expelled. But “full of oil” misses the mark a bit. The fractures in these shales may be full of oil some of which could be recovered. But it makes no difference if the rock matrix (the non-fracture component) is full of oil or not: it will never be recovered because the matrix permeability is too low. Some cornucopians like to toss out some analysis that notes that Shale X has Y% of organic matter per cubic yard of rock volume. This can lead to a calculation of a huge volume of hydrocarbons in place. They fail to mention that only a very small percentage of that material is recoverable.
“Many source rocks, after letting the oil out to migrate, may have subsequently been cooked into NG & asphalt. But what %?” I doubt anyone could come up with a defendable number other then saying “a lot”. But does it really matter? Whether 5% or 95% has been cooked off we have what we have today. As mentioned before the vast majority of hydrocarbons ever generated on the planet have leaked off the surface. The conditions and timing to generate hydrocarbon traps are actually rather rare.Which is exactly why we have the shales to chase today: very low oil mobility.
As long as oil prices stay high and the pubcos have no other option for increasing their reserve base, the old technology of horizontal drilling and frac’ng of the shales will continue. Unfortunately for the cornucopians these high rate wells decline to relatively insignificant levels in several years unlike the older conventional fields that comprise the majority of global production today. I remember one that showed up on TOD a while back bragging about a specific Eagle Ford that came on at 950 bopd. Unfortunately for him I had the data base and pointed out that very same well was doing 86 bopd just after 12 months of production.
And then there was wild speculation over URR per well since there hadn’t been a sufficient production history to nail it down. But as I said then: wait a couple of years and the fog will lift. I suspect you’ve seen the new estimates of fractured shale URR by the USGS (the former fair haired child that the cornucopians loved to quote). I doubt we’ll hear the cornucopians toss their new numbers out now.
And lastly, eventually every potential drill site in every known shale play will be drilled. The only hot play that stands out today IMHO in the Canadian tar sands. And they seem to be approaching their own PO. But a peak that might last a couple of decades…or more. Just one more reason to expect Canada to become the 51st state one day. Excluding Quebec, of course. We got enough Cajuns already to satisfy that slot.
FYI – Alan’s use of the term “rock licker” is not derogatory. While doing field work we use our little magnifying hand lens to look at the rocks. But this technique works much better when the rock is wet. Yes…we could use our canteens but after the first hundred times you get tired of pulling them out. Just easier to lick it and deal with potential diseases by pre-medicating with large doses of alcohol.
As previously discussed, a recent SPE paper put the median EUR from existing Eagle Ford wells at 160,000 BOE. If we subtract out natural gas, I suspect that the median crude oil EUR for Eagle Ford wells would be about 120,000 BO.
Hello,
I just posted the results from an in depth study of actual well data from the North Dakota Industrial Commission on my blog.
I am in the process of translating it into English (or perhaps it becomes Engwegian) intended for a near future post on TOD with the working title;“Is Shale Oil Production from Bakken headed for a Run with “The Red Queen”?
The posts are rich on illustrations/charts in English that presents the results, so I take it any TODer is able to get the picture.
Part 1
Part 2
Rune
Rune – Very interesting. If I’m reading your charts correctly the performance of the newer Bakken wells are falling below the earlier wells. Not a huge surprise since the sweet spots are usually drilled first and the less promising areas later. But I might have thought that an improvement via the learning curve as well as drilling longer laterals and doing more frac stages would have produced better (even if more expensive) results.
I especially liked Fig 5 that shows the cumulative curves. I use them all the time to give a quick and telling non-mathematical impression of where URR is heading. But we plot it on log-normal scales which really emphasize the diminishing return over time. We plot the vertical oil cum on a base 10 log scale (10 – 100 – 1,000 – etc) and time as linear. Give it a try some time: IMHO it’s a very handy way to eliminate arguments over URR.
ROCKMAN,
That is right the data shows that the performance of newer wells in Bakken are in general decline. This despite applying "state of the art" technologies and learning curves.
The law of diminishing returns at work, or "the lowest hanging fruit is picked first".
As you know it is hard to debate actual data!!!!
All the wells that was subject to the in depth study had a reported production history of 12 months or more.
Studying reported production data for newer wells started post August 2011 (in Bakken) there is so far not a sign of reversal of the trend in decline in well productivity, as expressed by total produced during the first 12 months.
Other have looked at the development of IP and found the same trend.
I also have the plots on log-normal scales, but opted for the format to make it "less" technical. It is always a challenge to find an adequate format to present studies, especially if you also have to consider an audience with poorer technical background.
And I agree on using the format you refer to present the story of URR or EUR.
Rune
Rune – I am a little surprised to see the Bakken slipping this early in the game. In conventional plays you often see a slight uptick before the decline kicks in and then usually quite a few years, if not decades, down the line. But, in general, the Bakken trend covers a relatively small area compared to some others. What’s particularly disturbing is the lower productivity with the higher capex per new well. I don’t have a good handle on those costs in the Bakken. But in the Eagle Ford any increased in average well performance has come at a high price. Originally wells had 4 or 5 frac stages. Now with the longer (and more expensive laterals) 20+ frac stages are not uncommon. I’ve seen numerous reports indicating that many frac job are costing more than the drilling the well. Original wells cost $4 – 6 million and now I’m hearing of costs exceeding $10 million at times.
I understand about not confusing folks with a log-normal plot but I would hope anyone with an interest to study such a plot would understand it. It’s not as though the data is being altered…can read the same values just as easy. What I find particularly useful is to plot some cornucopian’s expectation on the l-n plot of the actual data. It doesn’t prove his projection is incorrect but it emphasizes that there will have to be a very radical change in the system to even come close to his prediction. But even on your linear-linear plot it would seem rather clearIMHO
ROCKMAN and others interested,
One of the key charts to understand is the one below.
The chart above shows the development in the moving average reported production for the first 12 months (yellow circles connected by black line) for the 193 wells started between January 2010 and July 2011 being subject to in depth studies. Wells from August 2011 and later had as of June 2012 not 12 months of reported production.
All the wells in this study came from companies/areas with above specific production bbls/day/well in the Bakken area.
Then the 25 moving average, that is the moving average reported production for the first 12 months of production of the 25 most recent wells. This is done to speed up and smoothen the function.
The wells in the chart are by sequence in time, that is first well in Januray 2010, last one started July 2011.
I did not expect such an outcome from the study given the exceptional growth in shale oil extraction from Bakken. It was by studying individual wells a different picture emerged.
Without the observed decline in well productivity there would not have been a story.
So who are you to believe; those happy stories created for a purpose or your own lying eyes?
Rune
As a supplement to this information, one also needs to look at the trend of individual wells.
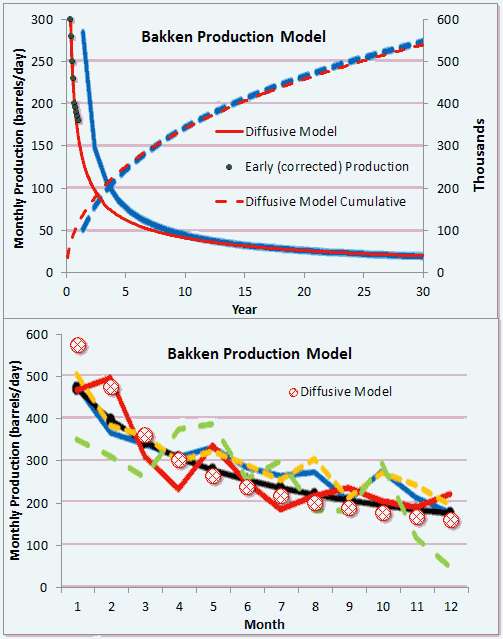

Two Bakken analysts, Mason and Brackett, have done independent analysis of the production rates.
From Mason's data, the flow of oil out of a hydraulically fractured well appears to be controlled by diffusional dynamics.
This is what an average Bakken well decline looks like if one uses Mason's charts.
The cumulative is the important part of the curve I believe because he plotted the instantaneous production incorrectly (which I tried to correct with the black dots).
But then if we look at Brackett's analysis of Bakken (see below), I can better fit the average well to a hyperbolic decline model. A hyperbolic decline is an ensemble average of exponential declines of different rates, assuming maximum entropy in the distribution in rates (this works to describe lots of physical phenomena).
That result conflicts with the diffusional model that better describes Mason's data.
Now I believe it's possible that Brackett simply took the 1/e decline point on each well and then tried to extrapolate that to an average production. That's the easy way out and is definitely wrong as this will always approximate a hyerbolic decline; of course I can check this if I can get access to the 3,694 samples that Brackett says goes into his analysis. Rune, do you have access to this data?
Mason and Brackett can't both be right, as there are sufficient differences between diffusional flow decline and hyperbolic decline to impact projections. The former is steeper at first but has a fatter tail, whereas the latter will definitely decline more in the long term. Brackett says the average well will generate 250,000 barrels of oil while Mason shows twice that and still increasing.
The analysis doesn't end here as there are lots more possibilities on what to look at -- unfortunately the actual data is so hard to get a hold of. Someone was saying that the state of North Dakota had at one time made all the information available, but now only provide roll-ups in the form of PDF files. That is not enough to infer the specifics and you can make the neophyte mistakes that Brackett has made, which may be a result of only using rolled-up data. Mason may have more information available, but unfortunately made mistakes of his own.
This is kind of frustrating that given what is at stake here, that we can't nail this bean-counting exercise down. It's really not that hard.
Hello WHT,
I downloaded the data from here. The data for the individual wells split by areas and companies are published in monthly pdf-files.
It is a time consuming effort to reformat them into spreadsheets that makes them more convenient to work with. Therein lays the tedious leg work.
I found it useful to establish purpose built templates for areas/companies as this also makes quality assurance easier.
When you have the templates (lots of consideration needs to be taken in their design) it becomes easy to transfer data from the pdf format to the spreadsheet.
If you have a flexible spreadsheet and for an advanced user thereof….you can arrange the data just as you wish and charting them becomes a child’s play.
Using actual data eliminates a lot of discussions and theorising………hard data are just that, hard data.
There may of course be revisions either way to the data, but I found that the revisions on an aggregate level are well below 1%. Using lots of representative wells should also help to get a representative picture of the developments.
Rune
People don't realize how grueling that work is. Rune had to take these unwieldy PDF files and extract the raw data, all the while trying to work around all the extra characters and line breaks that a PDF contains.
The ideal plan is to take each one of the reported locations and extract the monthly data. Either plot this as is or as a cumulative over time. For each curve, find the best fit, either as an exponential, hyperbolic, or dispersive/diffusive decline. My own findings suggest that these wells show a dispersive diffusive decline -- http://theoilconundrum.blogspot.com/2012/07/bakken-dispersive-diffusion-....
Once this is done, compare it against Mason's or Brackett's analysis, which is the only prior work that I am aware of.
I took a peak at some of your cumulative curves and they do indeed look more like Mason's, which I model as diffusional flow.
Is it possible that wells may fall into different groups represented by each of the models and that taking these as a whole can confuse matters? Perhaps different local geologies can affect this?
NAOM
Yes, it is grueling - more than anyone that has not done it can realize.
The set-up is crucial - but several mental checks need to be made at every step of the process.
Again and again and again ...
Best Hopes for Appreciation,
Alan
I downloaded the data from here.
Rune - thanks for the link. How does one determine the age of the well from those NDIC monthlies? I see well location, monthly oil, gas, etc, but not age?
Hello,
The hard way! ;-)
It is a grueling systematic task, so developing a suitable template is a "must" also to maintain quality assurance.
What I did was to use individual wells (like those listed in the most recent report) and then work my way backwards....then you will find that production increases as you move backwards in time..until the said well disappears from the production reports and maybe appears as confidential (in progress).
Note that production figures are monthly....so keep track of the days.
When that is done you will immediately be able to identify first month of reported production..... (and hopefully you will see the well disappear from earlier reports).... but as a safety measure check out a few of the previous reports....it helps if you have Acrobat (late printer version) and is familiar with its possibilities.
When you have a good template, good handle with Acrobat and good spreadsheet, good working routines it all works out....takes some time for preparing, but makes it a charm when extracting data.
When the data have been transferred to a flexible spreadsheet........it becomes easy to work the data.
I was surprised of the findings....the decline well productivity.
Rune
The chart is only 18 months. Is it long enough to establish a trend?
If I look at ND Monthly Bakken* Oil Production Statistics, the production per well has held up remarkably, despite a huge increase in the number of wells.
https://www.dmr.nd.gov/oilgas/stats/historicalbakkenoilstats.pdf
aardvark,
The study comprised of the production history of 446 wells of which 193 had a reported production of 12 months or more, and was reported to flow as of January 2010 or later. This to include effects from technological innovations. All wells were from areas/companies that had a history of specific production above the average for Bakken.
The chart you attached describes "The Red Queen" effect an accelerating number of wells are put into production without any effect on average specific well production as expressed by Bbls/day/well.
The observed trend is unquestionable.
So as you (aardvark) have just barely started to look into this issue I highly recommend that you move on to study the development of individual wells.
Rune
I'm not questioning your numbers. You have obviously gone into the matter deeply. I'm trying to clarify in my own mind what you're saying.
Basically, you're saying that
A) The seeming plateau of around 140 bopd per well in the Oil Production Statistics is an artifact created by the fact that there is currently a very high proportion of fresh young wells in the mix (the "Red Queen Effect").
B) The newest wells show a declining productivity compared with slightly older wells employing the same technology. This implies that the best areas have been drilled and lower-quality areas are now being exploited.
Someone who puts a lot of data into a diagram is Hans Rosling. If one had to use his software to create bubble charts I'm guessing you'd get something like this. (Using the full dataset of 193 wells would look something like my receding hairline.)
Another way to present the chart from EIA (in aardvark’s post) is what has been done below,
The chart above shows the development in the specific average production (Bbls/day/well) for all wells in Bakken, black line together with reported net added wells by month, blue columns.
The chart shows how an accelerating number of wells are needed to sustain the average specific production. It is this acceleration of added wells that both grows total production and sustains average specific production in Bakken now.
I studied the time series of a total of 446 wells of which 193 had reported production of 12 months or more and that was started as of January 2010 or later. I good qualification was found to look on total reported production for the first 12 months. As time goes and more data is made available 24 months, 36 months etc will be added.
Other studies has looked on IP or first month production and found exactly the same trends.
What the results from these studies suggest is that the “sweetest spots” has been drilled and increasingly well productivity should in general be expected to continue to decline. This follows the same pattern as with developments of other petroleum basins.
Yes, what you show could be an alternative way to present the results. Rosling has great presentation skills, amongst other skills.
Rune
Rune – Aardi is a clever guy but I suspect he, like many clever TODsters, underestimate how tricky Mother Earth can be. After 37 years she still screws with me from time to time. You understand very well what I’m about to describe…this is for others.
Today I had to check on 3 locations I’m about drill so had plenty of “highway thinkin’” time to work out an explanation. I had to drop out of the discussion this morning just as we started to beat on the time domain and statistics. First, the easiest aspect: changes in technology vs. time. This will be somewhat inflammatory to some but bear with me: there has been very little improvement in horizontal drilling and frac’ng tech in recent years. Some tweaking, of course. Yes: they’ve been increasing the length of Bakken hz wells. I’ve seen reports of 5,000’ to 8,000’ not being uncommon. New tech? Not hardly: Maersk has been drilling 30,000’+ laterals for years in the Persian Gulf. We were drilling 8,000’ laterals in Texas 20 years ago. Frac’ng? Again some modest changes but the general process has changed little for decades. Bigger fracs? No…just more frac stages. Over 30 years ago I did a 4 million gallon and 600,000 lb propant frac. Individual frac stages in the Bakken are much smaller today. The pump trucks and tubulars have changed little in several decades. The chemical components have changed some but more like flavor variations that significant differences.
What has changed over recent times is the length of the hz wells and not how they are drilled. And they were drilled longer to expose more reservoir which naturally required more frac stages to take advantage of the longer laterals. This does result in skewing the data WRT the time domain: newer wells should have better initial flow rates and better initial cumulative production (i.e. the first 12 months) IF ALL OTHER FACTORS REMAIN UNCHANGED. But if they did show improvements it wouldn’t necessarily be because of better tech or better understanding of the Bakken: an 8,000’ lateral should do better than a 3,000’ lateral IF ALL OTHER FACTORS REMAIN UNCHANGED.
Next time domain factor: geological understanding. When a virgin play first begins a learning curve has to be established. Every trend ever developed has sweet spots and sour spots; better geothermal history and poorer; oil windows and NG windows; tectonic histories that produces better and poorer quality reservoir conditions, etc, etc. So as drilling progresses results should improve for a while as the knowledge base expands. But the apparent decreasing productivity of Bakken wells might argue otherwise. But the Bakken isn’t a virgin play…it started producing over 50 years ago. I’ll switch to the Eagle Ford Shale to expand on that thought since I know it far better than the Bakken.
The EFS, like the Bakken, began producing from vert wells decades ago. I drilled, frac’d and produced an EFS well over 25 years ago. Not only produced wells but many more wells tested and abandoned because they proved to not be commercial. And beyond these wells literally thousands of other wells drilled thru the EFS testing deeper formations. A great many studies have been conducted on the EFS just evaluating its quality as a source rock. I doubt any “new” horizontal EFS wells have been drilled more than a few miles from older wells which penetrated the section. There are areas in the EFS where oil is the dominant production and others where NG dominates. And this knowledge was well known long before the first hz EFS well was drilled. In a similar fashion there were areas where older vert wells produced much better than in other areas. If companies knew there were areas where better vert wells that produced more oil were to be found wouldn’t it be logical for them to concentrate there first with their hz wells? And as those areas are leased up and exploited wouldn’t it seem likely for future drilling to move to the less productive areas?
And this may be exactly what Rune’s analysis of the Bakken may be showing. As hz drilling and frac’ng (along with higher oil prices, of course) proved up potential to make Bakken drilling more profitable would they have not started in the sweeter spots first? And as those were developed wouldn’t they then have to move to less productive areas. And wouldn’t they consider drilling longer laterals and more frac stages to make up for the less productivety?
And this is what I find so shocking in Rune’s chart showing the variation of the first 12 months cumulative production vs. time. Even with drilling more expensive wells with longer laterals and more frac stages the initial 12 month cum has dropped 25% in an incredibly short amount of time IMHO.
Let me continue with my long essay and give another example of productivity vs. time vs. tech improvements. The 3 wells I mentioned earlier are targeting oil productive Frio reservoirs on the Texas Gulf Coast at a depth of 5,000’. These are conventional reservoirs I’ll be drilling vertically. This same trend began its initial development in the late 1940’s. This shallow play alone has produced over 4.5 billion bo. The initial fields were on the order of 30 to 150 million bo each with 50 to 200 wells in each. The potential of my 3 wells was identified with state of the art 3d seismic. I really can’t give a sense of how much more advanced this tech is then the tech used to develop this pay initially. The difference is beyond the magnitude of the difference between the first PC and the tech most folks have in their cell phone today. And what about drilling tech? I’m poking holes with state of the art tech.
So with this greatly improved tech and high oil prices am I going after fields with tens of millions of bo and dozens of developments wells? Not hardly. My target reserve for each well is 30k to 50k bo of oil and, if successful, each well will be the only one drilled into its trap. So why am I using this vastly superior tech to drill such relatively small reserves in this truly prolific trend? Easy answer: it’s all that’s left to drill. All the best tech in the world isn’t going to create oil fields where they don’t exist. I wouldn’t even be drilling these 3 little wells if the seismic tech hadn’t gotten good enough to image their potential.
And this may be what Rune’s chart is indicating with what’s currently happening in the Bakken: even with the greater application of newer (and more expensive) tech the better days (on a per well basis and not total daily rate) of the Bakken may be behind us. But the time frame is still difficult for me to believe: the life cycle I just described for the Frio took several decades to manifest itself. But appears to be happening in the Bakken in just a few years. ASAP I’ll put together a similar chart for the EFS as Rune has done for the Bakken (initial 12 month cum vs. time frame) and see if there’s a similar down trend.
Wow, that's a lot of work! thanks. Looking forward to the English version. In the meantime I'll try to figure out the plots.
Thanks a lot for noticing!
It is/was a lot of work, luckily I had access to some very useful tools.
Rune
Rune, if you don't mind, I could translate the posts into English so that people can read them with a clearer prose than the choppy Google Translate mongrel versions.
And then I could send those translations to Leanan for a post if there is interest and consent on both sides.
He can handle the translation. He's said this will be an article. Rune is on staff here. He doesn't need me to post things for him.
Alright, sounds good.
I've read the posts and they're some of the best on Bakken I've come across so far.
Rune does great work. You can see his previous articles here.
Svamp and Leanan,
Both, thanks a lot for your offers and the publicity.
Using Google translate from Norwegian to English….makes it almost impossible to retain the content.
I am in the process of translating it into English, then I will have someone help improve the language then load it up for review by the editors (Art Bermann is one of them.....just mentioning) and if they find it worthy for posting they will allocate it a slot.
I hope this will be a Monday or Wednesday….hopefully about a week from now.
I am quite impressed with your diligent data mining :-)E
Best Hopes for Recognition of Your Efforts,
Alan
Thanks a lot for recognizing the amount of work and time such an effort requires.
Aloha Rune,
When one uses then GIS server on the North Dakota Oil and Gas site to look at the existing wells in the Bakken, it seems to my in-expert eye that many areas are already "saturated" with either horizontal or vertical wells. How long before they simply run out of real estate at current drilling rates?
W – Hopefully Rune can paint a better picture but I do know that the original straight holes in the Bakken established some distinction between better and poorer recovery areas. Naturally companies would concentrate in those better areas. I know it doesn’t sound very scientific but in such plays it often boils down to taking the leaseholds closest to the better old wells. The technical geologic term is closology . LOL. Seriously.
But I made this point before about the formerly very hot Austin Chalk unconventional play of many years ago. If you check out a map of the now fairly dead play you would see one hz AC well after another drilled as close to each other as the regs allowed. And the graveyard of now dead AC wells carries county after county. The play ended for the most part when nearly every possible location had been drilled. I can’t guess when but that same terminal day will happen for the Bakken, Eagle Ford, Deep Water GOM and Brazil as well as every other play being drilled today. The big difference between these plays and the older heritage fields is that those older fields are still producing a significant percentage of our current production. These new plays don’t have such legs. To maintain production anywhere close to current levels will require finding new plays and finding them quickly. The new hot plays will become the worn down old plays in the not too distant future IMHO.
Regarding "closology", a more sophisticated approach is "trendology". In other words, if good wells appear to line up in some sort of linear trend, one wants to buy leases and drill wells along that trend.
;-)
Geo – Na…trendology doesn’t narrow it down good enough for this career development geologist. Even closology fails sometimes. Remembering when I drilled my first GOM well for Mobil Oil it twinned an expendable hole that found a 150’ NG sand near its total depth. So set the platform and drilled to within 200’ of the original hole and, SOB, no dang gas sand. Not only did the very closology not work but I never saw the sand in any well in the field. And I meant the sand…neither productive nor wet. And drilling on a 5,000 acre based on the exploration dept’s mapping my first 5 wells off the platform were dry holes.
I’ve never seen a trend that didn’t contain numerous non commercial wells and dry holes. Exploration is a tough job. But so is explaining 5 dry holes drilling for “proven” reserves. LOL
Rock,
Like I always say, the earth is full of surprises. Sometimes good surprises .....sometimes not so good.
;-)
Rock, It seems that RMG's oil sands is the only long term oil play in North America.
The thing about oil sands wells is that they are highly predictable. You drill a SAGD horizontal well pair, and start injecting steam into the top well of the pair. After a few months the bottom well starts producing oil.
The production rate rises to about 600 bpd, stays there for about 4 years, and then falls off. When it falls off too much, you plug and abandon the pair. Total production might be 500,000 barrels out of the pair. Then you reclaim the surface equipment and install it at the next well pair. They are drilling up to 100 wells off a single gravel pad these days. It takes them about 12 days to drill each well pair.
Ultimately, though, the fact is that you can drill well pairs about 300 feet apart laterally and 3000 feet or more long, and you can do this over an area the size of Florida. You just keeping moving down the lease drilling wells, and then when you use up one pad, you move on to the next pad.
Once started, you can keep doing this for decade after decade after decade, so it gets to be something of an assembly-line process. The big issue is initially high capital costs. Once you get rolling and capital costs are amortized, it turns into a money making machine assuming oil prices stay high.
How about the energy required to run these things ? I understand it is from local natural gas right now, and that there has been some thoughts on nuclear, but how the natural gas reserves used can be characterized ?
Do some of these operations run from the extracted "crude" ?
The local natural gas supply is more than adequate in the short and medium term. Because Alberta gas production is now declining, the Alberta government is curtailing natural gas exports and diverting the gas to the oil sands, which it has the legal right to do. If there were a North American shortage of natural gas that might be a problem for the US, but with the current US surplus of shale gas, I doubt the US government even noticed.
Some of the operations use bitumen gasification to turn the heavy ends into fuel gas. Others burn coke (the carbon solids produced by the upgraders) for fuel. There are a variety of other alternatives, but with the current oversupply of cheap natural gas, nobody is bothering to use them.
There are also massive shale gas resources nearby in NE BC, and Alberta probably also has big shale gas deposits, but at this point in time nobody has evaluated them. Maybe they will if gas prices go up.
The glut of natural gas in the U.S. is probably temporary. If there is 200 billion barrels of URR of bitumen in Canada that is extracted at an average of 5 Mb/d, then 109 years will be needed to extract it. The global production of natural gas is likely to peak before even half of this time elapses sending the price up. The CIA World Factbook indicates Canada's proven natural gas reserves are 1.754 trillion cu m (1 January 2011 est.) and production was 152.3 billion cu m (2010 est.). Even if Canadian production decreases to its level of consumption, 82.48 billion cu m (2010 est.), the proven reserves will not last long. Canada will need a higher price to get at some of their presently uneconomic reserves probably within a decade.
I'm not too concerned about the CIA estimate of Canada's gas reserves because I know where there is a lot more gas that the CIA doesn't know about. The real question is, "How much will you pay for it?" because if the answer is high enough, I can point to the map and say, "Drill here." I'm not unique in that regard, there are a lot of people who are a lot better at it than me, which is why they do it for a living rather than personal amusement and are richer than me.
The reality is that these reserve estimates are just stakes in the sand to mark a limit, and the only reason they are there is that everyone needs a planning number to work with. The current estimated URR of the oil sands is about 170 billion barrels, but that is just an arbitrary marker that the government set, and everybody knows that there is at least twice that much oil there. But, an official stake is an official stake, and everyone will use the government number until the government decides to move the stake. When they do move the stake, everyone will nod their heads and say, "Yup, that's the amount of oil that is there now. Amazing how it suddenly doubled."
However, the oil sands region is one of the most energy proliferate regions on Earth, and there are energy resources of various different kinds all over the area. In order to run the steam generators for a SAGD project, they need energy of some sort, and they currently use natural gas because it is the cheapest and most convenient sort. If it became in short supply, they would use something else, and there are numerous different alternatives available.
The ultimate constraint is price. If the price is high enough, they can find the energy to produce the oil. What type of energy doesn't matter, only the price matters.
it turns into a money making machine assuming oil prices stay high
... and natural gas prices stay low.
Alan
Low natural gas prices certainly help. Some companies were experimenting with bitumen gasification as a way to provide fuel gas for the steam generators, but with the current oversupply of cheap natural gas, there's no point.
Joe – As Rocky describes the oil sands are rather unique. More like mining than exploration or even development drilling. I wonder how big Venezuela might be if it weren’t for the local politics. When Hugo is gone it might change radically…or not at all.
I would think the SAGD technique would work very well in the Orinoco oil sands, but with the current political climate in Venezuela nobody is likely to use it to develop them.
Venezuela can't attract the financial risk capital to build an expensive steam injection system like SAGD, and I doubt it can attract the technical experts who could make it work, either. In driving out private capital and firing all the country's heavy oil experts, Hugo has kind of burned all his bridges behind him.
I suspect that China would be willing to provide the risk capital and develop the expertise (which will take some time) or just hire the expertise directly.
How many ex-PVDSA employees would be willing to cash a CNOOC paycheck while living close to their parents, cousins, etc. ?
Alan
Well, if the $15 billion CNOOC takeover of Nexen proceeds to completion, it is likely that a lot of ex-PDVSA employees will be cashing CNOOC paychecks. However, I suspect their first priority will be to get Nexen's troubled Long Lake oil sands project running properly.
Going back to Venezuela? I don't know if either they or the Venezuelan government would be keen on that. The politics are problematic.
I just posted the results from an in depth study
Nice work.
A couple questions about your figure 10 in part 1 if you are inclined?
1. So the most of the wells started pre-2010 (black) are have past two years old now. They're peak output in 2010 was ~1100 bpd and ~two years later (June 2012) are above ~800 bpd? Am I reading that correctly?
2. Wells from 2010 (red) had early peak output of ~3000 bpd and wells from 2011 had peaks of ~5000 bpd. Is that due to more wells (3X and 5X?) or mproved production techniques?
F,
Re your questions,
1) The black area are wells that started to flow pre January 2010 and have various production life, that is more than 30 months. And yes you are reading the numbers right. The interesting thing about these wells are that they for a while improved production which could suggest some kind of stimulation.
2) During 2010 there was reported flow from an additional 15 wells.
During 2011 there was reported flow from an additional 15 wells.
As from January through June 2012 flow from 13 wells were added.
If you look at figure 05 in Part 1 you will see that this area (Reunion Bay) operated by Marathon has seen growth in specific production. And looking at well data these has shown some improvements in productivity.
If you look on figure 04 in Part 2 you will see that Marathon had some of the poorer wells of those studied.
So in light of this it becomes interesting to read that Marathon has decided to cut down on their activities in Bakken.
Normally it should be expected that oil companies are somewhat ahead with regard to results than what is presented in my study.
Rune
Is we is or is we ain't getting near Peak Oil "Point Of No Return"; time for serious work on Matt Simmon's "Plan B"?
Scrolling down 33 inputs here tells an objective observer we have to get going on the multitude of changes needed to keep on keeping on...
Alan is one of TOD contributors apparently train savvy,so we took the liberty of grabbing your coat tails. Here are some "Plan B" requisites to consider. TOD Webmeisters can think about a "Plan B" section for TOD? (that's job #1) Besides train therapy, we include a few other subjects-
Water for North American agriculture- see NAWAPA, a comprehensive civil engineering extravaganza, should be under way ASAP while diesel fuel for construction phase is still adequate. Aquifers recharged, hydroelectric generation enroute, and deliveries to Mexico included to offset yankee water grabs from watersheds trying to reach Mexico.
Education, exchange of information- Electronic information transfer is not the last word in an unstable era, suggesting continued maintenance of US Postal system, even re=opening of smaller offices on closure list. In 1838 the US Congress passed a "Post Road" Statute, putting all railroads into the category of "Post Roads" as stated in Article I Section 8 of the Constitution: Duties of Congress... This segues us to
Transport- Replace lost secondary and branch/feeder rail lines to assure "Societal & Commercial Cohesion" including mobility, distribution of victuals and necessities of life and Postal service points, letter & package movement.
Employment- After WWII, President Truman made deliberate shift from rail to highway based economic model, successfully tapping cheap oil from home and overseas sources to propel massive auto production, new suburbia, and mechanized agriculture. It shall be difficult to reverse suburbia to a level commensurate with energy units/capita projections TOD discusses. See Kunstler's "The Long Emergency". More than simply a transport subject, railroad mode scaled back to local orientation is an employment enhancer. Stepping rail back to a local service component will require more effort from railway executives than any particular technical hurdles... "Retail Railway" is a study along the line of local communities with energy and water supply and mobility not dependent on massive scale systems we now see deteriorating before our eyes. "ELECTRIC WATER" is a 2007 book (New Society Press" by Christopher C. Swan, a compendium of technology and applications to achieve employment in the Post Carbon era.
Aviation- It seems likely aviation faces transition to more expensive fares and fewer routes operated. Larger airframes with fewer scheduled flights, with most short hops showing very high seat costs. With Federal Executive Emergency Orders for motor fuel allocation, expect partnerships with airlines and new High Speed Rail lines where corridors are shared. SF/LA HSR invites a Southwest Airlines partnership, for example. Airborne derivatives like dirigibles/blimps are subject to climate change weather oscillations, and probably will experience high liability insurance overhead.
Herbert Hoover was our last Republican civil engineer president, Jimmy Carter our last Democratic president with engineering savvy. We need another one PDQ. Please, Oil Drum site governors, try reaching out to the political parties, including Tea Party offices. Social engineering will need to play second fiddle to crucially needed CIVIL engineering emphasis for the decades coming at us. Geopolitical realities in the Middle East (see George Grant's "The Blood Of The Moon") are about to spill over on the Peak Oil calculation...
I do not think NAWAPA is a good idea.
http://en.wikipedia.org/wiki/NAWAPA
http://www.polarisinstitute.org/turning_on_canadas_tap
http://aquadoc.typepad.com/waterwired/2008/01/kennedy-to-cana.html
Without a strict Zero Population Growth implementation, along with an entire societal paradigm shift regarding growth and consumption, NAWAPA would lead to even more severe overshoot and even more dire consequences down the road.
Regarding NAWAPA, shut down coal and nuclear powered electrical generators that use fresh water for cooling and replace them with wind and solar power sources. Constructing an aqueduct from Alaska to the Colorado River is another grandiose, expensive project to postpone what we really need to be doing.
Coolant water for coal, nuclear and gas-fired thermal plants doesn't go away, it just gets used as a thermal dump and then gets returned to the river or lake (or ocean in the case of coastally-sited plants as in the UK's nuclear fleet) so shutting them down won't make more water magically available in areas with limited resources.
Solar power plants, both PV and mirror-thermal require fresh water to wash the panels and mirrors to clean them and keep efficiency up and that water does go away as it evaporates on use. There are already concerns in some desert areas about depletion of local aquifers to keep existing solar plants operational and this is limiting further expansion plans for solar energy.
"Coolant water for coal, nuclear and gas-fired thermal plants doesn't go away,"
It does if they are closed loop, as in if they have cooling towers. One pound of water for every 1000 BTU of heat that has to be rejected.
And for the open-loop plants, warming the discharge water increases the evaporation rate from that plume too, though not as much.
Most hydrologists label river or pond cooling as nonconsumptive and cooling towers as consumptive. My take is that nuclear plants are less efficient thermally, not even using superheated steam in many cases, because the fuel cost is low relative to the increased maintenance cost of high temperatures. A cooling tower raises the efficiency by two or three percent from the typical <30%, a 10 percent increase in electrical production with no downside other than up front costs and ongoing water consumption.
Coal plants generate steam around 550C, nuclear plants around 300C. Thus coal plants can be designed to minimize water consumption as they are indifferent to the exit steam enthalpy.
http://www.brighthubengineering.com/power-plants/40814-differences-in-a-...
If I recall from several years ago the low thermal efficiency of nuclear plants has to do with the maximum operating temperature of the metallic fuel cladding, resulting in generator inlet temperatures of only 700 degrees F. The metal selected for fuel cladding had special characteristics that allowed it to maintain some strength in the high radiation field in combination with water. To get the same 1000 degree steam that a coal plant utilizes would put the metal out of its safe operating range.
The General Atomic gas cooled reactors of the '60s and '70s had no metal, only graphite, in the core and were thus able to generate outrageous temperatures, 1460 degree outlet gas temp as I recall, and steam temperatures over 1000F. Unfortunately they were not able to do much else very well and only two reactors were built, neither economically successful.
Talking about cooling water for thermal plants, and cleaning PV panels in water in the same discussion, as if they consume similar amounts of water isn't correct. The later only needs small amounts of water, whereas thermal plants consume much larger amounts of water. Water that is used and returned hotter, will cool in the pond or river largely via increased evaporation, so much is consumed. PV cleaning can be delayed, whereas thermal plants require the water at the same time they generate power, so in a water pinch, PV could keep producing even without cleaning water. In many locations panels don't need to be cleaned at all, i.e. you can wait for the rain to do it for you.
What rain? The best places for solar power plants are desert locations with 300+ days per year cloud-free, like Barstow in the Mojave desert where the SEGS complex is located.
http://en.wikipedia.org/wiki/Solar_Energy_Generating_Systems
The only local source for water to wash the mirrors is an aquifer which is being drained and not replenished quickly -- Barstow gets about 4 inches of rain a year. As for not washing the mirrors, that would cut down on the generating capacity of the plant which impacts the financial bottom line so the mirrors get washed weekly during the summer.
http://www.nrel.gov/csp/troughnet/images/photo_14952.jpg
On the other hand you posit that a river feeding heat exchangers for thermal fossil and nuclear power plants loses more water but it is a river with continuous restorative flow, not an underground reservoir with a very limited restorative capability and which has other demands on it. In the case of Barstow that includes Edwards Air Force base to the west, a major consumer of groundwell water.
Can the dust/dirt be removed by rotary brush made with an appropriately soft bristle material that would not scratch the PV glass cover sheet, or the reflective mirrors, as the case may be? Perhaps mated with use of high-pressure air?
There would be an opportunity for some manual labor...a few jobs for people who like to be outside and have some 'alone time'?
Perhaps if some water cleaning must be done, a nozzle/brush system could be used that recaptures most of the used water...something akin to a carpet shampoo machine?
To cap it off: I think that if there were large deposits of oil under the same deserts which required fracing to produce, the large quantities (much larger than required for the occasional solar system washing) of water would show up PDQ.
Dust itself can be highly abrasive. We get a lot of it here and trying to brush it off a surface causes scratches. As for compressed air systems, think sandblasting.
NAOM
Question. I live in Arizona, and a number of neighbors have solar panels on their roof. I must confess, I have never seen them using a hose to clean them. How often should they be hosed down, and how much energy generation is lost over time if they don't?
I have never seen any solar arrays on residences (or on the government building that have them) hosed down either. Maybe the occasional rains do the tick. Maybe people should be cleaning them.
Also: would hard water leave a residue/film on the glass, also cutting down isolation a tad?
Occasional spotty/light rains rains in desert climes can also leave dust-mud spots as well...as one can see on car windows.
Use Rain-X?
I'm just OCD enough about energy, to give mine the occasional wash. I do worry about hard water, which we have, so I try to minimize it as much as possible, and when I do, it is on a moist dewy morning so as to minimize the amount of hose water that evaporates -as opposed to running off. If there is any realistic hope for rain, I wait. The hundreds of other PV roofs around here, are probably not washed, which means potentially four or five months worth of dust accumulation, I'd bet loses are under ten percent.
While keeping PV panels clean certainly helps reap better production, it hasn't been a big deal for us. Rain keeps them pretty clean. I have a hose out back to wash off the occasional bird poop, pollen or dust, and I wash them with glass cleaner once or twice a year, but they have to get pretty dirty to affect production much. I haven't hosed off our panels in a few months and we got 22.5 kWH today out of 3400 watts of rated capacity; about 6.6 hours of full rated production. Cool, clear weather helps a lot.
That said, I've never been an install and forget sort of guy. I monitor production via meters and a laptop data logger, and know when production isn't what it should be. Living off grid gives one a feel for one's energy production. My two older arrays don't have bypass diodes so I can spot when a big leaf or pile of bird crap has shut down a string. Easy to spot; easy to correct. If I had a roof-top array I would want a way to hose panels down occasionally.
I imagine most folks worry more about keeping their car washed.
Google did some analysis on their own solar installation, you might find it interesting.
Here in Florida, during the spring pollen season, washing is a must as it is also the dry season.
Perhaps mated with use of high-pressure air?
My thought too. We tried high pressure air (just air, no brush) to clean the optics of sensors in the Mojave some years ago. We found that pressure air will remove 'stacked' dust as one would guess but never the last coat of dust/film in contact with the glass surface even with a high psi, and past a certain psi one begins to grind up the glass surface, or break it I suppose.
With a cleaner/machine that made contact with the surface I expect a large amount of the water could be recirculated.
I have one of those electric pressure washers, it uses very little water per square meter cleaned, probably less than a tenth of what you'd need with a hose. Its effective range is too short for it to be very effective on my panels (unless I climbed onto the roof), the hose stream has better range.
4" of rain, sounds like a potential for collecting rain water for use cleaning the panel. How about trapping moisture out of the air at night? Low water use cleaning systems and water recycling, cut the water use to start with. Many solutions.
NAOM
There are also dust repellant coatings that people are working on. Compressed air can also be used to blow off dust. PV is a work in progress. Where I live once a month light washing is about all I do, and that is only needed during the rainfree summer months, Barstow gets more summer precipitation than my location, although I get 13in per year. With some design consideration, the amount of water needed per KWhr can be greatly lessoned. I just don't think its been enough of an issue for it to have been given much thought.
My PV system competes with the Navajo Coal Generating Station which has a closed-cycle cooling system. Navajo Generating Station Water Intake Project Environmental Assessment, page 34, March 2005,(PDF warning):
28,000 acre-feet/year = 9.1 billion gallons/year = 34 Gl / year
That water comes from the lake and is discharged into the atmosphere as vapor to produce 2250 MW of electricity. It consumes about .46 (gallons of water)/kWh of electricity generated. Compare that to my PV array in which I have used less than a gallon of water over 20 years to wash them. Water that I add to my batteries overwhelms the cleaning water ranging between 1 gallon/year to 3 gallons/year (it depends on the age of the batteries). With my PV array generating ~900 kWh/year, my average water consumption is:
(2 gallons of water/year)/900 kWh/year = .0022 gallons / kWh
or 209 times less water than the Navajo Coal Generating Station.
Good info, and of course at your scale, you're hardly doing all the optimizing that a utility sized PV setup could apply if it really needed to be water-conscious.
There could very easily be a portable or built-on system with a sponge and squeegee that leaves very little water behind, recapturing drizzle at the downhill end of the panel that is taken through the array for a very reasonable, periodic wash.
Getting so detailed about the PV use of water seems to me one of those overblown issues that is probably barely even worth mentioning if we were to really look at the full costs of the Power Systems at the other side of the argument.
Somebody from Heritage was debating energy with a League of Conservation Voters guy on CSPAN yesterday, and was talking about the poorly installed Hot Water systems of the 80's, as if we still haven't figured out how to make them not leak AND get a decent payback..
It's enough to make you scream, since nobody poked him in the eye and asked if ANY of the other plumbed equipment in our lives has maybe also had some leakage issues here and there, where your selection of qualified Plumbers makes ALL the difference in its success. And just out of curiosity, how long did it take his Walk-in shower, his toilets or his Jacuzzi to get IT's full payback?
(Answer, NEVER. Almost nothing you have in your house offers you an actual energy payback for the money you've invested in it, and in fact, they usually require a constant input of MORE money in energy and materials to function at all. Renewable energy tools are almost the ONLY things you can buy that will do this.
Thanks for reminding me to check the leak in the toilet.
NAOM
Speaking of Bakken...
The numbers for Bakken are released with a few months of time lag.
The last time the EIA did an estimate was in the spring of 2012 where they put the production number just slightly north of 500,000 b/d.
The newest numbers, however, come from the North Dakota mineral department.
As always, the latest data is released with a few months of a time lag.
So, production for June 2012 is the latest we got and it's now 660,000 b/d and still increasing.
It's very possible that as I write this, Bakken production could be about to gently test the 700,000 b/d ceiling, if it hasn't already.
The question is, how much further?
The estimates I've seen from the ND mineral department lies between 800,000 and 1,000,000 b/d.
Although it should be said that those predictions are a bit dated. Nonetheless, from the reports I've looked at, I have a hard time seeing Bakken growing as wildly in the next two years as it has been for the last two.
Not least because this is the average production profile of a typical Bakken oil well:
The main challenge for the North Dakota oil men will probably shift more and more towards maintaining the production rate, rather than increase it even more, from here on out.
Not least because this is the average production profile of a typical Bakken oil well:
I do not think that's correct, or at least not verifiable, that the curve is "typical" production. The typical well being drilled in the Bakken today, hydraulically fractured, with long horizontals, with special sauce sand grain size to hold separation, did not exist before ~seven years ago in that area, and not in large numbers before four years ago. So the first 2-3 points in that graph come from one type of well, but the points after come from a very different type.
With regards to production, this O&G author suggests 1 mbpd is obtainable from the Bakken in four years w/ 1000 new wells per year. Two thousand wells per year would supposedly yield 1.5 mbpd. Last year 900 new wells went in.
http://www.ogj.com/articles/print/vol-110/issue-4/exploration-developmen...
K – That’s an excellent point I hope folks try understand. It’s very critical to understand how statistics can vary greatly over time. An easier analogy most can consider: the change in personal computer power over relatively short periods of time. It seems like every 12 months we make a noticeable improvement. Not only in power but the cost of the new technology doesn’t increase proportionally.
Older Bakken horizontal wells did not have the production potential of newer wells. As you point out newer wells are longer and have more frac stages. Additionally I think it’s safe to assume they have improved the frac quality itself. So a new horizontal well should have a much better production profile than an older well.
Which is why it’s so freaking important for folks to look at Rune’s chart above so closely. It shows the productivity of the Bakken wells in discrete time frames. If I’m reading the chart correctly the new better improved (and more expensive) Bakken horizontal wells are not producing like wells drilled some years ago: they are not as good as the older wells. For example Bakken wells drilling during the summer of 2010 recovered about 110,000 bo during their first 12 months of life. Wells drilled December 2011 produced 90,000 bo their first 12 months. And wells drilled during July 2011 produced closer to 80,000 bo their first 12 months.
So as knowledge of the trend increased and companies drilled longer, more heavily frac’d and much more expensive wells the quality of the production decreased. Above I said the potential of new wells is greater…not the actual production. The simple explanation IMHO is that the better areas of the trend have been drilled and now operators are moving into less productive areas. And even though they are drilling wells that should produce better results than the early wells they are actually producing poorer results.
And this the path that every trend in the history of the oil patch has followed: the better acreage is drilled first. And even as the technology improves the rocks don’t. We have to spend more money to produce less hydrocarbons. What shocks me a tad is to see how quickly it has shown up in the Bakken. About 30 years ago I was typically drilling 12,000’ wells to test potential conventional NG reservoirs that might cover 1,500 acres. In the last 3 years I‘ve been drilling 16,000’+ wells (that can cost 2X what a 12,000’ well costs) for potential NG reservoirs that cover 120 acres. But that transition happened over a 30 year period. The Bakken transition, if it continues to decline at the current rate, will be the most dramatic transition I’ve seen in my career.
Rock,
IIUC the quality of various prospects varies as a pyramid; few really high quality prospects, more good prospects, loads of OK prospects. eg its a geometric progression.
Now technology is difficult to tag, but until you reach the limits of physics and diminishing returns, it tends to get better more linearly at worse, possibly exponentially at best.
Thus, put those together and shouldn't the rate of improvement in technology catch up and pass the rate of decrease in field quality - at least for a constant production rate? You might run through Tier 1,2 & 3 prospects with declining yield numbers, but there are so many Tier 4 prospects that technology increases yield numbers before they are run through.
Gary – “…technology…it tends to get better more linearly at worse, possibly exponentially at best”. Often true and appears to be true in the case of the shale plays. “…shouldn't the rate of improvement in technology catch up and pass the rate of decrease in field quality - at least for a constant production rate”. But that will only be true if you continue to drill prospects of equal quality. If you look at Rune’s chart closely you’ll see that just the opposite is happening in Bakken. The wells are not getting better or even holding even…they are getting worse. And finally: “there are so many Tier 4 prospects that technology increases yield numbers before they are run through.” That implies one of two possible situations. First, after more than 50 years since the first Bakken well was drilled operators still don’t know where the better locations are to be drilled. If there are better parts of the trend to drill and they haven’t figured it out after half a century I doubt they ever will. Second, if they do understand where to drill the numbers would indicate that they’ve drilled up your better Tier 4 prospects and the future does not look good.
Again, let me know if I’m reading the chart wrong: after drilling the Bakken for 5 decades and utilizing the ever increasing technology you’ve described the results show the productivity of Bakken wells is decreasing. With more knowledge of the play and improved (and more expensive) technology recent Bakken wells are recovering 25% less oil during the first 12 months of production then they did just a short time ago. The very points you’ve brought up makes the situation even more telling IMHO.
I don't think I made myself at all clear, let me try again.
Suppose there were twice as many Tier 2 prospects as Tier 1, and twice as many 3 as 2 - etc.
And suppose Tier 1 prospects could yield 1000 barrels per day per unit of technology, Tier 2 800 barrels, Tier 3 600 barrels, Tier 4 400 barrels. Each Tier reduces in quality
Finally, assume each year you increased the technology level by 1.
In year 1 you drill all the Tier 1 prospect at 1000 barrels per day a shot.
In year 2 you drill half the Tier 2 prospects at 1600 bpdps (800 x 2).
In year 3 you drill the other half of the Tier 2 prospects at 2400 bpdps (800 x 3)
In year 4, Tier 3 at 600 x 4 = 2400 bpdps
In year 5, Tier 3 at 600 x 5 = 3000 bpdps
In year 6, Tier 3 at 600 x 6 = 3600 bpdps
In year 7, Tier 3 at 600 x 7 = 4200 bpdps
In year 8, Tier 4 at 400 x 8 = 3200 bpdps
In year 9, Tier 4 at 400 x 9 = 3600 bpdps
In year 10, Tier 4 at 400 x 10 = 4000 bpdps
In year 11, Tier 4 at 400 x 11 = 4400 bpdps
Hopefully you can see in this very simplified example, even as the quality of the prospects decreases, the longer and longer time you have on each tier gives longer for the technology to increase - meaning that by year 16 we are on 6400.
Now - exactly how this plays out in practice depends on exactly how you can improve the technology, where the limits are, diminishing returns, etc. - but if there are different 'power laws' defining the field quality and technology effectiveness (which there likely is), you shouldn't expect the result to be particularly well behaved. Production could go up, down, then up again.
I've been thinking about the fracking playing field, and I think I can see how quite a bit of scope for technological innovation - both reducing the drilling costs (a major factor in this red queen race) and improving the recovery (frack and forget isn't sensible). Together I think they could deliver expensive, but reliable, extraction - just two issues. First, the upfront development costs are high, and second, the stop at the end of field availability is sudden.
Sorry all. Responding to Falstaff above and not K. Tired eyes. I also hope Rune can respond to my post. I think I'm reading his chart correctly. But having the first 12 month production dropping around 25% in that short a period would be shocking enough if they hadn’t improved the way wells were being drilled. I keep thinking I’m reading the data wrong but it still looks the same to me.
With all due respect, Falstaff, your source is a single energy consultant who isn't even based in North Dakota.
My source is the North Dakota mineral department, the people who deal with all the oil companies, who have to handle all the actual data streaming in from all the oil companies.
https://www.dmr.nd.gov/oilgas/presentations/FargoEnergySummit2011-08-17.pdf
Page 10.
Since when does Falstaff use facts? Most people know debating him is like peeing in the wind. As an example:
flagstaff wrote a few days ago:
"Not yet. In Israel as of last month BP had opened 17 swap stations on their way to what they say will be 40. Originally BP had stated they would build 51 in Israel. And BP is loosing $200 million / year.
and are on their way to finish their second country - Denmark
No, as we discussed elsewhere, they are not. BP has built *one* station in Denmark and they are at least a year behind their publicly announced schedule."
Here are the published facts:
"It yesterday opened a battery switch station at Amsterdam Airport Schiphol to serve 10 Renault Fluence Zero Emissions taxis. In Israel, 20 stations are operating and the company aims to double that this year. It expects to use about 30 million euros of the EIB loan to open 13 more stations in Denmark this year after already running five to connect Copenhagen to Aarhus."
http://www.businessweek.com/news/2012-09-04/better-place-plans-to-fund-d...
So, that puts the count to 18 swapstations to be operational this year in Denmark and they even have one in Amsterdam! Also 20 running in Israel with 20 more to be completed this year! What is that count for just these two areas? At least 39! Yet, he is trying to tell us that it is all vaporware! That much hardware is not vaporware and that also explains the huge amount of money they are spending. Remember, initial infrastructure first, then the cars.
Flagstaff simply does not understand the fact that if you live in Israel you can buy a Better Place car and drive anywhere in the country... Right now! He doesn't understand that Better Place already said the infrastructure is complete to drive anywhere in the country. He thinks they have to have all stations up and running and everyone in the country driving one for the system to be considered functioning. That is impossible to do in such a short time frame. Completely unrealistic. It only took America 100 years to reach the gasoline and road infrastructure Americans enjoy today. Thus, Better Place must be a failure, in his eyes. He also doesn't understand that startup companies often spend tons of money in their early years. This is common for huge capital projects. This is common knowledge!
No, I won't debate him more on this. Why? I don't like to get pee on me.
Also 20 running in Israel with 20 more to be completed this year!
We'll see about this year, but the build fraction so far is about right. Yet before you said:
They have just completed the entire infrastructure in Israel
As for this and similar statements:
Yet, he is trying to tell us that it is all vaporware!
No, you will not me find me saying that no BP/Renault cars/charge points/swap stations exist. Please do not put words in my mouth. I do give credit to BP for trying something new, but nonetheless I (and others) see BP's particular business model and technology as flawed, and their CEO is prone to grandiose claims while depending on large government subsidies which I don't sanction from any company. I think battery swaps *can* work, in particular I think they can work well with fleets and especially taxi fleets in the right climate.
Well no doubt both the Oil and Gas author and the NDIC staff have detailed knowledge about oil production (and I don't).
But I've read both and I'm not sure what you are trying to say. The pg 10 chart you reference from NDIC reflects up to 2010 historical data, hence the long ago surpassed 2010 P90 they provided of 400K bpd.
Above you stated, "The estimates I've seen from the ND mineral department lies between 800,000 and 1,000,000 b/d." I can't find that estimate in the NDIC brief you linked, but either way the Oil and Gas article, which I just listed as an easy to reach reference, also predicts peak Bakken at 1 mbpd with X wells drilled, and then goes further to 1.5 mbpd IF X+Y wells are drilled. [Shrug]
Jobless Greeks Resolved to Work Clean Toilets in Sweden
If Sweden doesn't work out, he's going to try Shanghai next.
There's a relatively sizeable Greek diaspora in Sweden, a distant remnant of the 1960s labor immigration.
Although it does not make much noise, it's nonetheless a helping hand to a young, new Greek immigrant looking for a job, any job.
I've seen Spainards at the local stores here too.
The unemployment is officially elevated in Sweden(at 7.9%), but the unemployment for native-born Swedes ages 25-54 is below 4 %.
The unemployment is mainly due to low-skill immigration stuck on the dole(and contrary to myth most do not choose the dole, but a significant minority does).
There's an irony in the sense that the unemployment problem among some of our immigrant communities is now being 'fixed' by immigrants from Greece.
This has built up a little tension. Usually the nativist feelings are supposed to come from the natives(hence the word) but in this case it's established immigrant vs new immigrant...
In the last elections in 2012, the city of Landskrona had a very high percentage of voters voting for Sverigedemokraterna. Turns out a fraction of those voters were imigrants from the waves of the 60ies and 70ies who voted on the racist party to show their oposition to the latest wave of imigrants. Interesing how things play out.
I find it bizarre that, once they have been living in a country (in this case Canada) for a few years, immigrants will start to argue that the country should restrict immigration.
I have to ask them, "Are you telling me, now that you are established here, you want to lock the door behind you so that people just like you can't get in any more?" They don't like that. They don't like it when I laugh at them, either.
I don't know if you have had this experience, but when you are surrounded by immigrants, you start to feel like an immigrant yourself. When they ask me, "What country did you immigrate from?" I have to stop and think, and then say, "Well, this country, actually."
This phenomenon happens on all scales. I've lived in many northern New England small towns - beautiful, unspoiled, charming. Then it gets "discovered", people move in "from away", and next thing you know they're complaining about all the people moving in spoiling the town! I've seen this dynamic several times...
Yup. Happens everywhere. There are lots of people who moved to Alaska a couple of years ago, and think the door should be locked behind them. They are often the first ones to talk about how "real Alaskans" should do this or think that.
Not long ago, one of these relative newcomers was complaining about an article one our local news columnists (a rather liberal leaning young woman) had written. He started ranting about how she "should go back to California and leave Alaska to real Alaskans.." The guy really didn't like it when it was pointed out that the columnist is a third generation Alaskan, and one of our major streets was named after her grandfather who homesteaded what is now part of the city!
Everywhere and forever.
"..us natives, born right-wise to this fine land, or the foreign hordes defiling it."
http://www.youtube.com/watch?v=ADmX9eMEV9U
http://s193.photobucket.com/albums/z50/Sonny9213/?action=view¤t=Fi...
Colorado has seen tremendous population growth over the last 25 years. An interesting recent change in the law requires developers/cities to identify long-term water supplies for new households before they build. The law has started to bite and is being challenged in court. Assuming that it survives the courts, it will probably slow the population growth substantially. But I suspect all sorts of unanticipated consequences down the line.
The same situation is likely to occur repeatedly throughout the Southwest. Most of the Lower Colorado Basin has already outgrown the available water supplies.
It is quite logical. Established immigrants have a fear that if too many people are allowed to immigrate they will recreate the same conditions in their newly adopted country that they fled from years or decades ago. Of course it is a selfish sentiment but then we know that humans are selfish :-)
Perhaps the immigrants see the problem as I do- relentless arithmetic. Any country with open borders, no matter how careful it is with its own population numbers, will be overwhelmed by those fleeing impossibly over-reproducing countries elsewhere.
Is there any other solution than closed borders? I would be happy to hear of one- not, incidentally, involving mass murder.
Unless, of course, you consider closing borders mass murder, which it is- but once removed.
Yeah, well, the birth rates of the so-called 'third world' has been plummeting. Iran is a case in point, where the birth rate has gone dipped below 2.0 per woman.
Mexico's birth rates have also collapsed where they hover just above the replacement-rate birthrate.
A second point is that in Sweden at least, 2nd generation immigrants(from outside EU) have a lower birth rate than native-born Swedes. I read that the birth rate of hispanic women plunged post-recession in the States(and had been on a secular decline anyway as more and more hispanic women get an educated, while the men drop out).
So I think that this argument of the 'hordes of the third world are overwhelming us' is based on old data.
And besides, the phenomenom we're talking about involves not just people from other countries but indeed I've seen it happen within nations too where people of the same background, culture, religion etc get into conflicts as you have significant internal migration and people who have always lived in one part of the country get angry with the 'newcomers', and then those newcomers start to discriminate against the next wave etc.
It seems to pop up in all circumstances, under all conditions.
It's probably a leftover from our hunter-gatherer days when resources were very scarce and you had to constantly be ready to let people die so that you would live, even if those people were of the same tribe and to rationalize their death you'd have to tell yourself they were so different than you etc.
I mean just think about, people make up all sorts of reasons to exclude others. Most of the worst genocides have been between people who are very similar in how they look, lived close to each other for long periods of time and are familliar with each other's cultures
Ashkenazi Jews(who were very assimilated in Germany)/Germans, Turks/Armenians, or the African tribes of Tutsi and Hutu, who lived in the same country but had managed to create insignificant differences between each other who were more or less made up.
Freud called it the 'narcissism of minor differences'.
A biologist could probably give a more thorough answer but the phenomenom is pretty scary - and fascinating.
Data from the CIA Factbook current as of January 1, 2011:
Population Growth rate by country:
Bar chart: http://www.indexmundi.com/g/r.aspx?t=0&v=24&l=en
Map: http://www.indexmundi.com/map/?v=24
Another map: http://en.wikipedia.org/wiki/File:Population_growth_rate_world_2011.svg
Crude Birth rate:
Bar Chart: http://www.indexmundi.com/g/r.aspx?t=0&v=21&l=en
Total Fertility Rate, by country (CIA, 2012 estimated):
https://www.cia.gov/library/publications/the-world-factbook/rankorder/21...
Total Fertility Rate, by country (World Bank, 2007, 2008, 2009, 2010-2011):
http://data.worldbank.org/indicator/SP.DYN.TFRT.IN
Population:
Bar chart: http://www.indexmundi.com/g/r.aspx?t=0&v=21&l=en
World population, historical from 1950 and estimated to 2050, broken down by 'developed countries' and 'less developed countries' ('Population Reference Bureau':
http://www.prb.org/Educators/TeachersGuides/HumanPopulation/PopulationGr...
World population growth rate, 1960-2011, from Google:
http://www.google.com/publicdata/explore?ds=d5bncppjof8f9_&met_y=sp_pop_...
World population pyramids, 1950, 2010, 2050, 2100, from The Economist:
http://www.economist.com/blogs/dailychart/2011/05/world_population
You are partially correct...for the countries you cited...but there are plenty of other countries with high TFRs and projected growth rates...even for counties with decreased TFRs, there is demographic momentum.
The World population growth rate has fallen recently, but the graph showing this data to 2011 appears to be showing the growth rate decline to be leveling out, still above zero...~1.2%.
A quick peruse through individual country population charts is also available at the Population Trends databrowser. Here is a chart for Iran which raises some interesting questions:
Some of the answers are available in a 2001 report on the Iran Model for Reducing Fertility:
You certainly don't read much about THAT in the mainstream media.
Happy Exploring!
Jon
Great citation!
Your site is interesting...I bet working in your company is very fulfilling.
Best wishes for you and your mates to help people understand the data for their Worldly concerns, and helping them do the math.
I guess the knee in the total Population curve and the corresponding dips in the population growth bars (~1992-1995) must be indicative of the lag between the start of the population control push and the time that people started to embrace the message?
The birth rate of second generation immigrants is according to German data correlated with the education of the women. As Sweden's school system does a very good job with integrating kids of the first generation immigrants the Swedish numbers are no surprise for me. The "problems" (i.e. much higher birth rate for second generation immigrants ANG high drop out rates of these kids) in Germany and Austria are caused by our school system.
The Canadian school system is very good at bringing immigrant children up to the same standards as everyone else. This has been cited by international education experts as one of the reasons for the uniformly high scores of Canadian children on international comparison testing.
However, it does come as a shock to first-generation immigrants that their children act and talk exactly the same as all the other children in their school. Many of them expect their children to follow the same cultural traditions they would in their home country, and marry within their own ethnic group, and that just doesn't happen. It causes a lot of conflict within families.
An interesting game to play at parties is to ask, "What languages did your grandparents speak?" It is not unusual to find a number of people whose grandparents spoke four different languages. Canadians have always been relatively colorblind and prone to marrying across ethnic boundaries - it was always dangerous to insult an ethnic group because someone you were talking to might have a grandparent in the group (physical appearance can be misleading), but now the whole country is turning into Heinz 57's.
Here in California my children are Dutch, French, American Indian (Mohawk), Scotch/Irish, German and Swedish. My daughter is now dating a young man who is Chinese/Phillipino and Spanish. That's approaching "57 varieties".
I love contemporary family portraits in S. Cali. You generally see family members of every ethnicity under the sun and every possible blend too.
I once had a spanish-teacher who was also an opera singer. He was a spanish jew, born in Turkey, who moved with his family to France, where he attended an english school. He now lives in Sweden.
The "differences" between the Hutu and the Tutsi were mostly amplified by their European colonizers in order to divide them.
The two terms are confused, but the idea is there:
"Beginning about 1880, Roman Catholic missionaries arrived in the Great Lakes region. Later, when German forces occupied the area during World War I, the conflict and efforts for Catholic conversion became more pronounced. As the Tutsi resisted conversion, the missionaries found success only among the Hutu. In an effort to reward conversion, the colonial government confiscated traditionally Tutsi land and reassigned it to Hutu tribes, igniting a conflict that has lasted into the 21st century."
"...those who owned cattle became known as Tutsi and those who did not became Hutu"
"The Belgian-sponsored Tutsi monarchy survived until 1959"
"The Tutsi aristocracy or elite was distinguished from Tutsi commoners, and wealthy Hutu were often indistinguishable from upper-class Tutsi. When the European colonists conducted censuses, they wanted to identify the people throughout Rwanda-Burundi according to a simple classification scheme. They defined "Tutsi" as anyone owning more than ten cows (a sign of wealth)..."
The mechanism set in place still is at work today. Hundreds of thousands have died. Pure Evil
http://en.wikipedia.org/wiki/Tutsi
http://en.wikipedia.org/wiki/Hutu
Divide and conquer. FoxNews: "Fair and Balanced". "Teach the Controversy"
___________________________________
http://uploads6.wikipaintings.org/images/johannes-vermeer/woman-holding-...
wimbi:
I agree.
Even knowledgeable, informed people on a website such as this can have remarkably inconsistent world views.
They simultaneously believe:
1) The world is overpopulated! We need education on birth control and to lift the economic status of women! We need birth rates to fall!
BUT:
2) Let's prove how tolerant and welcoming we are! Our towns and cities are enriched by immigration and diversity and more people! Let's grow to infinity and beyond!
Cognitive dissonance of this sort is easy to spot and is all around us in various forms.
Falling birth rates and migration/mixing are not exclusive. I move to Mexico, a Mexican moves to the UK, what has changed other than where we are, has this changed birth rate? Infinity and beyond, yeah, therein lieth the problem.
NAOM
100% agreed! Cultural diversity and exchange are not necessarily equivalent to spreading the meme of infinite growth!
I even believe that if we have more of the former it may actually help with eliminating the latter.
I woke up on the optimistic side of the bed this morning >;-)
I don't hold views that would mean open borders.
But I do not hold views that are at the base directed against immigrants. If someone comes to Sweden from another country, is well-educated and wants to work then they should be given the opportunity to do so without discrimination.
If there's a squeeze on resources, then it's only natural that immigration should be scaled down. What I'm saying is that the people who come, if they come, should be treated fairly, not a generalist statement on immigration overall.
But I guess even that is too much for some.
Fair enough. I myself have been personally responsible for bringing a number of immigrants into this little town. I did it for the simple reason that they had very high skills I needed. And of course they were willing to come, usually from hot, tired places. These people then went on to become splendid citizens and famous in their professions.
My problem is the simple arithmetic, not personal characteristics. As I read it, the arithmetic says we have too many people and are getting more fast. The fact that we are getting more less fast today than yesterday does not cancel the fact that less fast is still fast, with consequence appertaining. That is my reason for that remark on borders.
I note the happy fact that, for what reasons I know not, I do not feel a need for approbation, the which I do not get, copiously.
Do they really need to be well educated or is it more important that they are willing/able to do the work that locals cannot/will not or where there are insufficient numbers?
NAOM
The question is more "are they willing to do highly skilled work for near minimum wage"?
And the thing about population growth is that's is high population growth which is harmful. This creates huge demographic populations when the growth rate, inevitably, slows down. What constitutes "high" is debatable, but I think anything over 0.5% p/a.
Svamp above wrote If someone comes to Sweden from another country, is well-educated and wants to work then they should be given the opportunity to do so without discrimination. That's the policy Australia has been following, more or less, for the past decade. Our growth rate has been hovering around 1.6-2%. Which is madness and will only cause immense problems in the decades to come.
If you care about world population as opposed to local population, immigration has to first order accuracy no effect. For those moved it frequently speeds the demographic transition to lower birth rates. And back home, remittances probably boost the local economy, allowing the source regions (of immigrants) to also advance towards the demographic transition. So the net effect of economic migration should be a lowering of the future (world) population trend.
Nice, comforting point, enemy. Question. " frequently", " Probably" and "should be" are ok as far as they go as quite possible guesses, but what does the actual dynamic on the ground say? I dunno. Easy to visualize a runaway dynamic that swamps everybody. Something to study. Meanwhile, what do we do?
I have spent a little time in India and Bangladesh, and know a lot of really great people there who I admire as being far more civilized than I am. But just eyeballing it, I get the feeling that they have way too many people for their own good, and they aren't slowing down anywhere near fast enough, and the tiny dribble of them I got to come here made zip difference either way.
Mea Culpa. The elections was in 2010, not 2012.
China will boost demand to help global recovery
S – “…to rebalance its trade and will generate $10 trillion in demand for imports”. Whatever the exact number it is I’m sure it will be significant. Just consider who much oil and scrap steel (which one of my sister companies ships to them on a regular basis) they import today. Those volumes should certainly increase if their economy continues its robust growth. And probably a nice increase in coal and other raw commodities. OTOH I wonder how much of that $10 trillion will be for finished products.
R - Time for some more "Ghost Cities"
S - And we’ll keep shipping all the steel they need to keep building those ghost condos. Just ironic that much of what we ship is oil patch infrastructure including refinery scrap. Be nice if we could ship them finished drill rigs but they make them cheaper domestically with our scrap steel.
Rebuilding bridges that keep failing. (Eight bridges have collapsed around China since 2011.)
Chinese Blame Failing Bridges On Corruption
Thank god. I thought we were alone when it came to falling bridges. /sarc
Test Drive: Electric Focus EV is appealing, but practical?
What a terrible article on EVs. A real anti-EV hit piece. First of all it refers to the Ford Focus Electric(FFE) as "a very nicely executed example, in Focus EV's case" . . . bull-crap. The Ford Focus EV is widely-panned as an over-priced out-sourced half-assed failure by EV people. For example it brings up the truck space taken up by the battery . . . well that only happens because this is a half-assed kludge conversion . . . Tesla's Model S and Model X have MORE trunk space than conventional cars. The FFE is not terrible car but it costs way to much compared to the Leaf & Volt such that it is a failure destined to sell nothing more than double-digits per month.
The article bring us the coal-boogie man in a false equivalency even though every scientific analysis proves that EVs are MUCH CLEANER than conventional ICE cars even when powered with today's grid which includes coal-power.
The article even goes out of its way to say "Some buyers qualify for $7,500 federal income-tax credit." Some? C'mon. EVERY buyer qualifies for the tax-credit. I guess you won't get the full $7500 unless you have $7500 in tax-liability but if you have the money for a $40K car you obviously have at least $7500 in tax-liability.
So the article goes out of the way to high-light the negatives but does it even bother to mention the positives? Other than complementing the fast-acceleration . . . Nope. No mention of the fact that driving an electric costs like 2 cents a mile in fuel compared to 10 cents a mile for an ICE car! No mention of the lack of oil-changes, smog-checks, oil-filter changes, air-filter changes, spark-plug changes, exhaust system issues, etc. It takes the nice quiet operation of electrics and paints it as a negative referring to the 'whine' and saying it is a danger to pedestrians.
So basically they picked one of the worst EVs on the market, proceeded to highlight all the negatives with exaggeration, and then did not bother to point out any of the positives such as saving $1000 to $2000 per year in gasoline costs.
Pure EVs are a hard sell these days though because gas is still relatively cheap, pure-EVs are expensive up-front, and people are not familiar with them. The market has spoken and the electrification will proceed with PHEVs. The Volt is the biggest selling plug-in car these days by a good margin. And a second wave of plug-in hybrids is on their way with the Ford C-Max Energi, a Honda Accord PHEV, Ford Fusion Energi, an out-now but wimpy Plug-In Prius, a Nissan PHEV SUV, etc.
To me the batteries are still a major problem. I noticed a bunch of Leafs (Leaves?) on my local Nissan dealer's inventory and started doing some research. Almost immediately I read about problems with major battery capacity losses in the heat.
Even our Prius with 140,000 on it seems to be suffering a little this summer from the heat. Used to be the mileage got better in the heat, not this year.
I expect the miles driven will drop off a lot more before electric vehicles catch on, if they ever do. If you are only putting a couple thousand miles a year on a vehicle, it probably won't matter much what you power it with.
The heat issue has only happened in Arizona. Nissan put no active thermal control system in the Leaf battery pack and that may have been a bad decision . . . it may be fine for most of the country but in super-hot places like Arizona, that might not work. The Volt has a full thermal control system and hasn't show any problems.
Batteries do age and cells must eventually be replaced. But the fact you read stories about the Leaf having battery issues may have just caused you to start thinking your car is getting less mileage. Do actual tests to verify. Perhaps you need a cell replaced . . . at 140K, that is not unreasonable. Nothing lasts forever.
I just can't figure why our local Nissan dealer (town of about 100,000) is sitting on a dozen Leafs. If they made one without all the electronics and heated this and that's for around $30,000 I might consider it. $38,000 for a car to get about town in is just too much money. You shouldn't need a navigation system if you are never more than 50 miles from home.
The prius mileage is real easy to verify. We hardly get over 46 when the temp is above 95F and we used to get low 50's. I'm probably in the market for a remanufactured battery. Hopefully it will wait until next year and I'll be able to find somebody to install it. It doesn't look that hard, but 90lb in a tight space doesn't sound like a good time.
"It doesn't look that hard, but 90lb in a tight space doesn't sound like a good time."
Don't forget about the 200 Volts (electrical, not GM) either.
Sometimes it pays to hire the guys with the right tools.
From what I gathered, there is a plug you pull before messing with the battery that disconnects the internals from the outside world, making it safe to deal with. Otherwise, I wouldn't even dream of handling 220 dc, not unless the car was plastic.
The Leaf had a nice start when it was released at $32K and they sold a decent number. Then they jacked the price up to $35.2K and sales dropped like crazy. Now they are often at $36K to $38K with options and they are only selling a few hundred per month. People are counting on the Symrna, Tenn. plant opening up and reducing the price to re-vitalize sales. We'll see. I hope that happens . . . but I suspect that the Plug-In Hybrid Electric Vehicle (PHEV) model will be the way most people move into electrified transport.
Seems either someone needs a really large kWh battery, or my personal favorite idea: have a trailered or small FF and/or solar powered APU for the times longer trips needed.
Here is the Tesla S doing a Los Angeles to Las Vegas run, but with great sacrifice to the drivers. http://www.treehugger.com/cars/los-angeles-las-vegas-electric-car-single...
"Seems either someone needs a really large kWh battery" . . . but it really is true that they really don't the vast majority of the time. But that is a HUGE mental adjustment for people and they won't make it until the price of gas forces them to. They'll end up spending thousands of dollars for gasoline for 10, 20, 40 mile trips that could easily be handled by a battery just for that rare occasion when they need to drive hundreds of miles. But with the money you save driving on electric for everyday commuting, you could easily rent a gas car when you need to drive a long distance.
I think the widespread availability of car-sharing programs may help electrics. If people know they can easily get a gas car anytime they need one for a long trip, then they may feel better about having an electric. But the biggest problem remains the high up-front cost.
Crazy Weather ... Tornado watch in New England … [the new Tornado Alley?]
I’ve lived here 58 years – prior to 2000, (~50 years)- maybe 1-2 tornadoes – after 2000 (~10 yrs) - 7-8 tornadoes. [2 within a mile or two]. 'Things' have changed.
… to paraphrase Capt. Rameus The Hunt for Red October … “some things around here don't react too well to tornadoes.”
and Signs of Arctic climate change
Greenland High – UK Low – If this is the new ‘normal’ then it's going to have an interesting effect if you’re planning any agriculture in the UK over the next century.
and How melting Arctic ice helped cause poor UK summer
also Methane is starting to creep up at Barrows , AK …
http://www.esrl.noaa.gov/gmd/webdata/iadv/ccgg/graphs/ccgg.BRW.ch4.1.non...
http://www.esrl.noaa.gov/gmd/dv/iadv/graph.php?code=BRW&program=ccgg&typ... (choose CH4)
… the latest Barrow data show the last 2 points in August at approx 2080 PPB/v, which is extremely anomalous. The fact that there have now been two readings at those very high levels indicates a stronger signal.
Perhaps God is angry at the sinful residents of New York, Connecticut and Massachusetts... Jersey is probably just collateral damage >;-)
Seraph,
umm...not exactly. These types of anomalous readings happen fairly frequently. What you are looking at is unverified data. It turns out that most of the anomalous readings (and quite a few readings in the 'normal' range) end up failing data verification/equipment calibration tests. It is not uncommon to get several readings in a row that turn out not to pass verification. One can read up on how the readings are taken and verified on the ESRL site as well as various blogs.
Short term readings (as short as one hour) vary quite a bit during the day but what is really relevant are daily and longer averages. Those show a steady linear rise over the years but not the spike that frightens and worries many.
That spike will come some day, but it is more likely to be decades or longer away than it is likely to happen in the next few years.
Wyo
Two reports on two areas up in that area indicate methane is already roaring:
(Deepwater Horizon). The melt of the ice extent is likely to enhance the conditions for methane release:
(New Drug Dealer - Same Addiction). It is near the time of the year when the ice begins to increase again.
I have not read the latest Arctic ice-extent data to determine how low the new record ice extent record will be this year.
Dredd
Yes I am aware of the Russian research. It is famously exaggerated by the media (I note your info is from the Independent) and some (non-scientific) strong proponents of fixing AGW.
The Russian data you cite is from 2010 & 2011. I would note that if this portended a disaster back then it would have already manifested itself by now. No globbal spike in the last couple of years. Just the steady rise I mentioned.
If you go to RealClimate you can find extensive discussions on how much of a methane 'burp' is required to get the instantaneous heating effect that is so frightening. Basic answer is that there needs to be an increase from what the Russians have observed by about a factor of 100 times. Then we panic. When, not if, that happens (it is going to happen eventually) then it is "Katy bar the door!" But it has not started yet. Knock on wood as they say.
The Russians are due to report their 2012 findings very soon. It will be interesting to see what they have found.
The scary thing about climate tipping points is that they described state change processes that have the potential to completely upset the human world in very short order. There are many people who are very concerned about AGW who see information about those points and think that what they see means the point has passed and the change is upon us. Let's wait for the expert climate scientists to say that what we are seeing is a runaway change. There is nothing we can do about it in any case if it is starting to happen now as that would mean that it is game over. And if humans are going to change their behavior to stop climate change then they have to stop burning fossil fuels now. Not 20 years from now. Best of luck with that!
I am pretty certain that we are in fundamental agreement on AGW. Though I am probably more cynical about our chances than you are.
For data on Arctic ice I recommend the following site: It is the best I have found.
http://neven1.typepad.com/blog/
Best, Wyo
Yeah, we've got Saskatchewan's 'living skies' here today. The clouds look like a time-lapse animation.
Lively, but pretty!
Two tornadoes in NYC - one in Breezy Point at the far W end of Rockaway peninsula, the other in Canarsie, Brooklyn.
I've lived my entire life in NYC, and in fourty years, I can't recall a tornado. Per wikipedia, there was one in 1974, all the rest are much more recent. Things have markedly changed in recent history.
The back story to an article in the Sept 5 Drumbeat - Study sees no nutritional edge in organic food
Stats for anti-organic study done by ex Tobacco Institute researcher
Well, you gotta admit that isn't exactly a nutritional edge in organic food... and why would anyone want to lower their children's urinary pesticide levels. Are you sure that wasn't Professor Orkin?/sarc
And I've just been looking through reporting that ties excess Phosphor and Phosphates with behavioral disorders in children, relevant to pesticides, non-organic fertilizers and mis-prepared grains and nuts, which have Phytic Acid, a means by which plants store undigestible (by non-ruminants) Phosphorus, and which is known to chelate essential minerals from your digestive system. Calcium, Iron, Zinc and Magnesium in particular... where the iron and magnesium imbalances against calcium levels create a very broad range of disorders, from Skeletal and Dental development, to cell-wall and venous strength, to cognitive problems.
http://www.ncbi.nlm.nih.gov/pmc/articles/PMC3402076/
.. I also thought that 'Stanford' article had a fishy reek to it.. but no time to toss in my efforts to debunk at the time..
I still maintain that anybody or anything 'Green' is still the easiest target to get the widest audience to ballyhoo against, since the problems they point out to us are going to be the absolutely toughest and most disruptive to address.
For Hayward, BP Stands for “Back in Play”
... touches on MENA, Syria, Iraq, Kurdistan and other machinations
Crosstex to relocate pipeline near Bayou Corne sinkhole
Sigh. Roscoe Bartlett went and stuck his foot in his mouth. Posted here only because most of us know or know of Roscoe.
Roscoe Bartlett apologizes for Holocaust remark made as he blasted federal student loans
He subsequently issued an apology:
Roscoe is a strange bird. He seems to be the rare peak-oil aware pol. However, he is also anti-abortion and not exploding the population is probably one of the wisest response to peak oil. As much as many people dislike abortion, having it available as an option for people to terminate unintended pregnancies that they cannot afford is needed.
Not a related comment, but read yesterday James Akins article from April 1973 : 'The oil crisis, this time the wolf is here"
One of the most interesting thing about the first oil shock period or oil "diplomacy" in general for sure :
http://www-personal.umich.edu/~twod/oil-ns/articles/for_aff_aikins_oil_c...
(a lot "in between the lines " as well)
Akins is the guy that audited US capacity for Nixon after US peak, was then Ambassador in Saudi Arabia (had been in Iraq as a diplomat before), and then got fired by Kissinger ...
Too bad he died 2 years ago, and strange he isn't more rekown.
From a NYTimes article up top...
As Coolant Is Phased Out, Smugglers Reap Large Profits
Allison Bailes has a post at GBA that fleshes out more details...
The Loophole and the Ozone Hole
How the EPA has let us (and the planet) down with its air conditioner regulations
Here's a couple of additional posts at Allison's own Energy Vanguard blog...
The Science Behind the Phase-Out of R-22 Air Conditioner Refrigerant
HVAC Secret: An Air Conditioner Loophole the Size of the Ozone Hole
A Strange Silence on Dry-Ship R-22 Air Conditioners
I was browsing the A/Cs in the local supermarket yesterday. All but one R22. Lots of splits sold here and most seem to be dry-ship.
NAOM
As long as they keep the refrigerant IN the AC unit,it really doesn't matter what it is. It was venting it to the atmosphere that caused the problem. Since R-22 is now expensive, people are being careful with it. No venting, so the ozone is safe.
The R-22 units are phasing out as time goes on in any case. It's taking longer than expected.
These R-22 AC units aren't supposed to be being produced, and installed, the R-22 itself may be expensive but if the 'dry-ship R-22 unit' is substantially cheaper than a R-410a system then people will, and are, buying the R-22 unit.
There will be venting and leakage that's unavoidable and inevitable. And because there is far more R-22 being produced than the 'intent' of the regulation was trying to limit then we have a problem.
I'd say well in excess of 90% down here, it's an eye opener to spot a 410 label.
NAOM
(Money Magazine) -- More and more, people are in a committed relationship -- with their wheels.
The average age of cars and light trucks (SUVs included), says Experian, is now 11 years -- double the age in 1970. Driving this: higher quality and, lately, a poor economy.
It seems like this is mostly due to the fact that new car sales are dropping as people don't have credit to buy new vehicles and afford the gas cost for them. It looks pretty clear the automobiles are going the way of the dinosaur[/url].
"After the Warming" (James Burke, 1989) Documentary in which Burke acts the part of a 2050 historian explaining global warming and its results to a contemporary 2050 audience.
Since one of the favorite things here at TOD is wondering and figuring what the future holds, I thought some of you might be interested to see how, in 1989, he imagined things might unfold. I used to really watch the TV schedule for these documentaries; but I missed this one, if it was even shown in the U.S. Apologies if it has been posted before.
http://video.google.com/videoplay?docid=6514270139930450081#
Wonder what he's thinking now. There's a list of his documentaries at the wiki page.
http://en.wikipedia.org/wiki/James_Burke_%28science_historian%29
Every now and then, I've taken a peek to see if there's a cheap set of his 'Connections' series available.
At the top of that Wikipedia page, they have a still of him from the series, where he's describing the Haber-Bosch process, apparently. I wonder if he went into the rest of the Haber connections.. Nerve Gas, Zyklon Gas and High Explosives, etc..
Ah! Well here we are, Episode 7 'The Long Chain', or at least a 10 min chunk of it that gets into WHY Germany was so desperate for fertlizer in the first place!
http://www.youtube.com/watch?v=DdNzCwWhNa4
Sorry, erainh2o, for jumping completely away from your topic.. but watch Burke for a moment.. he does that and ties each departure back into the theme in brilliant and silly ways.!
(and here's now the full episode.. http://www.youtube.com/watch?v=Ims5JjhUWOU there are times when I just LOVE TV ! )
Thanks, jokuhl, for the link -- I love it, too. I'll watch this one sometime this week. If one has a computer and a broadband connection, one ought never to be bored.
Lizzie
CME: U.S. meat production down since 2008
There seems a dearth of information regarding the progress (or lack thereof) in Brazil's offshore oil program. Does anyone know of any article/study which has compared original expectations versus the existing situation? Thanks.
Sure, unfortunately most of them in Portuguese.
http://br.reuters.com/article/businessNews/idBRSPE85O02920120625
I've translated some pertinent statements
Petrobras will produce 1 million barrels a day less than previously predicted according to data for the company's new production curve for 2020
This volume represents half of what the company currently produces in Brazil. The Company now expects to produce 2.5 million barrels a day in 2016 and Petrobras' 2020 projections are for 4.5 million barrels/day, about 700 thousand barrels a day fewer than the original projections of 4.9 million barrels a day.
In previous predictions the company had expected to be producing 3 million barrels by 2015
Methinks even these newly downwardly revised projections border on the overly optimistic...
Thank you, FM.
I'm gathering a lot of information for an essay assignment at my university, but I can give you this tidbit:
Brazilian offshore production
It's from Bloomberg this August.
Notice how in the article, the expectation is now for Petrobras to have a stagnant oil production rate for the next two years. They are already very late.
The reason why you don't have much news on Brazil is because things are going sideways.
In fact, they are already having to fight declines in their Campo field(which is their biggest field) with other production(which is coming on late).
I don't think Brazil has peaked just yet, but it's important to note that the 'original production estimates' were not 4.9 mb/d. It was closer to 6.5 mb/d.
Those 2020 estimates have been cut down substantially and to hide that fact, Petrobras claims that those earlier estimates were just 'theoretical' and never set in stone.
The important part here is the trend downwards.
Do you remember the guy from Core Labs, their CEO?
His company is one of the best when it comes to drilling and oil field servicing. He has access to tons of data and his company has the most exposure in Brazil.
And he said that he thinks we'll peak within 2-3 years. I am not going to doubleguess him on that one, but I do think the important part of that quote is to note that most of his data is based on offshore Brazil so if he's a skeptic, then that means he has seen the most valuable data and concluded that Brazil is never going to take off.
There's a lot more I can add, but that's for another day.
Gulf OPEC big three raise Aug oil output by 400,000 bpd
This is a most strange conclusion. The Big Three increased production but actually only one of them increased while the other two decreased production. And the article says Kuwait increased production by 600,000 bp/d to 3 million barrels per day. But in July Kuwait, according to the OPEC OMR, produced 2,825,000 bp/d crude only. 3 mb/d would only be an increase of 175,000 barrels per day.
Also the article says the UAE produced 2.7 mb/d in August, down 100,000 bp/d from July. But the OMR says UAE produced 2,559,000 bp/d in July.
The data in this article is just crazy. But the OPEC OMR will be out in two days with the OPEC crude only production for August. The data there is about the best since it is a composite of secondary sources for OPEC production. We will know then.
Ron P.
What other utilities may expect going forward?
Queensland's oversupply of electricity could keep lights on in Brisbane for a year
See: http://www.couriermail.com.au/news/queensland/queenslands-oversupply-of-...
Curse you, thou wretched demand elasticity and renewable energy so foul.
Cheers,
Paul
Curse you, thou wretched production monopoly and nonrewable energy so foul!
So much for free market capitalism, eh? Apparently the religion of 'I've got mine so F you' is doing just fine...
Cheers!
Fred
Very true, Fred. Nova Scotia Power's sales for the first six months of this year are down 16.5 per cent. And with the closure of the Bowater Mersey plant in June (NSP's second largest customer), they've lost another 16 per cent of provincial load. Ugly, to say the least.
Cheers,
Paul
I recall Gail (I think) posting the idea that electricity utility companies carry a lot of fixed costs, and when demand drops, electricity rates have to increase to cover these costs with a smaller number of 'product units' being shipped per unit of time.
Less demand = higher unit costs, given the fixed costs which must be paid?
Of course, if this theory doesn't hunt, then the theory of prices being 'easy up, sticky down' sounds believable.
Meanwhile in South Australia ...
http://www.abc.net.au/news/2012-09-07/gales-fire-up-south-australian-win...
Curse YOU, thou wretched mathematical illiteracy!
That lead sentence mixes units in a bad way. The wording implies that they have an excess of stored electrical energy, expressed in KWh or MWh or GWh, "capable of keeping the lights on in Brisbane for a year".
What they really have is a time-varying imbalance of generation and usage, expressed in KW or MW or GW. Without an effective storage mechanism, that won't keep any lights on, anywhere, for any period of time. In particular, excess solar-generated electricity won't run any lights after dark!
*sigh*
PT in PA
Many dead in attacks on Iraqi security forces
Having my doubts about Iraq becoming the next Saudi Arabia.
Yes, but regardless if sectarian violence reduces oil production, one must realise the all encompassing importance of offing other people for holding slightly nuanced differences in extremist religious viewpoint.
I find it worrying that many of the cornucopian ideas feature increasing oil supply from areas of the world that are highly politically unstable such as Iraq and African states.
NAOM
A while back I noticed that most, if not all, unstable areas in the world are coincidentally clustered around access routes to valuable resources. for example, in no particular order:
- horn of africa: sudanese oil
- libya: oil, gas, aquifer
- chechnya, ingushetia, georgia, armenia: caspian gas routes
- afghanistan: caspian gas routes, opium
- syria: caspian gas routes, sunni petrodollar hegemony
- western sahara: phosphates
- angola: oil, gas, minerals
- nigeria: oil, gas
- congo: copper, tantalum
- burma: oil, gas, opium
etc etc.
Death Sentence for a Top Iraqi Leader in a Day of Bloodshed
Source
There are deep splits at the very top of the Iraqi hierachy.
The main obstacle for Iraq has always been the secterian factor.
There are so many unanswered questions now that I know I will not receive a pension, probably not live to be 40 and generally lead a life of perpetual and ever-increasing misery. Should I spend what little cash I have on traveling while airlines still operate, on a driver's license when I know the already-high prices on maintenance, gasoline, toll booths etc are going to skyrocket. What good does it do me that my employer puts away the equivalent of 5% of my salary every year into a savings account for when I retire at 67 (ie. in a "mere" 44 years). Who in their right minds think that 67 will remain the age of general retirement?
Should I get a house when I know I can't pay on the mortgage down the line? Should I buy more bullion coins because QE3 will make the spot price never return below $30? Should I quit my job and spend every waking moment on preparing for the doom (tm), even though I am 10-20 years late already?
Today's questions, tomorrow's regrets.
Well since you're asking...
I would vote yes on the travel option. There are many beautiful places where you can get by on less $$ per day than you are now at home. Especially if you can get out of housing costs at home while you are away.
Get some sun, sit on a tropical south Pacific island for a few months. And do it during the most depressing season at home.
Fish and coconuts contain natural anti-depressant properties!
Tropics yes, tropical island no - unless you plan to spend a LOT of time swimming ;) There are many tropical coastlines where you can live very well, very cheaply with an abundance of good food all around you, mmmm coconuts.
NAOM
"Should I get a house when I know I can't pay on the mortgage down the line?"
That was a popular fad for awhile, but I think it's too late to get in on it now. Besides, you want to be mobile. Expect to have to move a lot, and far. Excluding all the military moves, I've lived in WI, ID, NV, and WA. Whether I'll be able to hold on here until retirement is an open question. Look for an oldish book called Nomadic Furniture. I built some of the stuff in that, and am still using it, or later iterations of the same idea.
The book still exists! http://www.amazon.com/Nomadic-Furniture-1-James-Hennessey/dp/0394475771
The retirement age is going to go up, so plan to work until 70. Why you don't expect to live until 40 is a mystery, as you have entered the "practically unkillable" age range, where all you have to fear is your own stupidity, and since you about 23, you have passed the most likely time to do yourself in too. Very few of my acquaintances have died since I hit 24. That will be picking up now, alas.
I'm not a financial advisor, so I won't make those type of suggestions. I have enough trouble deciding what to do with my money in Bernanke's ZIRP world. But you do need to keep your job to prepare for whichever doom you expect. By the way, I made a chart for my own preparation. The Most Probable Doom is a week-long power outage. The Worst Case Doom is the eruption of Mt Rainer (call it St Helens X 6). I have prepped for both of those, which took surprisingly little, given I already have the camping/hunting/fishing gear. I have not prepared for a Zombie Apocalypse nor for the Sudden Collapse of Industrial Civilization. I don't think either of those is likely. I am also ignoring sea level rise as I am already 1300 feet up, nor am I in hurricane country. No major faults in this area, so no worries there either. I considered adding brush fire forced evacuation to the list, but this particular pocket of area is suprisingly fire-resistant given that much of the surroundings burns off fairly often. Basically no forest, but I am surrounded by irrigated orchards and natural firebreaks.
Anyway, back on topic, breathe deeply, get a beer and relax. It's not as bad as you would think by reading TOD. This place likes to dwell on the worst case, and as useful as that exercise it, what actually happens will be somewhere between the current BAU and Doom. BAU moves anyway (when was the last time you went to Tower Records and bought a cassette tape to use in the car?) The question is which way will BAU go, and how fast will it change.
Depressed: That prognosis doesn't sound very good, but is it realistic? Unless you have a medical condition that your doctor has said means you are unlikely to see 40, your prospects for a decent length of life should be pretty decent. The economy could go down a long way, and life expectancy would probably only go down a few years. At sixty I'd love to be 23again (especially when I see attractive females), so count your advantages, don't dwell on the negatives. I'm not sure the life prospects for your generation are any worse them they seemed for mine (we had no reassurance the coldwar would end with a whimper, not total thermonuclear war), even if the economic prospects don't appear to be as good. And the generation before mine, had to go through world war two and/or the great depression, so things weren't so great for them as well.
For some of the specifics. Drivers license, you can have one without owning a car, it does give you some options, and might be required by some employers. And if you do need a car, get something small and efficient -if fuel prices skyrocket, at least it will be enough in demand to be sellable. Social Security, who knows. Most likely the program will survive in some form, or at a minimum people in the system will at least be paid off (perhaps at a discount). Its just an unavoidable expense of employment, no need to dwell over it.
How old are you?
Alan Drake is going to love this.
A surprisingly realistic assessment of Saudi oil consumption trends, by (I assume) a Saudi national, with an explicit acknowledgement of "Net Export Math" (without any explicit discussion of the reality of depleting oil reserves).
Of course, almost no on is taking the math one step forward and reviewing the tendency for exporting countries, like Saudi Arabia, which are showing a net export decline to ship the bulk of their post-peak CNE (Cumulative Net Exports) early in the decline phase. And the Saudi ECI (Export Capacity Index) Graph, or the ratio of total petroleum liquids production to liquids consumption, is not, shall we say, subtle):
http://i1095.photobucket.com/albums/i475/westexas/SaudiECI.jpg
http://english.alarabiya.net/views/2012/09/09/236919.html
Will Saudi Arabia become an oil importer by 2030?
By Abdel Aziz Aluwaisheg
Of course a reduction in the population is also in order?
Or do they plan to go the way of Egypt?
The Denmark case history.
Denmark is a case history of a net oil exporter, showing a production decline, that taxes fuel consumption and that has successfully cut their consumption. Their 2004 to 2011 rate of change numbers (BP):
(P = Production, C = Consumption, NE = Net Exports.)
P: -7.9%/year
C: -1.0%/year
NE: -19.9%/year
P/C: -7.0%/year
Given an ongoing production decline in an oil exporting country, unless they cut their consumption at the same rate as the rate of decline in production, or at a faster rate, the net export decline will exceed the production decline rate, and the net export decline rate will accelerate with time.
In Denmark’s case, their 2004 to 2005 net export decline rate was 12.5%/year, while their 2004 to 2011 net export decline rate accelerated to 19.9%/year.
In simple percentage terms, a 43% decline in production from 2004 to 2011 resulted in a 75% decline in net exports, even as consumption fell by 6.5%.
Maybe you can verify this. The latest big find on the Norwegian Continental Sself, which holds reserves closely reminiscent to half of what Statfjord once was endowed with, Johan Sverdrup is claimed to hold between 0.8 and 1.8 billion barrels (that's pretty ambiguous if you ask me). Let's say that the high estimate bears resemblance to the truth. Recovery on NCS is from what I've come to know around 45-50%. That means the find is at best 0.9~ actually recoverable billion barrels. Subtract from that the energy cost of actually discovering the reserves, all the planning that goes into all of the activities relating to the find, the building of the infrastructure to actually begin producing, etc. In turn the 1.8 billion barrels down there might be trimmed to a measly 800 million barrels produced over a span of decades (if BAU allows). No headlines show this though. They're only concerned with how much (not realistic amounts obviously) oil will be converted into useless monetary figures to add to the oil wealth fund.
Rune Likvern is the Norwegian specialist 'round these parts. (Click on his name for email address.)
DAL,
Present NPD estimates for Johan Sverdrup is around 1 800 million barrels of (technical and economic) recoverable oil.
I have not seen any estimates of STOOIP (Stock Tank Oil Originally In Place).
I think about our transportation issues and I'm reminded of the admonition about Greener Grasses always being 'over there', and that we've overfed our wanderlust to keep chasing that elusive rabbit o'er yonder hill and dale..
There is a Buddhist or Taoist line that says 'The farther you go, the less you know..'
while Pippin concluded,
..so, what are you seeking? Not 'The Mainstream', not 'Joe Sixpack' .. you?
Grueling, and the constant concentration to keep quality up.
Multiple mental checks at every step, again, and again, and again ...
A SIGNIFICANT effort !
Unless you have done something comparable, it is hard to describe the mental discipline requried/
Best Hopes for Recognition !
Alan
Dubai Metro
Two lines open, three more planned.
http://en.wikipedia.org/wiki/File:Dubai_map_Dubai_Metro.jpg
Saudi Arabia has Metro type commuter train for Mecca & Medina and another one.
Best Hopes for MUCH More,
ALan
ECAT report released.
They released a very preliminary report from one of Rossi's third party testers of his hot CAT.
http://www.scribd.com/doc/105326231/Corrections
They say the hot ecat runs at up to 1200C with a COP of up to 3. (double that is planned for production by including periods of free running)
Heat losses through conduction from the wiring and the steel framing are 'impossible' for them to measure and/or calculate/estimate?
What does 'after death' refer to? See 'Heat after death'.
Have notable research and higher education organizations independently tested this device ans these concepts? CERN? MIT? Cal-Tech? The various organizations under the U.S. Department of Energy? Others? Convene a session of the JASONS and give it to tem for a look-see.
Then comes the other question...if this effect indeed generates small amounts of energy somehow, that would be exciting and interesting from a basic knowledge/research perspective, but then how does this scale up to become a major energy generation source for the World, as is hoped by some people?
The Wikipedia article casts great skepticism on the ECAT idea.
The Wikipedia entry has 61 references with links, and four external references, for those interested in reading further.
http://en.wikipedia.org/wiki/Energy_Catalyzer
Having read some of the linked articles, I think this smells like the great 178m2Hf scam perpetrated on a very gullible Defense Advanced Research projects Agency (DARPA) in the recent past...the Hafnium controversy even made it into mainstream mags such as Popular Science.
It was touted as the next great thing....178m2Hf reactors were going to power the dawn of the new age of widely available, cheap, low-consequence energy production.
Perhaps as otherwise intelligent people see the writing on the wall regarding the future of World energy production and the increasing population and drive to raise energy consumption (raise living standards), some of these people are becoming increasingly desperate to believe in a salvation/breakthrough.
Other people may be equally interested in following the wisdom of P.T. Barnum, or may have deluded themselves into thinking that they indeed 'found the answer' and have become the salvor of our non-negotiable consumption expectations.
http://en.wikipedia.org/wiki/Hafnium_controversy
Rossi's calculations are a bit weird. His radiation calculations assume the cylinder is heated to 1074C, based on his reported thermal camera results, taken from below. Yet, looking at the photograph (as shown previously), the thermal emissions from the inner cylinder appear to be much hotter than that seen for the outer one. If the photo was taken at the time of the maximum emissions, the outside would likely appear to be emitting in the visible portion of the spectrum. Since the outer cylinder is also cooled by convection, the coolest location would be the bottom surface, since that is where the coldest air first contacts the cylinder.
This whole test is really strange. Why not "throttle" the ECAT down by reducing the input electricity to achieve some stable temperature, then make measurements over many hours? Trying to measure things in the midst of a transient situation adds more confusion. The graphs show the temperature and energy production peaking at the end of the run, so the device is not in equilibrium in any sense. Better yet, mount this device within a water jacket which would capture the thermal energy produced, instead of running it in the open air, which makes it much more difficult to extract results?
I remain a skeptic...
E. Swanson
They aren't Rossi's calculations but those of the third party tester. They say the complete report and others will be published later - this was just from the raw data on a single run. It did produce excess heat as claimed...
The 'News at Eleven', the 'final report is coming soon' storyline has been in play for a couple of years, has it not?
Let us put aside implications about this alleged effect being a great new clean plentiful energy source for mankind for a second....even without that potential, the World's major research institutions would glom all over this just for the pure love of science and discovery...for the sheer personal joy of learning for some, and also for the fulfillment and prestige of being published....if there is a real new effect, and Rossi et al can't or won't figure our and publish the underlying science, then those who do that would likely garner a Nobel Prize, even if shared with Rossi.
The motivation to research this would be intense...if the scientific community thought there was any there there.
I will be happy to be proven incorrect about this.
Occam's razor:
If it was real, and further, if it was real and it had major probability to scale to useful levels,then the big dogs (U.S., Japanese, Chines, Russian, Indian, English, U.K, German,etc governments would be all over this like flies on cow patties.
Since this doesn't seem to be the case, I infer that the effect is either not real, or not scalable to useful levels.
Either that, or we have to believe, for just one example, that the Japanese government is willingly ignoring this new ample, simple, low-risk, clean, highly scalable power supply and chooses instead to stare down the long rifle of reality at the choice between 'Matrix reloaded' on nuclear power, or continued mass importation of fossil fuels at great cost, combined with a painful power-down at some point.
I sure don't blame people for being skeptical. But, excess heat has been found by dozens of real labs. There are lots of engineering problems to be solved to make a commercial product and this test of the hot ECAT is promising.
Of course, a lot more testing is needed. They aren't allowing the free-running state to be tested, that might just be something they need to tune in, or it could be an indication of a major stability issue. They haven't shown the device can keep working for weeks or months. Can Rossi start shipping these products in a few months? I doubt they can do that, but they do seem to be making progress.
I would like to think Rossi is on the up and up...if he has patents, he should give his kit, with complete instructions on how to assemble and operate (as well as the 'blueprints'), to a dozen or more World-renown labs/research institutions, have them sign iron-clad Non-Compete agreements, and give them rights to do as they please...poke, prod, radiograph, disassemble, saw in half lengthways, drill through, take coupon samples etc. and everyone agree to publish the results in peer-reviewed journals, and 6 months later, on the Web open-source. He could even offer a cash reward for the institution who can disprove his specific claims (withing reasonable and agreed-upon error bars).
I am sure that if his claims are borne out, he could profit handsomely, and receive the well-deserved accolades, etc.
If his device works as claimed, and if he wanted to be a hero, he could put his device's plans in the public domain, with the direction that any person/firm/entity is allowed to use and build on his work, sell for profit, etc, with the understanding that they can't sue anyone else for the exercising the same rights.
He would still get the Nobel Prize, and more, and a smart person could parley his fame into profit.
I think it's pretty clear that Rossi is not on the up and up. What I find more interesting is why people perpetrate this type of scam. (Orbo, Blacklight Power, the various oil from algae scams, perpetual motion machines, etc.) It's not Rossi's first. You'd think he'd learn his lesson.
Sure, there's money involved, and that's certainly one motivation. But if they are really motivated mainly by money, I'd think that keeping a lower profile would be smarter. Maybe less cash up front, but less chance of being caught.
I think for the energy scammers, it's a lot like being Bernie Madoff. Money is part it, yes, but it's also an ego thing. They like the attention, the admiration, the people clamoring to get in. Even though they know eventually there's going to be a lot of very negative attention, it's worth it to them on some level.
DARPA is funding the Italian effort in cold fusion. The DOD Threat Reduction Agency has funded SRI in Menlo Park California on cold fusion. The Emperor of Japan is personally funding Japanese cold fusion efforts. The Chinese National Science Foundation is funding Chinese cold fusion research.
Rossi is to science and research as a fish is to a bicycle.
...and the USN was (is still?) funding the Polywell fusor concept.
Research is commendable.
As long as it is not hucksterism.
The gold standard is to publish in open literature, share, collaborate, participate in robust peer review, be skeptical and apply the scientific method.
Unfortunately, a lot of research is behind green doors...either of government classification, private enterprise proprietary information, or in some cases, to prevent you from seeing the man behind the curtain.
http://www.amazon.com/Imaginary-Weapons-Pentagons-Scientific-Underworld/...
The book at the above link tells a factual story...perhaps with some embellishments (maybe not), but true at its base.
Shell starting drilling in the Chukchi and Beaufort:
http://usnews.nbcnews.com/_news/2012/09/09/13763372-in-arctic-oil-battle...
The United States government should relent and allow full exploration, with appropriate environmental safeguards, in ANWR. Might as well find out what is up there, off-shore, and on-shore. Get what we can, keep TAPS running as long as possible, and buy a little more time to figure out what comes next. Allow the environmental groups open monitoring of the situation, with a whistle-blower hot-line to the EPA and the media...the companies will mind their Ps and Qs.
Save ANWR to run tractors with.
The USA is still subsidizing burning oil (cheap gasoline) by $101 billion/year.
Any more production will just be waste.
Alan
If we had logic and restraint, we would produce it now, while we have the where-withal, avoiding a TAPS choke-off, and store it in more formations such as are used in the SPR (assuming suitable formations are available and could be engineered.
Not for some futile 'BAU forever' quest, but to buy some time to transition to another civilization energy paradigm.
But....that would require a level of intelligence and commitment to the future I have not seen.
but, on the other hand, perhaps we could run another oil pipeline, two or three NG pipelines, several HVDC lines bringing wind-generated electricity, and and a couple handfuls of double-tracked rail lines to carry the vast amounts of Alaskan Coal and other minerals from the far North, along the NWAPA canal system bringing water from AK and Canada to the parched U.S. and Mexico. Power for all can be provided by ECATS replacing every home, commercial, and industrial furnace/AC/Heat Pump, fueled by the almost limitless nickel mined from asteroids, with the side effect of plentiful copper for wiring for our electric future.
OK, breathe...just pulling your leg.
Without a ZPG and indeed a reasonable population reduction strategy affected by a strictly managed sub-replacement birth rate, followed by a level off at some sustainable population maintained by a strictly managed replacement birth rate, all those epic civil engineering fantasies would only result in continued major-league overshoot and even bigger pay-the-piper consequences down-line.
...Unless we invent warp drive and complete mastery of matter/energy transmutation, in which case most of the atoms of the known Universe can be converted to human flesh (or Kurzweil computer engrams in super-nano quantum energy fields) in about another two thousand years (maybe sooner).
After that...the Mufti-Verse would be our calling and our only salvation.
This cornocopian tripping is enticing...I can see why people take the various varieties of blue pills...
If there is oil for tractors to be produced from ANWR, it will likely be best accomplished before the pipeline freezes. (Was KIC-1 a dry hole?)
http://ngm.nationalgeographic.com/ngm/0605/feature1/text6.html
https://www.gasandoil.com/news/n_america/3b38b087544a39c7dad052b6e7fd8d7f
Setec Astronomy
but wait, there is this for the rock-lickers:
http://www.alaska.boemre.gov/icam/1992/95.pdf