| Is Shale Oil Production from Bakken Headed for a Run with “The Red Queen”? | The Oil Drum | Tech Talk - An Introduction to Iran |
Comments on Maugeri's Oil Revolution - Part I
Posted by Luis de Sousa on September 27, 2012 - 4:15am
This is part I of a guest post by Jean Laherrère, long term contributor to The Oil Drum. Jean worked 37 years for TOTAL on exploration and production of oil and gas, and since his retirement has worked tirelessly to analyse the world's oil & gas data and developments.
Leonardo Maugeri is an economist who worked for ENI since 1994, where he is currently on a sabbatical leave. He is also a senior fellow at Harvard University. In October 2009 he wrote an article in Scientific American entitled "Squeezing More Oil From the Ground: Amid warnings of a possible "peak oil," advanced technologies offer ways to extract every last possible drop”, which is now found with another title: “Another Century of Oil? Getting More from Current Reserves”. At the time, I wrote some comments on The Oil Drum in response: “Comments on Squeezing more oil from the ground by L. Maugeri Scientific American October 2009”
Recently, Maugeri published a new working paper, "Oil the Next Revolution: The uprecedented usurge of oil production capacity and what it means for the world". I again disagree with L. Maugeri’s stance that oil production capacity is surging, because production capacity data is completely unreliable, based on guesses and not on real measurements. Only oil production data should be used for forecasting purposes; his forecast on non conventional oil is also flawed. L. Maugeri has a poor understanding of the accuracy of oil data and his statements are in my view political and not scientific. His paper does not deserve to be on the website of Harvard University, a centre for science.
Below the fold are my comments on Maugeri's Oil Revolution discussion paper.
Summary
My analysis highlights a number of errors of fact and analysis in Maugeri's work. These include:
- Carrying out analysis on productive capacity, where such data are very poorly known; and only very weak conclusions can be drawn.(Section 2)
- In his data of possible future oil production by an “original, bottom-up, field-by-field analysis of most exploration and development projects in the world”, a significant proportion of the amount accounted for derives from proposed projects in Iraq, where the likelihood of early, and full, implementation is doubtful, as Maugeri should have pointed out.(Section 2)
- Maugeri uses OPEC data without indicating the serious flaws in these data. (Section 2)
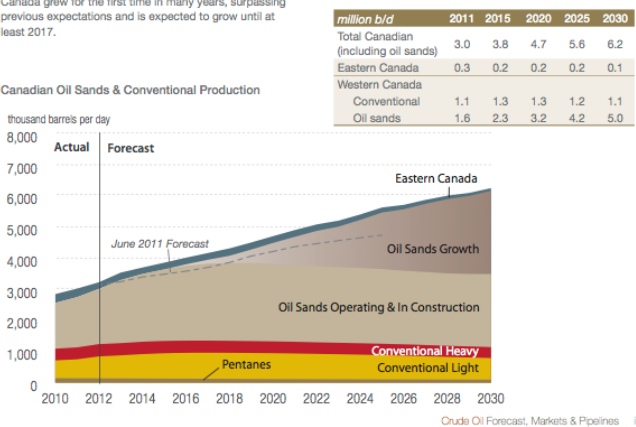
- His projection of Canadian tar sand production is significantly higher than the projections of the Canadian Association of Petroleum Producer's (CAPP). (Section 2)
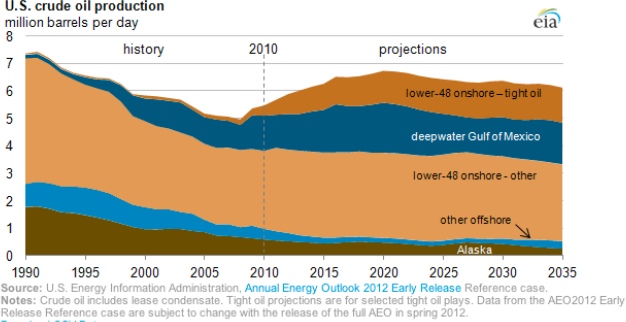
- Likewise, his US projections are higher than those from the Energy Information Administration (EIA) (Section 3); and in case of the Bakken production he has used data from an early optimistic report instead of subsequent more reliable studies. (Section 5)
- Maugeri is wrong to assert that conventional oil production recently surged, it has been in a plateau since 2005.(Section 4)
- If the oil price stays high, it is true that considerable work will be done to increase recovery from existing fields. But Maugeri’s data on reserves growth, which underpins much of his thinking and analysis, is based partly on a USGS study where the apparent reserves growth was almost entirely in a few OPEC countries, with the data being questionable. Also, on reserves growth, Maugeri - like many other economists - quotes Kern River, without pointing out the simple reasons why estimates of recoverable reserves increase in a century-old, heavy oil field; reasons which are quite inapplicable to the majority of oil fields. (Section 5 & To follow in part 2)
- Finally, Maugeri makes the usual error in not understanding the evolution of proved reserves data over time; not understanding the statistical under-estimation that results from aggregation; nor the fact that, under Security Exchange Commission (SEC) reporting rules, these reserves have been significantly less in the past than the "proved and probable" reserves; and so can be expected to grow.(To follow in part 2)
Overall, these findings make Maugeri's conclusions too erroneous to be sustainable.
1. The problem of using proper units
In page 1 of Maugeri's discussion paper we can read:
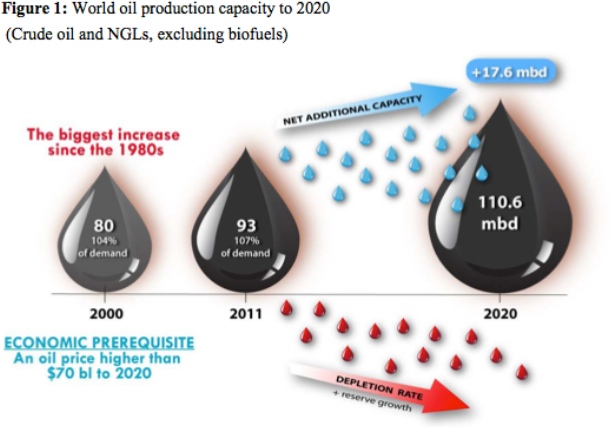
Based on original, bottom-up, field-by-field analysis of most oil exploration and development projects in the world, this paper suggests that an unrestricted, additional production (the level of production targeted by each single project, according to its schedule, unadjusted for risk) of more than 49 million barrels per day of oil (crude oil and natural gas liquids, or NGLs) is targeted for 2020, the equivalent of more than half the current world production capacity of 93 mbd.
In his list of abbreviations, “million barrels per day” is reported as Mbd, so why use mbd in the text? In fact it should be Mb/d. ENI must follow the SI (International System of units), which is the rule in every country outside the US, Liberia and Myanmar. By the SI, million is mega or M, m is metre or milli, d is day (dies) or deci, so mbd is millibarrel multiplied by days!
2. The inaccuracy of Production Capacity estimation
The field by field study presented by Maugeri is mainly based on Iraq contracts, which are unlikely to be realised due to political constraints. He continues:
the net additional production capacity by 2020 could be 17.6 mbd, yielding a world oil production capacity of 110.6 mbd by that date – as shown in Figure 1.
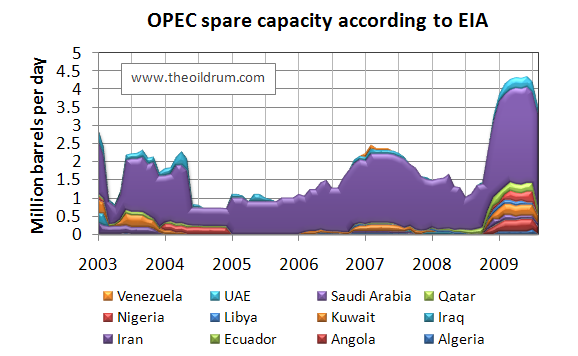
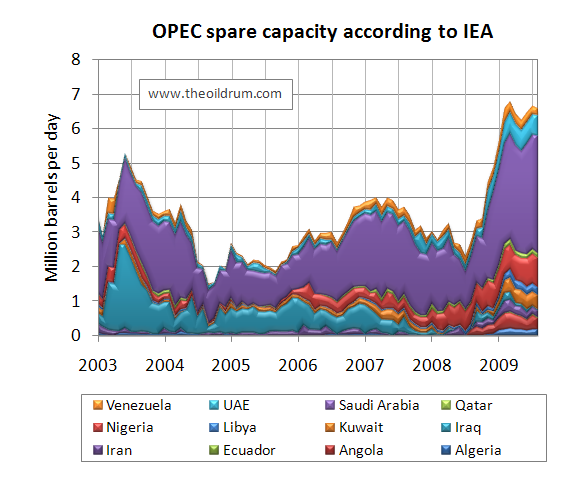
Oil production capacity is a very badly defined value and the data for OPEC spare capacity from the EIA and IEA differs widely, as shown by Rembrandt Koppelaar in these two graphs from 2003 to 2009. In the EIA reports the spare capacity in 2003 for the UAE varies little, while the IEA reports more than 2 Mb/d.
| Figure 1: OPEC spare capacity by EIA & IEA from Koppelaar 2003-2009 |
|
OPEC spare capacity is reported by the EIA with the following graph, showing an inverse correlation with the inflation corrected WTI oil price index (2010 $/b). And if OPEC capacity is shown, the title is for world spare oil production capacity! The EIA assumes that the non-OPEC production has no spare capacity.
| Figure 2: OPEC spare capacity by EIA 2001-2012 and WTI crude oil price |

|
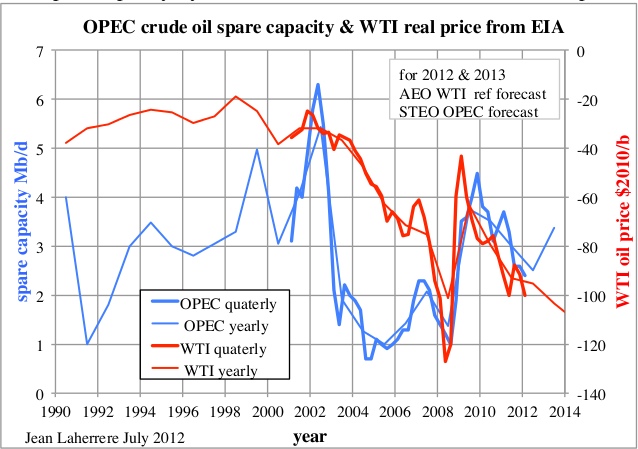
The EIA provides data since 1990 and a better presentation can be plotted for the WTI, shown here as a negative value. The relationship between OPEC spare capacity and the WTI may seem good on a periodic basis, but it is not very reliable. It is obvious that the “unprecedented upsurge of oil production capacity” claimed by Maugeri is the OPEC increase in 2009 (from 1 to 5 Mb/d), correlating well with the decrease in WTI from 120 $/b to 50 $/b. The meaning is clear for 2009: low oil prices correlate with high spare oil capacity. But, like the chicken egg and the egg, which came first? Spare capacity being a guess, it is difficult to time exactly the increase, depending on the brains of the author! OPEC annual spare capacity, as reported by the EIA, was 3.05 Mb/d in 2000 and 2.99 Mb/d in 2011: it means the same value over a long period. For the period 1990-2012 the EIA average is around 3 Mb/d, with up to 6 Mb/d and down to 1 Mb/d: usually a surge follows a fall! For a long term forecast, extrapolation from the past has to be made on the long term and not on the short term!
| Figure 3: OPEC spare capacity by EIA/AEO & STEO 1990-2013 and WTI price in negative scale |
|
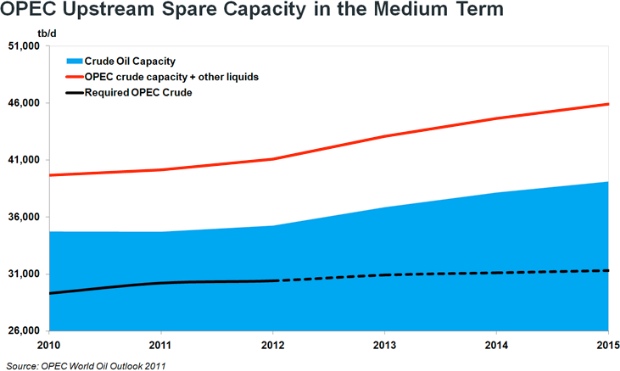
OPEC, in its monthly oil market report, does not mention OPEC spare capacity and in its annual report there is only the sentence: “OPEC crude oil spare capacity is also expected to remain at comfortable levels”, but no figure is presented! In the (last) OPEC 2010-2011 Annual Statistical bulletin edition, spare capacity is only mentioned in a note on page 10, quoting the 2005 OPEC Conference. It is only in the OPEC World Oil Outlook that a graph on spare capacity is given, since 2009 , stating that OPEC spare capacity was around 4 Mb/d in 2011 (against 2 Mb/d for the EIA) and should be 8 Mb/d in the medium term.
| Figure 4: OPEC spare capacity by OPEC WOO 2011 |
|
To estimate spare capacity, it is necessary to know exactly what the production is. But it appears that OPEC does not agree on what their production is. This graph uses secondary data sources, but it should be quite different, using data directly communicated by members! There are also discrepancies on capacity and production between OPEC presentations:
- Ch.Khelil “Oil production capacity”, OPEC seminar, September 2006.
- Dr Nimat B. Abu Al-Soof “Upstream Oil Industry Analyst OPEC“, May 2007 .
For 2003, Khelil reports OPEC capacity at 29 Mb/d, while al-Soof puts it at 31 Mb/d. The inaccuracy on OPEC capacity is more than 2 Mb/d.
| Figure 5: OPEC spare capacity by Khelil 2007 |

|
| Figure 6: OPEC spare capacity by al-Soof 2006 |
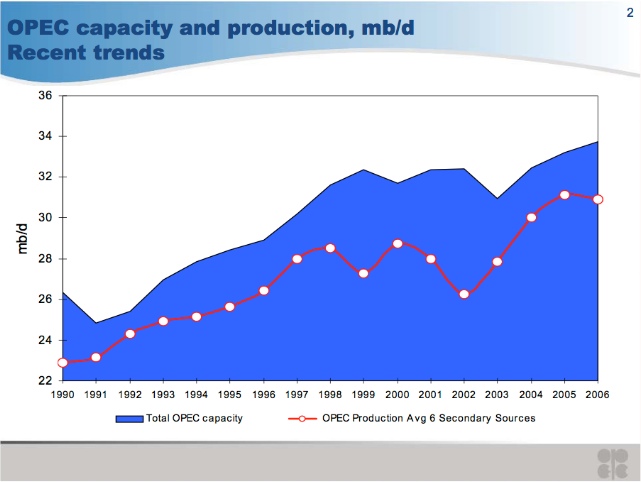
|
In fact, the reliability of OPEC oil production is very poor (because they cheat on quotas, and they cheat on production data or on its definition). OPEC reports mainly its production from secondary sources, meaning that the value reported by its members (called direct communication) is less reliable. The difference between secondary sources and direct communication varies (from -7 % for 1997 to 4 % in July 2012), in particular for Venezuela (from -25 % in 1997 to 19 % in July 2012). Direct data is often higher than secondary sources, but not always because of quotas.
| Table: crude oil production sources: AR 1998 & MOMR Ap 2012 | |||
| Mb/d | secondary source | direct communication by member countries |
difference % |
|---|---|---|---|
| OPEC | |||
| 1997 | 27.228 | 25.384 | -7 |
| 1998 | 27.726 | 28.100 | 1 |
| 2010 | 29.254 | 29.020 | -1 |
| 2011 | 29.776 | 29.942 | 1 |
| Feb 2012 | 31.176 | 32.107 | 3 |
| July 2012 | 31.619 | 32.964 | 4 |
| Venezuela | |||
| 1997 | 3.228 | 2.411 | -25 |
| 1998 | 3.137 | 3.409 | 9 |
| 2012 | 2.338 | 2.779 | 19 |
| 2011 | 2.380 | 2.795 | 17 |
| Feb 2012 | 2.379 | 2.785 | 17 |
| July 2012 | 2.370 | 2.831 | 19 |
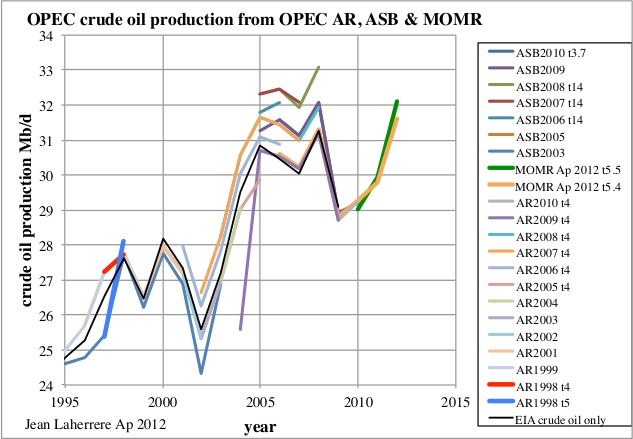
The data for OPEC crude oil production also varies with time between different OPEC Annual Reports (AR) and Annual Statistical Bulletins (ASB). For the year 2005, OPEC data varies from 29.9 Mb/d (AR 2005) to 32.3 Mb/d (ASB 2007 & 2008), while the figure reported by the EIA is 30.8 Mb/d . For the period from 2006 to 2008, there is a difference of about 1 Mb/d between the values from AR 2009 and ASB 2009. OPEC data is next compared to EIA crude oil production up to 2009 (EIA ceased to publish such data in January 2011 due to budgets cuts).
| Figure 7: OPEC crude oil production from AR & ASB OPEC reports compared to EIA crude oil (1980-2009) |
|
It appears that the accuracy of OPEC oil production is about 2 Mb/d!
World oil production capacity is badly known and completely unreliable,and its use should be avoided. Only CERA is forecasting production capacity, while reliable agencies forecast only oil production. Already the world oil supply data differs widely between sources (EIA, IEA, OPEC), mainly due to different definitions. For the period 1991-2012 the discrepancy could be plus or minus 2 Mb/d, and the most striking is the sharp change at the beginning of the year, due to a change in definition. The monthly data does not agree with the annual data, showing the uncertainty involved, varying with time and authors!
| Figure 8: difference for world oil supply (monthly & yearly) between USDOE/EIA, IEA & OPEC |

|
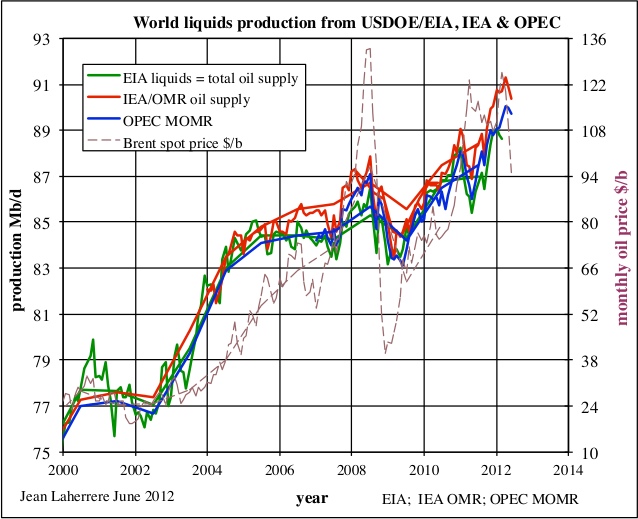
The EIA data is reported late and isn't subject to much revision. This agency has warned that it may stop reporting international data because of budget cuts!
| Figure 9: world liquids production from USDOE/EIA, IEA & OPEC with Brent oil price |
|
Using oil production capacity is adding more uncertainty, but it is a trick to claim in the future that the forecast was right by manipulating the data. In fact, past world crude oil plus NGL production data from the EIA gives an increase of 7.7 Mb/d from 2000 to 2011, against 13 Mb/d for production capacity in Maugeri’s Figure 1. As OPEC spare capacity from the EIA was about the same and Non-OPEC production is at or close full capacity (EIA Newell 23 Feb 2011), this 13 Mb/d looks wrong! There is no increase in US crude oil and NGL production from 2000 to 2011.
| EIA Mb/d | 2000 | 2011 | increase 2000-2011 |
|---|---|---|---|
| World | |||
| crude oil (& condensate) | 68.522 | 74.030 | |
| NGPL | 6.376 | 8.571 | |
| crude oil & NGL | 74.898 | 82.601 | 7.7 |
| US | |||
| crude oil | 5.881 | 5.659 | |
| NGPL | 1.911 | 2.183 | |
| crude oil & NGL | 7.792 | 7.832 | 0 |
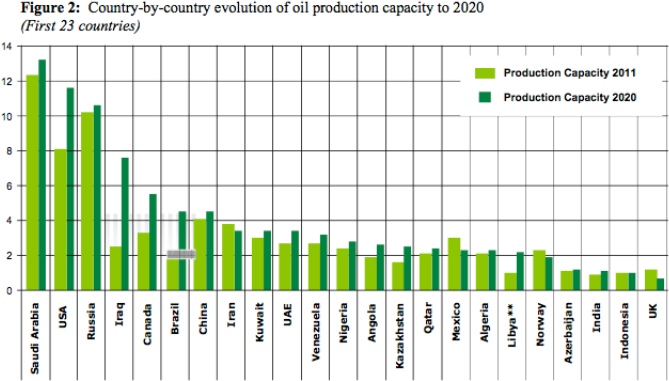
On page 3 of his discussion paper, Maugeri produces the following graph comparing production capacity between 2011 and 2020.
|
Let’s now compare Maugeri’s increase from 2011 to 2020 to official production forecasts in Mb/d. We can see the difference between his forecasts and that of the Canadian Association of Petroleum Producers (CAPP) being 1.2 mb/d higher for 2020. Similarly, his forecast is forecast for the United States is also 1.2 mb/d higher than the forecast of the Energy Information Administration.
| Canada Mb/d | Maugeri | CAPP June 2012 | Maugeri/CAPP |
|---|---|---|---|
| 2011 | 3.2 | 3 | 1.07 |
| 2020 | 5.6 | 4.7 | 1.19 |
| increase | 2.4 | 1.7 | 1.41 |
| Figure 10: CAPP June 2012 forecast on Canada production 2010-2030 |
|
| USA Mb/d | Maugeri | EIA/AEO2012 production | Maugeri/EIA | ||
|---|---|---|---|---|---|
| crude | NGL | crude + NGL | |||
| 2011 | 8 | 5.68 | 2.16 | 7.34 | 1.09 |
| 2020 | 11.6 | 6.73 | 2.79 | 9.52 | 1.21 |
| increase | 3.6 | 2.2 | 1.64 | ||
| Figure 11: EIA AEO 2012 forecast on US crude oil production 1990-2035 |
|
It is important to repeat, Maugeri can always claim afterward that he is right because his forecast is on capacity, which is a mere guess, as no one can state what capacity has been even in retrospect!. See the numbers for OPEC above. Every reliable forecast is on production.
3. Oil production in the USA
On page 4 of Maugeri's discussion paper we read:
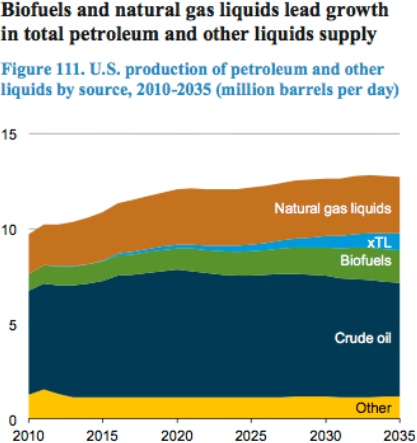
Thus, the U.S. could produce 11.6 mbd of crude oil and NGLs by 2020, making the country the second largest oil producer in the world after Saudi Arabia. Adding biofuels to this figure, the overall U.S. liquid capacity could exceed 13 mbd, representing about 65 percent of its current consumption.
In Figure 2 on page 3, shown above, Maugeri points to a figure of 11.6 Mb/d for production capacity in the US by 2020, but on page 4 it is indicated as production. He forecasts US liquids capacity for 2020 at 13 Mb/d, adding biofuels, but misses refinery gains, which for the US was 1 Mb/d in 2010. This a non negligible part of the US liquids production, which could come from imported oil but also from domestic natural gas used to make lighter products, being a kind of Gas to Liquids (GTL.
| AEO 2012 table A11 forecasts in Mb/d | |||
| Domestic production Mb/d | 2010 | 2020 | 2035 |
|---|---|---|---|
| crude oil | 5.47 | 6.70 | 5.99 |
| NGL | 2.07 | 2.91 | 3.01 |
| refinery processing gain | 1.07 | 0.94 | 0.85 |
| ethanol | 0.85 | 1.04 | 1.65 |
| biodiesel | 0.01 | 0.12 | 0.13 |
| CTL | 0 | 0 | 0.28 |
| total | 9.34 | 11.62 | 11.06 |
In its AEO 2012 forecast, the EIA includes an “other” category that is mainly refinery gains.
| Figure 12: EIA AEO 2012 forecast on US liquids production 1990-2035 |
|
Maugeri’s forecast of US production capacity of 13 Mb/d by 2020 seems significantly higher than the lastest EIA forecast!
Maugeri also claims that “in the first quarter 2012, average world oil production consistently reached or surpassed 91 mbd”. However, the data available publicly shows otherwise with EIA published 88.8 million b/d, IEA 90.7 million b/d and OPEC 89.2 million b/d, for world oil production in first quarter 2012.
4. Non-Conventional Oil flow rate expectations
On page 6 of Maugeri's discussion paper he states:
In the aggregate, conventional oil production is also growing throughout the world at an unexpected rate, although some areas of the world (Canada, the United States, the North Sea) are witnessing an apparently irreversible decline of the conventional production. Technology may turn today’s expensive oil into tomorrow’s cheap oil.
There is no consensus on the definition of conventional oil; for some it is the easy flowing oil, for others it is the oil from continuous-type accumulations. Maugeri states in page 14 the EIA definition for conventional oil: “produced by a well drilled into a geologic formation in which the reservoir and fluid characteristics permit the oil and natural gas to readily flow to the wellbore”. But the EIA does not provide the production data of so-called conventional oil and neither does Maugeri, he simply claims an unexpected growth for world production at present.
Extra-heavy oil (Athabasca & Orinoco) are obviously not conventional and the world crude less extra-heavy oil production from the EIA displays an increase from 1982 to 2005, but since 2005 it is plateauing at 72 Mb/d, contrary to Maugeri’s claim that conventional oil production is growing.
| Figure 13: world crude less extra-heavy oil production 1970-2011 |

|
Scrolling forward on page 8 of the report we read:
The unexpected and rapid increase of oil production from the forerunner of shale/tight oil (the Bakken Shale formation in North Dakota) is astonishing: production has grown from a few barrels in 2006 to more than 530,000 barrels in December 2011. This development seems consistent with the best study ever conducted on the geological features and potential productivity of Bakken (Price, 1999), which estimated the maximum Original Oil in Place of the whole formation at more than 500 billion barrels, with a probable recovery rate of about 50 percent.
The production data for Bakken (North Dakota) to date yields:
- 2006 – total production of 2.3 million barrels in the entire year;
- December 2006 – 10 kb/d average flow rate;
- December 2011 - 14.6 million barrels for the entire month;
- December 2011 - 510 kb/d average flow rate.
L. Maugeri, who is called by some a world oil expert, should know the difference between b and b/d, in other words stocks and flow rates. He should have made himself consistent with page 47 of his report where he writes, notwithstanding again confusing bd, b/d and b:
Thanks to the Bakken Shale, oil production in North Dakota skyrocketed from around 110,000 bd in 2006 (of which 7,600 boe/d in the Bakken Shale) to nearly 264,000 boe/d in 2010 and more than 530,000 barrels in December 2011.
The confusion can be found in the Bakken formation which is presently being produced not being the shale section, but the sandy limestone (or dolomite for Elm Coulee) in its middle: calling Bakken a shale play is wrong. It is a structural/stratigraphic play depending of the quality of the reservoir and it is called now light tight oil.
5. Non-Conventional Oil reserves and resources
When reading on at page 8 we find:
In April 2008, a report by the North Dakota Department of Mineral Resources (NDDMR) estimated that the North Dakota portion of the Bakken contained up to 167 billion barrels, and that approximately 2.1 billion barrels of that oil (the estimated ultimate recovery), less than 2 percent, could be recovered using 2008 technology. In any case, the report also recognized that technological evolution could dramatically increase the recovery factor.
In page 8 Maugeri quotes the Bakken oil in place to be 500 Gb (a maximum) with a recovery factor of 50%. But why chose an obsolete (1999) and controversial paper when many more recent estimates exist from the USGS, and in particular from the North Dakota Department of Mineral Resources, and mention them only in page 48? In the book written by the USGS geochemist Leigh C. Price “Origins and characteristics of the basin-centered continuous-reservoir unconventional oil-resource base of the Bakken Source System, Williston Basin” (1999/2000) it can be read:
In section 10.0, we present preliminary mass-balance calculations regarding the amount of oil generated by the Bakken shales in the Bakken HC kitchen of the Williston Basin (North Dakota and Montana). Our calculations suggest that 413 billion barrels of oil have been generated, with a potential upside of 503 billion barrels and a minimum of 271 billion barrels. These numbers are larger than three previously-published estimates of 92, 132, and 150 billion barrels”
The assumption of a recovery factor of 50% is well above the recovery in a conventional field and seems unrealistic. Price's 1999 paper is described as controversial by Julie LeFever and Lynn Helms in “Bakken Formation Reserve Estimates Julie LeFever” (ND DMR 2006):
Nature of the Controversy
The methods used by Price to determine the amount of hydrocarbons generated by the Bakken and the idea that the oil has not migrated out of the Bakken are under dispute.
Price (unpublished) used a more complete database and estimated that the Bakken was capable of generating between 271 and 503 BBbls of oil with an average of 413 BBbls. New estimates of the amount of hydrocarbons generated by the Bakken were presented by Meissner and Banks (2000) and by Flannery and Kraus (2006). The first of these papers tested a newly developed computer model with existing Bakken data to estimate generated oil of 32 BBbls. The second paper used a more sophisticated computer program with extensive data input supplied by the ND Geological Survey and Oil and Gas Division. Early numbers generated from this information placed the value at 200 BBbls later revised to 300 BBbls when the paper was presented in 2006.
How much of the generated oil is recoverable remains to be determined. Estimates of 50%, 18%, and 3 to 10% have been published.How much of the oil that has been generated is technically recoverable is still to be determined. Price places the value as high as 50% recoverable reserves. A primary recovery factor of 18% was recently presented by Headington Oil Company for their Richland County, Montana wells. Values presented in ND Industrial Commission Oil and Gas Hearings have ranged from 3 to 10%. The Bakken play in the North Dakota side of the basin is still in the learning curve. North Dakota wells are still undergoing adjustments and modifications to the drilling and completion practices used for this formation. It is apparent that technology and the price of oil will dictate what is potentially recoverable from this formation.
A Wikipedia article entitled History of Bakken oil resource estimates contains further details:
A landmark paper by Dow and a companion paper by Williams (1974) recognized the Bakken formation as a major source for the oil produced in the Williston Basin. These papers suggested that the Bakken was capable of generating 10 billion barrels (1.6×10⁹ m3) of oil (BBbls). Webster (1982, 1984) as part of a Master’s thesis at the University of North Dakota, further sampled and analyzed the Bakken and calculated the hydrocarbon potential to be about 92 BBbls. These data were updated by Schmoker and Hester (1983) who estimated that the Bakken might contain a resource of 132 BBbls of oil in North Dakota and Montana. A research paper by USGS geochemist Leigh Price in 1999 estimated the total amount of oil contained in the Bakken shale ranged from 271 billion to 503 billion barrels (8.00×10¹⁰ m3), with a mean of 413 billion barrels (6.57×10¹⁰ m3).[14] While others before him had begun to realize that the oil generated by the Bakken shales had remained within the Bakken, it was Price, who had spent much of his career studying the Bakken, who particularly stressed this point. If he was right, the large amounts of oil remaining in this formation would make it a prime oil exploration target. However, Price died in 2000 before his research could be peer-reviewed and published. Nevertheless, the drilling and production successes in much of the Bakken beginning with the Elm Coulee Oil Field discovery in 2000 have proven correct his claim that the oil generated by the Bakken shale was still there. New estimates of the amount of hydrocarbons generated by the Bakken were presented by Meissner and Banks (2000) and by Flannery and Kraus (2006). The first of these papers tested a newly developed computer model with existing Bakken data to estimate generated oil of 32 BBbls. The second paper used a more sophisticated computer program with extensive data input supplied by the ND Geological Survey and Oil and Gas Division. Early numbers generated from this information placed the value at 200 BBbls later revised to 300 BBbls when the paper was presented in 2006.".[15] In April 2008, a report issued by the state of North Dakota Department of Mineral Resources estimated that the North Dakota portion of the Bakken contained 167 billion barrels (2.66×10¹⁰ m3) of oil.[6]
While these numbers would appear to indicate a very large oil resource, the percentage of this oil which might be extracted using current technology is another matter. Estimates of the Bakken's technically recoverable oil have ranged from as low as 1% — because the Bakken shale has generally low porosity and low permeability, making the oil difficult to extract — to Leigh Price's estimate of 50% recoverable.[16] Reports issued by both the USGS and the state of North Dakota in April 2008 seem to indicate the lower range of recoverable estimates are more realistic with current technology.
The flurry of drilling activity in the Bakken, coupled with the wide range of estimates of in-place and recoverable oil, led North Dakota senator Byron Dorgan to ask the USGS to conduct a study of the Bakken's potentially recoverable oil. In April 2008 the USGS released this report, which estimated the amount of technically recoverable, undiscovered oil in the Bakken formation at 3.0 to 4.3 billion barrels (680,000,000 m3), with a mean of 3.65 billion.[5] Later that month, the state of North Dakota's report [6] estimated that of the 167 billion barrels (2.66×10¹⁰ m3) of oil in-place in the North Dakota portion of the Bakken, 2.1 billion barrels (330,000,000 m3) were technically recoverable with current technology.
In 2011, a senior manager at Continental Resources Inc. (CRI) declared that the "Bakken play in the Williston basin could become the world’s largest discovery in the last 30-40 years", as ultimate recovery from the overall play is now estimated at 24 billion bbls. This considerable increase has been made possible by the combined use of horizontal drilling, fracking, and a large number of wells drilled. While these technologies have been consistently in use since the 1980s, Bakken is the place where they are being most heavily used: 150 active rigs in the play and a rate of 1,800 added wells per year. CRI developed a technology allowing its rigs to move a few hundred yards on hydraulic "feet", increasing the rate of well completion.
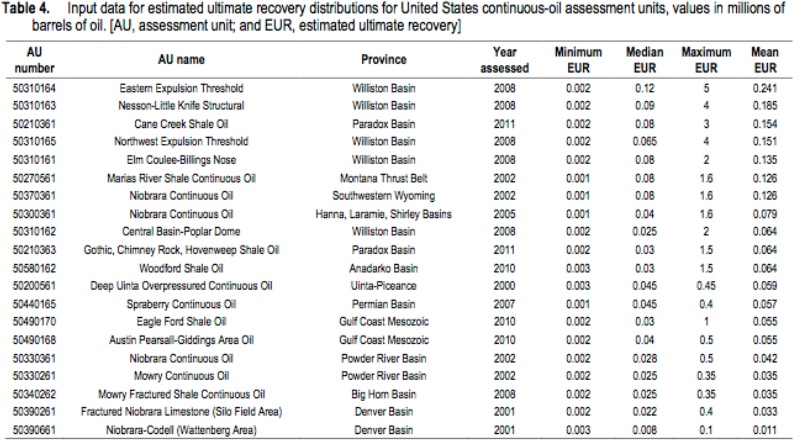
To add to the confusion, the USGS 2012-1118 report “Variability of Distributions of Well-Scale Estimated Ultimate Recovery for Continuous (Unconventional) Oil and Gas Resources in the United States” reports EUR (estimated ultimate recovery) in Mb when it should be in Gb. Shale oil is not called tight oil, but continuous oil. They speak about continuous oil but are obviously referring to discrete fields.
| Figure 14: USGS 2012-1118 table 4: estimated ultimate recovery in Mb |
|
The mean EUR for continuous oil assessment units in Williston Basin are:
- Eastern expulsion threshold - 0.241 Mb or 241 Mb?
- Nesson-Little Knife structural - 0.185 Mb or 185 Mb?
- Northwest expulsion threshold - 0.151 Mb or 151 Mb?
- Elm-Coulee-Billings Nose - 0.135 Mb or 135 Mb?
- Central Basin-Poplar Dome - 0.064 Mb or 64 Mb?
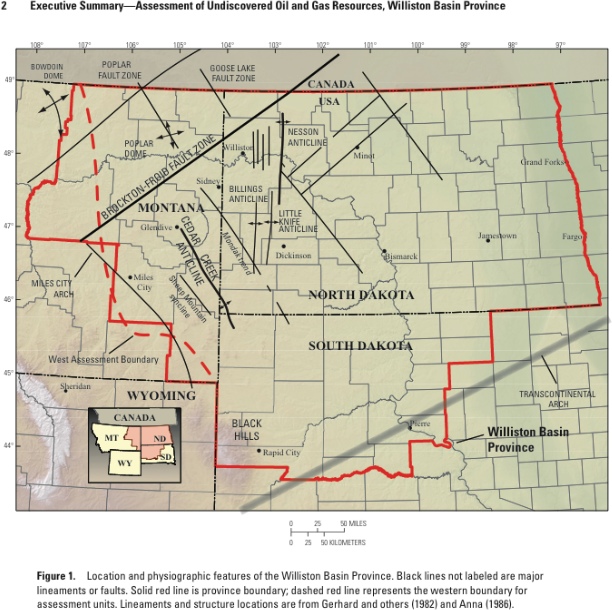
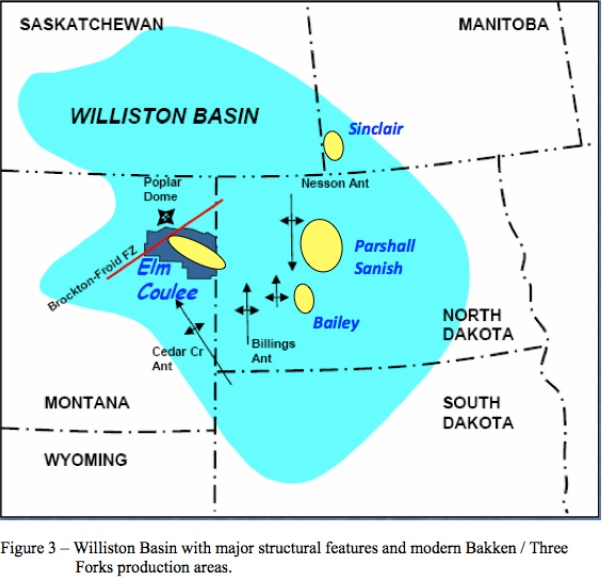
An earlier USGS report by the Williston Basin Province Assessment Team: “Assessment of undiscovered oil and gas resources of the Williston Basin Province of North Dakota, Montana, and South Dakota, 2010”, U.S. Geological Survey Digital Data Series 69–W, 7, 2011, displays a map indicating the main structural features.
| Figure 15: USGS 2011 DGS 69-W: map of Williston basin features |
|
This report estimates undiscovered resources for the main assessments units, being structural features (nose, dome) under the item of continuous oil & gas resources.
| Figure 16: USGS 2011 DGS 69-W: undiscovered resources in Mb & Gcf |
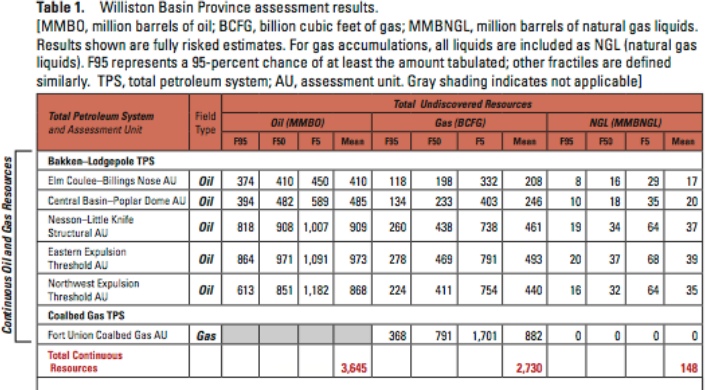
|
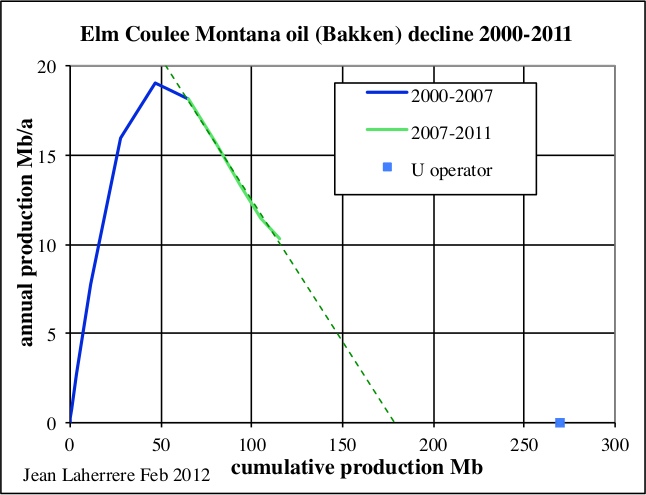
It is surprising to see that the undiscovered mean for the Elm Coulee - Billings nose is assessed at 410 Mb, while in the USGS 2012-1118 report the estimated ultimate recovery (EUR) is reported by at 135 Mb. It seems that this ultimate is not for the area but for the present discovered fields (in fact Elm Coulee). But the plot of the oil decline for Elm Coulee (in Montana) shows a 12 %/a decline from 2007 to 2011, pointing towards 190 Mb (and not 135 Mb) whereas the operator reports 270 Mb.
| Figure 17: Elm Coulee (Montana & Bakken) oil decline 2000-2011 |
|
Oil production in Montana displays an interesting sharp peak in 1968 at 130 000 b/d and a second peak, also sharp, in 2006 at 100 000 b/d.
| Figure 18: Montana oil production from Montana State & EIA |

|
It is likely that North Dakota will follow the same pattern as Montana, with a sharp increase and a sharp decline. But it is hard to guess the level of the peak, which depends upon the number of wells drilled: it could be this year or the next, though I doubt that they can keep adding producer wells at such rate, doubling the number since 2005. Contrary to what is said, it is not a continuous-type accumulation, but the sweet spots of fields. The best way to see that is to to look at the EIA video on Bakken drilling activity from 1985 to 2010.
| Figure 19: North Dakota oil production & producers |

|
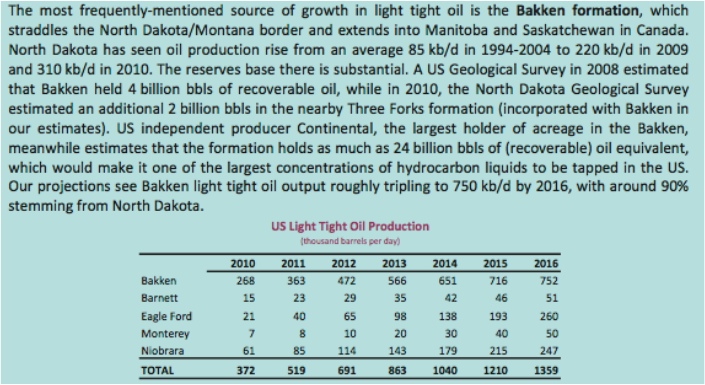
In “Medium-term oil & gas markets 2011” the IEA forecasts oil production in Bakken (called light tight oil) at 472 kb/d in 2012 (when it is already at 575 kb/d just for North Dakota alone in May 2012) and at 752 kb/d in 2016.
| Figure 20: US light oil production 2010-2016 for IEA medium-term oil & gas markets 2011 |
|
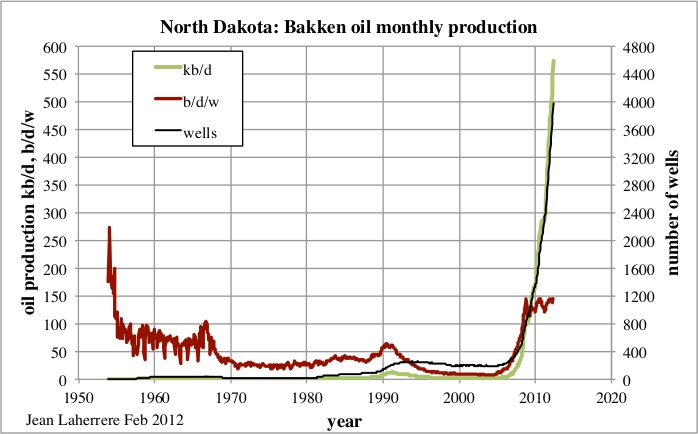
Present oil production in Bakken is increasing so sharply that it couldn't be forecast properly and is likely unsustainable. The production per well stays around 140 b/d/w; but it will fall as soon as the drilling slows down. The number of wells in Bakken went from 200 in 2005 to 4000 today.
| Figure 21: North Dakota: Bakken oil monthly production & number of wells |
|
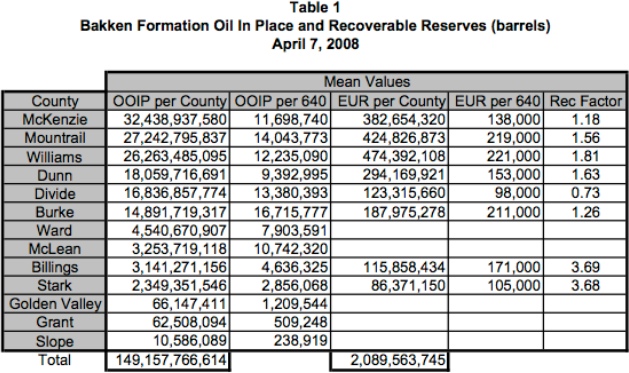
The North Dakota Department of Mineral Resources (ND DMR) described in 2008 the Bakken with a recovery of 1.4% of oil in place (149 Gb). In a reported entitled “State of North Dakota Bakken Formation Resource Study Project”, authors M. Bohrer, S. Fried, L. Helms, B. Hicks, B. Juenker, D. McCusker F. Anderson, J. LeFever, E. Murphy and S. Nordeng write:
The original oil in place in the Bakken Formation within the thermally mature portion of the State of North Dakota is estimated to be 149.2 billion barrels. The estimates are presented by County and separated into the total Bakken Formation, upper Bakken shale member, middle Bakken member, and lower Bakken shale member to make them more useful for resource evaluation and planning (Tables 1-4) and (Figures 3-6).
The Bakken Formation EUR using current drilling and completion practices within the thermally mature portion of the state of North Dakota has also been estimated. The estimated ultimate recovery is approximately 1.4% of original oil in place, which is equal to 2.1 billion barrels.
The structural features are shown for the Bakken/Three Forks production. The Three Forks formation is just a reservoir below the Bakken lower shale. It is the Bakken middle formation that produces, because it is not shale but a sandy limestone.
| Figure 22: Williston Basin Bakken features from ND DMR 2008 |
|
This report presents the oil in place in the Bakken formation disaggregated by county, summing up to 149 Gb with 2.1 Gb recoverable.
| Figure 23: North Dakota Bakken oil in place & reserves from ND DMR 2008 |
|
In a subsequent report, “Three Forks Assessment”, published in 2012, the DMR shows that the geographic distribution of the Three Forks oil is very unequal, with few sweet spots.
| Figure 24: North Dakota Three Forks oil in place in acre-foot oil from ND DMR 2010 |
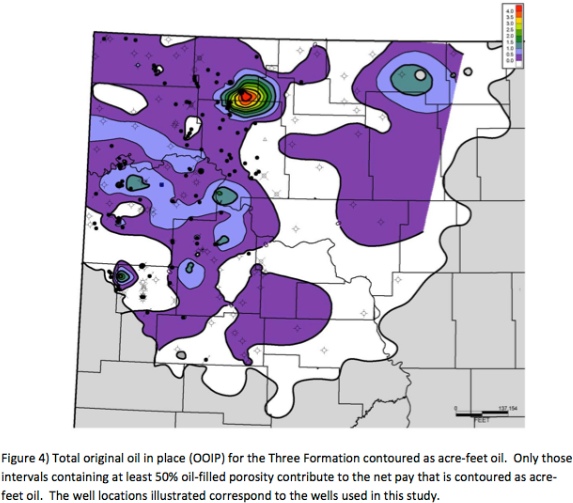
|
The total EUR is 2.1 Gb for Bakken and 1.9 Gb for the Three Forks, with a total of 3.9 Gb.
| Figure 25: North Dakota oil in place & EUR for Bakken & Three forks from DMR 2010 |
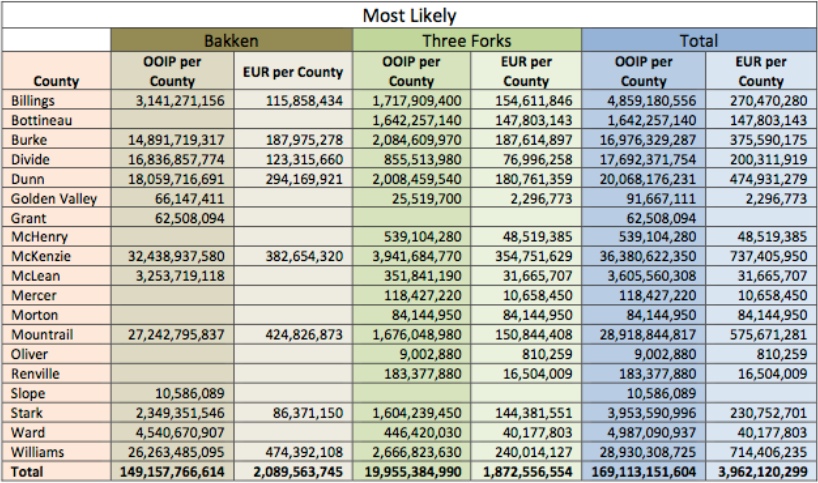
|
Maugeri is quoting unrealistic and obsolete reserve assessments for Bakken, by reporting 500 Gb of oil in place with a recovery factor of 50% (or 250 Gb of reserves). He neglects more recent studies, in particular by the agency knowing the most, the North Dakota Department of Mineral Resources.
In the second part of this article Jean tackles Maugeri's reserve growth predictions, looking into several giant oil fields and some of the largest oil exporting countries.
Acknowlegdement
Thanks to Roger Bentley for review the article and helping with the Summary.
Contact
- Content: editors at theoildrum dot com
- Tech support: support at theoildrum dot com
License

This work is licensed under a Creative Commons Attribution-Share Alike 3.0 United States License.
Jean - Great work as usual but no less than the TODsters expect. We've becomes spoiled with having such well documented analysis presented. It's an easy matter to disagree with any stated position but when such presentations are made with little support it's difficult to refute many assertions in detail.
I'm particularly pleased that you pointed out that much of the Bakken production dynamic is rather dissimilar to nearly all the other shale plays. I knew enough about the reservoir to understand the distinction but not enough make a good argument. Like the other shale plays fractures (natural and manmade) are important but the Bakken also gets a significant contribution from recovery from matrix porosity while the other plays have virtually none...they only drain the fracture volume.
The other very note worthy aspect I also lacked the ability to explain was the distribution pattern of historic production. I've seen many comments indicating an assumption that similar productivity was expected basin wide in the Bakken. Just observing the distribution of older and new wells it's clear that isn't the case. Companies familiar with the trend knew where the better productive areas were and logic would lead one to assume that's where they would concentrate as technology and prices improved. I think it's a bit early to fully accept some of the statistics recently presented by Rune but the short term trend was clear. In just the last several years the average first 12 month cumulative production from all Bakken wells decreased from 70,000 bopd to 52,000 bopd. Folks debate the significance of initial flow rates, curve fitting techniques and projections of EUR. But the 12 month cum stat requires no such efforts...its pure data available for analysis.
IMHO one reasonable explanation is that earlier wells benefited from the sweet spot knowledge operators had developed over the decades. As the better locations were drilled only the lesser quality drill sites remained. I've seen that pattern in every new play development for the last 60+ years I've analyzed. But what's very different in this Bakken stat is how quickly that transition appears to have occurred. Typical it takes the better part of a decade or more. Making the decline even more surprising is that during the same period operators were drilling longer laterals with more frac stages. I would have thought the increased (and expensive) efforts would have at least held recovery steady. This is another reason I hesitate to push this transition theory too hard.
OTOH Rune's work led me to make a similar analysis of the initial 12 month recovery from the Eagle Ford Shale in Texas and found the same pattern. But I'm less confident in that correlation given the relative low well count over the period. OTOH during the last 12 months over 1,400 new EFS wells have been completed. In another 12 months we should have a very reliable stat indicating whether the formation is in a rapid transition from sweet spot drilling to not so sweet spots. Despite what some believe the EFS is not a new play. Wells have been drilled and completed on the EFS for decades. Like the Bakken, operators had some early knowledge of the locations of the sweeter spots.
ROCK,
A bit of a side trot here. Came from what was essentially a presentation by one of your fellow Texan oil geologists (well he's from Austin so maybe that's the wrong club). Anyway Great Bear's (his company) web site gives this timeline of well completion tech.
The chart certainly makes it look like a whole lot of progress has been made in the fracing realm the last decade. Since you've repeatedly posted that the recent advances really aren't that significant in terms of production per well (or was that per field?) I thought I'd ask your interpretation of the graphic. Hope you have a chance to repy. The illusion of great progress in oil recovery is central to Jean's post so this isn't totally off track.
Luke - Soc. of Petroleum Engineers. From 1996: http://www.onepetro.org/mslib/servlet/onepetropreview?id=00036721
"There have been more than 4500 laterals drilled in the Austin Chalk...The first horizontal wells were drilled in the Austin Chalk in the mid 1980's in Pearsall field. Horizontal drilling activity grew rapidly from south Texas into Louisiana. The average recovery from these wells varies greatly from area to area and are as high as 500,000 barrels per well in some areas."
Notice that 500,000 bo recovery stat is similar to what some of the most optimistic folks are offering for current shale plays.
Again from the SPE - http://www.onepetro.org/mslib/servlet/onepetropreview?id=00020683
"Since 1985, Oryx Energy Company has used horizontal drilling and completion technology in the Pearsall Field of South Texas for increasing production rates and developing reserves in the naturally fractured Austin Chalk formation... The lateral hole lengths range from 150 to 4,800 feet. The three stimulation methods discussed are water fracs, acid washes, and acid fracs."
Notice that was 27 years ago. From a EIA report in 1993: " For example, in the Austin Chalk reservoir of Texas’ Giddings Field, under equal pressure conditions, horizontal completions of 500 to 2,200 foot HD produce at initial rates 2½ to 7 times higher than vertical completions.... Routinely achievable horizontal displacements have rapidly climbed from 400 to over 8,000 feet."
Did you catch that:"...8,000'? Over 20 years ago I drilled dual wing (5,000' EACH) horizontals in the AC. And more recent report...Aug 2012: http://www.aogr.com/index.php/magazine/frac-facts
"...to March 17, 1949. A team composed of Stanolind Oil Company and Halliburton personnel converged on a well 12 miles east of Duncan, Ok., to perform the first commercial application of hydraulic fracturing... Fast forward to 2012, and hydraulic fracturing has allowed commercial hydrocarbon recovery from more than 1 million wells that would not have produced as economically, if at all. Moreover, it was hydraulic fracturing that ushered in the age of unconventional resource plays,...Throughout the 1950s-60s, the technical achievements in fracturing consisted primarily of developing fluid systems that could carry increasingly larger volumes of sand. In the 1970s, the term “massive hydraulic fracturing” entered the lexicon..."
Those massive hydraulic fracture treatments of the 1970s placed larger PER STAGE volumes in vertical wells to what is now being placed in a single stage in a typical horizontal shale well. By some estimates, more than 2.5 million frac treatments have been pumped. In 1978, 34 years ago, I did a 500,000 lb frac on a vertical well in Texas....34 YEARS AGO. In the current hz drilling and frac'ng efforts individual frac stages usually don't exceed 150,000 lbs. A simple analogy: I hit a rock once with a hammer and break it in two. Now I take the same hammer and hit the rock 20 more times and make a lot of small pieces. Did I invent a new rock breaking technique? Not hardly...I did the same thing but just did it a lot more times. Over 25 years ago we were drilling hz wells the same length that are being drilled today in the shale plays. And typically we're pumping smaller fracs PER STAGE today then we were pumping 25 years ago. Some of the big red Halliburton pumps trucks used today were in service pumping the same stuff over 20 years ago.
Big Bear's website does exactly what its designed to do: pull in unsophisticated investors. Which isn't to say they are doing anything improper. They may a good outfit to invest in. But if they were presenting their projects to other operators, like me, it would look nothing like what they put in front of others. For instance that little column with the ever decreasing permeability: that's the rock matrix perm. Absolutely meaningless. Once you get below 0.1 md the shale matrix rock contributes no significant volume of oil/NG. All the production is from the fractures. Which is why the Bakken IS NOT a typical shale play: it has areas where the coarser matrix porosity can contribute to the production stream. If Mr. Big Bear tried to blow that smoke up my butt I would thank him for the presentation and then throw his brochure away after he left my office. And never take another phone call from him. I've mentioned it before and I wasn't kidding: we do have a term we use all the time for unsophisticated investors who swallow a promoter's tale: a mullet. Yes...it's an insulting term and it's meant to be. If I'm going to talk to a potential partner in one of my wells and someone tells me they are a mullet I know exactly what they mean. And I won't allow a mullet to join me in a project. And that has nothing to do with my looking out for them. Unsophisticated investors are an aggravation because when something goes wrong or the well is unsuccessful they have trouble factoring what they don't understand. And sometimes that ignorance has them calling their lawyer. That's grief I can live without. LOL.
Jean is correct about the great progress in oil recovery in recent times. And that has been primarily due to higher oil prices IMHO. Just as there had been great progress in NG recovery a few years ago utilizing the same tech being used today in the oily shales. And that great progress came to a crashing halt when NG prices collapsed at the end of '08. The east Texas shales are still there and the tech is still available so why has the NG rig count gone into the toilet? I can't imagine what would knock oil prices down now other than a major global recession. But if it did happen we would see the rig count in the oily shales go down the toilet also despite all this "new" tech that has arrived to save the day. LOL.
[a couple small edits for accuracy]
Thanks for the well thought out reply ROCK. I thought the response would carry much more weight coming from you--I was pretty darned sure the the permeability numbers were strictly there to create an exaggerated impression of huge recent progress, which made me immediately suspect the significance of the square footage increase, though with less confidence. If you could dissect that column a little more I'd appreciate it, the 'Frac Facts' magazine article doesn't quite clear that up for me
It is really tricky to figure who Great Bear (I like the name Big Bear you gave them though) is trying to sucker in. They are a private company and last I read had relatively few investors. The presentations (a university geologist, training center head and state senator all had a piece in it) came off more like a community pep talk than anything else. I asked a couple questions (about truck loads needed per well completion-there is only one 400 mile long road of uneven quality that goes to the play and Prudhoe--and price per barrel needed to break even) and was side stepped by the smooth talking CEO/geologist--but the questions must have hit a nerve as after he 'answered' me his expression darkened and showed something other than the suntanned confidence he exuded the rest of the time. He did let out he thought all non conventional oil players would be getting nervous if the price stayed under ~$80/barrel any length of time but after fully regaining his composure later on merely said the $85/barrel number I threw out for Bakken profitability was quite a bit above what their analysis showed and that Texas shale plays came into the black at even lower oil prices.
As he is really talking up using the huge brackish underground reservoir (a couple thousand feet down but overlaying a huge section of or possibly nearly the entire source rock region, sorry I didn't take notes but at the very least the reservoir would handle the next 15 years drilling) for the frac'ing. I thought a bit more details on that would have been forthcoming. When questioned Mr. Big Bear merely said Halliburton (their current partner in the drilling) has been working on frac fluid chemistry big time for a long time and the saline properties of the reservoir water made it almost the perfect frac fluid for this play. No doubt it is important to the project feasibility that that is the case as right now they are hauling their water from the Prudhoe, still a fair piece up the road to the north. Do you know whether or not subsurface saline water reservoirs are being used for frac'ing anywhere at the moment.
We did get to see a really cool picture of the core break that had been done on the site the night before, nice shiny black break following the contours left by a layer of what could best be described as clam shells--I think it came from the Shublik Formation just above where they were to stop drilling the #2 exploration well.
Interesting your comment about mullets calling a lawyer. Mr. Big Bear introduced his wife, one of the company co founders, and gave chief counsel or some such as one of her titles--sounds like an attorney to me (I'll use the term they seem to prefer this time LOL).
I guess I should have looked at the handout. One VP, Mrs. Big Bear, is VP-Corporate, General Council & Secretary--and a practicing lawyer in the State of Texas since 1987. The VP-Finance & CFO graduated first-in-class in Law and Accounting, Queens University. Is that typical makeup of independent oil companies upper echelons these days?
What is interesting in that BigBear graphic is the progression of the permeability of the reservoirs.
The permeability is going down by an order of magnitude for each new technology introduced.
I don't understand all the intricacies of geology but I do understand the mathematics and physics of diffusion.
What this means is that the production rates of oil are now becoming completely diffusion-limited. In other words, the flow of oil is essentially a random walk from the source to the destination. All these new technologies are doing is exploiting the capabilities of diffusion-limited capture. This is the bottom-of-the-barrel stuff, kind of like driving your car off of fumes, or keeping your maple syrup bottle upside down, to make an analogy out of it.
The Bakken rates are likely all diffusion limited and I will be willing to bet this based on some of the data from Mason.
http://www.sbpipeline.com/images/pdf/Mason_Oil%20Production%20Potential%...
From Mason's data, the flow of oil out of a hydraulically fractured well appears to be controlled by diffusional dynamics.
This is what an average Bakken well decline looks like if one uses Mason's charts.
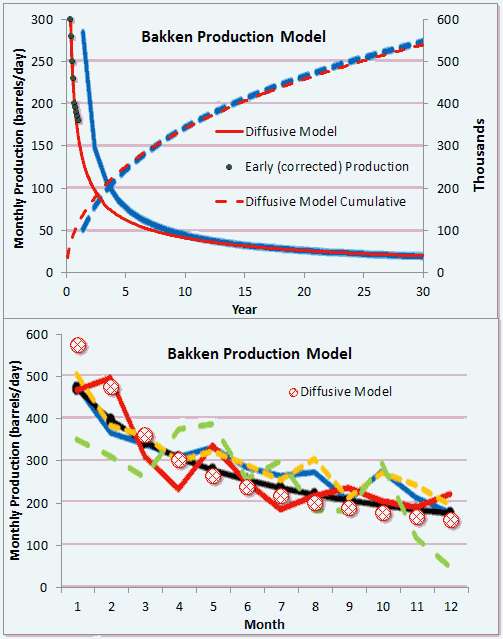

The cumulative is the important part of the curve I believe because he plotted the instantaneous production incorrectly (which I tried to correct with the black dots).
But then if we look at Brackett's analysis of Bakken (see below), I can better fit the average well to a hyperbolic decline model. A hyperbolic decline is an ensemble average of exponential declines of different rates, assuming maximum entropy in the distribution in rates (this works to describe lots of physical phenomena).
That conflicts with the diffusional model that better describes Mason's data.
Now, I believe it's possible that Brackett simply took the 1/e decline point on each well and then tried to extrapolate that to an average production. That's the easy way out and is definitely wrong as this will always approximate a hyerbolic decline; of course I can check this if I can get access to the 3,694 samples that Brackett says goes into his analysis.
Mason and Brackett can't both be right, as there are sufficient differences between diffusional flow decline and hyperbolic decline to impact projections. The former is steeper at first but has a fatter tail, whereas the latter will definitely decline more in the long term. Brackett says the average well will generate 250,000 barrels of oil while Mason shows twice that and still increasing.
Rune Likvern has a lot of the data that he painstakingly scraped from PDF files. There will be more data forthcoming in the next few years. We will see how it pans out.
Luke H,
It is just me still lurking around wondering about the Great Bear presentation and also the number of truck loads that goes with the development speed, i.e. how many wells that monthly is put into production.
In a previous comment you mentioned something about plans for around 200 wells a month which should total around 250 000 truck loads a month (not counting the return trips, and some movements will be over shorter distances as rigs are being moved around for new drill sites.). To cut a long story short and just for illustrations let us say that monthly there will be a total of 360 000 heavy truck loads (and some of them are return trips).
An activity level of 200 wells/month would thus translate into something like 12 000 heavy truck loads on your average day, that is an addition of 500/hour with heavy trucks, then adjust for weather and rest for the truckers to get an idea of traffic intensity during the day.
The other thing is logistics for the consumables for making this happen, storage at terminals etc.
The break even price for shale oil is very sensitive to the total (cumulative) flows during the first 2-3 years of operations.
That is one of the things with shale oil, a lot of money has to be invested/committed into the well and normally (as for 95% of the wells) the commercial viability will be proven after the well has flowed for some time.
Rune
Rune
Actually I just added a comment to the other post. However the 200 well/month number I threw out earlier was talking about the Bakken recent peak, sorry if I created confusion there. 250 wells a year is the biggest number I've seen Great Bear toss out and and yesterday the full blown buildout number given was 192 wells a year which would entail the construction of some 50 miles of gravel roads a year connecting eight new pads a year.
I had a brief conversation with the CEO/geologist. He did say they were using a discount rate somewhat higher than 7-8% in their calculations and that even with that the $85/bbl number I threw out was a fair amount above the oil price they needed to make the play pay. They have only just completed their second exploration well and have yet to run the results through thorough analysis, so some numbers would seem subject to substantial adjustment.
They do plan to get water for frac'ing out of the subsurface brackish reservoir and pipe it throughout the project in poly pipe. I've no clue whether this would be a pioneering effort for this technique. All very challenging in an arctic environment regardless, with long periods of cold in the forty below range. However not moving the drill rigs off pad for 24 holes and not having to truck water greatly reduces the trucks per completion count.
[edit add]
I'm guessing gravel hauling will be big part if not make up the bulk of the trucking by that stage of the project (assuming it can get that far) and those are relatively local loads--at the very least they would be confined to the north side of the Brooks Range.
It would seem diesel for all operations could be refined on the slope and who knows if it might not be more economical to use the associated gas produced with the shale oil for as much of the operation fuel as possible.
All very fun to contemplate but far from where the project lies now--trying to get a Environmental Impact Assessment approved for the next stage of development rather than having to come up with the full fledged and much more time consuming Environmental Impact Statement
Luke H, thx!
Break even price is a lot of flow and EUR.
Decisions about drilling wells are based upon informed expectations.
The fact that the wells go through three seperate source rock zones on their vertical trip seems at least in part to figure into the expectations.
Of course right now there is a political play by the governor and his former oil company employers to change the state tax structure on oil. Great Bear has weighed in on the side for changing the law while the state senator that hosted the discussion has been aligned with the forces who are not in favor of a wholesale rewrite. It can be difficult to find the fire through all the smoke generated in such a political environment.
Rune/Luke – Good conversation. I’ve rattled on many times about the unique motivation of public companies to chase projects that don’t have the greatest profitability. But the Bear boys are privately owned. Let me expand on that business plan. A warning first: as I go into the details don’t start thinking I’m describing an illegal or even immoral process.
A very typical example: I own the Little Cub Oil Company…100% privately owned by me and my partners. I’ve spent $3.5 million putting together 6 prospects. I spent money on shooting 3d seismic, paid good salaries to some top notch geophysicists to interpret the data, paid landmen good salaries to lease the acreage on those 6 prospects. That $3.5 million also includes the salaries me and my partners were paid. The entire process took 2.5 years from start to where I am today: looking for the capex to drill those 6 prospects.
Three weeks ago I had a booth at the Houston NAPE (North American Prospect Expo) where I had some great displays showing those prospects. Lots of foot traffic: oil companies, hedge funds, private investors, etc. I had two companies offer to buy my prospects at my asking price. The trade: a total upfront buy in price of $3.8 million. In addition the two buyers will pay 100% of the cost to drill and complete the 6 wells. My leases have a 25% royalty going to the land owners. My geophysicists share a 2% overriding royalty. Thus the working interest owners (Little Cub and the two buyers) earn 73% of the revenue from the wells.
The wells are drilled on a fairly standard 1/3 for a quarter promote. IOW an investor pays 1/3 of the cost of the well and earns ¼ of the net revenue. Or the investors pay 100% of the costs and earn 75% of the revenue. So where does that 25% go? To Little Cub, the prospect generator and promoter.
So the numbers: the investors pay $3.8 million plus $26 million to drill the 6 different prospects. How much does Little Cub have invested by the time the wells are drilled? It has -$300k in the deal. IOW words if all 6 wells are dry holes Little Cub walks away with a $300k profit and the investors lose $29.8 million. And what if all 6 wells are successful and produce a net income of $100 million? Little Cub makes $25.3 million, the geophysicists make $2 million and the investors make $49.4 million (about double their investment).
Another possibility: the 6 prospects are shale plays (and not very good ones) and ultimately net only $20 million. The score card now: Little Cub makes $5.3 million profit, the geophysicists make $400k and the investors lose $9.3 million. So under this scenario were the shale prospects successful? Well, they did generate $20 million in revenue, Little Cub and the geophysicists made a nice profit. The investors…not so lucky. Even if the 6 shale wells produced a bit more revenue then it cost to drill them (and thus could honestly be called successes) the investors could still post a loss. This is not just a hypothetical situation: I’m in the process of negotiating such a deal for 6 conventional oil prospects.
The only way a private promoter loses money is if they don’t sell their deal and thus have to eat their sunk costs. And how much profit can an unsuccessful promoter make? About 33 years ago I watched a promoter drill 18 dry holes in a row for a joint venture group and their senior staff retired millionaires. This was during the late 70’s boom time when companies were desperate to buy into drilling projects.
There are honest promoters who put good quality prospects together that sell them at a fair price to investors who know what they are doing. And then there are the rest of them. So the question an investor has to answer is which group does Great Bear fall into? And does he know how to make that distinction?
Luke – “The fact that the wells go through three separate source rock zones on their vertical trip seems at least in part to figure into the expectations.” Was that a part of their pitch to lure investors in your opinion? If so I have no problem qualifying it exactly for what it is: 100% BS designed to impress the unsophisticated novice. But that doesn’t mean the statement is untrue: you cannot drill a well anywhere in the GOM Basin that doesn’t penetrate any number of source rock. The Basin is one of the greatest hydrocarbon kitchens on the planet. If they are using this aspect to make their potential look better then it borders on fraud IMHO. At the very least it’s an intentional misdirection: look at all the pretty source rocks in my right hand...no need to look at the quality of the prospects in my left hand.
ROCK, Luke thanks.
Understanding the geology, technology, potential for production and the role/importance of the commercial model is key. I have seen cases which suggests poor understandings of how risk/reward is distributed and who is left holding the bag if expectations are not met.
Then there is herd mentality (mixed with various portions of greed); as enough people/companies starts to run in one direction, some fear they will be left out and takes “the risk” and jumps in.
Rune – “I have seen cases which suggests poor understandings of how risk/reward is distributed.“ A slow day so I’ll toss out another actual example that emphasizes the deadly combination of herd mentality, greed and inexperience. Every word true…better than anything I could make up. Back in the late 70’s I was Division Development Geologist for a CA based exploration company. They were flush with a big credit line: they owned a piece of a recently discovered 1 billion bbl oil field in Indonesia.
So they started a US division at the beginning of the boom. They quickly hired a staff of incompetent and/or dishonest and/or light experienced (like me) hands and quickly spent $550 million to find about $60 million worth of oil/NG. The president few in from CA for a presentation to discuss the poor results. One metric addressed was the company’s finding cost which was running about 50% higher than the price of oil. After hearing the presentation he said he knew how to fix the situation. While the economics of the few successful projects we had weren’t too bad when you factored in the dry holes the numbers got very bad. His solution: focus on the types of prospects that worked and avoid the types that failed. IOW let’s just drill successful type prospects. Thank you fearless leader. A couple of managers chuckled at first thinking he was making a joke to lighten the mood. He wasn’t. Within 4 years they were liquidated under bankruptcy.
So how did they find a 1 billion bbl oil field? They didn’t. A joint venture had been drilling one dry hole after another until finally one partner dropped out and sold the interest for almost nothing to a guy he played golf with…the president of my company. The company had no geotechnical staff…they were a real estate/shipping company. All they did was write a check. The very next well found the billion bbl field. They had financed all their oil patch operations based upon their share of that field. They eventually had to file bankruptcy when they couldn’t pay $1 when the bonds came due. The crash of oil prices in the early 80’s killed their credit line. And they were not alone. The exuberance of the boom had destroyed hundreds of companies small and large. High oil prices and the mad rush to capitalize on them destroyed much of the oil patch. Could we today be seeing the beginning of another such event? I don’t know…only time will tell.
ROCK,
No I'd say Duncan was very cautious when he mentioned the three major source rock formations Thursday afternoon. He said they were targeting the Shublik Formation but that if the properties of one or both of the major source rock formations above that zone showed the right qualities they might be able to be exploited as well. I happened to catch that particular part of his presentation on the news again last night. The local media is treating the entire proposed project with caution.
Real numbers are thin right now--as might be expected with zero wells in production it being a shale play and all. The section below is from the Plan of Development in the presentation given to the state senate April 2012
Phase 1
Proof of Concept
(Data Collection and Play Tests)
Vertical wells with horizontal sections
Vertical wells to be drilled to Shublik, cored through all 3 main shales
Multistage frac tests are planned
I'm afraid I do not know if and what horizontal sections were drilled in these first two exploration wells--nor the schedule for the multistage frac tests--some upcoming part of the process is trying to get approval with use of EIA rather than a full fledged EIS as I stated up thread--a difference of 6 months to complete the first rather than 2 years for the second. I'm not sure if the frac testing needed this approval or rather the plan to turn these exploration wells into pilot production wells--which I am pretty certain is the plan but again I didn't take notes--realized my wife and I didn't have a pen between us after the show started.
I found Great Bear's original power point presentation (4.9MB) from February 2011.
They certainly were talking up the potential of all three formations--the Hue, Kingak and Shublik--in that presentation, saying they all compared favorably with Eagle Ford-but it was their coming out party, it seems the tone is more measured now.
Here are two of the more pertinent slides from the above linked presentation
by the way ROCK you never got back to me on the square foot column on the table that started this part of the thread. I'm guessing that a real important number would be drilling cost to access that square footage, and of course that would be be different for each play and to some extent for each well.
Luke - Sounds like the Great Bear folks might b the real deal. Going in to establish a new trend is very risky…you know what they say about a pioneer taking an arrow. OTOH if they are right and can establish the trends viability new players will pay them big time for the acreage they picked up cheap. Remember the story of Petrohawk selling their Eagle Ford acreage for $12 billion when that trend heated up. To date I know of no other company in the trend being that profitable…and they didn’t do it by drilling up their leases. BTW they are in the process of doing it again…known as Halcon now.
As far as the square footage it doesn’t mean anything to me. It’s a theoretical model. All that eventually counts is what comes out of the wellhead. Models are all there is to talk about until those first pioneers stick their necks out and start posting results. At that point folks start forgetting what the models did or didn’t project. As the wise man said: data trumps theory every time.
On page 2 of Maugeri's now famous, or infamous, study we find these astonishing words:
By balancing depletion rates with reserve growth he gets the decline rate down to 2 to 3 percent. Astonishing! The decline rate is a measured figure, it is what it is. And whatever that measured figure is, any reserve growth or depletion has already had its effect. If production from the North Sea is declining by 9 percent, and that is the decline rate I get for the last two years, then whatever reserve growth they may have had, or whatever the depletion rate may be, will not change what the measured decline rate is.
That just seems so obvious that a fifth grader should be able to understand it. But a man who has held the position of Senior Executive Vice President of a major oil company, this just seems inexcusable.
Or am I missing something here? If production from a given field is declining by, say 7 percent a year, then that is what it is. Production is falling by that rate. You may slow that rate in the future but you cannot change what figure you measured in the past. It just blows my mind that Maugeri thinks that a measured decline rate is malleable. That is, he thinks that the folks who measured those decline rates in the past did not take reserve growth into consideration so therefore their decline rate numbers are way too high.
Ron Patterson
His argument seems to be (and I am bending over backward to defend him here) that reserves growth reduces the rate of depletion (by growing the URR). He then infers that a slowing rate of depletion is a leading indicator that, at some point in the future, the decline rate will slow as well (hence 'decline profile'). When you take into account the whole 'profile' maybe that decline rate will end up being 2-3 percent per year.
Of course you and I both know that putting greater weight on reserves estimates than on production results is foolhardy. It's essentially a faith-based statement.
The irony is that at some point in the future he will be proven correct. After a field has been sucked bone dry, you go to stripper wells and the yoy percentage decline goes nearly to zero, right?
Well no, he is quite obviously not talking about future decline rates but current decline rates:
The word "being" implies right now. Already producing...appears less pronounced than assessed by most experts... He is very clearly saying that that those who assessed the decline rate of the world's already producing oilfields clearly got it wrong! And they got it wrong because they failed to take reserve growth into account. There is just no other way to interpret that statement.
Ron P.
Well, I've suggested another interpretation, which is that by 'decline profile' he means not just historically observed decline rates, but an implied projection of what decline rates will be in the future (what else could reserve growth influence, except future production, hence future decline rates?). I agree that if by 'decline profile' he means exactly the same thing as 'decline rate' your interpretation is correct.
IMHO, his language is deliberately slippery, as with his use of the term 'productive capacity'. His definitions are plainly of little use in understanding what's happening on the ground, so it's not really worth dwelling on them further.
EDIT: OK, got it. He is asserting that historic decline rates are not what others have estimated, and the reason is that historic reserves growth contributed unexpected production. So he has to disclaim the estimates of others to make that claim, or cherry pick a few examples where that might have, in fact, occurred, like Kern River.
There are many problems with Maugeri's report, and with his history of oil production forecasts.
Much has been said, so I will limit myself to a few short points:
First of all, one should use the term NGPL(not NGL, which is the less specific term for what we are talking about).
In his estimate, the amount of NG(P)L is 15 mb/d in 2011.
This is wrong by a huge amount. The EIA estimates the number to be at about 9 mb/d this year and could grow to about 14 mb/d by 2020 if all goes well without any major setback.
So even his starting estimate is way wrong.
Second, he doesn't calibrate for net energy heat content between NGPLs and Crude oil. Therefore, he uses a 1:1 ratio.
Again, an amateurish mistake.
The depletion/decline rate hiccup is well covered so I will not get into it.
A final note:
Maugeri is even more extreme than Yergin is.
Here is his 2006 article from Forbes:
http://www.forbes.com/forbes/2006/0724/042.html
Yergin's 2005 call was actually less than Maugeri's 2006 call in total production estimate - since they both used 2010 as the end year for their production forecast.
This is quite amazing, since Yergin had an extra year to factor in(Yergin's call was in 2005).
And we all know what an utter disaster Yergin's estimate turned out to be; crude oil production barely budged.
This fact alone, that Maugeri has a track record of extreme and outlandish future production estimate calls, should give everyone, even those who gives it the briefest glance, significant pause.
NG(P)Ls
Hello (and for all interested.)
Chart above shows the development in world supplies of NG(P)Ls from January 2001 and as of June 2012 (as reported by EIA) split on some economic groups.
World supplies of NG(P)Ls grew from 6.69 Mb/d in 2001 to 8.56 Mb/d in 2011 a growth of roughly 1.9 Mb/d during those 10 years.
From here I will leave to the readers to evaluate the prospects of world NG(P)Ls supplies reaching 14 Mb/d by 2020….or higher as some claims.
Rune
The 14 mb/d estimate by EIA is very high, and I am highly skeptical of it.
But my point is that Maugeri is even worse.
His estimate is far higher, it's at 24 mb/d by 2020. And he gets there by taking the current 9~ mb/d (the last months according to the EIA is around 8.85 to 8.95 mb/d) and he magically increases it by a whopping 6 mb/d to get to 15 mb/d, and then he increases it by 9.6 mb/d to get to 24.6 mb/d.
If you're asking why there are three rows in the middle which are removed, that is how he left it intentionally.
His errors on Crude Oil is notable too, but it's less than his wildly-off-the-mark NGPL estimate/forecast.
Remove his NGPL error and his entire report falls apart.
Symmetric (and all others taking an interest)
I would now side with you on NGPLs.
Looking carefully on the chart (or rather the numbers used for it) the numbers shows that reported annualized NGPLs supplies from ROW and Russia had a high back in 2007 and has since declined slightly. ROW (in the chart above) includes the North Sea where NGPLs now are in decline and expected to continue to decline.
Growth in NGPLs supplies from OPEC has slowed down.
USA extraction/production of NGPLs declined slightly between 2002 and 2006 and from 2006 and as of now (on an annualized basis) US NGPLs supplies grew with around 0.7 Mb/d (from 1.66 Mb/d in 2006 to 2.32 Mb/d as of now, figures annualized).
2006 was when drilling in shales picked up speed and presently the US market is flooded with NGPLs and prices have collapsed.
NGPLs will experience the same dynamics as crude oil production; decline in some areas has to be offset by growth in other areas. NGPL production tends to experience high decline rates.
As Symmetric points out; Maugeri’s report is sensitive to the (Maugeri’s) NGPL forecast.
Rune
Isn't the answer as to whether there is an "oil revolution" becoming less relevant? You know, what with the climate change and all.
nano - I'm sure many would hope so. You probably know what I do for a living and also how pessimistic I am about the future. IMHO the climate would fair better if we did have a real oil revolution that increased, or at least held steady, oil supplies. As oil production declines I expect coal to move in to replace that loss. And even with new burning tech and some sequestration thrown in I expect GHG emissions to continue as bad as they have been... or worse. The exception would be a severe global recession that reduced all ff consumption significantly.
Even with high oil prices, the EIA forecasts minimal increases in coal exports for the foreseeable future. If coal moves in to replace oil, where is it going to come from?
The big coal users are China (especially) and India, and they are both having problems increasing domestic production (India seems to be having trouble maintaining existing production). Roughly speaking, world oil production is about the same as world coal production in energy content. China, which burns about 50% of current world coal production has about 14% of the world coal reserves (BP 2010), and 38 years of reserves two years ago: but Chinese coal consumption has grown over the last two years, and two years of those reserves have been mined, so they are probably down to 35 years now. India has much larger reserves relative to production, but is already having trouble meeting demand.
About the only significant energy users with significant coal reserves are the U.S. and Russia. In spite of its large reported reserves, the U.S. is already reduced to taking the tops off mountains and operating clearly unsafe mines in inaccessible locations. I'm not optimistic about the U.S. increasing coal production by much, even if there is a shortage of oil. I don't know much about Russia's coal industry, but I suspect the easy coal is already burned there too.
So if coal does replace oil, where will it come from?
Your severe global recession sounds to me far more likely.
Yea, like the Austrians in 1913 arguing who their next Hapsburg Ruler is going to be.
US Crude oil production just reached 6.509 million barrels per day. There was a dip for several weeks because of production shutdowns because of weather in the gulf of mexico.
http://nextbigfuture.com/2012/09/us-crude-oil-production-at-6509-million...
All US oil liquid production is at 10.8 million barrels per day. US Imports were down to 7.5 million barrels per day
In July, North Dakota oil production hit 674,000 barrels per day. It will be interesting to see what the September and October production is when the EIA reports US oil production is 200,000 barrels per day higher. Likely the increase is a mix of Texas and North Dakota and some recovery in Alaska.
http://nextbigfuture.com/2012/09/north-dakota-hits-another-oil.html
Alberta Oil Magazine projections
http://nextbigfuture.com/2012/09/north-american-oil-production-to.html
Iraq Oil Production projections
http://nextbigfuture.com/2012/09/iraq-sees-oil-exports-reaching-6.html
Year Exports Total Production
2012 2.6 million bpd 3.2 million bpd
2013 2.9 million bpd
2014 3.5 million bpd
2015 3.75 million bpd
2016 4.5 million bpd (NBF interpolation)
2017 6.0 million bpd
Your "North American Oil Production Scenarios" completely left out Mexico. I understand it's not your chart but I just wanted to point that out.
Mexico is part of North America, along with the United States and Canada. It is also commonly said to be on the continent of Central America, but no such continent exists.
Ron P.
Thanks for a timely, interesting and good post!
I will try to post some charts of actual developments for what they are worth.
Chart shows the split between crude oil and condensates (green columns) for the years 2002 and as of 2011 based upon data from EIA and National Board of Energy (NEB) in Canada.
So far there was a high for the world in C + C in 2005.
EIA has a new world peak for monthly crude oil including lease condensate at
75.87 million barrels per day for April 2012. that is higher than in 2005 even with whatever you are trying to disqualify.
http://www.eia.gov/cfapps/ipdbproject/iedindex3.cfm?tid=50&pid=57&aid=1&...
I used annual data...and there is still some more months left of reporting for 2012. Extraction of shale oil is expected to show strong annualized growth from 2011 to 2012 and oil sands is also growing.
Nice try, why not present data on an hourly basis. ;-)
Rune
IEA projects flat production into August and through the rest of 2012.
http://omrpublic.iea.org/
Improved refining margins spurred steep gains in OECD refinery runs in July and August, lifting global crude throughput estimates for 3Q12 to 75.7 mb/d, up 1.3 mb/d on 2Q lows and 450 kb/d y-o-y. Non OECD gains are projected to keep runs flat through 4Q12, lifting annual growth to 1.3 mb/d.
Demand projections for 2012 and 2013 have been raised by 100 kb/d on data revisions for 2011, to 89.8 mb/d and 90.6 mb/d, respectively, though demand growth forecasts are little changed at around 0.8 mb/d for both years. Demand grew by 1.2 mb/d in 2Q12, buoyed by Japanese utility burn to replace idled nuclear generators..
Global oil supply fell by 0.1 mb/d m-o-m to 90.8 mb/d in August from upwardly revised July estimates. OPEC liquids production growth, led by Nigeria, Angola and Iraq, failed fully to offset unplanned outages in non-OPEC countries. Crude oil imports from Iran are estimated to have inched up in August to 1.1 mb/d, from below 1 mb/d in July. Non-OPEC annual supply growth slowed to just 0.2 mb/d in 3Q12.
http://www.eia.gov/cfapps/ipdbproject/iedindex3.cfm?tid=50&pid=57&aid=1&...
First half of the year 75.45 million barrels per day.
New world peaks by month, quarter, and for various categories of world oil and oil liquids.
Crude and Lease condensate had new annual peak since 2005.
It will happen regardless of the definition for annual world crude in 2012.
North Dakota, Texas, Canada, Iraq are adding significant amounts of crude oil and will continue to do so.
Libya production is back, Russian production and Saudi production will be maintained.
Depends on what you term 'significant' I suppose. Supply growth of 0.4% per year since 2005 globally, despite these significant new sources?
Would be nice if the oil price had grown at 0.4% per year since 2005.....
Combined net oil exports from Canada, Mexico, Venezuela, Argentina, Colombia, Ecuador and Trinidad & Tobago (BP):
Hey - things are looking up!
advancednano wrote
Projections are NOT actual figures.
Perhaps advancednao could enlighten the readers how his comment relates to crude oil/condensates production?
Projections are not actual figures.
I highlighted a portion of advancednano’s comment.
Rune
I wrote;
And for persons like advancednano (who has been a member on The Oil Drum for more than 5 years) I should have bolded it and used capitals.
There is also a discussion about supplies of unconventional oils like oil sands (bitumen) and shale oil, and these supplies have grown, and some in this group are interested to follow these developments.
advancednano then replied;
advancednano, what are you trying to imply, yes I find the above comment from you insulting?
And if you are trying to insult me, why not post under your real name.
Rune
Not trying to insult you. Just saying that you are wrong and that after this year there will not be a valid way to call 2005 a peak in world oil.production in any remotely valid way. I also do not consider disregarding oilsand and heavy oil as particularly important.
I also have indicated where I think.things are going from now to 2016 and 2017 re oil.
Brian Wang.
Nextbigfuture.com
I DID NOT CALL A PEAK IN 2005!!!
Just read what I wrote, your reply apparently implies an agenda.
The chart did not disregard oil sands, heavy oils etc, it simply distinguishes between supply sources.
Original article -
Rune comment
Sounded like support for splitting the crude oil up and calling 2005 a flat plateau.
If Oilsands oil becomes 10+ million barrels per year in the 2020's or 2030s that would still work fine in a combustion engine car.
If there is some desire to adjust for some kind of net oil calculation based on how much more it takes to recover or based on energy content (biofuels and ethanol) then fine, but zeroing the other stuff out is misleading. It also does not support all of the economic disaster scenarios of peak oil.
I think there needs to be
Crude oil equivalent barrel calculations.
Net energy calculation.
One thing is that if the recovery method uses burning bitumen in the ground then the net calculation should only apply to upgrading after it is pulled from the ground. Although the upgrading above ground is often natural gas.
So then it would have to also include all fossil fuels.
Jean's post is a lot about Bakken and its reserves.
I had a post a couple of days ago about production from Bakken. There is my connection.
I chose the wording carefully involving "so far" and "high" deliberately, as I can not rule out new future highs also for C + C.
Two years ago I would not dismiss that KSA (and other OPEC members) in a post on TOD still could increase production, which they have (if I am to believe EIA and IEA data)....and still I believe they have the potential for further increases, but if they can remains to be seen and then there is the development from other oil producers.
AdvancedNano ought to look at Laherrere's plot of crude oil production aligned with crude oil prices.
http://www.theoildrum.com/files/JL_Maugeri_09_WorldProd_EIA_IEA_OPEC.jpg
Interesting that a doubling of oil prices since 2004 can barely nudge the production levels up. If my boss promised to double my salary, you could rightly bet that I would work at least incrementally harder.
What we have to realize is that the totality of the global industrial and social base will do whatever it takes to keep the production of liquid fuels at something approaching a stable level.
This could involve creative book-keeping as well, since all is fair in the free market.
I have a lot invested in the analysis and find it interesting to determine where the creativity/manipulation will come from. Since I do not use any heuristics at all, every long-term deviation from the model needs to be explainable. In contrast, a heuristic only needs to be adjusted :)
the point is that production levels have gone up and will continue to go up for a while. The big difference will be if things like toe heal air injection work or significant improvement in horizontal drilling.
Natural has has made more advances.
I think big gains will happen in nuclear fission and nuclear fusion and synthetic biology enabled fuels. Those will take a couple of decades to scale.
What does nuclear fission and nuclear fusion have to do with crude oil?
Bakken appears to be diffusion limited flow and will drop out of the picture fairly quickly. That's what a lot of money will get you, a temporary reprieve that amounts to noise on the curve.
You lost the argument.
FOR ALL - From:
http://scitizen.com/future-energies/time-to-worry-world-oil-production-f...
From late 2004 to today global C+C has ranged between 72 mmbopd and 74.2 mmbopd. IOW it has varied about 3% from one extreme to the other. I'll defend to the death anyone's right to pick the exact time of PO in that period or any other time they wish to project. PO = 2005? I won't disagree. PO =2012? I won't disagree. PO = some years from now? I won't disagree.
Why am I being so agreeable? Because it doesn't make one dang difference in our lives today IMHO. If the whole world suddenly agreed that (A) PO hasn't happened yet would oil prices tumble over night? Or if we all agreed (B) PO happened on 21 February 2005 how much would oil prices increase tomorrow? Let's try some other metrics based upon those two propositions (A) and (B). How many more/less folks would be unemployed today? How many more/less $trillions would the US military have spent "exporting democracy" to the ME? How many more/less shiny metal boxes would have been shipped into Dover? How much more/less would it cost each of us to fill our gas tanks up? How many more/less Bakken and Eagle Ford wells would have been drilled? How many more/less folks in NY and PA wouldn't be able to buy enough fuel oil to keep their homes heated through the coming winter? How much more/less foreign oil producing properties would China have bought? How many more/less electric cars would have been bought? How many more/less SPR releases would there have been?
Yes TODsters...run for your lives: THE POD IS COMING!!! For those that haven't read my previous rants about the Peak Oil Dynamic. The POD deals with everything I just mentioned in my list plus many dozens of more issues big and small. And the answer to those questions I just raised? It doesn't matter: we are dealing with the same situations today whether PO happened a few years ago or not for several years to come. The price of oil isn't determined by the date of PO. It's determined by current market conditions. Will the shales push us up above the current plateau for a number of years? Maybe. OTOH as ELM keeps cutting into how much oil the KSA, Brazil, etc. eventually export will that radically change the POD? Just MHO but I doubt much if at all. Same question with the volume of future oil production the Chinese effectively removed from the market through their acquisition efforts: maybe it will offset what gains the market place sees from biofuels....maybe not. If one wants to worry about peak dates I'm much more interested in PE (Peak Exports) than PO. That should have a more significant impact on the POD than the PO date. If in X years global oil export volumes drop 30% will it matter to US consumers if they are still importing all their needs from the Canadian tar sands? Granted the price may be a good bit higher than it is today. OTOH today that price is about 50% higher than it was in 2005 and US buyers have all the oil they can buy...at current prices. In reality from a purely nationalistic view point I wouldn't care as much about PE as I do PIUSA: Peak Import USA. Screw the world as long as we get ours! LOL. I said a nationalistic viewpoint...not a nice/humanitarian viewpoint.
The PO date is an interesting stat from an academic standpoint IMHO. Folks like Ron et al work their butts off beating on it. That's one reason you'll never see me argue about the date of PO: I'm too lazy to do the work. Add that to my emphasis on the POD and it's easy to understand why I don't get dragged into those debates. But there's nothing wrong with those debates if that's where one's interest is. My little rant isn't a criticism of those efforts. But the vast majority of the conversations on TOD deal with the many aspects of the POD. So that's where I'll stick.
ROCKMAN
I'll take two filled trays with whatever you are drinking!! ;-)
Rune
Nevertheless Rockman, it really does matter how much oil is produced. And it matters how much oil is exported. And it matters how much oil is consumed. It matters because oil feeds people. And less oil means less food for people to eat. And less oil means more agricultural land devoted to growing fuel instead of food. That means even less food to keep people alive.
Peak oil means peak people. And that matters. That matters a lot. Check it outL
Peak People: The Interrelationship between Population Growth and Energy Resources
And the date of peak oil matters because that tells us that oil production has actually peaked and will not continue to increase for many decades into the future, meaning that we will never hit peak people.
I am picking peak. Peak oil is already in the rear view mirror and the decline has already started. Of course that is Crude + Condensate. I have no idea when bottled gas might peak.
Ron P.
Yeah who gets to decide what defines "oil" in determining when PO hits? Since C+C hasn't increased it seems all the cornucopians then start working their way down the ladder to include increasingly unconventional oil to try to show that Peak Oil, or "Plateau" Oil hasn't occurred. First it's tight oil, then oil sands. Then if GTL and CTL ramp up they'll include that. From a consistency perspective oil sand is closer to coal than to oil. To follow this line of analysis, then the whole idea of "PO" falls apart because then it would all be intermingled with Peak Coal and Peak Natural Gas, which we haven't hit yet. PO would be replaced by "Peak Fossil Fuels" which we all agree we haven't hit yet either.
These people going to such lengths to quibble with the conclusion that we are obviously at or very near PO seems to be slitting hairs, I mean what is a 1% increase in the grand scheme of things compared to a 150% price increase over the same period? Just a ploy to deflect media attention from the obvious, that you can't suck a finite resource forever without it being depleted.
You are correct but I must point out that tight oil and oil from the oil sands are included in the EIA's calculation of Crude + Condensate.
Ron P.
Is there a typo in that? I don't see how we would never hit peak people. Peak people will lag behind peak oil, or rather, peak people will depend on peak usable energy, which will largely depend on peak FF. What may follow peak oil more closely is peak luxury. So, how far will total usable energy have to fall (i.e., how expensive will energy have to become) before deaths exceed births world-wide? That is when we will see peak people (well, you may see it, I'm almost 70 and hoping that I won't see it).
Nevertheless Ron I didn't say it didn't matter how much oil is produced. LOL. I said it didn't much matter if the world is producing 3% more oil or 3% less oil today then in 2005. "And it matters how much oil is exported." Which is exactly the point I made about being more interested in Peak Imports than PO. "And the date of peak oil matters because that tells us that oil production has actually peaked and will not continue to increase for many decades into the future". Neither I nor almost every American cares if global oil rates peak in the future. What "we" care about is whether "we" get the supplies "we" want. From a practical stand point there are many economies for which oil "peaked" decades ago because they couldn't compete on a price basis with the stronger economies. And again whether oil rates have peaked on some specific date or not it doesn't change the circumstances we have to deal with today and in the future. I won't repeat that long string of situations that exist today regardless of if or when the exact date of PO occurs.
And again from a very cold hearted perspective: does it matter to the US consumer if the rest of the world is denied oil in the future as long as the US imports haven't peaked? IOW if global production dropped 10 million bopd in the next 10 years but the US can still outbid the rest of the world would PO mean anything to the US? It would certainly mean a lot to the rest of the oil consumers.
A simple metal experiment: how would you (or any other TODster) conduct your life differently today if you were given absolute proof PO hasn't occurred in 2005 but will in 2020? It doesn't change my plans at all. I fill my car up with $3.94 fuel tomorrow. I'll still drill my well near the salt dome collapse in La in a couple of weeks. I still won't drill the NG prospects I cancelled when prices fell earlier this year. I also doubt any TODster who planned to put up solar panels in the next year would change their plans either. That was the whole point of my little rant: what would we and the rest of the world be doing today differently depending upon the exact date of PO? An easy answer: nothing. And just as easy to defend: the vast majority of folks on this planet do even know the term peak oil. And many of those who do don't fully understand it.
But like I said: it's an interesting stat just like a lot of other interesting stats out there.
Maybe we should talk about FPO, Fuzzy Peak Oil. Whether we're among the first few tendrils, or deep in the middle of the bush, I'm not sure. But it's close.
Personally, I think Peak Oil is when we start burning it faster than we're finding it, and that we'll only be able to tell looking in the rear-view mirror. Which I think will be better than the view looking forward.
We have been burning it faster than we are finding it for almost 30 years. Does your rear view mirror go back that far?
Ron P.
Burning it faster than we're finding it happened in the 80's[Edit - Thx Darwinian for the graph - your comment wasn't up when I was working on mine]. I'm guessing you mean burning it faster than we can extract it, or consumption/demand growing (or wanting to) faster than extraction (production) can ramp up, AKA 'peak lite', which is where we've been for a few years now. That view will clarify with time, and be visible to more people, which is not to say that denial and techno optimism won't ramp up greatly as that happens... wait, those are happening now. I'd say that's an indicator.
"techno optimism" - I like that term, it succinctly conveys the faith that human ingenuity will always conquer the challenges before us. I use the word -faith- intentionally. Those who are not technically literate can only rely on their faith in those who are to remain confident in the future and that faith (sometimes intentionally stroked by slick projections of future 'scenarios') will used against them by the unscrupulous just as religious faith has been (and continues to be) used to fleece millions from their hard-earned dollars.
Should read: My analysis highlights...
Hello,
Chart above shows development in production of crude oil and condensates (green columns lh scale) from North Sea (that is off shore Denmark, Germany, Netherlands, Norway and UK) versus development in the oil price (red line rh scale).
Looking at the data from a different perspective, that is development in the annual decline rate (blue line) (12Month Moving Average) vs oil price (green line) leaves the impression that the growth in oil prices as from 2004 slowed the decline with a time lag.
Recent high oil prices does not seem to affect the oil price, and UK had a decline of 18% in its crude oil production from 2010 to 2011.
The chart above show the developments in production from the Norne field in the Norwegian Sea versus oil price. Again there is a pattern with slowed decline as the oil price moves higher.
Applying the same method as for the North Sea for Norne results in the chart above.
Note how it appears as the decline rate moves with the oil price. Correlation is not necessarily causation, but it certainly rhymes. Note also the acceleration in decline for Norne in recent months defying the high oil price.
The same pattern was observed for several fields in the North Sea (slow down of decline with high oil prices) and more recently and acceleration.
For fields offshore Norway this may signal an approaching acceleration of field declines and in total production.
Rune
Quoted by aws.classifieds in yesterday's Drumbeat:
Sometimes they pump more when prices are high, and sometimes when prices are low. Yer pays yer money and yer takes yer chance.
Has anyone any knowledge and can comment on the 'peer-review' process for Maugeri's article? Apparently there was none?
It is not a scientific paper, it is not being published by a scientific journal, so it has nothing to do with the peer-review process. The Belfer Center (part of harvard), where it is published, calls it a 'discussion paper', and given the reactions on this site, they succeeded. Maybe it would be a good idea if someone with good academic standing can send a complaint to harvard on the elementary errors in this piece. Universities are usually protective of their good name.
I see a typical example of an illustration designed to mislead.
The top chart, the one with the three big oil drops showing world oil production capacity to 2020, is optically misleading and exaggerates the increased production capacity.
The second drop is pro-rata correct if one just looks at the height of the drop. If one considers it as a volume, and it is certainly drawn to give the 3-D impression of a volume, it would contain 57% more oil rather than 16% more.
The last drop is 53% bigger rather than 38% bigger if one just looks at the height of the drop, which is clearly misleading, and is FOUR TIMES bigger than it should be if one considers it as a volume, the way it is drawn (164% bigger rather than 38% bigger).
Mb/d
Mb/d
actual
in drop height
in drop volume
As well as being drawn in 3-D to give the *feel* of a bigger increase in volume, the 2020 drop is a sharper, denser, more arresting image, further enhancing the emotional impression of wealth and abundance.
Good call, Aardvark! IMO, this is an example of what pi referred to (in the Wed Drumbeat?) regarding 'our animal spirits'. That is, our emotions lead and overwhelm our rational minds. Advertisers/salesmen, politicians & conmen (is there a diff?) know this well, and use it to their advantage. We'd do well to call them out at every opp'ty, but we'd also exhaust our time doing so...
When I saw that I immediately thought of the book published in 1954, How to lie with statistics, by Darrell Huff.
Maugeri's Figure 1 is exactly like the figure on page 71 of the book (you can get it on Google Books). But in addition to the optical illusion effect Huff describes, it looks as if Maugeri has fudged the numbers too.
Occam's Razor,
The price of Brent between ~'99-03 averaged around $25/bbl. The price then rose even though production of C+C had been growing.
C+C production stopped growing around 2005. In 2010-12 the price of Brent is around $90-$115/bbl, yet production has not risen. The price has been higher than the '99-03 average the entire time since 2005.
Seven years is enough time for economic theory to work, ie an increase supply (production) in response to higher prices, yet it has failed to do so. Anyone with a PhD in Economics should understand this.
The only conclusions that can be drawn are that either production has peaked (supply cannot increase) or economics is bunk. I favor both.
Nifty chart.
EIA says US crude oil production should average 6.8 million barrels/day next year.
Credit Suisse study says, depending on assumptions of price and recovery/decline rates of wells, US will be producing as “little” as 8 million barrels/day or as much as 10 million barrels/day in 2022.
And before Rune tells me, "Projections are NOT actual figures," I remind him that this entire article is filled with projections on both sides of the debate, and writers on this website regularly make projections about all sorts of things.
I do not think I ever have discouraged anyone to make projections, and projections may be good, bad, biased, carry an agenda etc.
So what is your point?
You were attacking advancednano for posting projections ... on a website which regularly posts projections, and in an article filled with projections. Just wanted to make sure you didn't do the same thing to me.
I replied to an attack on me after I posted actual data! Read the thread!
What is interesting is that this post is supposed to encourage comments to a report on future oil (liquid energy) supplies,
and some contributes by trying to derail that debate.
I am a long time reader and a member of TOD for a couple of years. As a Mechanical Engineer with a career in power delivery (and Nuc Subs, old Cold War warrior) I understand some of your comments and articles.
I just want to say thanks to everyone for all the work you put into this. You folks know your stuff and are willing to share/teach us non oil field types.
Again thanks for all your hard work, I have learned a lot and hope to learn more.
Gary
About Maugeri, I'm reading right now his book "The Age of Oil: The Mythology, History, and Future of the World's Most Controversial Resource", available (partly) on google books :
http://books.google.fr/books?id=JWmx5uKA6gIC&printsec=frontcover&hl=fr#v...
(started chapter 8 page 93. Chapter 8 (rise of Arab nationalisms) and 9 (the first oil schock) being fully available)
Interesting, as always going over these historical aspects from the oil angle being quite "enlightning", but also very interesting how you can tell that he is fighting "the banality of the resource contraints aspect".
For instance writing at the beginning of chapter 9 :
To then write further down :
or :
