| Tech Talk - Conclusions on the Chinese Energy Situation | The Oil Drum | Comments on Maugeri's Oil Revolution - Part I |
Is Shale Oil Production from Bakken Headed for a Run with “The Red Queen”?
Posted by Rune Likvern on September 25, 2012 - 6:27am
In this post I present the results from an in-depth time series analysis from wells producing crude oil (and small volumes of natural gas) from the Bakken - Bakken, Sanish, Three Forks and Bakken/Three Forks Pools - formation in North Dakota. The analysis uses actual production data from the North Dakota Industrial Commission as of July 2012 from what was found to be a representative selection of wells from operating companies and areas.
The reference in the title to the Red Queen from “Through the Looking-Glass” by the English author Charles Lutwidge Dodgson (perhaps better known as his pseudonym Lewis Carrol) who was also a mathematician and logician, is deliberate to create associations with the Red Queen’s statement "It takes all the running you can do, to keep in the same place".
After presenting, discussing and concluding the results from the study presented in this post, the reference to the Red Queen was found to be an apt analogy to describe why technology and/or price cannot overcome the inevitable fact that field size and well productivity declines in most plays, whether in shale or any other plays. Put in a different way: shale plays do not get a pass on the laws of physics or the history of play and basin developments.The potential and technology for extraction (production) of shale/tight oil has been around for several decades.
There is every reason to embrace the recent additions of shale oil (from Bakken, Eagle Ford and other plays). These additions will help ease the present tight global oil supply situation and thus slow down the growth in oil prices.

Figure 01: The illustration above is from “Through the Looking-Glass”. At the top of the hill, the Red Queen begins to run, faster and faster. Alice runs after the Red Queen, but is further perplexed to find that neither one seems to be moving. When they stop running, they are in exactly the same place. Alice remarks on this, to which the Red Queen responds: "Now, here, you see, it takes all the running you can do to keep in the same place".
Continued below the fold.
MAJOR FINDINGS FROM THE STUDY
All charts in this post are clickable for a larger version.
Findings from this in-depth study of time series for production from some individual wells:
- Presently the estimated breakeven price for the “average” well in the Bakken formation in North Dakota is $80 - $90/Bbl In plain language this means that presently the commercial profitability for new wells is barely positive.
- The “average” well now yields around 85 000 Bbls during the first 12 months of production and then experiences a year over year decline of 40% (+/-) 2%
- The recent trend for newer “average” wells is one of a perceptible decline in well productivity (lower yields)
- As of 2007 and also as of recent months, the total production of shale oil from Bakken, has shown exceptional growth and the (relatively high) specific average productivity (expressed as Bbls/day/well) has been sustained by starting up flow from an accelerating number of new wells
- Now and based upon present observed trends for principally well productivity and crude oil futures (WTI), it is challenging to find support for the idea that total production of shale oil from the Bakken formation will move much above present levels of 0.6 - 0.7 Mb/d on an annual basis.
Authoritative research companies (like Bernstein Research) and widely acknowledged specialists/institutions like USGS and SPE have recently and in general arrived at identical conclusions by applying different sets of methodologies and from studying other areas.I am of course in no position to rule out that the required breakeven price in the future could be lowered driven by technological innovations and improvements in well design and operations. However recently there have been a flow of reports that casts a reasonable doubt that this will become a given.
The content for this post was first posted in two parts (with data as of June 2012) on my Norwegian blog; “Fractional Flow” Part 1 and Part 2.

Figure 02: The map above from EIA (Energy Information Administration) shows the extent of the Bakken formation, areas with considerable activity and oil and natural gas wells. The most active areas are also the most productive ones (sweetest spots) and data now shows that these are well developed (saturated).
As of July 2012, data from the North Dakota Industrial Commission documented extraction (production) from 4 319 wells in the Bakken formation (which includes Bakken, Sanish, Three Forks and Bakken/Three Forks basins). Total reported production in July 2012 was around 610 000 Bbls/day with a specific average of 141 Bbls/day/well.
The production of shale oil/tight oil (which is not to be confused with oil shale; kerogen) is proclaimed by many to constitute a “revolution” and/or “game changer” for the global supplies of crude oil. Shale oil has unquestionably added valuable supplies during a period of tight global crude oil supplies.
SCOPE OF THE STUDY
The scope of the study incorporated companies/areas that had a specific average production (Bbls/day/well) above the average for the Bakken formation, see also figure 06. Further the study concentrated on newer wells where there were reported starts of production as from January 2010 and later. This was also to make sure that effects from those newer wells with “state of the art” technologies (technological innovations/improvements like horizontal wells also with laterals, multistaged hydraulic fracking, to name a few) were incorporated. This was done to document recent trends. Normally it takes somewhere between 5 to 6 months from start of drilling of a well until it starts flowing. Then add time for planning and approvals.
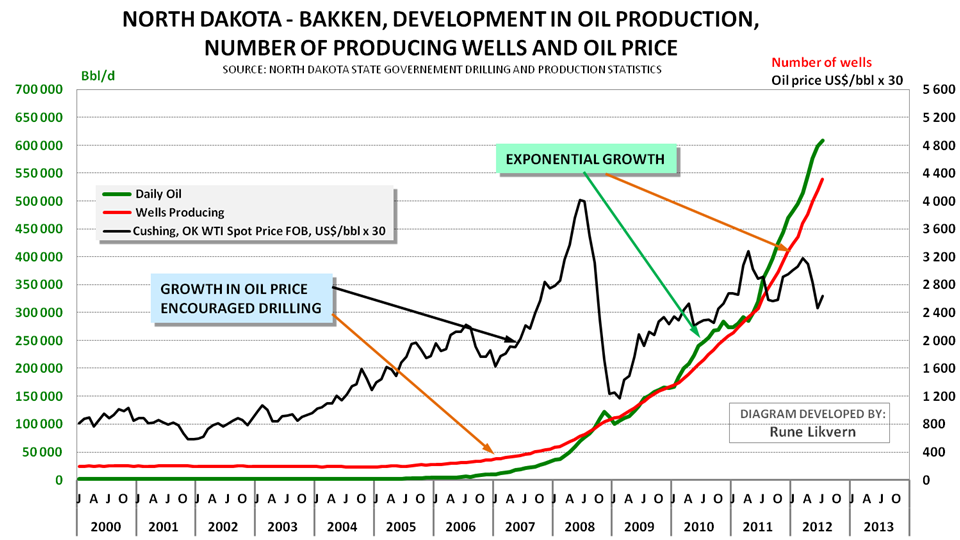
Figure 03: The chart above shows the development in the number of reported producing wells, oil production and the crude oil price (NOTE; to enable the inclusion of the oil price in the chart the actual price has been multiplied by 30. In other words actual prices are found by dividing the value in the chart by 30.). The chart shows that the growth in oil prices has been the dominant driver for acceleration of drilling and the resulting growth in oil production from the Bakken formation in North Dakota.
Figure 03 could also create the illusion that growth in shale oil production from the Bakken is still continuing at a rapid pace.However if the time series of actual production data are studied in further detail and are presented in an appropriate manner it becomes easier to document and spot the true underlying trend. From figure 03 it may also be seen that the collapse of the oil price during the fall of 2008 led to a slowdown of activities and lower total production. As illustrated in figure 03 it was primarily the growth in the oil price together with technological innovations in recent years that caused production of shale oil to make economic sense.
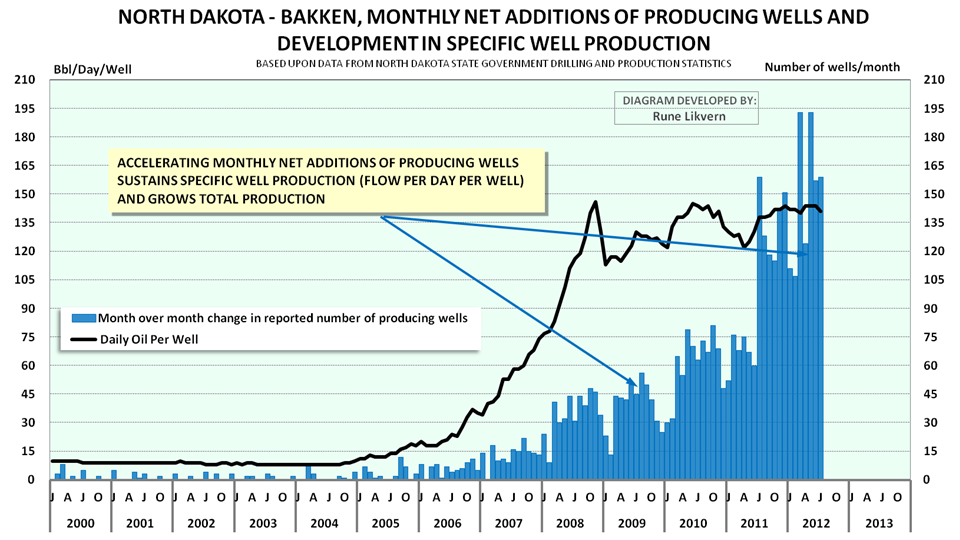
Figure 04: The chart above shows the development in the reported net total monthly start up of wells (blue columns) and the development in the specific productivity (Bbls/day/well; black line) for the Bakken formation from January 2001 and as of July 2012.
Figure 04 shows that the specific average production (Bbls/day/well) had strong growth as from 2006 to 2008 and has since been sustained at around 140 Bbls/day/well. Start up of new wells shows an accelerating trend as from 2006. It is this accelerating start up of new wells that have resulted in growth in total production. Extraction/production of oil and gas from shale formations has its own distinct physics governed by geology and comprised of steep decline rates and challenging dynamics that define the rules to create overall growth, sustain a plateau and/or declines.
There are also considerable variations in the productivity between plays within the same play and normally the areas with the best production potential (sweetest spots) become developed first (harvesting the lowest hanging fruit first etc.). The development of shale plays thus follows exactly the same pattern as developments of other petroleum basins.
THE WELLS, AREAS AND COMPANIES COVERED BY THE STUDY
What follows is a presentation of some selected wells from the study and the wells from the areas/companies covered by the study.
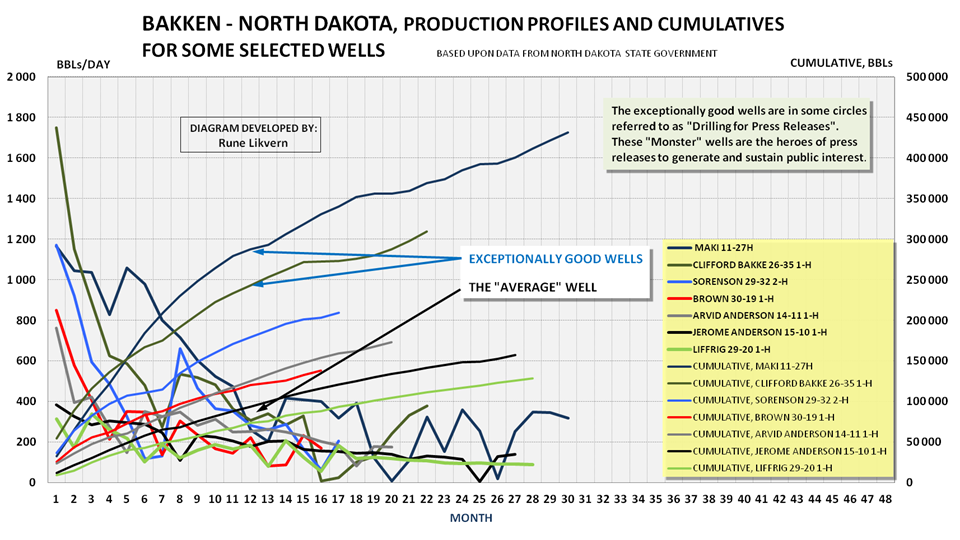
Figure 05: The chart above show the development in reported average daily production versus number of months in production for some selected wells (well identifications in the legend box) (left y-axis). Incorporated in the chart is the development of total production versus number of months in production (right y-axis).
The chart above illustrates that there is a huge spread in well productivity, cumulative and decline rates amongst individual wells. The well Sorenson 29-32 2-H (blue line) got attention from, amongst others, the Oil&Gas Financial Journal back in April 2011. Normally it is the exceptionally good wells that get the attention of media and its readers.

Figure 06: The chart above shows the development in specific average productivity (Bbls/day/well) for all Bakken in North Dakota (black circles connected by black line), Whitting Oil and Gas Corporation’s wells in Sanish (green triangles connected by green line), all of Brigham’s wells (blue circles connected by blue line) and Marathon’s wells in Reunion Bay (red squares connected by red line) from January 2010 and as of July 2012.
Figure 06 documents that the wells from the areas/companies that were subject to the in depth time series studies had productivity that was above the average for all reported wells in the Bakken play in North Dakota. Notice also the pronounced decline of more than 40% over 2 years in the average well productivity for the wells in Sanish.
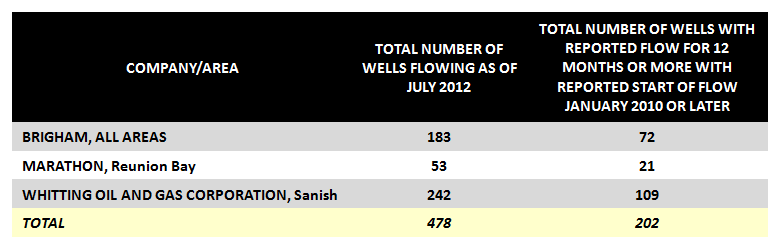
Table1: The table above lists the number of wells that were subject to the in depth time series studies, and what companies/areas these were reported.
The in-depth time series study was comprised of 478 wells (around 11%) of the 4 319 wells reporting production from the Bakken. These wells represent around 13% of the total production as of July 2012. The wells with reported start of production as of January 2010 and later and that had reported production for 12 months or more were subject to additional analysis which includes the wells with reported start of flow as of August 2011. In the period January 2010 and through August 2011 there was reported start of flow from a net addition of 1 417 wells of which 202 (or more than 14%) were subject to extensive statistical analysis. The statistical analysis formed the basis to define what is presently considered a pro forma well (or “average” well) for Bakken. The “average” (pro forma) well should not be expected to be static as it will continually change with time and presently the trend is one of declining productivity.
For this “average” (pro forma) well an economic analysis was performed which is presented further down.
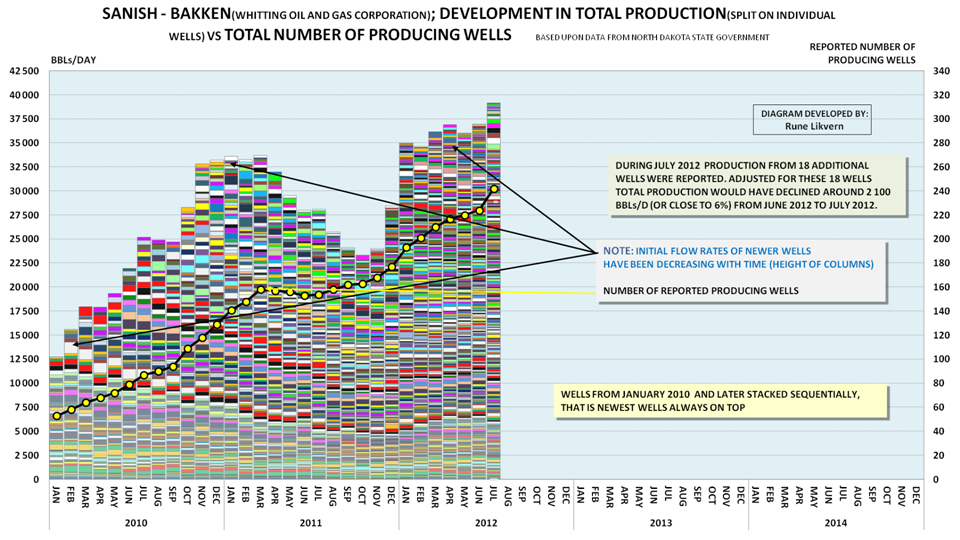
Figure 07: The chart above shows the monthly total number of wells, month of start up of reported production from added wells, production from the individual wells and total production from the 242 wells reported for Whitting Oil and Gas Corporation in Sanish - Bakken as of July 2012. The chart spans the period January 2010 through July 2012. The wells in the chart are stacked sequentially according to reported start up of production that is newest wells always on top.
Figure 07 is a suitable illustration of what is to be expected in developments of shale formations (or areas within shale formations) for both oil and natural gas. From the figure it should also be possible to perceive the development of well productivity with time.
- The wells normally have a high production at start up that rapidly enters into steep declines.
- To facilitate growth in total production an accelerating number of wells needs to be brought into production.
- To sustain a plateau requires a continual addition of a high number of producing wells.
- Note in figure 07 how total production declined between March 2011 and as of October 2011 while the reported number of total wells with production saw little change.
- Figure 07 also shows how well productivity (note the arrows and height of columns) has shown a general decline for newer wells.
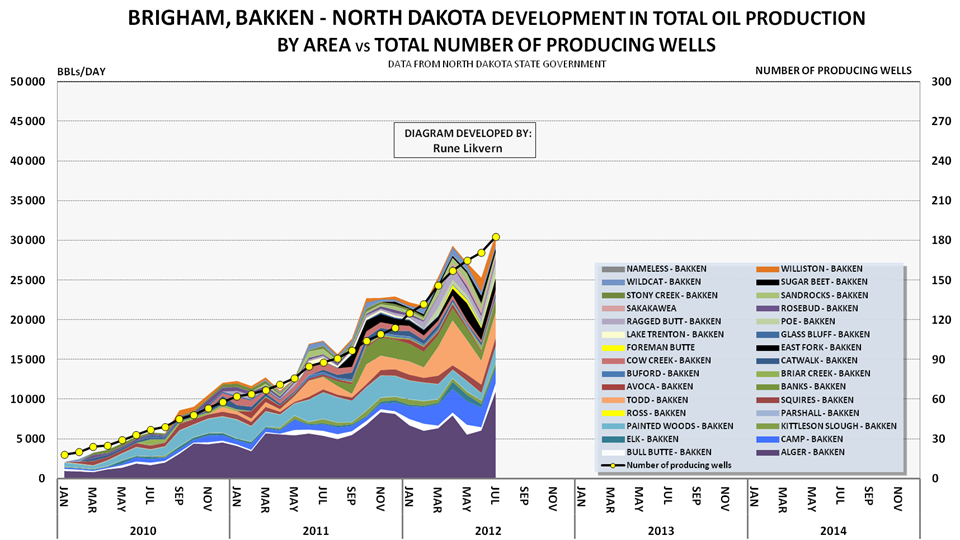
Figure 08: The chart above shows the development in reported total production by area for all the wells for Statoil/Brigham in the Bakken formation, North Dakota. The chart also shows the development of total number of wells. The chart spans January 2010 through July 2012.
The chart in figure 08 also illustrates how an accelerating number of additional producing wells are needed to create growth in total production. Brigham was acquired by Statoil December 1st 2011 for a price of US$4.4 Billion.
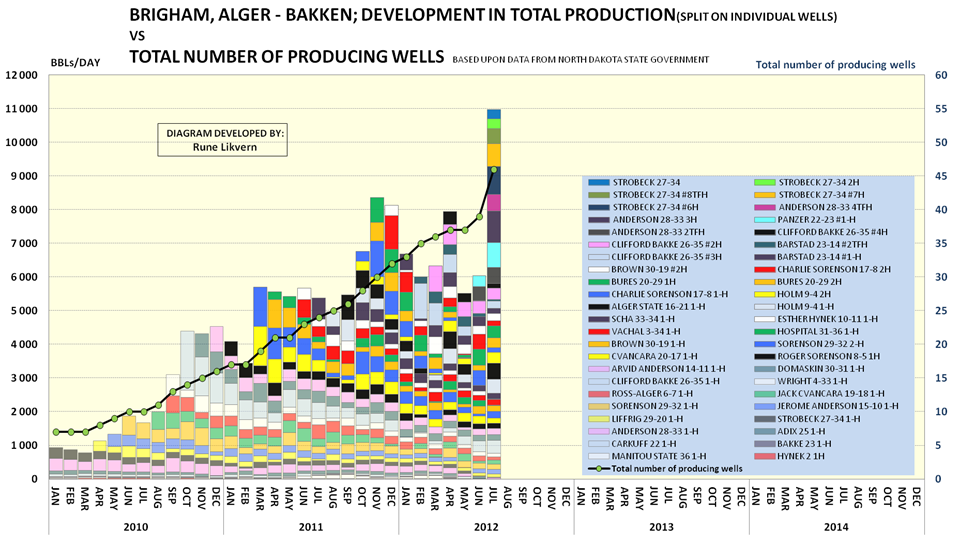
Figure 09: The chart above shows development in total production by individual wells (ref the legend) and total number of reported wells with production for all Statoil/Brigham wells in the Alger area of Bakken.
The wells in the chart are stacked sequentially according to reported start up of production, that is newest wells always on top.
The chart may also serve as an illustration to what in some circles presently is referred to as “the Red Queen” effect. It is not a given that total production will grow by adding new producing wells.
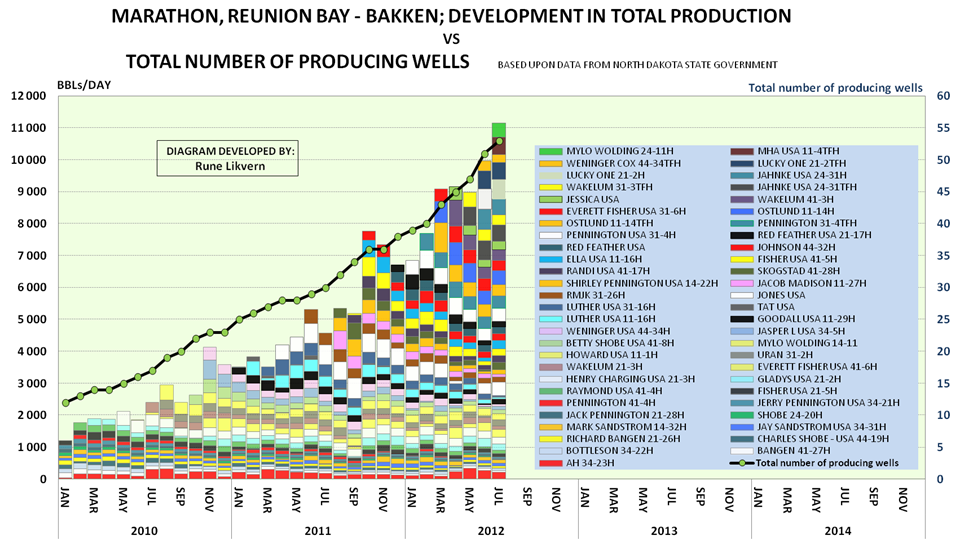
Figure 10: The chart above shows development in total production by individual wells (ref the legend) and total number of reported wells with production for all Marathon wells in the Reunion Bay area of Bakken.
The wells in the chart are stacked sequentially according to reported start up of production, that is newest wells always on top.
The chart above also illustrates that growth in total production requires accelerating additions of producing wells. The Marathon wells in the area above have recently seen some improvements in well productivity.

Figure 11: The chart shows development in total production from wells started within specified calendar years for Marathon’s wells in Reunion Bay - Bakken.
The purpose of including the chart above was to give a better feel of annual production declines from wells within an area.
THE STATISTICAL ANALYSIS
What follows are the results from the statistical analysis of the wells that were subject to the in depth time series analysis. If the trend described by the statistical analysis persists and the wells analyzed are representative for Bakken it should be expected that total production from the Bakken formation is about to experience what in some circles is referred to as “the Red Queen” effect.
In plain language this means that a high number of new wells needs to be brought to production to sustain total production.
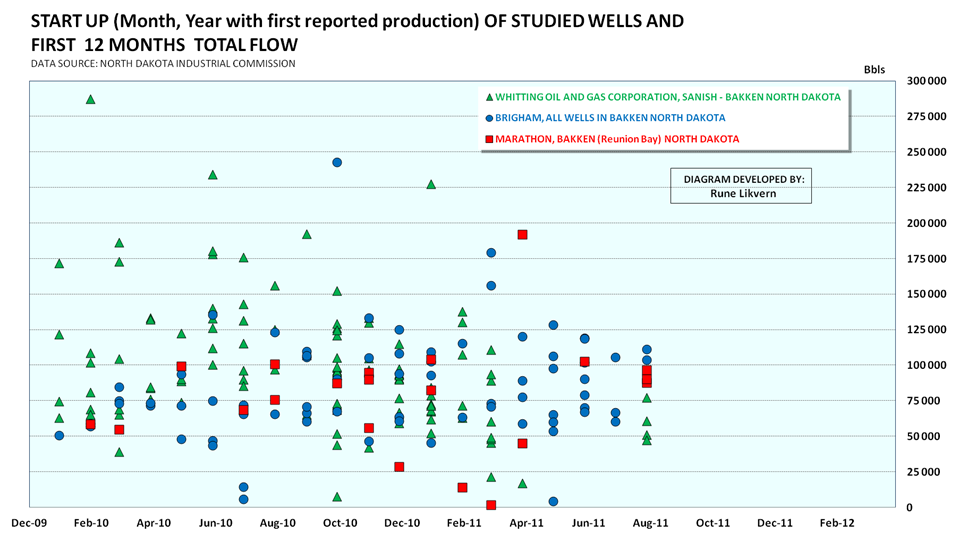
Figure 12: The scatter chart above may appear complex for those who are not familiar with this kind of chart. Based upon data from the North Dakota Industrial Commission it shows total reported produced crude oil for the 12 first months (y-axis) versus reported start of first production (x-axis). Wells that were started as of August 2011 or later had as of July 2012 not attained 12 months with reported production. This is the reason why there presently are no data points in the chart after August 2011.
The figure shows that there is a huge spread in the total production for the first 12 months amongst the wells. It may be challenging to perceive any trends for well productivity with time from the scatter chart, but as of now it appears as the spread in productivity has narrowed with time.
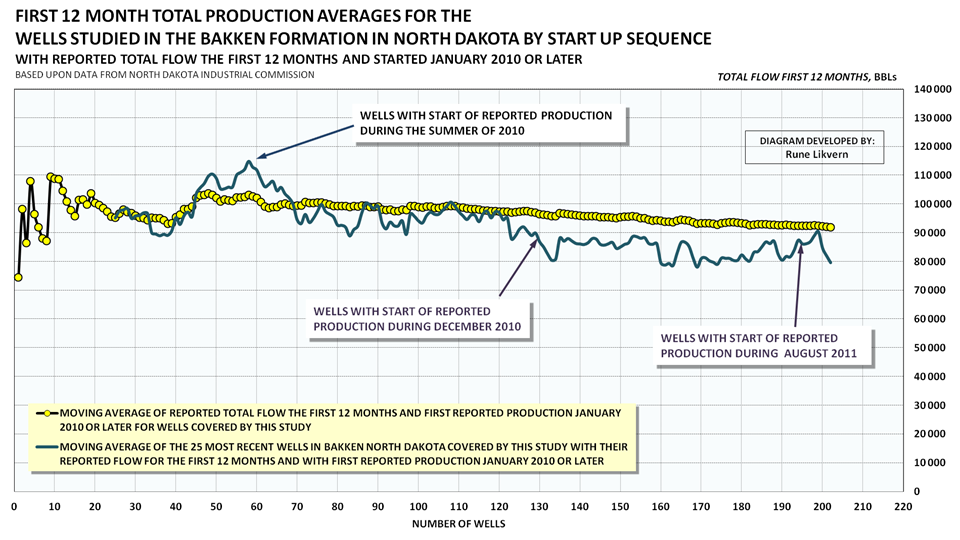
Figure 13: If the data on total reported production for the first 12 months on all the wells that were subject to in depth time series studies are organized sequentially according to when production were started and a moving average is used, the picture above emerges. The moving average is the total first 12 months production divided by total number of wells (yellow circles connected by black line). Described another way the first data points are for wells with reported production from January 2010 and the last data points in the chart are for wells with first reported production as of August 2011. This function is slow. To both speed up the function and improve visualizations a 25 moving average was added. The 25 moving average shows the average of the 25 most recent wells (aquamarine line, 25 moving average was chosen as a compromise to smooth out wild swings and achieve an acceptable speed).
Figure 13 shows a worrying development for newer wells in the Bakken formation. Productivity as expressed by total first 12 month production has shown steep declines for newer wells. The productivity was growing until the summer of 2010 where it reached a high. Since the summer of 2010 to the summer of 2011 average first year productivity for newer wells in Bakken declined around 25%!

Figure 14: In the chart above the same methodology as used for figure 13 is shown for the companies/areas covered by this study. The green triangles connected by green line are the moving average for Whitting Oil and Gas Corporation’s wells in Sanish. The green line shows the 25 moving average. The blue circles connected with a blue line are for the wells of Statoil/Brigham. The dark blue line is the 25 moving average. The red squares connected by a black line are for Marathon’s wells in Reunion Bay.
On a long enough timeline, the highs in well productivities for the Sanish area and Statoil/Brigham will melt into a point. To repeat, the wells for the companies/areas subject to these in-depth studies had all a specific well productivity (as expressed by Bbls/day/well) that was above the average for the Bakken formation, see also figure 06. The Sanish area in the Bakken formation is/was considered being one of the best and during a year (from the summer of 2010 to the summer of 2011) the well productivity (as described by total reported production during the 12 first months) declined about 40%. For Statoil/Brigham the well productivity declined about 10% in one year.
Do the above create associations to the law of diminishing returns?
THE ECONOMICS FOR THE PRESENT PRO FORMA (“AVERAGE”) WELL IN BAKKEN
What follows is a little about the economics for what the analyzed data presently describes as the pro forma (“average”) well in the Bakken formation.
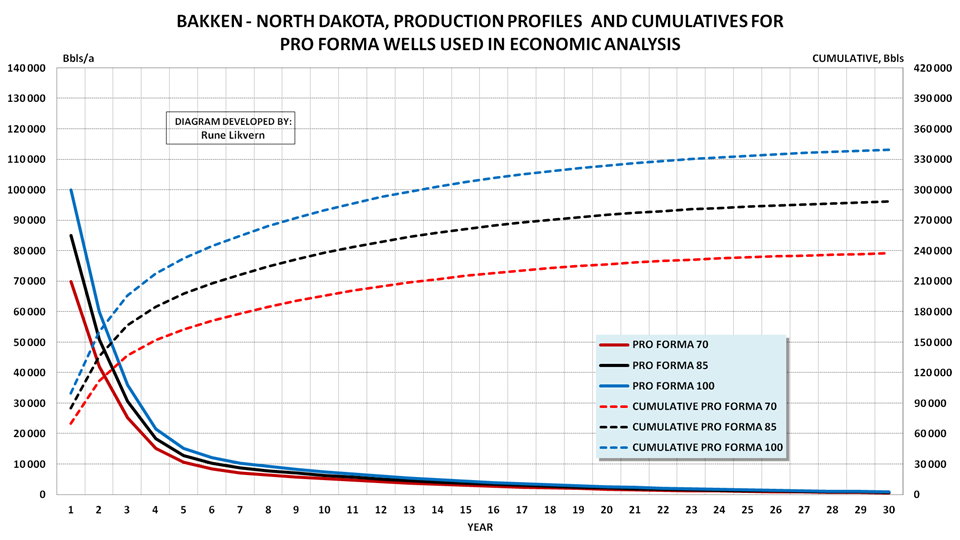
Figure 15: Based upon the data from the wells that were subject to in depth time series studies a pro forma well (an “average” well) was established. The future development for this was forecast by using data from the North Dakota state government and what is presently available of forecasts from several reputable sources with regard to declines, total recovery or EUR (EUR, Estimated Ultimate Recovery) for wells producing oil from shale. From this study it was found that the pro forma (“average”) well yielded around 85 000 barrels with crude oil during the first 12 months of production.
The chart shows production profiles for pro forma (“average”) wells with respectively 70 000 (red lines), 85 000 (black lines) and 100 000 Bbls (blue lines) for the first operational year, and how these are forecast to develop with time.
Presently the data documents that the production trend for the “average” well is in slight decline.
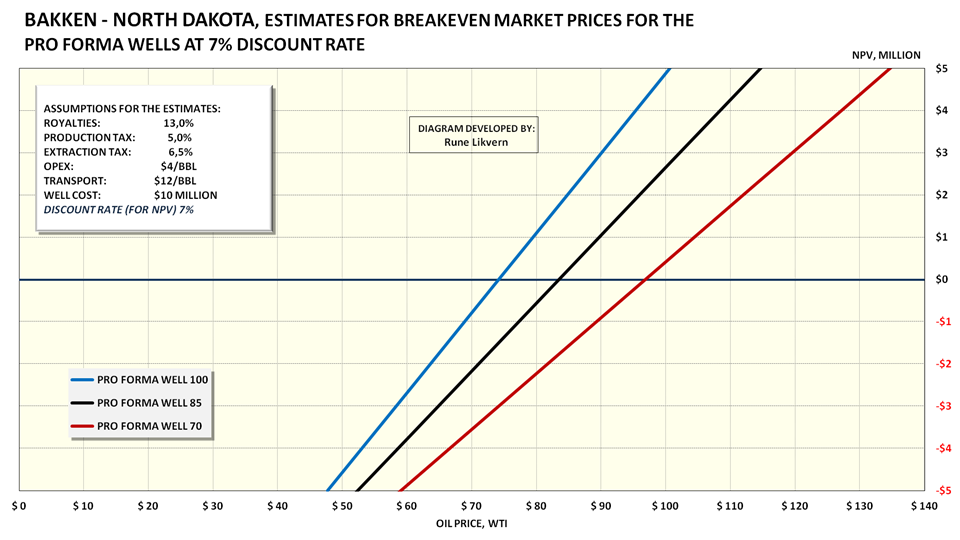
Figure 16: The pro forma (“average”) wells shown in figure 15 were subject to economic analysis. The assumptions used for the economic evaluations are shown in the box within the chart. (PRO FORMA WELL 100 = well with a total of 100 000 Bbls produced during the first year, etc.). The well costs include preparations of the well site (inclusive access), horizontal drilling, completion, multistage hydraulic fracking and hook up for processing, storage and transport. The well cost does NOT include full life cycle costs, financial costs, costs for mineral rights (acreage costs) and effects from potential changes to statutory regulations.
NOTE: The “average” well also produces 0.5 - 1.0 Mcf/Bbl with associated natural gas. The natural gas may be flared or sold if there is available infrastructure. Presently the natural gas price in USA (Henry Hub) is around $3/Mcf. In other words the potential contribution from natural gas is marginal and well within the uncertainties for the estimates.
The profitability analysis shows that the “average” well for Bakken now requires $80 - $90/Bbl to make commercial sense. A requirement for a higher rate of return (than the 7% used here, which is moderate) will raise the commercial threshold. If the trend with declining well productivity persists (all other things remaining equal) the threshold for profitability will move higher. During the planning of drilling campaigns several assumptions are made with regard to well productivity (performance), oil price, financing and an associated package of risk assessments. If these evaluations show high uncertainties (as in high risk) and a potential for no or at best uncertain profitability, the wells under consideration are most likely to not be drilled. The exception will be wells that the licensee is contractually obligated to drill within a specified deadline to maintain the rights for mineral extraction, so-called “drill it or lose it!”
Normally before wells within shale areas are put into production, it is close to impossible to issue any guarantees that it will make commercial sense. After six months or more of production, data will be available that may support the profitability expectations. For a well in a conventional reservoir information about whether it is worth completing will be available at the end of drilling. For wells in shale plays (both oil and natural gas) the companies (operators) commit themselves to produce these long before they know if the wells make commercial sense. If production from a completed well after some time shows that it will underperform (that is yield less than expected) then the oil company/operator will continue production from it as long it generates a positive cash flow. As with regard to total well costs given by oil companies/operators there are presently some spread in these. These spreads should be considered to be real and rooted in geological particulars like depth to and thickness of the organic zones, applied technologies, laterals, number of hydraulic fracking stages, topography, costs for hook up for processing, storage and transport to name a few.
Production of crude oil and natural gas from shale is also a lot about growing shareholder value. As long as shareholders do not suffer any losses it does not matter if production from shales makes little or no commercial sense. These dynamics led to the boom in drilling for shale gas. The recent collapse of natural gas prices in North America has resulted in huge balance sheet impairments for several oil and gas companies.
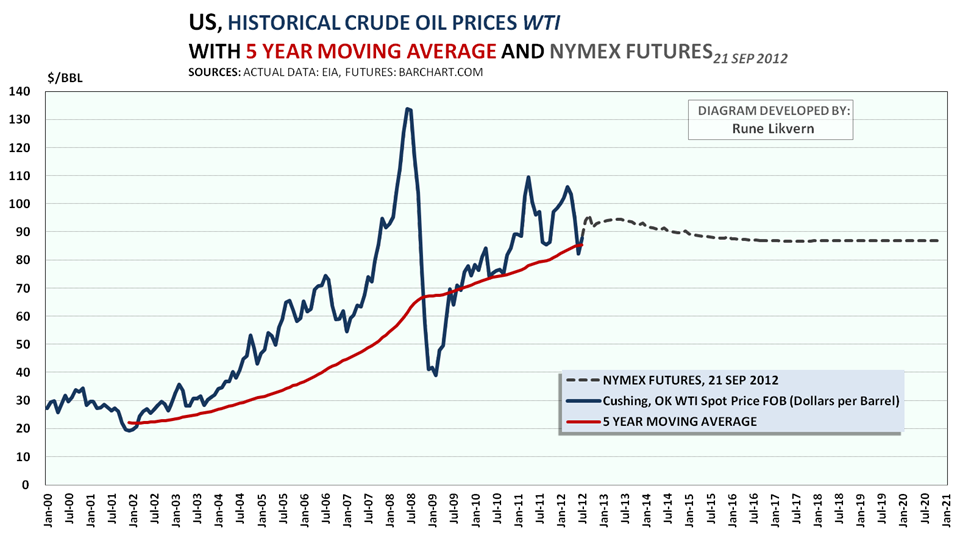
Figure 17: The chart above shows the development in the oil price, WTI, as from January 2000 and now. Further the NYMEX futures (WTI) as of 21 September 2012 through December 2020 have been added. FWIIW the 5 year moving average of the actual WTI has been added (red line).
In reality, it was the growth in the oil price to an apparent structurally higher level that secured commercial support for crude oil production from shales. In that respect it was the oil price that was the true game changer and unleashed the “shale/tight oil revolution”. There is a saying that goes like; “Do not listen to what they say. Look at what they are doing!”. This may as well go for the Bakken formation.
The oil service giant Baker Hughes recently expressed concerns about slowing activity levels in shale plays if oil prices moved below $80/Bbl. Further the oil companies Marathon and Occidental recently cut back on their activities in the Bakken formation. Oil and gas companies still care about the colors of the numbers at the bottom line for their projects.
Indicators to follow that may be a harbinger of emerging developments in activity levels in shale plays:
- Number of drilling rigs, uncertain as there has been improvements to drilling.
- Net added number of wells with reported start of production.
- Changes to total reported production.
SOME RECENT REPORTS
U.S. Geological Survey (USGS) recently published (recently as in a few days ago) the report: “Variability of Distributions of Well-Scale Estimated Ultimate Recovery for Continuous (Unconventional) Oil and Gas Resources in the United States”. USGS has revised their estimates for many U.S. shale plays (oil and natural gas) and their recent estimates ought to have a sobering effect.
For production (extraction) of shale oil in the Eagle Ford formation in Texas the study:”Eagle Ford Shale - An Early Look at Ultimate Recovery” (SPE 158207; SPE, Society for Petroleum Engineers) documented a trend of declining well productivity.
ROCKMAN is an experienced geologist and as close you get to an inexorable fountainhead for oil and gas field experiences on The Oil Drum.
ROCKMAN applied the same methodology as I did for Bakken on data from Texas Rail Road Commission (TRCC) for shale/tight oil in Eagle Ford and documented the same trend.
Does it appear as if shale oil production from Bakken is headed for a run with “the Red Queen”?
Contact
- Content: editors at theoildrum dot com
- Tech support: support at theoildrum dot com
License

This work is licensed under a Creative Commons Attribution-Share Alike 3.0 United States License.
Rune this is a great quantitative analysis, hats off for tie-ing so many datapoints and thoughts together. I was wondering about your final point in conclusion on production not rising much above 0.6-0.7 mb/d. Is that on the basis of drilling activity developments and the way the market is shaping? I.E. in principle it looks to me that as long as the oil price is high enough (110+ dollars per barrel) the operators can just keep on plugging wells (as long as the infrastructure for this is available) despite lowered productivity. Hope you have some time to comment.
Rembrandt, thanks!
There are several elements/observations that make me believe that shale oil extraction in Bakken (and elsewhere as well, like Eagle Ford) is about to reach its high;
Presently the futures market does not believe in a higher oil price, ref figure 17.
(I have based the price on Western Texas Intermediate (WTI) as the shale oil is land locked. The (shale) oils from the Bakken formation comes with a spread of qualities which is reflected in the pricing.
The lowered number of rigs could also be results from improved drilling technologies/drilling rigs. Still, number of rigs drilling may be an indicator to watch.
That is the “Red Queen” at work or the “drilling treadmill” as some refer to it.
Normally an operator adds a margin to the break even costs as a kind of “risk” protection.
It may still be early in the game, but experienced operators will monitor the project economics of every well and the total very closely. If the numbers start to draw a picture of poor returns (and possibly negative returns) they will start reworking their plans and put their money where they expect higher returns.
Therefore watch what the operators are actually doing.
The same trend has been documented for oil extraction from other shale plays like Eagle Ford.
Recently the trend has been towards lower productivity. This may suggest the “sweetest spots” has been drilled. This follows the classical pattern observed for all mineral extraction, the lowest hanging fruits get picked first.
That is the “Red Queen” at work or the “drilling treadmill” as some refer to it.
Did the above bring us a little closer to an answer? …and then hopefully a good answer ;-)
Rune
RUNE... excellent work. If you state that the average break-even price of these wells in the Bakken are $80-90, at a current $92.80 a barrel (WTI), would the EROEI be about the same as corn ethonal?
Hello and thanks!
I find EROEI a useful concept to describe declining energy returns on energy invested, however I would be careful to use price as a proxy to quantify EROEI but certainly a growing breakeven price sends a signal about the direction of EROEI.
Higher energy prices also signals less energy (net energy) made available to rest of society.
Was my answer of any help?
Rune
RUNE... thanks for the reply. According to those studying the EROEI of oil and gas (such as Cleveland, Hall, Murphy and etc) the EROEI of Shale oil was in a range of 4-5/1. I imagine this figure was calculated from the data taken early in the beginning stages of shale oil drilling.
With the data that you compilied from actual results, it looks as if the overall EROEI of shale oil may be much lower... that is, if we factor an average cost per well over the entire field.
It seems as if the SWEET SPOTS in the shale oil field may indeed carry an EROEI of 5/1, however this is not the average when we factor in all the wells in the field.
You are spot-on with your answer, Rune. We'd have to take into consideration energy expended for exploration, drilling, pumping, transportation, refinement, etc for EROEI.
Excellent article, btw (we need the Like button back), and it seems to suggest a follow-up from you at some point in the future...
We have heard that Alberta oil companies are receiving discounted WTI prices due to pipeline bottlenecks. How much is bakken crude really selling for? Is WTI a good guage?
Hello,
You post a good and crucial question.
Rose Rock Daily Price Bulletin publishes oil prices (which I presume is at the wellhead).
From the link above it shows the spread between North Dakota Sweet and North Dakota Sour at $6/bbl.
Many companies/operators have arranged transport (rail, truck and pipeline) for delivery at points which gives them an increased net back.
That is the higher price received (say at Cushing Oklahoma and WTI), so their net back at the well head is, let us for illustrative purposes stay with WTI, WTI adjusted for transport cost which EIA presently list as around $12/bbl.
Then the question arises how should taxes and royalties now be estimated, from the price achieved at the delivery point or from the price net backed to the wellhead?
Transport bottle necks (if there are any) have the potential to squeeze producers into accepting a lower price at the wellhead (I am not saying it is happening).
Rockefeller started out by transporting oil and the story says that he had the price posted in the oil fields every day by his representatives.
I am not sure if my answer brought us any further, but yes logistics may play a crucial role in prices achieved at the wellhead.
Rune
North Dakota oil is going into the same pipeline systems as Alberta oil, so it is suffering from the same bottlenecks and sells at the same discount to international (Brent) oil that Alberta oil does. WTI also suffers from the bottleneck at Cushing, so it sells at a discount to oil on the Gulf Coast, too.
In fact, some ND oil producers are trucking oil north into Canada and putting it into the Canadian export pipeline system, and others are having their oil hauled through Canada to refineries in the Eastern states by Canadian railroads.
The oil transportation infrastructure on the Canadian side of the border is more highly developed than the US transportation infrastructure in the northern states, mostly due to the high volume of Alberta oil production.
Thanks Rune quite clear and detailed reply. It's always a combination of qualitative arguments and quantitative measures when it comes down to future expectations (I find at least), and difficult to be in ballpark given many possible factors involved!
Rune, nicely done, TOD at it's best in fact. I have a few questions:
1. You have a chart under this quote:
This chart shows steep declines followed by long tails of milder decline rates. I get the point that initial levels decline fast. But decline rates do become more flattened as the years go on. Given the fact that thousands of these wells are being drilled, don't all these long tails add up to ever increasing levels over the years because each year more wells are being drilled that will produce long tails also? If I have 1,000 wells drilled per year then by year 10 I have 10,000 wells- doesn't the increase in all those long tails eventually overwhelm the initial decline rates so that each new well's decline rate is offset by adding more future long tails to the pile? I hope I am making sense here. I guess i am wondering because I have seen very little analysis in the news about the cumulative effect of all these long tails. If thousands of wells are being drilled those tails have to start adding up don't they?
2. How automatic can the extraction process become after intitial drilling? Drilling thousands of wells takes a lot of manpower. Are people required to stay at those drilled wells or does the gas come out on its own from there on in so the drillers are free to move to another site? I don't see how thousands of wells can be serviced and watched- or is this necessary?
3. The drilling and fracking process requires energy, but does the extraction process? Or does gas flow out on its own power? If energy is needed to pull gas out- how low does a long tail have to go before a well takes as much energy as it gives? There's not a natural gas equivalent to a stripper well is there? What happens to low performing wells?
4. Initially, as a new process is put into effect, costs are high becasue original equipment must be manufactured. But as the process continues, old equipment can be used again to save on costs. How much of the high costs of this drilling is due to having to build such a large supply of well drilling and fracking gear? Won't costs go down as old equipment and materials are reused over and over? If the fracking boom wears off, would't that cause equipment prices to plumet also- thereby maintaining affordability in drilling?
5. How much of the costs of drilling is equipment vs. other factors such as energy input, lease rights, labor, materials that cannot be reused, etc?
This is a lot, I know- just answering one or two questions would be enough for me. Again, good job.
The "long tails" on the well decline curves will never overwhelm the decline rates. The direction of production will always be down. Small companies can do okay by stretching out the production decline on old wells, but they have to deal with the fact that production is always decreasing, and cost control is their first priority. The only way to increase production is to drill more wells, and eventually they run out of places to drill them.
All the old wells eventually become "stripper" wells, producing only a few barrels a day, and 10,000 wells might produce only 50,000 bpd in total - which might be 45,000 bpd the next year and 41,000 bpd the year following. Eventually it all peters out and the entire field has to be abandoned.
The Bakken wells might not even be that good. We have no long term data on the decline curves of these fractured shale oil wells and don't really know how long their lives will be.
I'll just expand on what RMG says with an example -- I always find a numerical example helps understanding. Even a highly simplified one, with approximate figures.
Assume we're in a steady state: total production is the same every year. Assume wells have the production profile shown in Rune's fig. 15. Let's use the 70,000 barrels per year per well case.
Wells drilled one year ago produce 70,000 barrels, 2-, 3-, 4-, and 5-year-old wells produce 38,000, 24,000, 15,000 and 10,000 barrels respectively. Years 6 to 26 can be approximated with a straight line decline to zero: as a group, they produce an average of 4,500 barrels each well each year. At year 26 wells are retired.
Here are the relative numbers of wells of each age and their production in a table:-
drilling
(bbl/year/well)
wells
Production
We can see two things. In the steady state, 1 in 25 wells gets retired every year (those in year 26): we need that same number of new wells every year. And we can see that those new wells produce 70/247 (roughly a quarter) of the oil. We need those new wells every year.
If we want 2 million barrels per day total, every year we have to drill enough wells to provide half a million barrels per day. At 200 bpd/well (70,000 per year), that's 2,500 wells. If a rig can do 8 wells per year, 313 rigs are needed. In total there are 62,500 producing wells: 2,500 x 25. To put that in context, there are about 100,000 active wells in the US today, according to Rockman. The great majority of wells produce under 15 barrels per day.
Note that this simple scenario doesn't allow for inevitable decline in the quality of wells as the best prospects are drilled first, nor for trivial things like profit and loss.
greg et al - From deep within the eia.doe stats: Some facts that might surprise a few: Since 1950 2.6 million oil/NG wells were drilled in the US. And a great many more were drilled prior to that date. By the end of 2009 there were 825,000 producing oil wells in the US. The average oil well in the US produces less than 10 bopd. At the beginning of this decade 27,000 wells were drilled per year...recently that number has jumped to 40,000.
As a result the US is the largest producer of NG on the planet and the third largest oil producer. Yet by some estimates the US contains only 2% of the proven global oil reserve. And the credit goes to the US independents...not Big Oil. BO gave up major operations in this country decades ago. These companies can't function at the level of the extremely budget conscious independents. How pennywise are these independents? As we say they are so tite they squeeze a nickel so tite they make the buffalo poop. I've made the point before that any attempt to model future global oil/NG activities using the US history is pointless. The US is nearly matchless is this regard. Second place might go to Canada where the provinces have greater control over such activities then the national govt. This allows a much more aggressive and industry friendly environment. And particularly for the small independents. Consider the other extremes such as Mexico. If they had allowed similar access to their hydrocarbon extraction efforts they would probably be a major oil exporter for decades to come IMHO. And the Mexican people would have received much more revenue than PEMEX has ever generated. If folks think the US is in a bad energy self sufficiency position today imagine if domestic efforts had been conducted as they have been in Mexico or any other country where an NOC controls development.
So could the Bakken ever generate such a low (but collectively large) but stable oil rate? Just my guess but no. Not that individual wells won't reach that rate. But remember the US is producing almost 6 million bo from over 800,000 wells. Are there half a million plus VIABLE drill sites left in the Bakken? Some of Rune's stats seem to indicate that even the currently developing drill sites are showing decreasing productivity in a very short period of time. Add the increase in drilling costs and it's becomes difficult to imagine the Bakken development to carry on for decades as it has been IMHO.
Now the tar sands...that's a whole nuther kettle of oil.
But how many other countries have geologies which will sustain these stripper wells? I guess they need the oil to be close to the surface or to have some sort of water drive to keep the oil flowing, otherwise the pumping costs would exceed the oil value. Also they need to be near stable human habitation, and have easy transport links to existing oil transport or processing infrastructure. so no use in the middle of a desert or high in mountains. Also, the wells will need to transition from producer to stripper without the well being capped and abandoned, because the cost of reopening a well of stripper status would be too high. My guess is that you also need large numbers of wells closely spaced, so modern high tech multi lateral high contact horizontal wells will never reach stripper status because they are too widely spread on the ground.
I think most countries have missed the boat on the stripper well fat tail. In places like the North Sea it never existed.
I don't think it is geology but politics and economics that determines if a country has stripper wells. It requires a free-enterprise orientation in which little "mom-and-pop" oil operations can thrive (mom does the accounting and pop drives the oil truck). You don't have that in most other countries (Canada being an exception). A giant fumbling government-owned oil company like PEMEX could never maintain stripper wells. The cost of paperwork alone would exceed the value of the oil production.
Don't laugh - I've worked for companies that would send a "proposal to abandon" letter on wells we operated to partners just because the accounting costs were getting too onerous. If one of them wanted to take it over, we'd quit-claim our interest to them, otherwise we would abandon the well. In a mom-and-pop operation, if a well produces 1 barrel of oil in a month, that's enough to pay for the telephone bill. If they have a dozen wells that each produce 5 bpd, mom and pop will be laughing all the way to the bank.
The most efficient solution for a giant multinational oil company (which I also have worked for) would be to sell the old oil wells to the junior oil companies. The juniors can operate them at a profit, Big Oil can't.
That being said, there is no such thing as a deepwater offshore stripper well. The economics don't allow small companies to operate them at low flow rates, so companies (even small ones) operate them flat out until the flow rate becomes uneconomic, and then they abandon them. They don't stretch oil field production out endlessly.
That's why PEMEX is stuck between a rock and a hard place. Production at its supergiant Cantarell offshore field has fallen off a cliff, and its next biggest field (40% of its reserves) is the Chicontepec Field, which was found in 1926.
Chicontepec is a tight oil trend like the Bakken that requires PEMEX to drill more wells every year than it has drilled in its entire history, and control operating costs closely. It's an environment that junior oil companies thrive in, but a giant, overstaffed, government-owned bureaucracy like PEMEX can't handle at all.
Hello this may be of interest for many of you,
I do not (as of yet) have readily available dynamic simulations of area developments for Bakken (or other shale oil plays) but I have something illustrating the dynamics of area developments in Marcellus, shale gas.
The dynamics at work are the same for both shale gas and shale/tight oil, so hopefully what follows will illustrate the dynamics for these types of developments.
The chart above illustrates the dynamics in play for development of an area in Marcellus. The period as from January 2009 and as of June 2012 shows actual data from the company. The flow (areas and total brought in during the month) is on the left hand scale, number of wells brought to flow each month on the right hand scale (yellow circles connected by black line).
The sharp colors shows actual developments in flow added each month and number of wells added to obtain that flow. Further (towards 2025) the model forecasts (based upon recent data from pro forma wells obtained from companies operating in Marcellus) flows from the wells already in production.
Note the following:
What the study on Bakken shows, and what should be expected for all shale plays, is that well productivity will decline with time. This now suggests a higher number of wells will be needed to sustain the plateau than what is depicted in the chart above.
A higher plateau (all other things equal) would require a higher number of wells than shown.
The higher the number of wells drilled (assuming they are identical or close) will with time result in a higher base production that with time is expected to see a slowing in decline if no more wells are added.
Under normal operation/production there are few moving parts on a well. And by instrumentation (collecting data on flow, pressure, temperature, valve positions etc.) the wells may be left unattended and monitored from a central control room. Operators will normally make routine calls to the wells, check fences etc.
Maintenance and/or interventions will require trained personnel and rigs at the well.
Gas flows due to pressure differential between the underground and surface. It may become necessary to boost the pressure of the gas downstream the well to meet pressure requirement in pipelines.
Nat gas wells will normally flow as long they generate a positive net cash flow.
Most of the equipment may be reused except most of the production tubing and casings. Equipment is normally designed to allow operation for a specified number of years, and as it gets old it may be required to undergo new tests, modifications and certifications before allowed into operation again.
I do not have the exact split on what you are asking for as these things are specific for each well, and the price trajectories for lots of the services and consumables seems to move mainly upwards.
Was the above of any help?
Rune
Rune: you have exceeded my expectations in your answers. I have tossed the "initial decline rates vs. cumulative tails" debate in my head for some time and when I saw your post I knew i wanted to deal with this unexplored debate. It does look from your chart above that those tails do add up. I never thought that they would sustain HIGH production levels but I have always felt that they should not be dismissed either. In a low energy future those long tails might acquire a greater proportional weight of the total energy portfolio as other sources diminish.
FWIW I did understand that you were talking about oil and not natural gas but the concept of establishing whether or not gas production can be generated by stripper wells is essential if one wants to detrminine if natural gas also will have long tails that add up. I guess my main focus was intitial depletion vs. long term well accumulation of long tails.
Wish you could answer all the questions I have in life!
Rune, thanks for this great article! C8, I had the same general questions you have been posing here and wondered what the decline curves would look like if they continued out. If the decline rate remains constant at 40% per year, then the total production from an average well would be
Total production = Initial production * sum(r^i, i = 0 .. infinity)
For 0 < r < 1, the infinite sum converges and for a 40% decline rate, r = 0.6, the infinite sum is 2.5. In other words, if the initial production is 85,000 Bbls/year, then the total would be 212,500 Bbls. After a little more than six years, production is down to 10 barrels per day (3650 Bbls/year) and if it tailed out at that rate forever it would take almost 57 years to double the total extracted in the first six years. I'm just playing with the math here, and maybe the actual tails are considerably different.
Rembrandt - "as long as the oil price is high enough (110+ dollars per barrel) the operators can just keep on". I would agree if all other factors remained the same. But I'm starting to get the impression that those factors are shifting in the direction of less robust activity even with high oil prices.
While Rune's work indicates newer Bakken wells may not be quite as productive as previous efforts they still appear viable to a degree. But currently developing reserves have come at a significant cost increase. I just discovered this release from the operator Hess:
http://info.drillinginfo.com/urb/bakken/uncategorized/2012/07/hess-relea...
Hess has significantly increased the Bakken exposure: "Approximately 35% of this year’s capital and exploratory expenditures are devoted to the Bakken compared to 11% in 2009. 2012 capital budget for the Bakken increased from $2 billion to $3 billion." They also offer a clear explanation for part of the budget increase: "...an increase in drilling and completion costs, which are expected to average $11 MM versus original estimate of $8.5 MM. This is due to the need for ceramic proppant instead of white sand caused by market shortages". They are trying to transition as quickly as possible to a different completion technique which they hope will strip about $1 million off the completed cost of future wells. And one more factor: "...Increased infrastructure spending associated with design changes and labor costs on gas plant and gathering systems".
So even with a sustained high oil price profitability must be decreasing. That doesn't necessarily mean public companies won't continue to be aggressive. As discussed before the pubcos see an off book ROR by adding proved reserves regardless of low margins: increased (or at least static) stock valuations. Wall Street needs sizzle to get folks to buy a stock. Beyond the dividends all those potential buyers need to see a reason to expect higher future stock prices. An increasing reserves base (regardless of its profitability...or lack thereof) is a key metric.
A more difficult factor to quantify is capex availability. Typically when a company makes a big discovery it gives them a big boost in borrowing capability. The oil patch bankers I deal with allow some value to undrilled shale locations but nothing close to the credit lines a convention reservoir would garner given the reserve potential. The high decline rate per well is one obvious reason. Less obvious, except to the banker's geologists and engineers, is that a company will drill its best locations first and the less attractive ones later. Not only do initial results indicate future potential but often indicate an early peak.
The one advantage the shales have over most conventional reservoirs is a very high initial flow rate. This allows a very quick recovery of capex that can be recycled to new drilling efforts. But that revenue stream also quickly decreases. This wouldn't be an insurmountable problem if new drilling activity didn't outpace net income. But for many operators in the shales that doesn't appear to be the case. I'm not that familiar with the Bakken operators so I'll use one favorite poster child: Chesapeake. Granted CHK may be THE extreme example but they do highlight the capex availability problem. In the last several years CHK has sold over $25 billion in assets to generate drilling capex. The latest efforts were selling producing NG reserves in west Texas (in one of the worst markets to do so in decades) and a pipeline system (typically considered a long term cash cow). And by their own reports they may still be $10 billion short of capex requirements. But one might ask about their ability to borrow against all the "proven undeveloped oil" in the Eagle Ford. The last report CHK issued showed their bankers would only allow $4 to $5 billion. Or something less than 20% of their future capex needs.
I don't think the Bakken or EFS plays are dead. Not on life support nor even severely wounded. But I do suspect the high expansion rate in these and all other shale plays is over. Continued activity (as long as oil prices don't slide) for sure but I'll be surprised if some of the more optimistic expectations of production increases over time come to pass. And if oil prices slide significantly? We have a good model for that projection based upon the NG price collapse in late '80. Many companies went under. And two of the largest US independents, CHK and Devon, came close.
Rockman,
Rune's analysis is very sensitive to the interest rate (discount rate) of 7%. ATP is paying 24%! Do you know what other oil developers are paying for money?
Hello,
Chart above shows how the breakeven price when the discount rate is raised from 7% to 12%. All other parameters remaining equal to what is shown in figure 16 of this post
By raising the discount rate from 7% to 12% the breakeven price increases with roughly $10/bbl.
To me the parameters to watch that govern the economics of individual wells:
Rune
realist - Read a little closer and you'll see ATP is paying 12% on their bond which is also different than a revolving credit line: "The bonds are trading at 50 cents on the dollar. The interest rate based on the $50 price is around 24%." The bond holders are receiving what would calculate as 24% because the bond price has fallen 50%. ATP is still paying 12% for that money. A year or so ago you could have bought Greek bonds that would have paid you 60% interest...if they were paid off that is.
Various ways for a company to raise capex: bonds, credit lines (usually a point or two higher than the benchmark rates) stock sales, and what we humorously call "mezzanine bankers" which is a nicer name than loan shark. LOL. A lot of operators that have exhausted other avenues and have questionable asset values have to go to these MB's. They aren't bankers but investment companies. They'll charge an interest rate (that doesn't violate usury laws) but then also require some form of equity position in the project...like a 10% to 20% piece of the pie. But even beyond the financial chunk they take out of a company they also can exert significant control over daily operations and future plans. For instance in many cases all net cash flow may go to the MB to pay down the balance on the loan and the company has to go on bended need to ask for some capex it to perform new activities. Imagine how this could work for a small public company: they get a big chunk of capex, drill a bunch of wells, add beaucoup reserves that drives stock prices up, the officers et al (often including the MB) cash out of their stock positions, perhaps all the cash flow goes to paying off the debt and a piece of what every is left goes to the MB. Everyone comes out ahead except, of course, for the shareholders who buy in late in the game. But at least they end up with a nice tax right off. LOL. Once again the "Golden Rule" applies.
This is not a game for amateur armchair oil/NG investors. Often hot plays can turn into giant chum rings with lot of sharks circling waiting for the next mullet to show up. And yes "mullet' is an actual term we use in the oil patch for such foolish investors. I'm not kidding.
Great detailed study.
On a side note, the Bakken tight oil is often cited as the key reason for current US production "uptick", but looking at eia data, it appears that increase production in Texas is as much if not more behind this US production total increase :
more graphs below :
http://www.theoildrum.com/node/9502#comment-919798
Is this increase in Texas also tight oil ? Increased efforts on conventional fields ?
Y - "Is this increase in TEXAS also tight oil? Increased efforts on conventional fields?" Probably from the shales but west TEXAS activity has been booming as much as in the Eagle Ford. But I don't have a good feel for how it breaks down out there. They do have significant carbonate shales to exploit but also a lot of EOR that could be expanding in conventional reservoirs. But looking at rig count they are drilling a lot of new holes out there. Also part of the reason TEXAS is ahead in the race with the Bakken is our very mature infrastructure as well as being home base for almost all the service companies.
And, let's not forget, this is TEXAS. Even the letters in the state's name are bigger. LOL
Thanks a lot for the info Rock, any "gut feeling" on whether this increase will keep on going and for how long ?
Y - From every service company working the EFS the story is the same: operators are scaling back future drilling plans. Just can't quantify that expection. But given the high decline rates it won't take much of a slow up in adding new wells to see oil production begin to quickly level off or even drop if the cut back is significant. Some folks who haven't yet learned the shale plays aren't another Ghawar (despite some of the reserve volumes tossed out) may get a harsh dose of reality in a couple of years. If drilling activity slows up significant so will oil production.
Is it safe to say that in about five, no more than ten years, it'll be BUST?
I've been a regular reader of theoildrum.com, chrismartenson.com (now peakprosperity.com), energybulletin.net, carolynbaker.net, theautomaticearth.com, peakoilblues.com, etc. for some time. I will say that the vision I created from those websites as well as documentaries like Blind Spot, End of Suburbia, Crude Awakening and books such as The Party's Over, The Long Descent, and Twilight in the Desert had me quite literally bleeding my heart out to family and friends.
At the time I discovered the phenomenon of peak oil I was in college in the sciences. If I wasn't reading Twilight in the Desert I was reading textbooks on Thermodynamics; if I had a break from an introductory course on Economics I was investigating articles about the supply/demand balance of oil, and the in-elasticity of supply; if I was studying the energy supplied by C-H bonds for an exam I was later watching Crude Awakening.
My knowledge of our species predicament flows to the depths of Jared Diamond and Joseph Tainter; my understanding of how quaint our quarrels rests in my passion for astronomy. Homo sapiens is in crisis now, but does Alpha Centuri care? Within our galaxy is over 150 billion stars. Does a neighboring galaxy care? Was our planet less important 100 million years ago when the evolutionary transition from dinosaur to bird was in mid-swing?
On a more imaginative tangent, will our destruction have been a positive or negative 50 million years from now when birds exceed our "intelligence". If you were a Brontosaurus would you sacrifice yourself to allow Homo sapiens to have a brief moment in Earth's history 65 million years later?
Carl Sagan said that we are but a mote of dust suspended in a ray of sun. In terms of distance it was a spectacular point. I posit that we are but a thin sheet in the book of time. In the book of life on Earth we are but a page on an Encyclopedia; in the book of universal time, we are put a page on Wikipedia.
Hello,
The chart above shows development in US supplies of all liquid energy by category from January 2000 and as of June 2012. Green columns are crude oil and condensates.
The chart shows a slow build in US supplies of crude oil and condensates starting as of late 2009 (there are some effects from the hurricane Ike as well) which accelerated in mid 2011. Note the steep build in shale/tight oil from Bakken in figure 03 (in this post and then increased drilling in Eagle Ford, Texas) starting mid 2011 and then look at the chart above.
Note also how US supplies rose in response to a higher oil price. This has been observed for other basins as well like the North Sea, a higher price stimulated development of what had been marginal discoveries but also slowed the decline rate of older fields.
Recently the growth in US crude oil and condensates supplies has slowed or gone flat. More recent data as these from EIA Weekly Supply Estimates shows a continuation of the declining trend in the 4-Week Average for US Domestic Crude Oil production.
Rune
Just eyeballing the chart, it looks like US c&c supply started to increase in late 2008 rather than late 2009 as stated.
Thanks for the great analysis, Rune.
Thanks a lot for the information
Rune,
Don't forget to include the cost of capital as well. Cheap money encourages drilling. Have you looked at the oil bond rates? My guess is that the discount rate for drilling for oil is going to rise. But I could be wrong, do investors still think that drilling for oil is a good play?
Hello,
Under figure 16 it is stated that financial costs are not included. This was done to avoid any discussions about the degree debt was used to finance a well and the cost of that capital.
If the level of debt financing, interest rates was known and included in the economic analysis the effects from these would most likely lift the break even price.
You raise an interesting question, whereby the answer lies in understanding that the game may be both pleasing the "street economics" (as in Wall Street) and obtaining good project economics (profitability, return on capital/investment).
There are examples that "street economics" is The Game and in such circumstances the commercial sense of drilling wells (project economics) becomes subordinate.
Rune
I'm curious as to why the costs for shale oil amount to $80-$90 per barrel, whereas the breakeven costs for shale gas (dry gas plays) seem to lie in the region of $5 per mmbtu (according to what I read on the 'net)...
If I did the maths correctly, $5 per mmbtu equates to approximately $30 per barrel of oil equivalent.
Are the drilling and fracking techniques and materials required for shale oil dramatically different than those for shale gas, or is it simply a question of shale oil leases costing so much more by virtue of the fact that the output is worth so much more?
Hello,
It is all about the flow and Estimated Ultimate Recovery (EUR) as measured in barrels of oil equivalents.
A good shale gas well may have 3-4 000 Mcf/d during its first year of flow, which translates into like 530 - 710 Barrels of oil equivalents per day. It will also have an expected higher Estimate on Ultimate Recovery (EUR) as measured in barrels of oil equivalents.
An "average" shale oil well may yield around 230 bbls/d in its first year, and a lower expected EUR as measured in barrels of oil equivalents.
Rune
I'll try and break this down as best as I can.
To begin with, as Rune has mentioned, EUR's on shale gas wells are higher. This can be a bit of a catch all statement in the sense that higher EUR's doesn't really get you closer to an answer. It should however make you question why EURs are higher on Gas VS Oil shale wells.
For my understanding I find it is best to start at the very basics. Longer chain hydrocarbons such as oil require more permeability to flow compared to short chain hydrocarbons such as natural gas. Recall that the big development in shale drilling has been our ability create artificial permeability using high strength proppant and hydraulic fracturing. Likewise in the search for these tighter reservoirs E&P companies have pursued deeper reservoirs, often targeting source rock that are 1000's of meters deep.
The catch with deep reservoirs is the requirement of stronger proppant to hold open the reservoir for oil/gas to flow. Larger proppants are needed for oil reservoirs as they need larger permeability. This leads to a serious problem, generally larger proppants have lower crush strength. Essentially meaning large proppants won't do their job in deep, high pressure reservoirs. In order to get around this problem extra strength proppants need to be made, which comes at a cost. Below is a general market breakdown of proppant strength and cost.
Currently the market for proppants is as follows, from weakest crush strength to strongest crush strength.
Pure Silica Sand ---> 5000 to 8000 crush strength.
Resin Coated Silica Sand ---> Takes regular sand and multiply by 1.5x to 2x crush strength
Ceramic Proppant ---> 8000 to 16000 crush strength.
Resin Coated Ceramic Proppant ---> Takes regular Ceramic and multiply by 1.5x to 2x crush strength
Prices for these sands range as follows:
Pure Silica Sand ---> $50/tonne at mine (add in another $50 for transport)
Resin Coated Silica Sand ---> $400 - $500 / tonne at plant (add in another $50 for transport)
Ceramic Proppant ---> $500 - $800+ / tonne at ceramic factory. (add in another $50 for transport)
Resin Coated Ceramic Proppant ---> Not entirely sure. Guessing $1,000 + / tonne
For example a 20 stage 200 Tonne frac stage well will require 4,000 tonnes of proppant.
Cost Breakdown
Pure Silica Sand ---> 4000 * 100 = 400,000
Resin Coated Silica Sand ---> 4000 * 400 = 1,600,000
Ceramic Proppant ---> 4000 * 800 = 3,200,000
Resin Coated Ceramic Proppant ---> 4000 * 1000 = 4,000,000
Where a shale gas well might be able to get away with using pure silica sand, a tight oil well will require a resin coated of ceramic proppant. Essentially shale gas has higher potential to cost cut which in turn lowers the required break even price.
Hope this helps!
Cheers,
Moric
Thanks Rune and Moric, very informative.
Moric,
Thanks a lot for your information, I learned something new about crush strengths and costs for proppants.
Rune
Very deep analysis RuneLikvern! Congrats on a job well done!
Out of curiosity what sort of monthly are you paying for your data on the Bakken? Seems like your pretty up to date as far as data goes! I had originally thought that getting that kind of data in the States was near impossible...
Hello and thanks for your acknowledgement.
The data are freely available from the North Dakota State Government who publishes them monthly.
The challenge lies in reformatting the published data, but that is manageable with good, flexible spreadsheets and some helpful tools like Acrobat (the printer)….and most importantly a good system for easy and thorough quality assurance.
As the spreadsheets are established (and given they are of a desired flexible design) any updates does not take much time.
By reformatting into spreadsheets it allows lots of alternative operations to present the data.
Rune
Excellent work - in examining well productivity did you consider taking a look at normalizing to lateral length and completion intensity - or was that data unavailable? This might make the picture look a bit better/worse.
edit: and oh yes, the race is on the only question being how fast is the treadmill running?
Thanks, Rune, that's a very good article documenting what is happening in the Bakken. It is nice having some hard data rather than having to rely on intuition.
The "Red Queen" effect is something that continually bedevils people in the oil industry, although the senior executives of companies don't like to admit it or talk about it. I usually refer to it as the "treadmill" effect - you are on a treadmill that is running faster and faster, until eventually you can't run fast enough to stay on, and then you fall off. I have worked for a number of companies that fell off the end of the treadmill and are no longer in existence, which is why I use that metaphor. I don't think Alice or the Red Queen had that problem.
I was surprised at the high prices estimated for Bakken production. $80-$90/bbl is in the range of new Alberta oil sands production, and the established oil sands operators are producing oil for $35-$45/bbl. Only the new operations are in the $80-$90 range because of the high startup costs. The sweet, light Bakken oil gets a higher price than sour, heavy oil sands bitumen, but the fundamental difference between the Bakken and the oil sands are that oil sands producers are not on a treadmill or chasing the Red Queen. If they slow down their spending, their costs drop, but their production stays constant into the foreseeable future (e.g. 40 years).
At one point, around Y2000 when oil prices were very low, they managed to cut production costs to around $14/bbl but maintained a flat production rate with no decline - in fact a bit of an increase. A region such as the Bakken would have seen a very steep overall decline as no new wells were drilled and all the old oil wells declined simultaneously.
The high initial production of Bakken wells looks very good in the promotional brochures and web sites, but their very steep decline curve will certainly cause big problems in the long term. Having run some simulations of this (purely theoretical, of course), I would say that in the long term the Bakken will display a classic bell-shaped Hubbert curve, like most conventional oil fields do. The Eagle Ford in Texas will probably do the same, and the two will probably peak around the same time, giving one big bell-shaped curve for North Dakota plus Texas oil shale. (I use the term "oil shale" loosely).
This will probably come as a complete shock to those over-exuberant investors and casual observers who expect exponential growth curves to go on forever. They never do.
RMG, thanks!
What the data showed for Bakken is not what I expected. Expectations from reading media and company presentations were that productivity (as defined in the study) was growing.
To me this signals something that should get the attention from more people as companies now voices hopes for increasing recoveries from 50% to 60% from existing almost depleted fields in the North Sea. (I think to get as high recovery as possible is a good thing and shows good husbandry of resources.)
Expressed hopes about dramatically increasing recoveries from almost depleted fields may also be a quiet admission from the oil companies that there are not that many great prospects left worth drilling into. Hope is, as everyone knows, not a strategy.
High breakeven costs for shale oil, oil sands, expensive GTL are all presages about expensive marginal barrels. As long the economies (consumers) can bear the costs I believe it is still possible to grow world supplies for some time (2 or 3 years into the future as I see it now).
Rune
Rune, I add my thanks.
Is there any information yet on the number of closed-down older wells, or the number reduced to 'stripper' wells at 10 or so barrels per day? Perhaps, (this is my question), an average period of production might help the predictive maths as the well-drilling 'front' proceeds into the shale formations?
I still do not have a full picture as to how the companies find the 'hot-spots' in the Bakken etc though I am much obliged to Rockman for this description of the earlier Austin Chalk development in answer to some questions of mine. http://www.theoildrum.com/node/9492/918927 Excerpts below:
Hello Phil,
The shale oil (that is the scale of present activities) is still early in the game, but with time and more actual data released the predictive powers will improve.
I read somewhere that someone had made and extensive analysis (may have been Bernstein) of Bakken wells and concluded (IIRC) that the number was six (6), what was meant by that is that it took six years from a Bakken well started to flow until it became a stripper well (that is a flow of 10 - 15 bbls/d).
With regard to identifying the “sweet” spots, the companies will be able to map the area from data gathered from the wells. With time, more wells, more data points, the understanding evolves and it becomes possible to draw up maps like this one for Marcellus .
I have seen similar maps for Bakken and Eagle Ford, but these come with privileges.
Rune
Rune - On that map, is organic thickness an indication of resource volume, or...? Wondering why the thickest part of the formation seems to have been the least exploited to date.
For all,
EIA has an article published May 23rd 2012 titled Horizontal drilling boosts Pennsylvania’s natural gas production .
On the page linked to there is an animation of drilling activities (horizontal and non-horizontal wells) in Pennsylvania (Marcellus). The animation shows that all the recent action now takes place in the red areas on the map (which was published in April 2011 (if I get the American date terms right).
Could the page and the animation help provide a hint of an answer about Marcellus?
Rune
Thanks again Rune.
Just a 'silly' scenario on my part - but 40,000 stripper wells by 2030 could produce 0.5 mbbls/day.
Well - maybe ...
Well, if it wasn't for unconventional oil like tar sands and shale oil, the 'peak oil' hypothesis would be in full affect now. I don't think shale oil or tar sands in US, Canada and Venezuela will ever make up for the conventional stuff we get from OPEC or the North Sea or anywhere else, but its sure does delay it (we're at 92 mbl/d now and thats even though conventional oil is in decline).
Petro - very good point and an opportunity for me to jump on my soap again and argue the relatively unimportant nature of the actual PO date IMHO. You may already know that I'm a plateauite and not a peaker. But IMHO that distinction isn't really that important either. A while ago we banded about the new alphabet soap of the day: POD...Peak Oil Dynamic. It just puts an acronym to discussions we have all the time here on TOD. It's about demand destruction, ELM, short term vs. long term production trends, new tech which aren't that new but are now viable, new trends that aren't new but thanks to higher oil/NG prices became viable, public company demands to show reserve growth, above ground political factors, military adventures, SPR releases, conservation efforts and lack thereof, environmental factors, political pandering, etc.
IMHO the exact date of PO, be it 2005 or 2020, is of little relevance compared to all the factors I just mentioned and others I didn't. Just as you point out the potential for unconventional production to change that time line. But even if it does extend the date years into the future we are still left to deal with all the same aspects of the POD as we have been for a number of years now and will have to deal with for decades to come..
Whats happening now with the substitution of conventional, cheap oil with unconventional oil is much akin to how an organism allocates its own energy resources. My body has an automatic process by which is decides what energy resources it will utilize. If I don't eat for 5 days my body will go through a process I cannot control. It essentially boils down to burning immediately available glycogen, then stored fat reserves, then muscle, and finally reserves around my organs. Every next step in the process is undesirable and effects the health of the organism, but is necessary to keep it alive.
Just as the body of a human being automatically chooses which energy reserves to access the global economy automatically chooses which energy it uses. I am a conscious, thinking Homo sapiens yet I have little to no control over what energy reserves my body chooses to burn just as an individual in the global economy can be conscious and aware yet have little to no effect on the macroeconomic picture. Our bodies have evolved to choose the lowest hanging fruit to harvest first, and our global system of trade has evolved over time to do exactly that. Why? Because its the most efficient method. Unfortunately, discounting the future for immediate benefit is something that is built in the fabric of life, physics, and chemistry. A trickle of water carving a path down a hill must take the easiest route available, not the route that would, at a later date, serve its needs better.
To say that the peak oil hypothesis would be in full affect misses the point that this is the way this trickle of water was destined to flow downhill. We should cherish and effectively use the time gained by the development of the lesser quality, higher hanging fruit that unconventional oil provides.
In 2008 I was a 21 year old college student. The oil plateau unconventional oil has created allowed me to graduate, move to Florida, save money, buy a house, and grow a permaculture garden and food forest on my property. Were it not for unconventional liquid fuels this reality I live in would not have been.
I do, however, find it odd that I'm grateful for the exploitation of a resource that will severely exacerbate the affects of climate change. I've thought for some time that our predicament is peculiar. Either global economic growth is over, or the earth's temperature and oceans rise dramatically... or both.
Thats a great way to think of it. Im 24 years old so we're at the same stage in life, I guess we'll have our children too one day, and for them to be in their 20s as well later in life and get a house, a car and perhaps even a boat with a big Evinrude on the stern, is something we should want them to have. But I believe young peoples opportunities 30 years from now is going to be a lot different. I dont hold the answers, but after hearing all that stuff about the side effects of fracking shale oil and gas I'm not so sure if its the right path.
I'm almost 60 and have a college age son, trying not to be too negative here, but may I suggest that you might want to guess again.
Though I do agree with you that 30 years from now things will probably be very different, with or without the fracking...
http://i289.photobucket.com/albums/ll225/Fmagyar/coping.jpg
http://i289.photobucket.com/albums/ll225/Fmagyar/ExponentialFunction2.jpg
When you say that you are grateful for the opportunities that the unconventional plays have provided to you, you are reacting on a "micro-ecological" scale, just as there are separate economics textbooks for how companies behave on a microeconomic vs. macroeconomic scale. "Micro-ecologics" is actually the same thing as microeconomics, it's just that economists don't understand it yet. The reason for this is that everything that economists erroneously attribute to "economic productivity" is actually consumption ...... of ecological productivity, because 95% of global energy supply comes from burning dead things that used to be alive -- i.e. plants, or the animals that ate them, all of course produced by your friendly neighbourhood ecosystem, or alternatively one from 150 million years ago buried underground.
The problem is that billions of people reacting individually to their micro-ecological situation all adds up to a pretty ugly macro-economic predicament. This is because in the natural world, every time a population is provided a source of energy in the form of complex carbon molecules, that population will grow to exploit that source of productivity, just like a stream will take the lowest route down the hill. How that increased population then fares is dependent on whether that energy source is sustainable or not, and a host of other issues like disease, climate, etc.
The problem with this concept of economic "productivity" is that our economists constantly strive to increase it. In that respect, we are no different than a population of deer introduced to a new island -- we will grow to take advantage of that opportunity (and one could imagine that the deer probably rationalize their growth by telling themselves that they are "producing" the grass they eat by keeping the competing trees away -- okay, they probably don't actually think that, but it's a perfect analogy to how our economists rationalize it).
Every economist will always put the two words "healthy" and "growing" together as a goal of economics. This is exactly what all the desperate measures to prop up the global economy since 2008 have been aimed at -- how to jumpstart growth. Of course, all of us here know that isn't going to happen, but try explaining that to an economist. If you go to the Wikipedia page for Keynesian Economics, you will see this attitude in such garish display that it isn't even questioned by 99.9% of economists.
But this perpetually increasing economic productivity actually perfectly correlates with perpetually increasing consumption of ecological productivity (the efficiency gains that economists believe have enabled humanity to "do more with less" over the years aren't actually real and amount to only minor trimming). Now the real heart of problem appears, in that economists don't have a clue how ecological productivity and energy work. If only they understood the one simple stat that you'll never see in any economics textbook -- that the total ecological productivity of the planet (i.e. the ability of our economies to consume in order to "produce") has actually gone down by 10% since the rise of humanity! And that's even factoring in all the wonderful agricultural advances from the Green Revolution (almost all of which are dependent on unsustainable fossil fuel and irrigation inputs)!
Considering that 95% of our activity is powered by ecological productivity, and since the total ecological productivity has gone down by 10%, then how could our economies possibly continue to grow? It's a head scratcher to me! But then, I don't come from economics circles so it's not so easy for me to compartmentalize this problem into a black box and bury it under some phony mathematical equation the way economists do...
In order to provide for the current extent of economic "productivity", humanity has to consume several times more ecological productivity than the planet can sustainably provide (we use about 5.5 cubic miles of oil equivalent energy per year, and the planet could maybe provide 1 for us sustainably, the way we've organized our societies). This number is a little fuzzy, but we've therefore probably overshot the carrying capacity of the planet about 5 fold, absent some other external energy input, which currently is provided by fossil fuels. And we have no obvious alternative currently being ramped up in time to take their place.
In this case, all of our technology will not help us one iota when the crash happens, because without a potential energy gradient, technology is useless. In this case we will follow the fate of every single other species in the history of the world that has overshot its underlying carrying capacity -- their populations crash and actually undershoot the long term carrying capacity for a while until the underlying ecosystem functions can be rebuilt. The sustainable world population is probably around a billion max without external energy inputs, but we would crash well below that once the current 7 billion falls off a cliff.
So the whole point of this shpeel is that the unconventional oil plays have merely allowed us to extend and pretend for a few more years -- to grow our economies even further, to increase the degree of ecological overshoot we will soon have to contend with. It's sad, because the unconventional plays could have instead provided an opportunity to develop alternative energy systems in time to prevent a collapse, like solar and nuclear. But unfortunately our leaders and economists do not see the need to do this, or have some blind faith in the ability of "the market" to solve this by itself, and instead follow their misguided fantasies of economic growth, since they view the current lack of economic "productivity" as a result of our economies not growing fast enough. They then try to stoke the fires of growth some more, but since they have it completely backwards, all this does is wring the last few drops of ecological productivity left out of the planet that can't really provide any more.
In the long run, humanity would have been much better off if we had run out of oil in 1950.
rosex229
Recommend you examine what is needed to:
1) Feed our growing population - more productive agriculture - from more CO2.
2) Prevent the next glaciation - warm the earth - from more CO2.
3) Synthesize transport fuels - from natural gas, CO2-EOR, oil sands, & coal - which will generate more CO2.
I believe that is much more prudent stewardship - compared to:
Starving the poor!
Freezing most of our population!
Running dry and destroying our economies!
Current evidence, is that the decadal temperature trend has turned to cooling since 2002. - NOT predicted by the IPCC's 0.2 C/decade.
Thanks, Rune, for insightful work.
I wonder at the eventual impact on the people of the Dakotas and Montana, Manitoba and Saskatchawan. I remember seeing a number of articles about the stress on their schools, shortages of teachers, etc., and of course physical resources for water, sewers, etc... then I look at the distribution of US Ghost Towns (http://ghosttowns.com/) and ponder long term consequences.
Are active wells apt to be moving around (from field to field)? How significant has the local borrowing been? Municipal debt, environmental damage and wild economic upheaval seemed logically to follow from the Gold Rush and Silver Rush. How will the great Oil Rush of the early 21st Century differ?
Craig
Thanks, Rune. Excellent work!
Not "Alice in Wonderland", but "Alice through the Looking Glass".
Old Ari
You are right and thank you!
It has been edited. There are two Red Queens in Carrolls stories, and both are very different.
Rune
Two Red Queens... both very different, and yet strangely the same.
What WAS that man smoking?
Craig
Exact title is "Through the Looking-Glass, and What Alice Found There" or just "Through the Looking-Glass" if second part considered as subtitle
Not sure if this has been posted before:
http://co101w.col101.mail.live.com/default.aspx?wa=wsignin1.0#n=14391748...
Snip:
It takes oil money to make oil money - Black Hills Pioneer: Local News
It takes oil money to make oil money
By Jaci Conrad Pearson Black Hills Pioneer | Posted: Wednesday, September 19, 2012 11:30 am
SPEARFISH — While it may seem to the innocent bystander that the North Dakota oil boom is running rampant, the entire process is actually a very delicate dance, involving hundreds of companies, thousands of decisions and millions of dollars.
“It takes $3 per second, $18 per minute, $10,800 per hour and $259,000 a day to drill an onshore well,” said Kent Ellis, owner of Aurora Energy Solutions, LLC, an oil and gas brokerage firm with offices in Bismarck, N.D and Oklahoma City, Oklahoma, during his address to a crowd of more than 100 gathered for his presentation as part of the Black Hills Pioneer's Oil, Gas and Mineral Rights Workshop.
“It costs between $8 and $9 million to drill a well and oil companies are very risk averse. Unless they are 100 percent certain there is oil there, they don't begin drilling. They are very cautious … What used to be a six-week project, now averages a month. It takes 2,200 gallons-plus of diesel fuel a day, just to run the rig.”
And moving the rig is another story and another significant cost.
“To move a rig from Spearfish to Belle Fourche costs around $250,000,” Ellis said. “There are around 60 semi loads to move. The rig breaks down in semi-sized Lego parts. To rig up and rig down is an expensive venture. A complete start to finish well in the Bakken formation entails hauling between 1,200 and 2,000 truckloads of stuff and around $33,000 per acre to reclaim.”
Very nice work, Rune. I appreciate your detailed and highly transparent analysis here.
Chris, thanks!
The idea was to present the data and results in such a way that anyone could do a check.
Rune
I wonder if we should simply assume an optimistic scenario that oil prices will, on a trending average, be supportive of expanding unconventional liquid fuels production. The only way I can foresee a significantly lower oil price would be in the case of a severe global recession.
I want to cover that scenario from two perspectives.
1. The global economy has had a tepid "recovery" from the previous recession, and global economic indicators are signifying a mild recession is either occurring or about to occur. Even with Europe in recession, U.S. growth weak, and Asian growth slowing Brent still sits at $110.
2. If a Lehman moment happens and a fresh round of financial panic ensues it would resemble 2008 to some degree. Global economic growth would hit a wall, oil prices would fall precipitously, and then the economy would settle (need not recover) and oil prices would zoom up again. This would happen much like 2008, perhaps with more volatility, for two reasons. First, lower oil prices would effectively allow global discretionary spending to increase. Secondly, The Central Banks of the world would do everything in their power to put gas back into the economy (Quantitative Easing on a massive, global scale).
To conclude I must ask, if oil prices plunge will it have a significant effect on unconventional production? Considering the fact that even Midwestern farmers (much less oil companies) hedge their bets to reduce the effects of price volatility these days wouldn't it be safe to assume that companies in the Bakken Formation can weather a temporary collapse in oil prices?
Hello,
Wells (fields) that have been drilled/developed will continue to produce as long they have a positive net cash flow.
There may of course be other considerations as well linked to company strategies.
That they continue to produce/flow does not necessarily mean the wells/fields are profitable, it is just that the game changes from return on capital to return of capital.
"Cheaper" oil could mean some are losing some of (and perhaps all) their capital/savings that was invested in a well/field to obtain profit.
Rune
First, GREAT work ! Very well done and well presented. A highlight on TOD :-)
My addition to the analysis -
Within a few years:
1) Pipeline capacity will be expanded enough and the WTI-Brent split will revert close to the traditional + or - $1 or $2. Due to the long term investment of pipelines, the trend will be for a slight shortage of pipeline capacity.
1b) Natural gas prices should increase, as well as gathering pipelines in North Dakota. More NG will be sold and less flared, adding another revenue stream.
2) Infrastructure, particularly housing & commercial space, in western North Dakota will expand and the shortage premium will decline substantially. Likewise more labor will move into western North Dakota and fewer will commute, which will indirectly affect labor costs.
3) Drilling rigs and fracing operations will reduce their current premium due to a better supply - demand balance.
From an oil company perspective, #1 will add around $18/barrel and #2 & #3 will reduce costs by, say, 40% if the steam drops out of the boom.
I am a believer in the IMF model - world oil prices will climb on an average of +7% (inflation adjusted) per year. This will support continued pressure to drill the Bakken, and reduce #2 and #3 while improving oil field economics.
Given the prospect of improving, and not stable, economics for Bakken drilling, the prediction for Bakken should change.
Higher producer prices and/or lower costs will increase drilling.
How much is speculative. But these factors appear to have been overlooked in the macro analysis.
Alan
Hello Alan and thanks!
Hope all is well with you and New Orleans (all considered) and I hope I one day will get to come and revisit New Orleans…it is decades since I have been there.
In short the major driver is the oil price and striking a balance between making new projects (wells) profitable and consumers afford the price.
Predicting oil prices for the near term future is a risky sport as some countries (Portugal, Spain, US, Italy to name a few) has dramatically cut down their demand/consumption during the past few years.
This raises the possibility of demand dropping below supplies for some time, and the experiences from the fall of 2008 gives a little insight on how a small reduction in demand had a dramatic effect on the oil price.
Anyway we slice it, the price for the marginal crude oil barrel is now in the range of $70-$90/bbl for oil sands, Bakken, the North Sea, so long term high oil prices seems to be a given.
Rune
Let me know when you come to New Orleans :-)
On this point - if drilling merely stays constant, then the cost of wells will decline.
Supporting infrastructure will mature, the labor force will move to western North Dakota, gas gathering pipelines will be extended (adding revenue), the "shortage premium" that drives costs today will dissipate.
If drilling declines, then costs will drop even more.
Only if drilling increases, might drilling costs stay stable, or even increase.
Best Hopes for Great Analysis,
Alan
This is great analysis, and really well put together. I'm going to point everybody to this when I hear the usual speculation about where the Bakken will peak thrown around. That's some data, by golly!
Rune, thank you for the most excellent and in my case most timely post. A panel discussion/town hall meeting (hosted by the co-chair of the state senate resource committee) on the potential of a North Slope shale oil play is going down here in town tomorrow. Great to have real numbers and trends for the Bakken going in. I'm curious to see how Great Bear's (the company president, Ed Duncan, is a panelist) expectations compare with them.
Is there a ballpark number for how many feet of pipe the average Bakken completion takes? Actually what I'd really like to know is how many truckloads of materials/supplies per completion. Only one road to the North Slope.
Just to make it short, it would take me some time to find how much pipe the "average" well takes.
When it comes to truck loads I have seen several sources mention anywhere between 1 200 and 1 500 heavy truck loads per well (as in one). Convoy?
Rune
Thanks again Rune.
That is a big number. 200 hundred wells in a month (Bakken approached this) would be around 2.5 million truckloads. I'm guessing 1200-1500 heavy trucks includes the drilling rig, other heavy equipment and gravel for pads that often does not have to travel far between/to wells.
If however that is not the case doing ten wells a month on the North Slope would put a truck on the haul road about every 3-4 minutes. That only comes up to 120 wells a year, the 200 wells a year number Great Bear has thrown out would cut the interval between trucks almost in half and use about 7,000-10,000 barrels of diesel a day just for rountrip north of Fairbanks.
Add in the plan to truck 7bcf of LNG south plus the normal North Slope supply traffic and I might have to wear earplugs on my porch, its less than 2 miles as the raven flies from the summit of a pretty fair hill every truck would climb just north of Fairbanks. Can't imagine how we would manage the road upkeep.
...but I really don't think the numbers will fly for Great Bear unless oil is a fair bit over $100/bbl.
Robert
LukeH,
The number of truck loads includes the moving of drilling rigs (which are disassembled, moved and reassembled as required).
200 wells a month should be around 250 000 truckloads.
How is the oil being transported from Great Bear to its destinations (refineries/ports)? By truck?
Rune
Rune,
Great Bear's leases abut the Trans Alaska Pipeline System (TAPS) corridor a bit north of the Brooks Range. The initial operation is to truck crude north to the aging Prudhoe collection facilities through which it will enter the TAPS. As the operation ramps up the proposal is to build new collection facilities on the lease holdings and directly access TAPS from there. Off hand I can't recall the initial proposed spacing between drill pads or the number of wells proposed from each pad--gravel pad layout is not an insignificant consideration on the permafrost underlain North Slope.
I expect Ed Duncan will lay out the potential big picture at the panel discussion/town hall meeting this afternoon. I'll try and give a more accurate account of things this evening. If I recall he was talking operations being in full swing with production starting this winter season a couple/few years back when he was presenting the project to the state legislature--a tad optimistic to say the least.
Thanks for catching my factor of ten error on Bakken trucks, 2.5 million sounded huge, though 250,000 loads no doubt are noticed even if many are relatively local.
Oh by the way my diesel fuel calculation was probably twice what it should have been as well. I doubled the one way trip twice inadvertently but I'm not sure haul road rigs actually get the 4mpg I used either, its a tough road with some big grades. If he doesn't give number during the panel discussion I plan to ask Mr. Duncan just how many truck loads per well will have to get up the road after the rigs are in place.
Some diesel is refined on the North Slope, way closer to the Great Bear leases than our North Pole Refinery. It would seem those couple very small refineries might have unused capacity since many North Slope operations that formerly used diesel now use natural gas, but then the refining facilities are old and may have been downsized and upgraded simultaneously. Of course a shale operation does produce natural gas. In a remote location like the North Slope the economics for using that gas to fuel drilling operations and more might pencil more readily than they would in North Dakota.
Robert
Well not many specifics given at the little show, more a community pep talk, but we were among the first to see last nights core break from the second exploration well, which may have been being completed at that moment. Pretty cool looking bunch of clam shell impressions on the rich black surface of the break--I think pulled up from the Shublik Formation but I didn't take notes so I won't swear to it.
Not too awful much info on the Great Bear web site and Mr. Duncan skated around my questions rather deftly. Though out of fairness I must state that Great Bear first bought their North Slope leases in October 2010, it just seemed I'b been hearing about them longer. Ed Duncan's original presentation to the state legislature was less than two years ago not the couple/few years ago I indicated upthread. They actually have moved rather rapidly for a North Slope player.
I guess I should have looked at the handout. In his presentation to the House Resource Committee (Alaska) February 2011, the Great Bear CEO stated
'We have an aggressive program that supports 250 wells per year for 20 years starting in 2013.
That does not actually contradict the more recent presentation he gave to the Senate Resource Committee (Alaska) in April 2012 but it does leave quite a different taste in your mouth than
Gravel pad (up to 24 wells)
the drilling part of Phase 2 which covers years 2013-2014
Still quite aggressive but certainly a little less flamboyantly presented.
Luke,
That black shale with fossils was indeed most likely Shublik, which is highly fossiliferous. It is one of the main source rocks for Prudhoe Bay, and I think Duncan has said that would be their initial target for production.
With N Slope operating costs being what they are, I'm a bit skeptical that Great Bear can make any money up there. Controlling drilling costs will be key I think. But who knows, they just might make it work if oil prices stay up. Certainly starting next to the Dalton is a smart thing for him to do.
Thanks geo. An interesting dance to watch, that is sure. He mentioned having extremely close relationships with a set of vendors on this project--Halliburton seems an awful big player to be teaming up with a small startup. I've never stumbled onto something like this at the get go before, well worth the price of admission. The financials could be fascinating.
Wouldn't doubt you and Duncan get coffee at the same shops from time to time, he specifically mentioned Eagle River in some context yesterday.
Rune,
Thanks for a very interesting and well researched analysis. I have passed the link on to some folks who might find it useful and informative.
Excellent detailed post Rune - thankyou.
I look forward to watching how the Bakken plays out over the next few years (and in saying that I hope you might do another update for us in a few years time).
Good post. I did not get a sense of exactly the shape of the typical decline curve though.
Is it an exponential decline? Definitely not, as the tails are too fat.
Is it an hyperbolic decline? Closer, but they are still a bit fat as in Figure 15.
Is it a diffusive decline? The ones in Figure 5 look diffusive with heavy tails, but Figure 15 looks thinner.
I could straightforwardly do the model fit if I could get access to the processed data culled from the PDFs. This has real implications for the strength of the decline.
My recipe is here: http://theoilconundrum.blogspot.com/2012/07/bakken-dispersive-diffusion-...
Hello,
By using actual data of the first 12 months cumulatives for the wells in the analysis the objective was to avoid the discussions about the significance of initial flow rates, curve fitting techniques and projections of EUR.
The decline (and thus forecast) of the pro forma well was based upon data/information from North Dakota authorities and company presentations for Bakken. Presently there is not available significant data for full life time or time series for several years for wells.
It is still early in the game and what I presented is actual developments as it has been. Trends may change, but given another year or so with production data will hopefully result in an assessment with improved confidence.
If time allows I would very much like to make an (expanded; i.e. more wells) update in a few months.
Rune
Fair enough. Steep declines are often mitigated by fat tails, and I think that is the only hope that the Bakken wells will give us.