| The Connection of Depressed Wages to High Oil Prices and Limits to Growth | The Oil Drum | The Mechanical Transmission of Power: Endless Rope Drives |
Tech Talk - The ExxonMobil Future: A Review
Posted by Heading Out on March 24, 2013 - 9:35am
It is the time of year when the major oil companies issue their predictions for the future, and h/t Art Berman, ExxonMobil just released their view of the world, looking forward to 2040. And this is downloadable. If I remember correctly, I first viewed their future projections back in 2011 and with a two-year step, it might be more interesting to see how differences in their world view have evolved in that period.
By 2040, EM anticipates that the global population will be approaching nine billion, up by around 25% from current numbers. Of that nearly two billion additional folk most are expected to be born in the developing countries such as India and in Africa, with the former gaining 300 million and the latter 800 million. Because the majority of the growth occurs in these countries, and the improvement in living standards and working conditions are more energy intensive, (whether air conditioning or iPhones) from a lower base and demand growth is concentrated more in electrical energy demand than that of transportation fuels.
EM continues to believe that, while the economies of the OECD nations will contribute significantly to global growth, with economic output increasing by 80% over the 27-year period, energy demand will remain stable. Growth in demand for power will come from the rest of the world, powering an average 2.8% growth in the global economy over that interval.
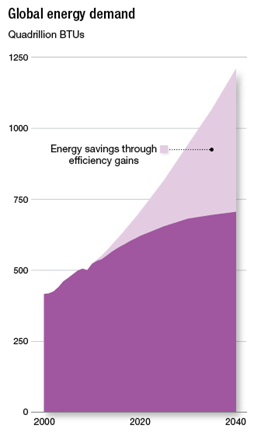
Perhaps the greatest change has been in the amount of energy that the company anticipates will not now be needed in that future, as improving energy efficiency cuts back the amount that must be supplied. If we look at the energy projections through 2030 that were made by BP and EM back in 2011, the total growth was expected to continue in an almost linear mode through 2030.
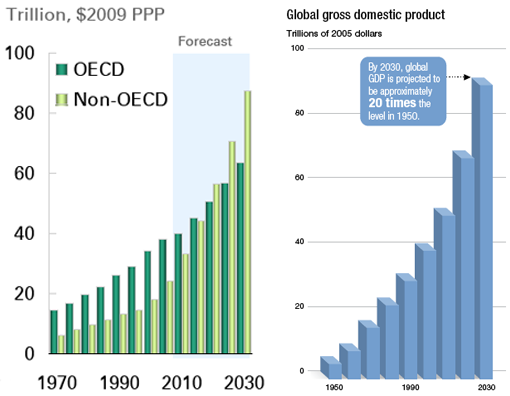
If one now looks at the shape (the units differ) of the new EM curve, there is a dramatic emphasis on a continued improvement in energy efficiency particularly as we get further into the out years. (Note the remaining illustrations all come from the EM document “The Outlook for Energy: A View to 2040”).
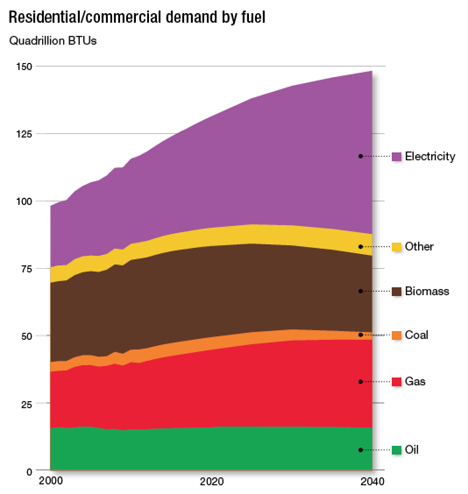
The report breaks down the growth in demand into several sectors. And this, at first, is a little irritating. The reason is that in describing, for example, the growth in residential/commercial energy demand, the track-back on the power sources stops at the point where electric current comes out of the wall. Given that it is the growth in electricity consumption, projected to grow overall by 85%, that is the greatest contributor over the period this is a little disingenuous. Now it is true that there is a whole section devoted to electricity generation, but the lack of the source fuel portrays a little bit of sleight of hand.
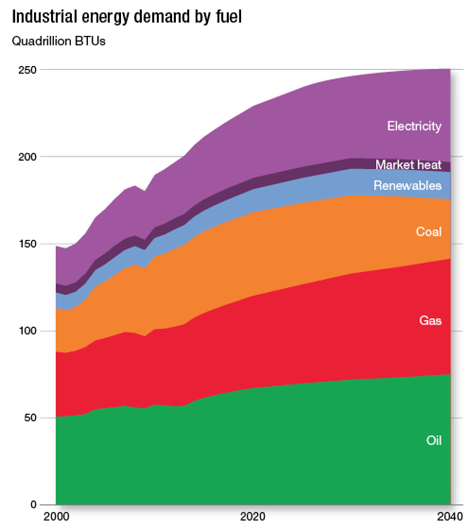
There is a similar restriction in source categories for the suppliers of industrial power:
However, as recognized, the document does have a chapter that deals with the generation of electrical power. EM anticipate that coal will continue to gain market until 2025, but from that point forward its share will decline as the main competitors, renewables, nuclear and natural gas take an increasing part of the supply.
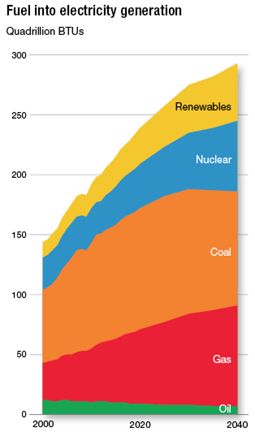
One of the reasons for the change, particularly the change to natural gas from coal, comes with the increasing burden of carbon costs, as EM projects.
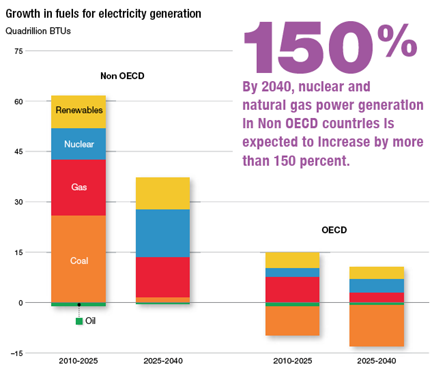
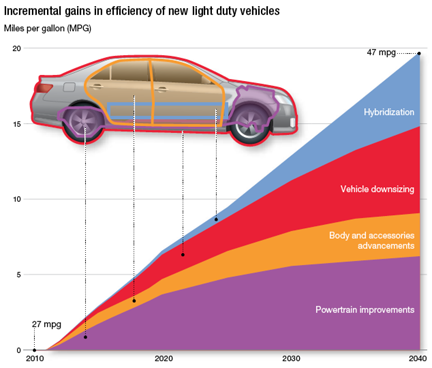
The low price that is anticipated to continue for natural gas makes it therefore the growth fuel, as Figure 5 suggests. When this is combined with the anticipated changes in liquid fuels for transportation, which will see a 40% growth overall with heavy duty transportation showing the greatest growth, investors in oil and natural gas should be reassured. Cars are expected to achieve an average performance of 47 mpg, which is achieved with the anticipated mix being:
Nevertheless, the increasing growth of personal transportation in the developing countries is expected to continue to increase demand for oil. With the growth in power generation from natural gas, the two combine to paint a glowing picture of the future of the hydrocarbon industry.
EM project that overall the demand for liquid fuels will rise to 113 million barrels of oil equivalent (mboe) per day by 2040, a 30% growth over 2010 with most of the demand remaining with the transportation needs. The company seems comfortable with industry being able to achieve that level of supply, although the mix will change considerably from that which currently prevails.

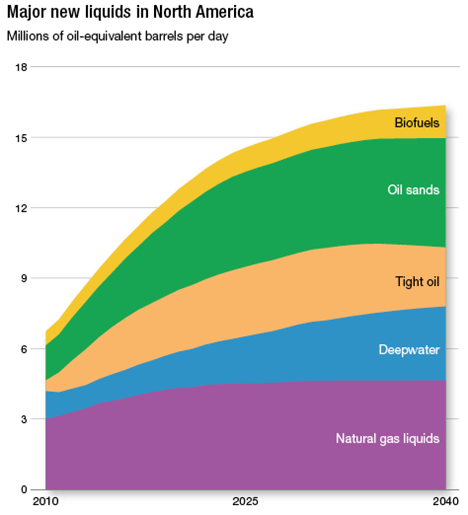
And it is here, I fear, that the report becomes overly optimistic. By looking at the relative size of the remaining resource, relative to the production achieved to date, EM foresee no problem in providing the supply targets that are shown in the above figure. EM expect that technical innovation will continue to dramatically improve production from the United States and North America in total. Supply growth is anticipated from tight oil in places such as the Bakken, Deepwater from the Gulf and the tar sands. They project that these will combine to lift North American total liquids production by another 40%. When the production from the offshore Brazilian fields and the heavy oil sands of Venezuela are added, then this reinforces the view that they hold of an achievable target.
Yet it is in the Middle East, a region they hardly discuss, that they see the largest growth.
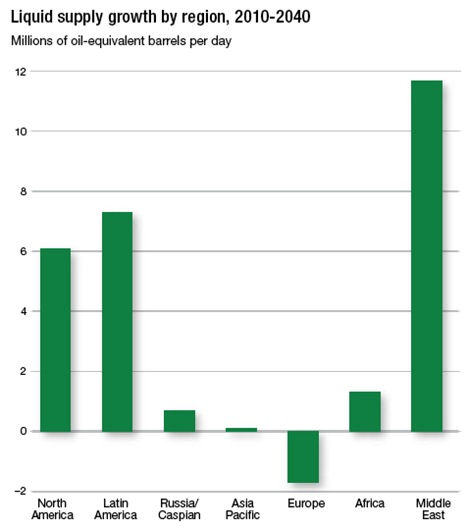
EM don’t actually say where that great growth is likely to come from, but it is very likely heavily weighted towards the most optimistic of estimates for the future production of Iraq, with the ongoing turmoil of the “Arab Spring” being totally discounted.
Well, it makes a nice pipe dream, as I’m afraid, as is also their anticipation that industry will be able to produce and distribute the target volumes of natural gas they anticipate will come to save us all from the increasingly higher costs of power. Dare one gently cough and mutter "decline rates"?
If I can put it another way . . . At the beginning of the report, after projecting a reasonable estimate of global growth over the next 25 years, EM put in a very optimistic level of improvement in energy efficiency in order to significantly lower energy demand. Then, to balance supply to that lower level of demand, they seem to have picked the most optimistic of assumptions about potential growths in that supply. I rather suspect that they are seeing the writing on the wall, but obfuscating it with optimism beyond the bounds of realistic expectation.
Contact
- Content: editors at theoildrum dot com
- Tech support: support at theoildrum dot com
License

This work is licensed under a Creative Commons Attribution-Share Alike 3.0 United States License.
And then there is "Net Export Math"
Definitions:
The following chart shows six years of normalized ECI data for the Six Country Case History, for the (2005) Top 33 Net Exporters (or GNE), for Saudi Arabia and for Available Net Exports (GNE/CNI ratio in this case). The Index Year (Year One on the chart) is defined as the 100% value. 1995 is the Index Year for the Six Countries, and 2005 is the Index Year for the other data sets.
The Six Countries data show a decline in the ECI ratio, from 100% in 1995 to 85% in 2001.
GNE (2005 Top 33 Exporters) data show a decline in the ECI ratio, from 100% in 2005 to 86% in 2011.
Saudi data show a decline in the ECI ratio, from 100% in 2005 to 70% in 2011.
ANE data show a decline in the GNE/CNI ratio from 100% in 2005 to 59% in 2011.
If we break down the 2002 to 2011, 9 year, decline in the GNE/CNI ratio (ratio of Global Net Exports to Chindia's Net Imports) into three segments, it looks like this:
2002 to 2005: 11.0 to 8.9, rate of change of -7.1%/year
2005 to 2008: 8.9 to 7.0, rate of change of -8.0%/year
2008 to 2011: 7.0 to 5.3, rate of change of -9.3%/year
At the 2005 to 2011 rate of decline in the GNE/CNI ratio, in about 17 years, around 2030, the ratio would approach 1.0, and China & India alone would theoretically consume 100% of Global Net Exports of oil, leaving zero net exports available to about 155 net oil importing countries.
While we all agree this scenario--GNE equals CNI--can’t actually happen, the brutal fact remains that the rate of decline in the GNE/CNI ratio has accelerated in recent years. In other words, we are headed (so far at least), at an accelerating rate of decline, toward an economically non-survivable point of impact.
It’s as if the passengers on a commercial airliner were calmly discussing dinner plans, oblivious to the fact that the pilot is steadily pushing the stick forward, putting the aircraft into an ever steepening dive.
The following chart shows estimated Post-Index Year CNE depletion, by year, relative to the Index Year. Again, 1995 is the Index Year for the Six Countries, and 2005 is the Index Year for the other data sets. All of the estimates are based on six years of declines in the ECI ratios and the six year decline in the GNE/CNI ratio.
At the end of 2001, estimated remaining post-1995 Six Country CNE were down to 39%. The actual value for remaining post-1995 Six Country CNE at the end of 2001 was 25%.
At the end of 2011, estimated remaining post-2005 Global CNE were down to 78%.
At the end of 2011, estimated remaining post-2005 Saudi CNE were down to 62%.
At the end of 2011, estimated remaining post-2005 Available CNE (estimated cumulative volume of post-2005 net exports available to importers other than China and India) were down to 52%.
Link to paper on ECI concept:
http://aspousa.org/2013/02/commentary-the-export-capacity-index/
I once thought that perhaps 0.1% of the people in the world understand--and this is key, ACCEPT the validity of--"Net Export Math." I am beginning to think that the number is more like 0.01%, or even a much smaller number, a few thousand people maybe?. Even Peak Oilers who are aware of the topic tend to fall somewhere between disbelief and denial.
scary work by westexas - again the relentless decline in available exportable oil leaves me breathless as to why no one in main stream land is taking notice - not even a little BBC mini-doc on it
perhaps I need to write to the "more or less " program - at least they have a scientific background
of course another point comes to mind - China is growing fast on coal
ELM / CNE model for coal would be nice to see - perhaps on a sister web site - "The Coal Barge" ?
Forbin
forbin – Or maybe “The Coal Car” since it’s usually transported that way at least initially.
I’m sure most understand that XOM and the rest of Big Oil are victims of their own success. They’ve grown so big that they need to add huge reserves every year just to keep pace with their produced volume. Which explains why the domestic and foreign DW plays attracted them: huge reserves, low man power effort per bbl, lack of competition from smaller companies. OTOH it requires a huge capex budget but they had that covered. Even the long development time frame worked in their favor: years pass before those new booked reserves began their depletion phase.
But just like every other play in the history of the oil patch most of the big fields are found early on. Same for the DW GOM. I bet a few folks might be surprised that the head count out there now exceeds 180 fields. This "new" play began over 35 years ago. So where are the next big trends XOM et al can explore beyond the DW and the harsher environments such as the Arctic? I’ve yet to see anyone offer even a foolish unsupportable proposal. Not counting Titan, of course. LOL
And the shale plays have not been a big draw either. Much too labor intensive: difficult enough to carry staff levels to handle multi-million bbl prospects let alone a few hundred thousand bbls per well. But there are some huge potential reserves out there that Big Oil can’t wait to get their paws on: smaller companies and their proven reserves. It doesn’t matter if XOM adds reserves via their exploration group or their A&D group. In the end all that matters is adding reserves at the cost of $X/bbl...whatever $X might be. Not like there isn’t decades old precedence for such a biz plan. The youthful TODsters need only search “Seven Sisters” and then count how many of those gals are still around. And also check out how many of their cousins, like Getty Oil and Tenneco, are no longer breathing.
And it doesn't mean the smaller companies will be too hostile to such efforts by Big Oil. The smaller pubcos face the same reserve replacement problem as the Big Boys. Being offered a premium for their company may be the best option as they approach that brick wall of usustainability.
"And then there is "Net Export Math""... and a lot of other factors. Early in the article:
I continue to be amazed by a complete dismissal (or denial) of limits to growth by corporations. I suppose there's no point, from their point of view, in factoring in the many variables required to achieve any of the projections we see here. This is why these "predictions" are purely an acedemic excercise,, or propaganda; take your pick. Greer, this week:
Meanwhile, Payden & Rygel has been running the following ad on CNBC for some time, noting that a quarter of all goods & service produced in all of human history have been produced in just the past 10 years:
Best Days by Payden & Rygel
http://www.youtube.com/watch?v=Hm-qqkF6Ork&list=PL848F15B913CBF0EA&featu...
"Seen in that light, global trade, investment and economic activity are still in their infancy."
Of course, roughly a quarter of all crude oil ever consumed was consumed in the just the past 10 years, and I estimate that about one-fifth of the total post-2005 cumulative supply of Global Net Exports of oil was depleted in the six years from 2005 to 2011.
Ghung – You’re not paying the game right. Now watch my right hand. Hey! Stop looking at my left hand! Do it again and I’ll slap you upside the head. Or even worse: I’ll declare you as being unpatriotic and anti-business. You, your family, your friends will all be shamed.
Reminds me of an old Woody Allen movie. Wife comes home early and catches husband in bed neked with his secretary. As she yells and goes nuts he and the gal get dressed quietly. The secretary leaves and hubby sits down and reads the paper. Looks up and says to the wife: “Hi…how was work today?” And he continues to act as though the wife didn’t see what she saw. Eventually the wife begins to question her own sanity…maybe she really didn’t see what she thinks happened. Eventually she starts dinner and life goes on as if there were no problems.
Sound familiar?
Gaslighted, on the macroeconomic scale.
NAOM
The U.S Department of National Intelligence and Accenture have acknowledged serious problems with growth, they don't say so directly but acknowledge problems with oil supply growth along with issues with water.
The math is clear and convincing, the resistance to what it conveys is a matter of psychology. You can bet that it is clearly understood by the Executive Branch and the military. I think it is an essential truth that is driving much of our foreign policy ie wars against terrorism and to spread democracy etc.
In some parts of the world we seem content to leave people like Robert Mugabe in power. In other parts, not so much. In some areas we are very worried about WMD's eg Iran, in other areas not so much eg N Korea. The thing which best makes sense out of our different treatment of different areas is a government that understands net export math.
Take solice wt, that what they can't get (from data) they will be forced to understand directly or indirectly as the situation unravels, much like those that do not understand AGW will be forced to when the Arctic is ice free and feedbacks quickly and dramatically increase CO2/methane releases. Like the old Fram filter ads, "pay me now or pay me later." If you ignore the need for a clean filter it will force an understanding (with a crapped out engine), and in this case, if you ignore ELM it will force an understanding at the pumps and with a crapped out economy.
westexas
I feel your anguish, and know that your message is just not being understood. Being a physician, I deal with failing biological systems on a daily basis. I try to help people and flat out tell them that they cannot live much longer with chemical facts concerning their body; however, denial is the response, an unfortunate amount of the time, by patients.
I have followed your math and logic for a long time, and totally agree with you, our biological/energy system is about to cease functioning in a way that is survivable in a form that is recognizable to us. I believe that as individuals we are part of a complex matrix which is in effect another living being. This living being is getting ready to enter a period of starvation, for which it is in no way prepared.
The most alarming graph that i follow regarding this process is:
http://www.eia.gov/dnav/pet/hist/LeafHandler.ashx?n=PET&s=MTTNTUS2&f=M
Please continue being a voice in the wilderness
Then you may be surprised that I find that graph one of the most reassuring around: the US has reduced it's addiction to oil by more than 50% from the peak in 2006!
I wish it were doing so more by reducing consumption than by increasing production, but either way, it's good for the US and the world. I find the idea that this reduction in consumption is a bad thing very puzzling - there's nothing magically essential about oil to our economy. It moves things and people around, and those things and people can get around in different and better ways.
A good thing, except, of course, for the CO2 emissions from the additional production...
There's an irony here.
1. We're convinced and outspoken that people will never take in new data showing coming limits and act in time. They're incapable of changing their behavior. They're not smarter than yeast.
2. Then, we're astonished that so few people get the math, even when someone else runs the numbers like wt has. (BTW wt, your work is standard fare in my advanced seminar. Please keep at it).
We can deconstruct our two faces in many ways (i.e., this is what it's like to be an "early adopter," power of the status quo, differences between "them" versus "us," or the old worn out "cognitive dissonance") but item 2 suggests we still do care to communicate, still want to motivate, still want to change behavior.
So, maybe it's just about framing. We get the graphs and math, they don't. If we want to do anything at all other than precisely track our demise, then we need to communicate differently.
IOW Peak oil journalism.
IIRC it took only one source (deep throat), and two journalists, to start the unraveling of one of the most powerful position in the free world.
Growth in the Middle East also may include a greater volume from Iran. While the US may not want Iranian exports to increase, the rest of the world is likely to be less fastidious.
Wow, by 2040 that’s almost 105 additional cities equivalent in population to the largest city (tumor) in the ecosystem – Shanghai (18 million). These new cities are going to suck up enough energy and resources to make nightly satellite photos look like an aggressive malignancy lit up by radioactive glucose tracers on a PET scan. They say it’s a slow and agonizing death, being eaten from the inside – out and many species outside the cancer of civilization would probably agree. One thing is for certain, the ecosystem will unwind until it is cured of its cancer and then it will grow again into a balanced and cancer-free ecosystem. Only time and evolution will determine if the reset button must be pushed again as a result of some other species gone awry. In any case, if unlimited growth is our unfortunate destiny, then Exxon-Mobil will eventually be layed-out in the morgue on the cold hard slab of reality as surely as everyone else.
It is unclear to me,based upon my knowledge of the past history of life on Earth and physical principals, that there is any requirement that a reset be successful. Recovery to an ecologic stable state from the handful of events such as the Permian extinction may owe as much to the fall of the dice as to any principal of science - such a reset has not happened many times, the environment was different then (ie a sun that may have been about 30% cooler, the continents were different etc). With a warmer sun, who knows. The system may be more brittle naturally. There is no close comparison with the present circumstance. Neither the geologic/climactic history of Venus nor Mars inspire confidence.
To be fair the P-T-event is not very likely be met by our eforts to "unbalance" the ecosystem. I think this vastly overrates our capabilities.
This does not mean that we are'nt heading towards very hard times and doing much "unbalancing", but the P-T- event - or even the K-Pg event - is far beyond our reach. Nonetheless the time earth is "cooked" by sun is about 2 billion yeras +/- 1.5 billion years away.
Your opinion indicates our capabilities are overrated. Our best climate science says otherwise - that it is not so much a question of our ability to brute force a change climate, but a question of our ability to pull a trigger, let nature do the amplification, then live with the consequences. Now we are back to the question of psychology, and our ability to use the data.
It reminds me of the myth of Pandora, and her little box of hydrocarbons - easy to open. Like the myth, hope remains at the bottom of the box, after it is empty of everything else.
Anyway, I feel no need to discuss climate science further - it is very easy to look up and you know what I refer to -
It is fairly doubtful whether the population projections by 2040 will be realized. They are done by taking the age distribution of women, the fertility rate trends, and doing some math to get the projections. It is all pretty straightforward.
On the other hand, the UN population projections show an increase in Egypt going from 2010 = 81 million to 2040 = 116 million. Since Egypt has arable land to support about 40 million people and not much in the way of exports to earn foreign exchange to trade for food, it is in severe difficulty now. The increase to 116 million is in great doubt.
Even more problematic are projections such as Malawi going from 15 million to 38 million. According to the CIA Factbook,
The economic crisis since 2007 is limiting the willingness of donors to support these countries already.
While it may be apt to compare humanity to a cancer on the planet, taking the metaphor further could lead some to not-so-metaphorical responses: Chemotherapy and radiation treatments. I'm not sure that's a useful meme.
Best hopes for a better, less damaging diet, more excersise, and all things in moderation.
Assuming this is sentence is to with diet and exercise habits then all those things listed will just make the population problem worse. Anything that extends life will result in more people and thus a more degraded environment. That is the predicament in a nutshell. I do feel the treatment will be forced upon us somehow and it will indeed be some form of chemotherapy and radiation treatment...
Best hopes is for future generations to learn from our mistakes and not repeat them in the future...
I was using it metaphorically as an alternative treatment for what ails humanity's collective condition.
If you fly from coast to coast on a clear day and look down, you will see that large areas of the earth have a patchy and scrofulous appearance. If your dog looked like that, you'd treat it for mange.
http://aleklett.files.wordpress.com/2012/11/figure-3-15-world-oil-supply...
The link is to the November 2012 version of the WEO and the following observations that I make in a slide presentation are not original to me:
[1] IEA is finally accepting a peak or undulating plateau of conventional oil, having dropped their projection about 25% over the last 8 years
[2] "oil supply" in the title of course really means 'all liquids' supply
[3] incomplete fungibility of NGL since this bar graph is volumetric, thus NGL energy content should be represented by 70% of its current height
[4] totally incomplete fungibility of refinery processing gains, which should be listed as actually 0% of what is shown here, since the energy content was already counted in enumerating the BOE of the conventional or unconventional oil below it in the graph
[5] there is no representation of EROI, though all of these categories of liquids become more expensively financially to produce
[6] there is no accounting for externalities experienced as a return on energy, which clearly increases with especially the unconventional types
[7] instituting a carbon tax, or cap + trade, or purchased offsets obligatorily further compromises industry economics + destroys demand
[8] per capita energy availability diminishes as population tops off
[9] EROEI is the real kicker - the ratio of 'net' energy is not factored in+ yet progressively declines
So my question is, does anyone have a handle on what fraction of the total represented energy is currently utilized to produce itself now, and what that fraction would be by 2035?
In Figure 9 I'd have unconventional liquids peaking by 2020. At that point I'd use the mirror image of the 2000-2020 unconventional growth to show shrinkage to 2040. By then conventional and unconventional combined would be ~70 mbpd. I'd call that a semi-optimistic scenario that takes no account of declining EROEI or export retention.
If we assume these numbers are accurate; what kind of global warming numbers can we expect?
"EM project that overall the demand for liquid fuels will rise to 113 million barrels of oil equivalent (mboe) per day by 2040, a 30% growth over 2010 with most of the demand remaining with the transportation needs."
They also anticipate a 47 mpg by 2030, that seems to be a leap of faith that makes Exxon's future look very certain to shareholders. I have seen projections for liquid fossil fuel usage growing steadily to 2100. This must be reassuring to them.
This is fairly huge, isn't it? Exxon-Mobil has publically accepted that conventional oil has peaked, and that conventional plus deep-water has at the least plateaued. Perhaps in a couple of years, they'll be publically accepting a more realistic decline rate.
E-M's assumptions about NG liquids depend on their assumptions about NG price and availability. Besides HO, many other people are sceptical of the claims being made about that.
And as for their assumptions about Middle-East liquids growth...well, winning the lottery is possible. I suppose. If we have our lucky four-leafed rabbit's feet on us at all times.
On the plus side, I think their assumptions about global GDP growth look high. Lower than expected GDP growth will take some pressure off fuel demand, and will likely accelerate efficiency efforts, as companies and households seek to reduce costs.
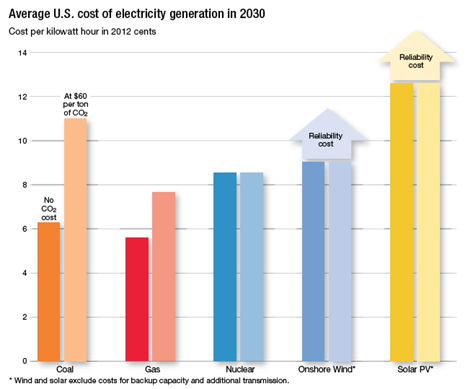
The estimated wind and solar PV electricity prices also look high, although E-M is correct to point out that there will have to be a reliability of supply cost added to those sources once they grow to be a major part of the mix.
"By 2040, EM anticipates that the global population will be approaching nine billion, up by around 25% from current numbers"
Just mind boggling.
"By 2040, EM anticipates that the global population will be approaching nine billion, up by around 25% from current numbers"
Just mind boggling, and even more mind boggling, the United States government is projecting 380 million by 2040, a 21% population increase from current numbers. So we will be making our proper contribution to overpopulation, as well as making a nice increase in our disproportionate contribution to world resource depletion.
Are we in fact seeing -- right there in black, white and color -- that the biggest oil company in the Western world is openly admitting that global C+C production growth is over for good? Note figure 9, flat-as-pancake orange section.
Holy Schneikies!
Of course, we all know that range will decline, but at least a major is subtly admitting the end of growth for the most efficient/versatile energy source we've ever harnessed. Have they admitted that before? ... Unless I'm reading that wrong, I do hope someone trumpets that told-ya-so and what it truly means for the overall energy picture.
Get your popcorn.
Whatever Exxon Mobil knows, the government surely knows.
Which leads to the question: how much of the AGW and climate change movement is real, and how much is orchestrated as a means of conditioning the public to accept a lower rate of fossil fuel usage?
A lot of AGW science comes out of the UK, which is facing a dramatic economic problem as their North Sea production declines. The Exxon Mobil paper attributes at least part of the decline in fossil fuel usage to carbon taxes, rather than geologic availability or cost of extraction.
Which leads to the question: how much of the AGW and climate change movement is real, and how much is orchestrated as a means of conditioning the public to accept a lower rate of fossil fuel usage?
Merrill, you put into words what I have struggled to articulate. I look at an IPCC chart that has growth built into all 40 scenarios -- like something from a local chamber of commerce -- then look at the graphs here on TOD. The assumptions are almost polar-opposite.
That's not to say the science of AGW isn't realistic or well-grounded. Rather, the assumptions used as input to the models just never seem to align with the peak oil story, not even once. Yet. step out of the AGW circle and one finds scientists like David Rutledge at Cal Tech who predict the amount of fossil fuels we can extract is not sufficient to trigger the levels of carbon dioxide being predicted by the IPCC models.
Frankly, I have spent many hours in the last year trying to determine what assumptions make the most sense. What keeps coming back to me is that the climate change story, particularly with respect to the level of carbon pollution, is a far more politically acceptable way of mobilizing change in public behavior than telling people the cold truth about peak oil and a "world made by hand," to borrow Jim Kunstler's book title. If that proves to be the case, history is going to have an interesting judgment to render.
scientists like David Rutledge at Cal Tech who predict the amount of fossil fuels we can extract is not sufficient to trigger the levels of carbon dioxide being predicted by the IPCC models.
Actually, he's not saying that. He focuses on coal, and he's saying that the amount we're *likely* to extract is not sufficient, but that's based on BAU and current efforts to reduce coal consumption.
There's more than enough available hydrocarbons (and coal in particular) in the ground, to generate the CO2 assumed by the IPCC.
Humanity is going to have to make a more or less conscious decision to leave carbon in the ground - we can't rely on geological limits to do it for us.
My reference was to a Powerpoint presentation from Dr. Rutledge that is available on the web. There he presents oil and gas along with coal, analyzes the potential impact on carbon dioxide, and projects a peak of 467 ppm at 2067, close to the date of 2070 at which he projects that 90 percent of the economically extractable fossil fuels will be exhausted. He also observes that 64 percent of the emissions have already occurred, so only 36 percent can be affected by policy at this point in time. (The 95th percentile confidence band on the resulting temperature was 0.13 degrees C.)
My point is that the use of limits as understood in peak oil scenarios results in very different outcomes for the climate models. I agree we have more than enough hydrocarbons to do immeasurable damage if we are successful in extracting and burning most of them. Oddly, the economic impact of peak oil may be all that saves us from ourselves.
I just wish our government officials would speak honestly on this. Four years ago the talk was high speed rail and solar power. Now, its a hundred years of natural gas, and the press is full of "peak oil is dead" stories. Meanwhile, what actual progress is being made on carbon emissions on a global scale? And what is going to be the emotional and psychological impact on people when they learn that we have a whole new crisis about which they have been told nothing as a matter of policy?
close to the date of 2070 at which he projects that 90 percent of the economically extractable fossil fuels will be exhausted
I believe that's incorrect. His analysis of coal is the heart of his presentation, and he's not projecting "economically extractable", he's projecting "likely to be extracted".
For instance, look at his website. He says: "Production of oil, gas, and coal in the long run is traditionally estimated from government geological surveys of oil and gas reservoirs and coal seams, together with an allowance for future discoveries of oil and gas. Where these estimates can be tested, they tend to be too high, and that more accurate estimates can be made by curve fits to the production history. http://rutledge.caltech.edu/
He and I have had long discussions about this, and I believe he has basically agreed. For instance, coal consumption in the US is falling sharply, and that's not because US coal is expensive to dig up and burn, it's because policy makers are deciding to reduce pollution, both direct (e.g., sulfur) and CO2.
Another major example: the Green River formation in the US has an *enormous* amount of hydrocarbon, which could be burned quite cheaply, if necessary. Please note, I'm not talking about conversion to liquids, I'm just talking about digging the stuff up and burning it, like coal. If the US or world were to be short of coal, and decide to jettison environmental concerns, the stuff is there to be burned.
I think that Rutledge is partly correct: current trends suggest that we won't burn quite as much coal, oil, etc as the IPCC assumes. Nevertheless, those trends are not driven by geological limits (except for oil, to some degree), they're driven by human choices. Those choices aren't quite as bad as we've feared, but they're not nearly as good as they need to be!
I always think reports are a bit dodgy when they are based on pure linear thinking and outcomes. Personally I think the idea that OECD energy energy/oil demand will remain static is highly dubious to the point of maintaining the status quo - population growth, future trade patterns, OECD energy intensive production 'hedging' to offset trade costs, more GDP and energy spent in obtaining new forms of energy (NET energy) to name but a few. The idea that debt will keep demand low looks an attractive outcome at the moment, but with inflation debt is much less of a problem than global structural factors looking forward.
A thought popped to mind: has ExxonMobil reached PO? If so, when? One would think it would be easy to find the oil production history of one of the largest public companies on the planet. Couldn’t find it after pulling up 100+ links. Nothing on the dozens of XOM web sites either. Maybe I missed it. Did find this:” Given the difficulties these companies are facing, some investors have begun to wonder if Exxon bought XTO last year to "mask the extent of their replacement problem," said R. Blair Thomas, chief executive of EIG Global Energy Partners, an energy asset -management firm.”
If I had the time I might be able to find the annual oil production numbers in each year’s annual report. XOM certainly has that chart but apparent don’t feel the need to share. And if we did find that data we would have to subtract all the gains from production acquisition. Picking up X bopd by acquire a company may increase XOM’s oil production rate but not the world’s. As the post says:”…EM foresees no problem in providing the supply targets…”. One would assume that if XOM sees the entire energy expanding their production capacity to such levels then XOM should be one of the leaders contributing to the effort. And the potential for XOM to do so should clearly in a plot showing how the company has increased its oil production rate over the years. But they don’t…curious. But if you dig deep enough you’ll find that XOM’s oil production rate has fallen 6% in just one year.
RM, I think that that data is here:
http://tribune-pic-petrolier.org/wp-content/uploads/2013/03/IOCprodforec...
from Jean Laherrere.
This could be wishful thinking. Notice we will not reach 113 million barrels per day until 2040, presumably because the average MPG will be 47. I doubt this, in fact we could reach 113 mbpd by 2030, with China and 200 million cars.
Growth? Managers haven't bothered to notify the natives (Doug Short):

USA motoring miles have declined to 1995 levels, painful for businesses depending on those miles.
Big Oil not so healthy (crudeoilpeak.info & Jean Lahererre):
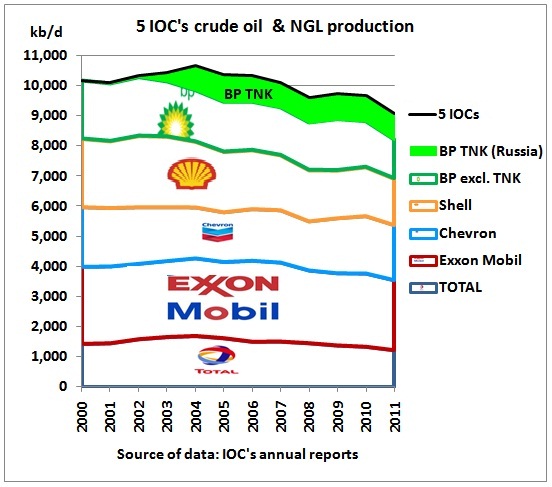
Both consumption and supply are backing into holes that will prove difficult to climb out of. New oil is now a matter of multi-billion dollar deep water platforms, not opening a valve on existing production. BP's TNK is the Russian subsidiary that the company is selling to pay for the Macondo blowout.
Costs are high, energy company balance sheets are inflated by credit that is becoming too costly for energy companies' customers to afford. Credit cost is added to the petroleum itself ... also becoming too costly to afford ... even when pricey credit is available.
The lesson of Cyprus ... and Europe ... is that credit is less available or at breaking costs, only.