Hurricanes increase driving, gas prices decrease it
Posted by Stuart Staniford on December 23, 2005 - 5:22am
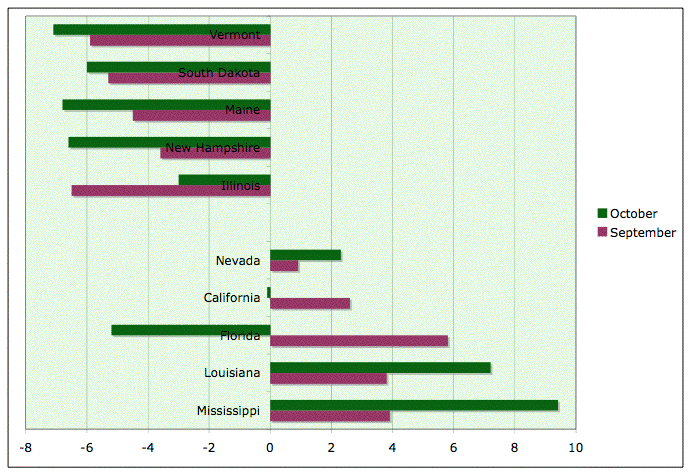
Percentage change between monthly VMT in 2005 and the same month in 2004, by state, for five hardest hit and five most favored states. Click to enlarge. Source October FHWA Traffic Volume Trends

US Vehicle Miles Traveled (VMT) for the last three years through October. Click to enlarge. Graph is not zero-scaled. Source October FHWA Traffic Volume Trends
The FHWA breaks out statistics by class of roads. Rural traffic has been suffering at least since the beginning of 2004. Presumably this reflects that rural economies are less wealthy and more gasoline dependent, and long haul travel is more sensitive to diesel costs.
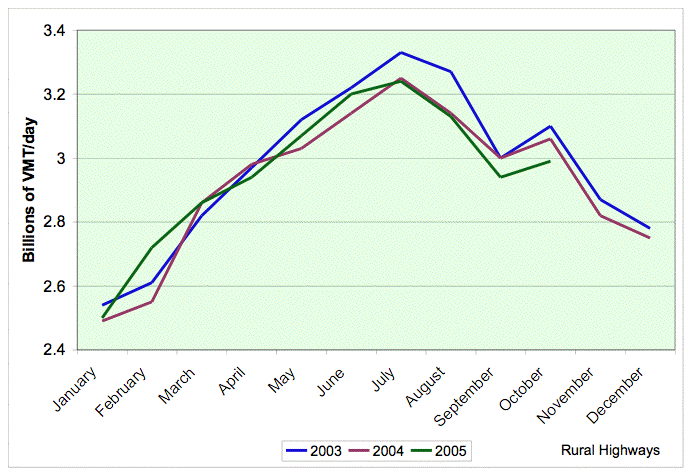
US VMT on rural highways only for the last three years through October. Click to enlarge. Graph is not zero-scaled. Source October FHWA Traffic Volume Trends
By contrast, there is little pain visible on urban highways till this year. However, the effect was pretty substantial by October.
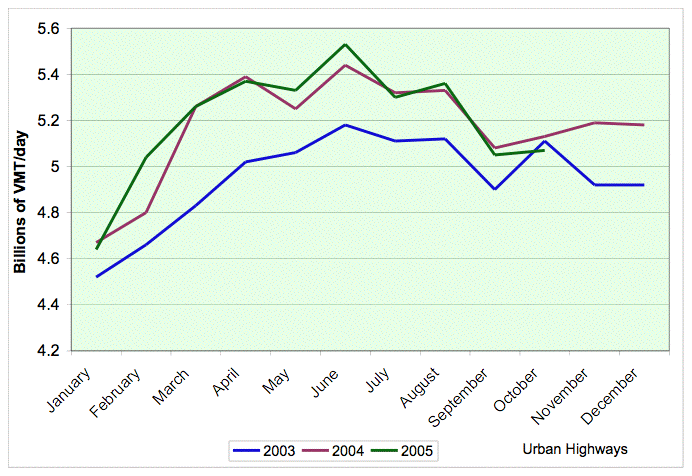
US VMT on urban highways only for the last three years through October. Click to enlarge. Graph is not zero-scaled. Source October FHWA Traffic Volume Trends
Finally, the most interesting question. Did the hurricanes mainly reduce VMT by direct effects on travel in the affected region, or by price? Turns out to be price: absolutely no doubt about it. Louisiana and Mississippi saw a huge increase in VMT, but the rest of the country reduced VMT. The North East was hit hardest, and the West was affected the least.
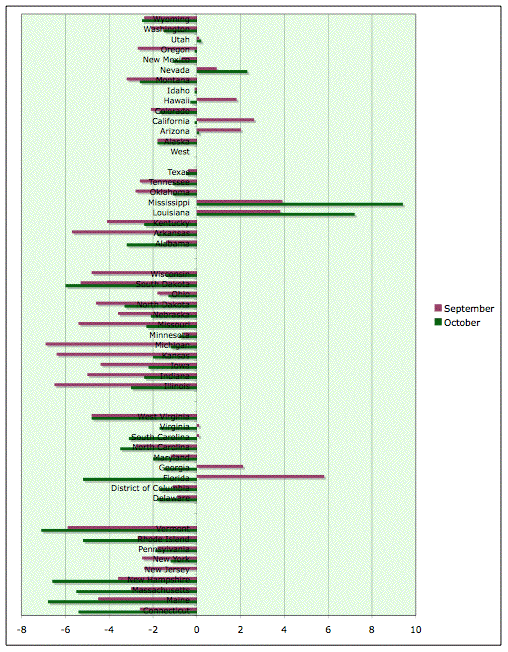
Percentage change between monthly VMT in 2005 and the same month in 2004, by state. Click to enlarge. Source October FHWA Traffic Volume Trends
Here's a map from the Bureau of Economic Affairs of average annual GDP growth from 2002-2004 by state.
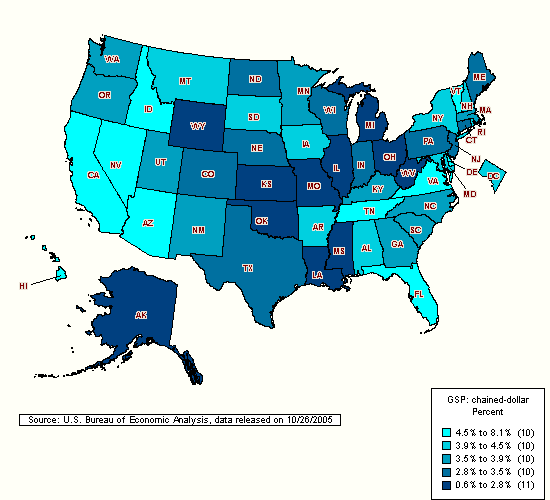
What you can see is that the states that had to reduce VMT were pretty much the states that had slower growth economies. This may be a general truth: the slower your growth now, the more you'll have to reduce as peak oil bites. New England seems to be seeing a little extra drop in October - nobody going up to see the fall colors, maybe, with gas prices so high?


It's interesting to see that the 'Demand Destruction' thesis of people like Adam Porter seems to be right.
My personal feeling is that we will see some sort economic trouble both sides of the Atlantic in 2006. The tax risings of Greenspan (RIP - Retire in Peace) and Trichet will just offset Stagflation to good old regular Recession.
We should also consider the chance of an ease in Oil prices during next year. If supply can keep in the 84-85 MBD frame, a Recession will keep prices in the 50 - 70 US$ range, and might even lower that.
If the central banks don't raise taxes again, then inflation will set in, spiraling everything with it. Those news on coal yesterday where really scary.
Well, let me just wish a tranquil cozy Christmas to everyone reading this, and hope for some sort of miracle in 2006.
Peak oil will really put the central banks between the devil and the deep blue sea. If we have a sharp peak (rather than a plateau), the 3-4% annual declines, year after year, will trigger huge inflationary pressures, coupled with increasing unemployment ("stagflation").
If the central banks of the world decide to fight inflation, they will raise interest rates just as an oil supply-side recession takes hold. This is the same mistake the world's central banks made in the 1930s (but for a different reason). This has been called the "second mistake." It has been credibly argued that the "second mistake" turned a mere recession into the Great Depression of the 1930s.
So, will history repeat itself? I believe the central banks are very fixated on fighting inflation. The generals fight the last war. If I am right, then when peak oil hits, we will see extremely high real interst rates. This will bring on a severe recession, and lower oil prices, temporairly. When it becomes a depression, the central banks will lower rates in a desperation move to stimulate the ecomony. But when they do that, inflation will skyrocket. What a mess it will be.
Where I would disagree with you is with the assertion that cutting interest rates in desperation would actually stimulate the economy. Even with nominal rates near zero, real rates could still be punishingly high in a negative inflation (deflationary) environment. During the implosion of the credit bubble, lowering interest rates should be the equivalent of pushing on a piece of string. The Japanese tried to stimulate their economy for years, cutting their rates to almost zero, but couldn't get nervous citizens to spend. I would expect the US government (and others) to try the same thing with the same result.
Once the deflationary impulse is spent, I would then expect hyperinflation in both Japan and the US. The generals would still be fighting the war on deflation as inflationary pressures loom. America should watch Japan as they are further along the path to hyperinflation. The US should catch up eventually though as the American crash should proceed more rapidly.
As the world's former largest creditor, Japan was able to stave off the day of reckoning for years by burning through their resources building four lane highways from nowhere to nowhere etc. The US is going into a crash as the world's largest debtor already. America's deflationary crash may be the trigger to push Japan into hyperinflation. (Printing yen has already begun - see The Dollar Crisis by Richard Duncan.) I would guess that America's own hyperinflation would begin several years later. It should indeed be a mess.
Look at the actual number of measuring stations on page 5, and the footer:
"Note: Where Number of Stations are shown as dashes, the values for the Vehicle-Miles and Percent Change are derived from the estimated VMT based on data from surrounding States or the nationwide average VMT."
Certainly future VMTs (decades hence) are often projected using GDP. Are we sure no one is using the same method to fill current gaps?
FWIW, my suspiciion that gross gasoline sales are used with EPA fleet mileage numbers to calculate VMT (when monitoring stations were not available) was confirmed by this doc:
http://www.epa.gov/ttn/chief/eiip/techreport/volume04/iv01.pdf
In that case, we wouldn't want to use VMT from one source, and gasoline sales from another, to "calculate" a real world fleet mileage. All we are doing is working back to the EPA figures, in a self-referential way. That's really too bad, because I would really like to know how higher gasoline prices changed the vehicle mix on the road. Were SUVs left home while another car was driven? Sorry, if state's VMT figures are calculated from "known" fleet mileages, we aren't going to get there.
So no smoking gun, but a bad feeling. Sure.
The 101 freeway sensors are an interesting point. We're trying to mine data for oil use patterns, when the monitoring system was put in to generate road congestion, construction, and maintenance data. This allows on-line maps like this one:
http://www.sigalert.com/map.asp?Region=Greater+Los+Angeles
Does the State monitor surface roads to the same degree, and is there a data flow from local entities (city county) to a statewide aggregate?
I'm a surface street driver (90%), which might make me wonder more that freeway drivers at how that data is integrated.
And the big question for me is why the FHWA report at the top of the page had so many "dashes" for states without data. Why would entire states be missing monitoring?
A minor question is when the FHWA says California has 30-32 "stations" what do they mean?
Anyway, interesting stuff. I spent 15 or 20 years doing analytical chemistry. It was easier to know exactly what you were measuring in that environment. If I could DESIGN this experiment myself, I think I'd try remote sensing ... repurposing sattelite photos to count cars on roads.
There is also a gravity effect, where large trucks attract packs of smaller vehicles. I always wondered what would happen if they traveled long enough - would all the little cars eventually be absorbed into the truck, making one huge vehicle?
But these effects must seriously decrease efficiency, and are one of the advantages of rail transport. Train cars don't each make separate judgments, and they all follow obediently and act in unison. Human drivers cannot do this.
Seriously, it would be nice to have a couple ways to independantly measure VMT without assumption. Right now we can use limited sensors and extrapolate ... but the only cross-check is with gasoline sales and an "average" mpg.
If my "gut" were to speak again, it would say use the gasoline sales figures, which are at least directly measured - especially for short term studies.
It might be possible to get a direct-measure VMT ... if anyone out there is carefully totallying odometer (not exactly an odograph ;-) mileage on each vehicle transfer. If a car changes hands (or is scrapped) after X years, with Y miles, we can get a good average yearly VMT ... but of course we'll never get accurate month-by-month changes.
"Actual implementation will vary from agency to agency. Each State or local highway agency has its own traffic counting needs, priorities, budgets, geographic, and organizational constraints. These differences cause agencies to select different equipment for data collection, use different collection plans for obtaining traffic data, and emphasize different data reporting outputs. However, all highway agencies collect the same basic types of data, and each can benefit from using a similar basic data collection framework."
I would LOVE to have good day-by-day VMT numbers, including vehicle type (and heck, while we're at it, passenger count).
It just strikes me that VMT totals are a "secondary product" at best, from these measuring entities.
There were stories a few months back the state of VA was noticing that revenues from the state gas tax were decreasing. They were attributing the change to people starting to switch to more fuel efficient vehicles as opposed to driving fewer miles.
I suppose when you think about it though, each state that has a gas tax has a pretty darned good measure on the number of gallons sold. The VMT is something that would seem to be harder to measure though.
Not if it is raining cats and dogs. I gather it was one of the wettest Octobers on record in parts of New England. I visited Maine in September before the rains came. Weather may be a bigger factor than gas prices in some situations.