The ASPO plot


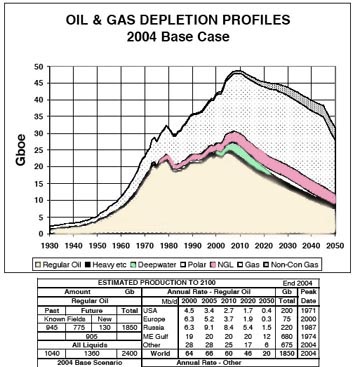
Sometimes it is useful to go back to the original source for the depletion curves that we discuss, and so I just copied this from the latest edition of the ASPO newsletter (which is a pdf from ASPO-Ireland which is on the Blogroll). To make it easier to read I have added a bit of color.

The relevant bits that I would draw attention to are the bulges up at the top of the curve, which relate to Deepwater production (green), and to the growth in supply of Natural Gas Liquids (pink).

 If you look at the list of new projects that have been the subject of the posts last week, relative to CERA, you will see that a significant number are coming from Deepwater.  These are the more expensive efforts that are long in planning, and which can more easily identified as a result.  And note that it is these that are cummulatively now moving us upward, instead of already falling back.  They are also "The Last Frontier."

Natural Gas Liquids, more commonly associated with gas production are also the major source of the additional oil that CERA is predicting will come to the global rescue.  The volumes shown here do not seem to agree with CERA numbers, however, and so I suspect we will need to do a little more detective work to see where they all come from.

Technorati Tags: ,

Question regarding ASPO graph - when stacking different types of energy on top of each other as they do, is everything on its own energy terms, or is ERoEI calculated to make it a 'net' curve? In other words, when ASPO states that there are 1,850 gb of 'regular' crude oil and 2,400 gb of all liquids - is that an apples to apples comparison? Or does the 2,400 gb net out to something less, because it takes some of the 2,400 gb to get it out of the ground, and process it? And furthermore, is the net energy of the remaining 900+gb of regular oil equivalent to the first 900+gb? Or is it harder to get and of lower quality so we need to use more of it to refine the oil into usable products? Basically Im asking if their current statistics accurately reflect the energy content of what is remaining in terms we are used to.. thank you
Asked in a simpler way, the peachy flesh colored part of the graph represents all crude oil ever produced and ever to be produced, in terms of barrels of oil. Wouldnt it be more appropriate to draw the graph in terms of 'energy available for use' instead?  (this would factor in the much higher % of lower quality heavy crude that requires more energy to refine and the fact that the oil the world is producing/using takes more oil each year (%wise) to get it out of the ground and into usable form?
the fact that the oil the world is producing/using takes more oil each year (%wise) to get it out of the ground and into usable form?

On the whole, oil is not used to get oil out of the ground. In 1997, roughly 90% of the fuel energy used by the oil and natural gas extraction energy was provided by natural gas (most of which was produced on site).

See ENERGY INTENSITY OF OIL AND GAS EXTRACTION

I would doubt that anyone has the numbers to realistically do that.  The amount of energy required will vary significantly from field to field and thus it is at least a step in the right direction just to note how much is expected to come out of the ground.
Thank you - I agree. But this is why depletion rates are inherently low IMO. In addition to the actual bpd loss, we will be using more energy to get the stuff out, so the relevant depletion rate for 'economics' will be higher than the straight geology.
Unfortunately Campbell still has not posted his database (or Jake for that matter) on peakoil.ie

As for my comments on the graph

  • Opec said light crude peaked before 2000. According to ASPO (or Colin Campbell) it did in 2004. So who's right?

  • Gas peak seems very controversial to me? This makes me distrust ASPO figures a lot more

  • Heavy etc (bitumen and Orinoco extra heavy?) seem to be too small amount

  • It seems strange that the Middle East keeps pumping regular oil at a level of 20 Mb/d for 15 years. How come it stays constant?
  1. ASPO/Campbell claims that conventional oil (according to his definition) peaked in 2004, not light crude.

  2. There is zero evidence that ASPO is even using a database.

  3. The ASPO forecast is already wrong. It predicts oil production of 82mbd for 2005 (as you can see by checking the Sept. ASPO newsletter at peakoil.ie), even though DOE stats give average production of 84.3mbd for the first six months of 2005.
Mmm. As I pointed out on the other thread, they discuss their database here. It's a crappy discussion and I wish they would be more transparent, but "zero evidence" overstates the situation. Here's what they said:
Some readers have sought explanations for the periodic revisions to the table at the beginning of the Newsletter. It is a summary of a depletion model and database that have been maintained for about 15 years, being subject to continual revision and refinement. It will be readily understood that public reserve and production data are grossly unreliable, and that even the industry databases show widely different estimates. Accordingly, it is necessary to look for trends and relationships, as well as apply common sense and geological knowledge, to try to come up with realistic assessments. The next revision may well see a reduction in the Yet-to-Find, based on extrapolating the falling trend. Furthermore, modelling depletion involves not only the calculation of natural depletion rates as imposed by the immutable physics of the reservoirs, but also relies on assessing politico-economic factors, especially in relation to critical Middle East supply. Each country is evaluated individually and then summed to give regional and world totals. It is well said that all numbers are wrong: the challenge being to determine by how much.

Much interest devolves on the date of peak, but this really misses the point. It is not an isolated or high peak, merely the indicated maximum on a fairly gentle production curve. Small changes in the estimates and modelling can shift it by a few years one way or the other. The Middle East Gulf is a particularly sensitive case. Production reached an historic peak in 1974 of 21.2 Mb/d. As currently modelled, production will rise from 19.4 Mb/d in 2004 to 20.5 Mb/d this year before declining gently to 19 Mb/d by 2030. It might indeed make sense to slightly modify the model and reserve estimates in, for example, Iraq, where there is a wide range of possible scenarios, so as to shift overall regional peak from 1974 to some date over the next few years. However, the importance is not so much in the date of peak itself but in recognition of the long, remorseless decline that follows.

You're right Stuart. Sorry. I should have said there is zero evidence which can be verified by a third party. To the best of my knowledge, no one outside of ASPO has ever seen the database, and no one knows what is in the DB, how/when it is updated, where the data in it comes from etc. Facts on the DB, with the exception of the material you quoted, is 100% lacking. Objectively speaking, I think the most you can say is: "ASPO claims to have a database". That's not the same as "ASPO has a database" or "ASPO has an accurate database".
It's like someone claiming to have an undiscovered, authentic manuscript by Shakespeare, but not letting anyone see it. How much credence would you give to that claim?
ASPO data can partially be seen in their newsletter country profiles. They are mostly interested in finding the production midppoint and the peak and drawing a very long range production curve. There they use mostly shifted discovery. Of course these curves are mere educated guesses. ASPO constantly stresses that there is very little reliable data. That is true. We don't really know even the exact world production at moment. We really don't now the production in last year. The error marginal can be 1% or more. Important oil producing countries keep their data as state secret. ASPO seems not to take any country data at face value but tries to make an independent expert assesment, some kind of expert consensus. That is why it is difficult for outsiders to confirm or critizise it.  

I have read papers the ASPO people have presented in their seminars. I think those people are very serious. They know. Their main task has been to come forward with the phenomenon itself, the Peak Oil. They have also tried to make a very long range estimate of the production. This is of course virtually impossible...

There is also a political aspect in ASPO work. They changed their scenario last year and reduced the "swing" component of Middle East markedly. I think this was to emphasize the problem. Simmons has been still more pessimistic about the Middle East capacity. It should be remembered that here are people who consult the US goverment and big oil companies. The public domain scenario might not be the same they tell them.

But ASPO uses the Hubbert methodology. It is much more than extrapolating present production trends and summing new projects. M. King Hubbert could predict the US peak in 1970 already in the '50s and place the world peak around 2000 (conventional oil) in the '70s. This is astonishing. No economist can make very long range forecasts so accurately. It is difficult enough to guess the next year right. IEA has had difficulties in predicting the oil supply and demand one year ahead (can they get 6 monts right or the past 6 months production...). The greatest discrepancy between ASPO and the official forecasts (EIA,IEA USGS...) has been in the next 20 years or so. Here I would rely more on M. King Hubbert and ASPO than others.


I think Deffeyes is a lot closer to what Hubbert did (logistic fitting to overall production). I think what Campbell has done is very important in raising overall awareness, but he hasn't got too great a track record of predicting the specifics - he has repeatedly predicted peak before it happened. See here for a critique.
It is true that Campbell (and may be ASPO) has been too pessimistic. But Lynch article shows that he had another viewpoint here. Lynch doesn't see any peak at all, his curves has no turning point. But Campbell tries to catch it. It might be that Campbell has problems estimating offshore and deepwater oil and accounting for the other liquids that are more important now.

If we look at conventional (and especially onshore) oil, Campbell hits fairly right. There were problems already in the end of '90s. This is not meaningless. Regular oil still makes the bulk af all oil production. The offshore production change rates are much higher and very high in deepwater. That's why we see optimism now.

I'm not saying Lynch is right that there's no peak. But I think he's done a good job of critiquing Campbell and pointing out the difficulties of doing this kind of analysis correctly. I think the right overall framework for understanding the process is probably Reynold's Mineral Economy - you never really know how much oil you have, until you've found it all by which time it's very late in the game.
I think that is a horseshit critique.  Campbell, Leherre and the early adopters of the Hubbert technique took a look at the available data for the world resource and were shocked to see a peak predicted for the late nineties.  Given the complete state of unpreparedness, and the conventional wisdom that said that this was a non-issue, these guys risked their professional reputations and credibility by making the prediction even though they knew that the data was unreliable.  Why did they do that?  Because the stakes are so high.  Because to refrain from publishing because you were afraid of being embarrassed when the consequences of being right were so momentous would have been the choice of a coward.  So, instead of 1998 we get a peak in 2005 or 2008.  Good Grief!  What kind of precision do you bastards want for this kind of analysis?  This is geology we're talking about for Christ's sake!  I respect the hell out of these guys for having the guts to make the predictions and I think that the carping about the fact that there were some pessimistic predictions that missed the exact date by a few years will be seen as absolutely ridiculous in hindsight.
I'm sorry to have upset you, but I would point out that that in the early nineties they predicted a peak in the mid nineties, and then in 1998 predicted a peak in 2003. So when in 2004, they are saying 2007, should we set our clocks by it? Clearly not, right? They may be qualitatively right, but they are not quantitatively right.

I completely agree with you that they have been extremely brave at considerable personal career risk, and have done an enormous amount to draw attention to the problem. But that doesn't mean we shouldn't try to improve on their methodology. And the way any science advances is by open publication of results, sharing of data, critique of methods, leading to steady improvement. Since they haven't seen fit to share their database, that process is impeded, and I think Lynch is right to draw attention to that fact.

Oh, no worries.  Takes a hell of a lot more than that to upset me!  I'm simply pointing out that we owe these guys a great debt for having the guts to actually put their asses on the line even though they knew the data was shaky back then.  And really, as you get older and look at things in perspective, ten years one way or the other doesn't seem to have very much significance.
I don't think the contention that light crude has peaked should be regarded as unproblematic yet. There are problems with Opec's numbers (as I analyzed here. Even if Opec is correct, all we know is that 2004 was lower than 2004. That could be consistent with a peak in any year prior to 2004. We also don't know if it mightn't go up again. I think all we have right now is suggestive evidence of a light sweet crude peak, not a solidly proved case.
To me, this is the real power of the theory at this point.  You can look at the ASPO curves and Rembrandt's data and curve and despite the difference what strikes me is the similarity.  As was pointed out, they both capture the same effect.  The last gasp is a final push from deep water and polar stuff coupled with natural gas liquids.  The difference is that ASPO sees it a little spikier with a quicker decline and Rembrandt sees it a bit more diffuse with a slower decline rate.  But what is really striking about this is that the results were arrived at using two completely different methodologies.  One is the traditional Hubbert analysis, that makes an estimation of the total endowment and works with a sense of what the extraction curves should look like.  The other is a bottom up field analysis.  And they are essentially converging on something that within the context of geology is within a heartbeat of one another.  That is rather amazing or ominous, however you choose to look at it.
Somebody like Mike Lynch would figure out some way to spin this.
SW: I agree. All these forecasts are in the probable error margin.
To me this is a critical point so I'll be persistent. Asked in a third way, what X% of Y annual oil/gas production is used by energy companies and refiners, and what % is left over for the rest of the worlds economic machine to consume? Presumably, when we discuss Peak Oil we only talk about Y (Total oil production) but what we really care about is (1-X)*Y, or the total amount of oil left for non-energy company human use. (this gets at the net energy problem from different perspective) Thanks.
For the U.S., I can answer part of your question. Roughly 4.5% of total oil/gas production is used by the oil/gas extraction industry.

Refining is an entirely different factor. "Petroleum refining is the most energy-intensive manufacturing industry in the United States and accounts for about 7.5% of total U.S. energy consumption." I haven't done a refining calculation yet, but this link is one gateway to the data:
http://www.eia.doe.gov/emeu/mecs/iab98/petroleum/energy_use.html

The energy flow diagrams for the U.S. given on P. 2 and 3 of the following document are also good sources:
http://eed.llnl.gov/flow/pdf/ucrl-tr-129990-02.pdf

thank you - so roughly 12% of our energy is spent on extraction/refining our energy. The two obvious questions are how does this look on year-to-year comparisons and how does this look vs other countries? I'll look further at your links.
OK - according to your 2 DOE links above, these are the quick numbers I get.  

% of american energy produced spent on refining:
1985  6.56%
1988  7.62%
1991  6.81%
1994  7.02%
1998  7.50%

So, a trend with the exception of 1988?? And Im sure there is more recent data than 7 years ago? - but maybe not

Although nobody ever responds when I post stuff about the Gulf of Guinea (West Africa), this region is projected to supply as high a percentage of US supply by 2012 to 2015 as the Middle East and 65% of that supply is supposed to be light sweet crude. (Nigeria, Angola, Equatorial Guinea, etc.). Which is why I attach some importance to this region and whether the forecasts are correct. Oh, well, my little hobby.
Dave-
This region is other people's hobby as well. Sir Mark Thatcher had much more profitable approach to Equitorial Guinea: just take it over.

I'm interested in the geopolitical aspects, reasoning that oil isn't of much use if you can't successfully extract and trade it. Info on your corner of the world:

Political Stability as a percentile of world,
World Bank average of 5 to 8 surveys
http://info.worldbank.org/governance/kkz2002/

Angola 18
Benin 35
Cameroon 21
Congo 9
Equitorial Guinea 37
Gabon 48
Nigeria 5
Togo 33

For comparison, Saudi is 31, Egypt 25. Using that sort of scaling, we can say there are no really stable counties here. And I'd bet, the better the oil, the stronger the urge to take it over.

Dave: West Africa is important. I checked ASPO Angola country profile and searched  some data about its production. It is interesting. Angolan conventional is past peak and production is decreasing. All new production will be deepwater.

The Angolans say that their total production will be double the present in 2008. It would mean 1.8 mpd or slightly more. This also ASPO peak rate for Angola. But the curve is very steep. ASPO curve shows that the production will collapse immedately after the peak and it will be back at the current level in 10 years. ASPO thinks that Angola don't want to develop the deepwater at the maximun pace. But they want. So ASPO puts the peak near 2020 but the Angolans say that level will be reached already in 2008. Because the conventional production will be higher then than 2020 this means that they will get real peak about 2010. Everything will be over in 25 years. After that the total production will remain quite small. Nice ride!

All this means that in 2012 - 2015 Angola may export almost double the present amount but only very short time. In five years it may be back at the present level. So this is a very short-lived affair. In fact it would be  a quick robbery of Angolan oil and no lasting remedy for the US oil needs.

What do you think?  

Look at Angola - Oil And Gas Industry: Exploration & Production. What you'll notice is how much activity there is, with lots of oil companies (ExxonMobil, ChevronTexaco, Sonangol, Roc Oil, Total, etc.) sinking a lot of money into various offshore blocks. Most announced production targets are in the 2005 to 2008 timeframe with some unknowns. The 2004 Angolan production number is usually given as 0.98/mbd with CERA expecting an additional 1.35/mbd by 2010, which yields a total of 2.33/mbd at that time. Whether this projected production will actually come to pass is a SWAG. As far as future depletion goes, all new fields are offshore deep drilling and are subject to rapid depletion at some point down the line.
CERA might well have right. But point here is the possibility of rapid depletion very soon afterwards. How much will it help to get 1 mpd a year more for only 5 years or so. I think this is what the Peak Oil is about.  
What i heard is that according to the wood Mackenzie database Angola deepwater (thus Angola) will peak in 2010.

Since we are seeing these really sharp deepwater decline rates it might be a wild ride indeed.

By the way, HO, I posted a comment on Forecasts, Maintenance and Reporting here that may (or may not) be of interest to you.
I replied over there.  And yes I will get around to West Africa, but having just got_ "Russian Oil Supply,"_by John Grace, it may take a while.

HO

How'd you get it? Do tell - Amazon doesn't have it yet.
Grin - my secretary says "clout is clout," but actually we just ordered it directly from Oxford University Press over the internet.
Well, they're out of stock now. Evidently a hot seller. I've put my order in at Amazon.
I'd certainly like to see a detailed post on Russia. My assumption has been they will plateau at 9.2 to 9.4/mbd for a few years and then decline.

Meanwhile, there are entertaining analyses like Deciphering Russia's oil production from RIA Novosti.
"Meanwhile, there are entertaining analyses like Deciphering Russia's oil production from RIA Novosti." Entertaining, indeed. They say that that the production in August was 9.33 mbpd and up 3%. EIA says that the production in 2004 was 9.27 mpd. This makes +0.6%. (http://www.eia.doe.gov/emeu/cabs/russia.html).

Now RIA Novosti in fact tells that the production is flat this year. Because  the production was still growing througout last year (9%, EIA), year-to-year comparisons give seemingly some growth this year, too. If we compare the month-to-month numbers the picture is different. Excluding some companies doesn't mean nothing. It is convenient to blame Yukos for the problems but we'll see only later if this really was temporary or not.  

I don't understand why the ASPO (and others) don't give a confidence interval on their estimates especialy when based on highly uncertain data. Some are saying that they are already wrong for 2005 (5% error) but it's probably within their confidence interval. In any prediction problems, you try to have a rough estimate of what your error is! especially if they use a curve fitting approach, the confidence interval is generally available along with the prediction. This uncertainty issue was discussed in an article from the last ASPO conference (Lisbon).
This is off-topic but here goes.

On todays (September 12) Newsweek there's an interview of the acting secretary-general of OPEC, Adnan Shihab-Eldin, on page 68. Here's an interesting quote from the interview:

"
Q: But won't the soaring demand from the developing world -as well as a forecast decline in supplies- inevitably keep prices high?

A: We wont't have a problem in 10, 15 or 20 years' time because the resources are sufficient and the investment is already in place. We don't see any problem in meeting demand from the developing countries even if demand continues at a robust [annual] level of 5 percent. Obviously in 40 or 50 years' time there may be [a problem], but we will have plenty of time to work out alternatives.
"

I don't know enough to think anything about this. What do you think?

Mr Shihab-Eldin is an Oriental gentleman. He said very politely that the question was stupid. 5% growth doubles demand in 15 years. So he pointed in fact out that this is impossible. And confirmed that by talking about "40 or 50" years. But the question was about the demand of the developing countries (is China still one?), not world demand. It could not really be answered because that depends on the demand from the other, developed countries. Basically I think that the OPEC secretary-general said that if you don't know the situation by now it is no use to answer seriously.