Oil Prices
Posted by Stuart Staniford on January 20, 2006 - 6:46pm
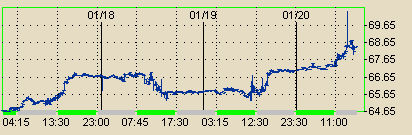
Oil prices seem to be on a tear again. The nominal reason is anxiety over Iran and Nigeria. Certainly those are good enough reasons for oil prices to increase.
But we can put the story in a larger context. The graph to the right shows the daily close in the price of West Texas Intermediate according to the EIA over the last few years. That provides the backdrop for the action in the last few days:
More below the fold.
Average price for light sweet crude during each year 1965-2004. Expressed in 2004 US dollars. Source: BP Statistical Review of World Energy. Click to enlarge.
The history of seventies oil shocks sending prices into the alto-cumulus, followed by the collapse back to earth, is clear. Prices bottomed out in 1998 during the Asian currency crises when demand was temporarily reduced. They then began rising again, but as the MSM is fond of pointing out, we are not yet back to the 1981 value. We can focus in a little bit in this next graph, which shows prices from the beginning of 1997 on:
Average weekly price of all oil grades weighted by export volume of each, together with daily price of West Texas Intermediate. 1997-present. Expressed in then current US dollars. Source: EIA, and also here for the world data. Click to enlarge.
The purple line roughly corresponds to what BP plots. It's the daily spot price of WTI - West Texas Intermediate (Freight-on-board in Oklahoma - ie you have to pay for the shipping on top of this). The green line is the weekly average closing spot price of all grades of oil around the world. The EIA weights each grade according to how much is exported globally. This line is probably a more realistic measure of the oil price forcing function on the world economy, since it includes all the heavy grades in a reasonable proportion according to how much of them is being exported. However, WTI is the price that is usually quoted in the US media.
Let's now focus in further just on the period from 2002 on. Price bottomed out at the beginning of 2002 due to demand reductions following the tech-crash in the world's stock markets, but have been generally rising since then.
Average weekly price of all oil grades weighted by export volume of each, together with daily price of West Texas Intermediate. 2002-present. Expressed in then current US dollars. Source: EIA, and also here for the world data. Click to enlarge.
We can see that the spread between the world average price and WTI is increasing, presumably as a result of the increase in the proportion of heavy oil in what is available. Now, this is where it gets pretty intriguing. Notice that there is a break in the trend around the beginning of 2004. Before that prices were increasing, but not as fast. Then remember this next graph from the most recent "plateau" post. It shows how much change in supply there was each month from the prior year. Notice that the price break corresponds to the peak in ability to increase supply.
Percentage change in world oil production from same month in prior year, according to various estimates. 2002-present. Click to enlarge. Believed to be all liquids. Source: IEA, and EIA. The IEA corrected line is calculated from the month-on-month production change quoted the following month. The smooth curves are quadratic fits to each data set - the fits are only intended to provide a clearer sense of the trend, not to express a model of the data.
It's apparently been getting harder and harder to increase supply, and now we are basically running flat over the same time last year (the change on same month last year is basically zero). Prices seem to have responded accordingly. Presumably, if prices increase much further it will be because supply starts to decline from year-ago values.
We can see more detail on the oil price trends if we just plot WTI for each year as separate lines on the same graph based on the date in that year.
Daily closing price of West Texas Intermediate. 2002-present. Expressed in then current US dollars. Source: EIA. Click to enlarge.
The very early running in this year suggests that the price increases year to year are actually accelerating (not decelerating, as I very recently hoped.)
So that's the context for what the market has done in the last few days:
Price for light sweet crude to be delivered in Feb 2006 in last few days. Source: Nymex. Click to enlarge.
Contact
- Content: editors at theoildrum dot com
- Tech support: support at theoildrum dot com
License

This work is licensed under a Creative Commons Attribution-Share Alike 3.0 United States License.
How about Kuwaits reserves? Has anyone seen this report? A link from Reuters. Brent rises $2 after Kuwait reserve report
My guess has been that a sizeable fraction of savvy oil traders have never believed these numbers. I don't know if it will move the oil markets that much.
However, what we may see is more recognition of this by the larger society. New York Times doesn't mention it today, however.
Someone who has read the actual report posted a synopsis at PeakOil.com:
http://www.peakoil.com/fortopic16642-0-asc-30.html
He describes it as "very disturbing reading indeed."
So the bottom line is that Kuwait was bullshitting the world about its reserves just like Sadam Hussein was bullshitting about having Weapons of Mass Destruction.
Kuwait's bull shit was so good that it fooled the Mother of All Bullshitters, Sadam, to go to war in hopes of cashing in on all that non-existant oil back in 1991.
Kuwait's bull shit was so good that it fooled the Father of the Ultimate Bullshitter, Geroge I father of George II, to go to war to stop Sadam from cashing in on the non-existant Kuwaiti oil. (George I got a small "honorarium" for coming to Kuwaits rescue. Not a bribe, an honorarium.)
Luckily for us, Simmons is all wrong about the rest of those straight shooters from the ME street. Other than Kuwait's Emir and Sadam of Iraq, all those other Middle East leaders are not bullshitters. They're giving us the straight dope (or is it hemp?). SA really does have the "proved" reserves that it has proven time and again it can tap into when the demand spikes.
The world is safe from bullshit.
Woo hoo.
fessin' up.
RESERVES - - PETROLEUM OIL - - MIDDLE EAST vs. OTHERS
- - comparing technical data vs. political data - -
http://mwhodges.home.att.net/energy/energy-b.htm
scroll part way down for charts.
I believe this implies that the oil market is now to an increasing extent discounting peak oil or at the very least long term tightness in the market.
While it is now possible for oil producers to sell oil at a price of approximately USD 66.70 for the coming 7 years, the implicit pricing of oil producers is no where near the current futures prices. The equity market are not on the PO wagon it seems.
According to an interview with renowned oil analyst Kurt Wullf of McDep in Barrons on Dec 26 the implicit pricing of oil stock is only at USD 40 long term oil. His own long term number is also on the low side at USD 50, while at the time of the interview the futures market was at USD 61 on average over six years.
http://www.mcdep.com/barrons51224.pdf
It is also interesting to note that the average realizable price for the coming 12 months is currently USD 69,56. For the the period 12-24 months from now the price is actually slightly higher at 69,70.
Today the near month price (Feb 2006) closed at 68.35 (it touched 68.80 during the session) and the price for Dec 2012 delivery was 63.10 (touched 63.50 intraday high). At the time of Katrina the near month contract touched 70.40 i believe, i.e. higher than today. But the Dec 2011 contract was just of 61.00.
So, clearly the markets angst over long term supply-demand is greater now. Also, today it aint so windy in New Orleans as in late August (no catastrophy) but the prices are still higher.
I have charts of these numbers that I mostly got from www.futureresource.com but unfortunately I was unable to post these.
If futures markets thought peak oil had a 50% chance of happening by 2009 then the price for Dec 2010 oil would be well over $100, since the price of oil after peak will probably be $200 and accelerating. The markets have not even begun to price in peak oil.
Today's (and recent) increases in price are despite a reasonable supply picture and high stocks (within the US anyway). The increase is partly due to an oversold state of the oil market in early December, seasonal factors, a bit of supply constraint in Russia and Nigeria, and a general jittery feeling. Any significant supply disruption (of maybe 2mbpd) or geopolitical event in the next few days could bring $100 oil in a blink. Barring that we could see the price get close to $70 but it will then retrace to near $66 and await the next mood or event.
Send me your $60 today, and call me in 2012. I'll have your barrel in the garage!
I really enjoyed this article on Alan Greenspan, told from his point of view, even laughed out loud a couple of times:
http://www.financialsense.com/editorials/daily/2006/0120.html
1)If you buy a futures contract expiring in 2012, you dont have to hold it until that date to take profits/losses/delievery - you can get out anyday and your equity is marked to market everyday. The force majeure event that you imply would likely not happen overnight, though I guess 'one' overnight it will.
2) The futures strip for oil out to 2012 has its highest price in January 2007 at $70.16 gradually declining to $63.10 in 2012. source nymex.com This implies that either a) the 'market' believes that new production after 2007 will offset depletion b) demand will be lower after 2007 c) long dated futures are so illiquid as to not be true voting mechanisms for large dollars (if someone could buy 1 billion$ worth of 2012 futures they would, but even buying $500,000 worth is hard to do) d)the market (and society) predominantly only looks 1 quarter to one year ahead in pricing e) that from 2008 to 2012 our liquid energy will be provided increasingly by ethanol, biodiesel, coal-to-liquids, tar sands etc.
It could be a combination of all of the above but I beleive most likely a combination of a) and e). What the market is missing is that these new energy sources are borrowing from Peter to pay Paul (tar sands require nat gas, biodiesel takes away some food production etc). Thoughts welcomed.
3) We keep hearing about how US natural gas futures have plummeted. Indeed they are down 50% from their highs of a few months ago due to VERY mild weather (55 in vermont today). But if one uses the NYMEX strip and takes the AVERAGE of all monthly futures prices over the next 6 years (not just the front months this winter), one discovers that natural gas has actually increased 11% in the last 2 months (even while the financial news media has pointed out that NG plummeted from $15.75 to $8.90). Long dated structural problem is being recognized - 2010 futures strip is up 25.5% from its November 2005 levels (when NG front month was over $15). In other words, averaging the entire futures strip of natural gas futures shows that this aggregate closed at an all time high yesterday. Interested in Freddy and others thoughts here...
As far as the structure of the future price curve (one that is seldom charted in print for some reason), I agree with you that the bottom line is that the market views today's problems as more or less temporary. I think most traders still believe that oil and alternatives will be able to grow to generally meet demand over the next five years (perhaps keeping in mind that demand growth may be suppressed at today's high price levels).
One thing I have noticed is that when the market moves up, long term futures move with them but to a lesser degree; and likewise with downward movements. Long term futures tend to lag behind short term ones, which is basically what you would expect. The result is that after a strong upward move (like now), long term futures are lower than in the present (backwardization); while after a short term decline, long term futures will be higher (contango).
That's also very interesting news about natural gas. I looked at the Dec 07 future price here:
http://futures.tradingcharts.com/chart/NG/C7
You can plainly see the steady upward trend over most of the past 6 months, in great contrast to the seesawing of the short term futures price. Interestingly you don't see the same effect with long term crude oil, that has been up and down almost as much as the spot price. So if the NG market is recognizing structural problems, that doesn't seem to be happening yet with crude.
You should also be discounting your price by the time-value of the money and goods involved. Ignoring the risk of a default for the moment, if you can make 5% on your $60 -- and you can get a five-year 5% CD today -- then if you're willing to pay $60 today for a barrel of oil in five years, you're betting that the price then will be more than $76.58, not that it will be more than $60. If you believe the price will be less than $76.58, you're ahead to buy the CD now and use the proceeds to buy the oil in five years. Include a 10% chance that the seller will default on the contract and you get nothing, then your $60 today is a bet that the price will actually be above $85.09.
Of course, that's using simple-minded calculations for the expected value of the future good you get for $60 today. You can make the model as complicated as you want. Still, the bottom line for me is that today's $60 price for oil five years out translates into "the market" expecting prices >$75/bbl by then.
Alternatively, you could put up 10% in margin and keep the other 90% in your 5 year CD and still get all the upside.
"First the cash market went up, reflecting the reality of a very tight supply-demand situation," said Robert Barbera, chief economist of Investment Technology Group, a trading concern. "Then the futures went up, making the case this was an enduring change in energy prices."
Now the stock market has come to believe the issue will remain with us for a long time.
How do you like the headlines today that the Dow dropped by 215 points because.........G.E. earnings were.....what they predicted!?! WTF?
Thank goodness for the internet at least a small % of the population can still be informed, but we sure have to work at it.
http://www.theoildrum.com/comments/2006/1/19/11155/2685/23#23
All that happened today in the stock markets was a faint whiff of reality, the hankies are still covering their noses, eyes still blinkered, ears still deafened by their own noise. There's a further 20% or more downside for stocks in 2006, but I doubt they will be making the real plunge just yet. If you wish to know what I expect to happen in 2006:
http://www.theoildrum.com/comments/2006/1/2/101214/8972/2#2
What you are really saying --if I understand that stuff about excess poker chips, or "excess money" as you call it-- is that all our fancy "financial market" stuff and all our high brow market "analysts" and their cronies are involved in a huge poker game where each bullshitter is trying to out bluff the next bullshitter at the table, each in hopes of cashing out before the truth becomes known.
The thing that intrigues me about the stock market (and I get just as fooled as the next guy) is why none of these "blue chip" shares pay dividends.
It used to be that you got dividends from the shares you purchased. The compnies made real profits and they plowed some per centage of that actual success as real pay back to their shareholders.
Then, one day someone got the bright idea: Hey why pay back in real money when we can just feed them bullshit? We'll tell the shareholders they are being rewarded by the year to year "growth" that the company experiences as it re-invests in itself and they will be rewarded as the "value" of their paper goes up! Then we get to rape the company for all it's got in the form of much deserved, extravagent CEO compensation. What a great idea. They (the dead brain stock buyers) will never figure it out.
I wonder how historians will view the Mother of All Collapses that is coming our way? Will the historians ask, What were those lemmings thinking?
Maybe not. No point in learning a lesson.
The US has avoided what I would call a 'proper recession' for too long now by virtue of: cheap energy, reserve status of the $, the (mostly) illusion of steady growth, astute manipulation of markets, etc. This has caused excessive imbalances which I don't believe can me managed away by a smooth adjustment.
Once any one important aspect of US / global economics 'breaks' I think there will be a domino effect lasting several years during which abrupt adjustments occur. Things will look very different once that process starts, but the markets will continue 'as normal' until then.
The spread is not increasing, if you use a logarithmic scale, as one should. Arithmetic graphs are misleading in their right-hand sections.
Is that generally how it goes? Or are the rigs/platforms contracted to drill one item only? Either oil or gas?
I mention GOMEX because i live nearby, but more inmportantly it supplies the nations energy needs.
Lots of times you don't get either one or the other, but some combination of both, which is separated using various process equipment. Gas, produced primairily in an oil field is termed "associated" gas, visa versa, oil from a gas field is associated oil. <Even if a well is producing "all" oil, gas(es) will come out of solution in the first holding tank it lands in.>
In many Gulf of Mexico salt dome formations, gas is produced in the center of the field, with oil being produced in outlaying areas. That due to the lighter gas being above the oil, both being held in an inverted bowl-looking geologic structure. Fill the sink with water, pour cooking oil on top then get a glass bowl, invert it and place it in the sink trapping some air too. Air will be the CH4, cooking oil will be the crude.
gas well
| | oil well
..|. |/
. gas .|
. oil |.
. water .
............
Depends on the shape of the trapping geologic formations. Now try the same with a rectangular glass baking pan and then vary the angle of the "bottom" of pan with the horizon. See what's going on now?
If you drill a shallow well in the center of the bowl, you get gas. If you drill a deep well in the center, you get gas from a shallow producing zone, oil from a deeper producing zone. If you drill into the outlaying areas, you only get oil, maybe some water.
If you have some idea of the underlying geology, you go first for the center of the formation, then later the more marginal areas towards the outside.
Most of the time, the gas pressure above is affected by the oil pressure below and there is an optimum production rate of both for any given field due to rock porosity.. da..da..da, So, overproduction of one versus the other will cause an overall loss of the total that can be produced during the field's lifetime. Hence not much flexibility is available to chose one over the other.
If you have the luxury of choosing between A or B, you go for maximizing the expected payoff (ROI). Evaluating your expected ROI must consider your expected purchase price, which for gas could be less than oil if the gas needed to reach far away market areas via LPG, which could and probably does skew the drilling rig distribution somewhat in some areas, but given equal expected ROI, there would not be a driving factor causing you to chose one over the other.
Most of the Gulf of Mex is XXX with pipelines and market access of one product over the other is not much of an issue. If there is no pipeline, construction of a new one is not an obstacle, provided the reserve is large enough to finance one. In the old days, associated gas that could not be loaded on a small tanker and ferried to shore, was flared off as it was produced with the oil, but now its illegal in most places and unmarketable associated gas is reinjected back into the depths to be re-produced at a later date when a pipeline or LNG facility is built near the field.
Then there are the producers like the one I worked for once, that, when the wellhead price of gas went down sooooo low in the mid 80's .... $1.20/mmcfd, they just opened more wells to get the cash flow up high enough to pay the bills again. I know some countries were doing that from time to time too. That's price-demand inversion.
Anyway. To finish this story. They look at all the possibilities from the portfolio of leases they have, chose their best probability of a hit and schedule the rig.
Another minor point, the price usually quoted in the media as "the oil price" is the NYMEX futures contract for nearest month's delivery. This is light sweet crude, which I think is not quite the same as the WTI grade. There are supposedly additional contracts which trade at the difference between the standard light sweet crude, and each of four major American oils: Louisiana Sweet, WTI-Midland, West Texas Sour, and Mars Blend from the gulf.
The failure of supply to grow recently, with the price increases seen over the same period, could lend itself to the same sort of price elasticity analysis that you completed recently for the various oil shocks of the 70's, gulf war 1 etc.
"Lost" production could be estimated by some sort of extrapolation of demand over the same period. It would be interesting to see how it compares.
Cheers,
Xuewen
It's kind of a confusing graph because it is really 3 graphs in one. The upper right quadrant shows price vertically against time horizontally; the lower left shows production horizontally against time vertically; and the upper left shows production horizontally against price vertically. This lets you see how it all fits together but it can be confusing at first.
The chart is also drawn incorrectly in the lower left quadrant; the curve should be of opposite concavity to what is shown.
Keep in mind that for something like oil, Hotelling's analysis applies to the world as a whole, based on the assumption that oil owners want to produce oil on a schedule to maximize their expected profits.
There are two interesting points. The first is that production starts at a maximum and immediately begins to fall, eventually hitting zero. This is of course not consistent with the historical record, which has worldwide production generally rising so far. I don't know why the model fails in this way, but perhaps we can ignore this for now and focus on it as a prediction of what will happen post-peak. In that time period it is indeed plausible that oil production will continually fall.
An interesting detail is that (despite the error in the chart) the rate of decrease steadily increases, that is, gets worse. Most Peak Oil models I have seen assume a relatively gentle die-off, but economically, producers have an incentive to drive their fields hard and kill them sooner.
And then there are prices, in the upper right quadrant. The formula is right there: prices increase exponentially. And although it is not clear from the chart, in fact the analysis shows a further constraint: the exponential rate should be the same as the general rate of interest. Today that would be around 4 to 5 percent per year.
The Hotelling analysis is actually based on price as a starting point, and this prediction is the strongest part of the whole picture. If prices go up at the same rate as interest payments, it means that producers can't increase profits (once discounted to their present value) by moving production from one period to another. This is what makes the solution work as an equilibrium.
Producers will adjust their production levels so as to stay on this price curve (if possible). If prices are going up faster, producers will try to increase production to bring prices down. If prices start to stabilize or go up slower, producers will hold back on production to push prices back up.
So this is the Hotelling prediction for oil prices, that they will increase by about 5% per year. This will continue until oil gets so expensive that it is mostly not used any more and has been replaced by whatever substitutes can be put into service. Again, I don't see a particularly good match with the historical record here, but perhaps as we move into a near-peak or post-peak environment, profit incentives will become dominant and prices will begin to follow the Hotelling curve.
At some point I want to read some of the papers that discuss Hotelling's analysis and see if I can find out if there are more complete models that allow for production to rise and fall, and see what they say about price trends in that situation.
AustinElliot makes an interesting point. It would be interesting to graph the spread over the last five years in order to see if the spread is indeed increasing. If it is, then we might conclude that the mix in the world price reflects increasing amounts of heavy oil, i.e., we are running out of the good stuff. For a while the increasing reliance on heavy may act as a depressant the overall cost of oil...but not for long.
Hope I am making sense here.
As I get more and more concerned and want to prepare, my question is:
Can you recommend the best ways to invest to prepare for the effects of peak oil? Should one buy stock in Exxon Mobil or Occidental? Oil futures? Canadian Petroleum Trusts?
What have you all done to prepare financially for these events?
Thanks in advance!!
Hal
My old plan was to just have a stockpile of canned goods and a gun to defend them, then use the food to get whatever I needed after the grocery stores have no more inventory. But it was pointed out I'd have better luck by joining up with a group of like minded people working towards a goal of self sustainability, and I'm tending to agree that is a better plan.
It depends on your age, risk profile, horizon, do you have children, how many assets you currently have, etc. The answers are different for everyone but if you believe in Peak Oil and subsequent decline in energy availablity, you inherently realize that energy is all that really matters - it is the limiting resource that gives us food, transport, industry,etc. Therefore at sometime, you would want to turn 'abstract' wealth (dollars, euros, gold, stocks, bonds) into real wealth (food, water, land, biomass, solar panels, windmills,friends, community).
As far as particular investments, the huge market cap at Exxon and other majors will have a hard time increasing at multiples of today - probably better to own smaller companies that have more leverage and less capex. Regarding futures, I feel oil is going to triple digits, but could drop to $30-$40 easily if there is a recession/depression. If you use margin to buy oil futures and such a drop occurs you could be wiped out, even if oil goes to $200/bbl eventually.
Since I havent really seen an oil futures example explained here before I will do so briefly:
Lets say you buy a futures contract that expires in December 2009 - fridays close of this contract was $65.75. This contract 'controls' 1,000 barrels of crude oil of the following quality:
"Specific domestic crudes with 0.42% sulfur by weight or less, not less than 37° API gravity nor more than 42° API gravity. The following domestic crude streams are deliverable: West Texas Intermediate, Low Sweet Mix, New Mexican Sweet, North Texas Sweet, Oklahoma Sweet, South Texas Sweet.
Specific foreign crudes of not less than 34° API nor more than 42° API. The following foreign streams are deliverable: U.K. Brent and Forties, for which the seller shall receive a 30 cent per barrel discount below the final settlement price; Norwegian Oseberg Blend is delivered at a 55¢-per-barrel discount; Nigerian Bonny Light, Qua Iboe, and Colombian Cusiana are delivered at 15¢ premiums."
Ok, so you control 1,000 barrels of oil at $65.75 - the futures exchange currently requires $4,725 initial margin on this 'investment'. Lets do 2 quick examples of putting up different amounts of margin and looking at what happens with an increase to $80/barrel vs decline to $50/barrel.
a) if you put up the full notional price of contract (not necessary) in cash or T-bills, of $65,750 then you will make $80-$65.75=$14.25 *1000 Barrels or $14,250 on your initial investment of $65,750 or 21%. If oil drops to $50, your account is now worth $50,000 or a decline of $15,750 (excluding interest). Basically you make or lose $1,000 for every dollar increase/decrease in futures price.
b) if you put up the minimum allowed of $4,725 and oil goes to $80, the same increase in value of $14,250 brings your account value to $18,975 which is a 300% increase in portfolio value. (sounds great!) However, there is a 'maintenance margin' of $3,500 per contract which if your acct value falls below, your broker will ask you to wire in money to bring it back up to original margin level - if you dont, they will liquidate the position at the market (nasty spreads in backdated futures). If oil goes from $65.75 to $63.75 in one day, your account is now worth $2,000 less, or $2,725. Since this is below the maintenance margin of $3,500 you will get a call. A series of such calls will occur if oil drops to $50/bbl and the overall '$' amount of your loss will be equal to example a), thought the % return will be very different. Basically, futures give you lots of leverage.
Essentially, investing in futures is glamorous and appealing to some, because investing in stocks allows a maximum leverage of 1:1, but futures gives you many multiples of that. There is no free lunch however and higher rewards are obviously offset by higher risk. I always am way overmargined so even if my positions go south I am never near getting margin calls. If you do invest in futures, I recommend putting up at least triple if not quadruple what the required margin is - if you cant, then you shouldnt be trading in futures. (unless youre fabulously rich or certifiably insane)
note: if youre only slightly rich, or half-insane, the NYMEX now has 'mini' contracts on crude, nat gas, heating oil and gasoline that are only 50% of the size of the regular contracts.
Most oil companies, certainly the biggest, are running down their reserves. A few small ones are actually growing them, and have got to the point that they are also adding drill rigs, increasing production, reserves, revenue and net income. Three fairly similar ones are ard, gmxr and gpor, all of which doubled their net income from 2q to 3q. However, the latter was damaged by Rita, and will not recover until 2q06. The first two are extremely profitable at current resource prices, and would still be if prices declined substantially. I think ard and gmxr stock will at least double over the next twelve months, gpor may be a good buy mid-year (unless hit again by hurricanes - their properties are in LA, on the edge of the gom.)
Futures make no money if the price stagnates or declines, regardless of how much or how little you put up. In my view canadian trusts buy their reserves at too high a price - much higher than US E&P's do - and therefore depend on prices continuing to rise to continue paying out their dividends - which, at 15-18%, is lousy compared with stock increases of the best smaller E&P's. See
http://finance.yahoo.com/q/bc?t=1y&s=GMXR&l=on&z=m&q=l&c=ard%2C+gpor.ob
Jeffrey Rubin of CIBC pointed out in his Tar Sands report a couple weeks ago that 80% of the worlds oil reserves are nationally owned, leaving small room for private investment (his thesis being, tar sands one of the few large remaining private plays).
I for one, think the EROI/Environmental externality will start getting attention in the next year or 2 in Alberta when Canada is faced with either meeting US Nat Gas demand or using it to melt their own tar sands. Also, indigenous tribes (and others) will be increasingly vocal about the water pollution that is ocurring north of Edmonton due to tar sands ops.
Sunday, Jan. 22, 2006
THE OIL SANDS - Bob Simon reports on the oil boom in Alberta, Canada, where the oil sands produce a million barrels a day and hold reserves eight times those of Saudi Arabia. Draggan Mihailovich is the producer.
(I think Draggan is the show producer not the oil producer)
After Katrina not only did crude go up but refining took a hit and there was a shortage of gasoline (or a least a tightening of supplies). Deliveries to stations were reduced, forcing them to purchase more often, causing the price to go up faster. Now the price of crude is going up, but not on the refined products (yet).
Nothing like that is going on right now.
See http://www.nytimes.com/2006/01/21/business/21charts.html.
Wow, thanks for all that fantastic info!!
I may indeed dabble in the futures market after all. :)
The survival information is useful too, since one easily imagine in this country full of guns that things could get ugly if food stops being delivered. That's a scary thought. I was once in a Home Depot before a giant storm in New England and I couldn't believe how people turned from civil creatures to survivalist animals, as though all civility just evaporated during a time of panic.
http://www.globalresearch.ca/articles/CLA302A.html
http://www.theoildrum.com/story/2006/1/20/101314/933#comments
The predominant consensus from TOD folks is that the actual threat to the US$ from the IOB is minimal, I'm inclined to agree but think it could contribute to $ problems.
Attack Iran just because of the IOB? It would be daft since the downside risks probably far outweigh any real benefit, but I could believe it of this US regime if it is thinking like William Clark.
It is about Iran currently shifting it's money out of Euros, pre-possible-sanctions.
Don't know how this would effect our IOB discussion, but I'm sure it will.
http://www.taipeitimes.com/News/front/archives/2006/01/22/2003290159
"William R. Clark is manager of performance improvement at Johns Hopkins University School of Medicine. His research on oil depletion, oil currency issues and US geostrategy received a 2003 Project Censored Award and was published in 'Censored 2004'. He lives in Columbia, Maryland."
It doesn't sound like he has any professional background in the relevant fields but is an interested, enthusiastic and opinionated amateur.
If nothing happens on/b4 20 March 2006 <or shortly thereafter>, I promise you won't have me to kick around any more. If it does, I'll be the first to say I told you so. I don't think its totally priced into the USD=EUR=JPY yet, because too many people don't think it will be a big deal. But if it is, I know which side of the see-saw I'll be on.
Oil price not going to matter <We'll have the money to pay for it.>
DJ 32,000 - 40,000
SP 13,000
http://www.wired.com/news/technology/0,70034-0.html?tw=wn_tophead_11