| UK's Guardian: Are Capitalism and a Habitable Planet Mutually Exclusive? | The Oil Drum | World Nuclear Panel Refers Iran to the Security Council |
November Statistics Updates
Posted by Stuart Staniford on February 4, 2006 - 5:38am
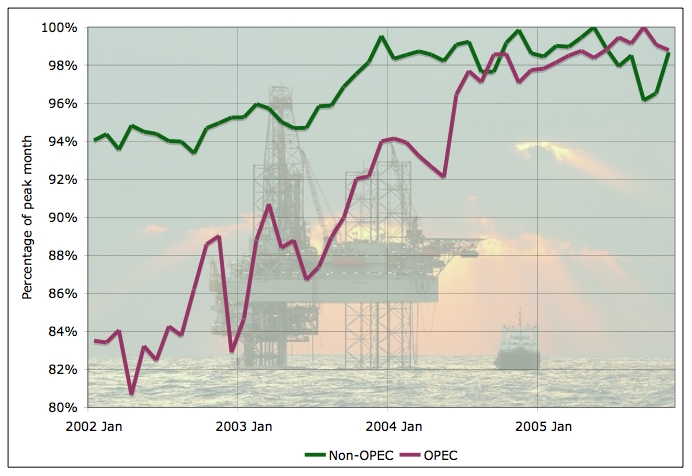
Average daily oil production, by month, from various estimates for OPEC and non-OPEC as a percentage of their highest month (May, 2005 in the non-OPEC case, September 2005 in the OPEC case). Click to enlarge. Believed to be all liquids. Graph is not zero-scaled. Source: EIA.
Update [2006-2-5 0:40:43 by Stuart Staniford]: Added this graph of OPEC and non-OPEC supply during the "plateau" period.
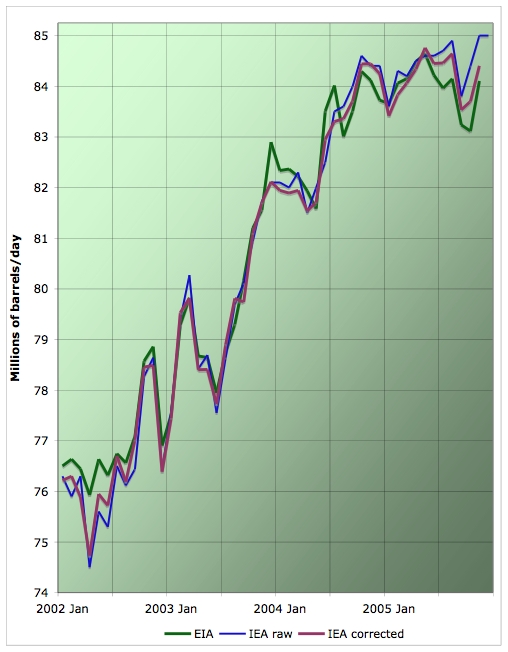
Recall that there was some excitement when the IEA initially estimated November production at a high 85mbpd, but they subsequently backed off that with their revised numbers a month later. EIA confirms that while there was some recovery in production in November, it was not near the peak month. Currently, the peak month still stands at May 2005 in both the EIA and IEA corrected lines.
Recall for context that these plateau graphs are focussed on a very small part of the total world history of production - just the rise since the beginning of the economic recovery in 2002. The little yellow box in the following graph (since 1930) is what the graph above shows.
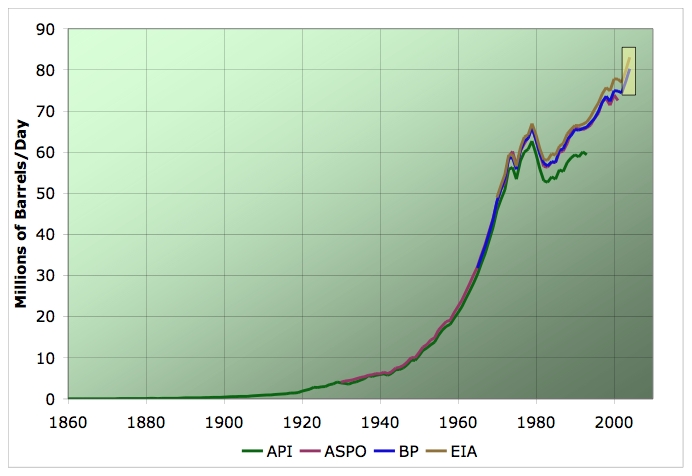
Average annual oil production from various estimates. Click to enlarge. Believed to be all liquids. EIA line includes refinery gains, others do not. Sources: ASPO, BP, and EIA.
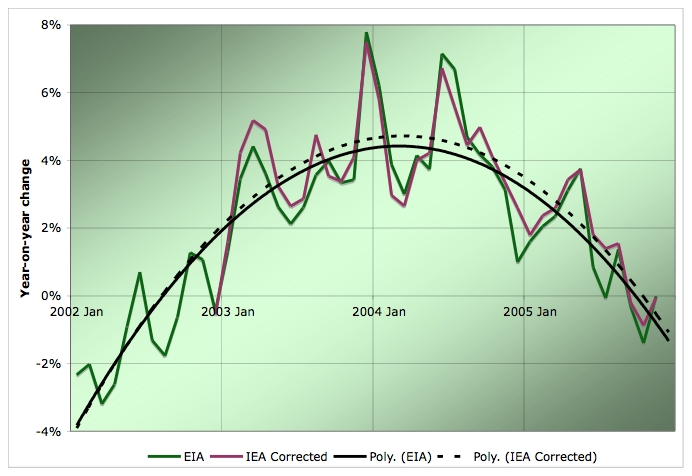
As the next graph shows, both EIA and IEA believe production increase year-on-year from November 2004 to November 2005 was very close to zero.
This was an improvement on September and October, when production was actually down on the same month last year. With a little more oil, Americans drove a little further than they otherwise would have:
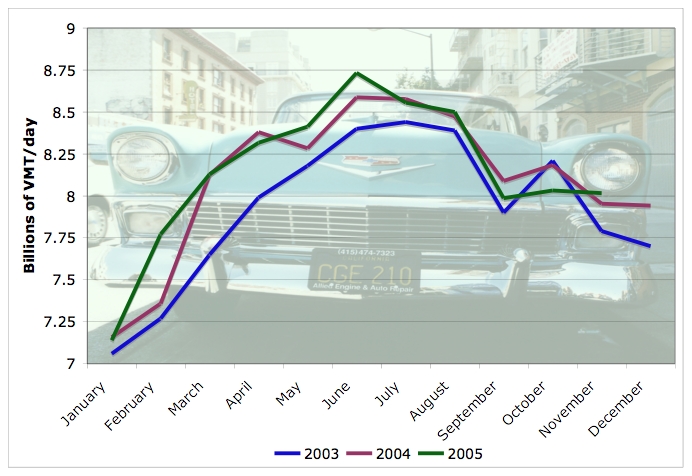
Average daily vehicle miles traveled by month in last three years. Source: FHWA.
Unlike September and October when miles driven was down, November showed a very slight increase on last year. However, this is still a very anemic increase compared to a normal year-on-year change, and suggests that high oil prices continued to take a toll on the public's willingness to drive, and likely on the larger economy also.
Average daily oil production, by month, from various estimates for OPEC and non-OPEC as a percentage of their highest month (May, 2005 in the non-OPEC case, September 2005 in the OPEC case). Click to enlarge. Believed to be all liquids. Graph is not zero-scaled. Source: EIA.
Update [2006-2-5 0:40:43 by Stuart Staniford]: Added this graph of OPEC and non-OPEC supply during the "plateau" period. I was looking to see who had plateaued. Looks like both were increasing during 02-03, and both have plateaued now. However, it does look as though OPEC has a tiny cushion of capacity - they were able to notch up slightly in September in response to the hurricanes, but then promptly took it away again.
Contact
- Content: editors at theoildrum dot com
- Tech support: support at theoildrum dot com
License

This work is licensed under a Creative Commons Attribution-Share Alike 3.0 United States License.
http://omrpublic.iea.org/currentissues/sup.pdf (page 51)
So, included are all such things as ethanol; sobering thought that, ne c'est pas? ;)
To elaborate: all non-conventional liquids are included, if these have been increasing in recent years (as, presumably, they have) one can draw certain conclusions about the production of fossil oil over that time.
We will have increasing confidence about this during the course of this year if and as more confirming data comes out.
http://money.cnn.com/2005/06/27/news/economy/gas_prices/
The article also references the lack of reinvestment by the oil companies that indicate by their behaviour - rather than their words - that they don't believe it's worth looking for more oil.
"Never again will we pump more than 82 million barrels."
-- T. Boone Pickens, 9th August 2004. On the Kudlow and Cramer Show, MSNBC.
http://www.monbiot.com/archives/2004/08/23/living-with-the-age-of-entropy/
"Global oil [production] is 84 million barrels [per day]. I don't believe you can get it any more than 84 million barrels."
-- T. Boone Pickens, addressing the 11th National Clean Cities conference in May 2005.
http://www.peakoil.net/BoonPickens.html
"I don't believe that you can increase the supply beyond 84 or 85 million barrel as day."
-- T. Boone Pickens, on "CNN In the Money", June 25, 2005.
http://transcripts.cnn.com/TRANSCRIPTS/0506/25/cnnitm.01.html
"Supply is--you`ve just about had it on supply; 85 million barrels a day world supply is about it. "
-- T. Boone Pickens, on Hardball with Chris Matthews, MSNBC, Aug. 26, 2005
http://www.msnbc.msn.com/id/9118826/
http://www.resourceinvestor.com/pebble.asp?relid=10766
-Ptone
However the error bars on current oil production are probably 2 mbd - that is the figures are not accurate to anything more than that. For example, Venuzuelan oil production has been reported at either exactly 2.540 or exactly 2.640 for nearly 3 years - a ridiculous precision which disguises a value of between 2 and 3 mbd. For another example, at least 10% of Nigerian Oil production is probably stolen (or reclaimed by the local inhabitants from whom it was looted in the first place.)
If we now move to an Iranian boycott expect another jump in unreported black market oil (and UN bribery).
That we are in a fuzzy plateau at around 85mbd is really the best we can say with any certainty. (I suspect that little "black" oil is in the EIA or IEA statistics so me may be over 85 mbd already.)
Though there could be scope for non-OPEC production to rise a little it's beginning to look like the odds favour non-OPEC production to have plateaued. May 2005 could well have been peak non-OPEC all liquids. It has been within 2.5% below the May 2005 peak for the last two years apart from the post Katrina dip. Let's hope this plateau can be sustained for a few years more, though, with Mexico and North Sea declines looking troublesome, that may be optimistic.
The OPEC reaction does indicate they may have a small surplus of 1 to 2 mbpd that can provide for brief shortfalls but whether that is from production (and so could help with shortfall lasting several months) or just from existing stocks (hence limited to brief, occasional, shortfalls) may be a moot issue. Also, that buffer is no more than projected demand growth in 2006.
Should 'business as usual' continue it's getting mighty difficult to imagine all liquids production exceeding 90 mbpd, which current forecasts of demand project within 3 years. The 95 mbpd that EIA want for 2010 is looking like a delirious pipe dream.
http://www.eia.doe.gov/oiaf/ieo/oil.html
I guess that any significant supply disruption (greater than 1 mbpd for 3 months or more) will result in a supply shortfall...
"There must be some way out of here,"
Said the joker to the thief,
"There's too much confusion, I can't get no relief.
Businessmen, they drink my wine, plowmen dig my earth,
None of them along the line know what any of it is worth."
"No reason to get excited," the thief, he kindly spoke,
"There are many here among us who feel that life is but a joke.
But you and I, we've been through that, and this is not our fate,
So let us not talk falsely now, the hour is getting late."
All along the watchtower, princes kept the view
While all the women came and went, barefoot servants, too.
Outside in the distance a wildcat did growl,
Two riders were approaching, the wind began to howl.
Another couple of thoughts occured to me looking at your percentage of max production graph.
- Both OPEC and non-OPEC production look a fairly close fit to a linear function recently running up to the Katrina blip. Non-OPEC from the beginning of 2004, OPEC from mid 2004, that might give enough datapoints to give a feel for slope and error bars.
- There seems to be a fairly clear negative correlation between OPEC and non-OPEC production whenever non-OPEC production is abnormally high or low, sometimes with a 1 month delay on OPEC production. That smells of there still being an OPEC buffer, albeit small, though a multitude of other explanations are possible.
"No time now for contrition:the time for that's long past.
The walls are thin as tissue and
if I talk I'll crack the glass."
If country A over reports every month and country B under reports every month, the errors may cancel out. However, the extreme consitency of the statistics from places like Venuzuala has all the marks of the EIA or IEA saying, "the figures from Venezuela are obvious nonsense" (or even "we haven't anything from them this month") "so let's use last month".
So I'd set the error bars at 2mbd or so, certainly not less. We probably will never know the exact peak, only that we will be able to say, at some time, 'we have clearly passed the peak".
9/22 1,379,000
10/21 986,000
11/22 621,000
12/22 412,000
01/25 373,000
You can see recovery has slowed dramatically. The MMS said they expect 255,000 still to be offline by the start of the new hurricane season this summer, so not much more will be restored. I said impact of the delay in new production will just start to be noticed soon because the decline in producing wells takes a while to show clearly, many wells have only been up 3-4 months since the storms, and decline rates would have been masked by the return to production of other wells/fields.
But do the only slightly rising global rig counts reinforce the idea that peak/plateau is happening now? Not much more drilling happening despite prices simply because there's not much more to drill for? I think this is an important part of the numbers you've posted - I'm just not sure how exactly it's important.