Peak Oil Contango?
Posted by Prof. Goose on March 23, 2006 - 12:22pm
More interesting ideas (and explanations) under the fold.
Normally when a market switches from temporary backwardation back to contango, it is a result of the short-term supply problem that caused backwardation being resolved--that is, the spot price decreases. The interesting point from a Peak Oil perspective is this: a shift in fundamentals, such as a steady decline in world oil production, will make the commodity increasingly expensive in the future and will cause a market in backwardation to shift to contango without a decline in the spot price. Interestingly, that is exactly what may be unfolding in oil--compare the two graphs below, the first (from Bank of England), showing the crude oil markets in classic backwardation as of Feb. 15th, 2006, and the second showing a potential reversal in backwardation as of Mar. 21st, 2006, especially in the 2009 and 2010 contracts:
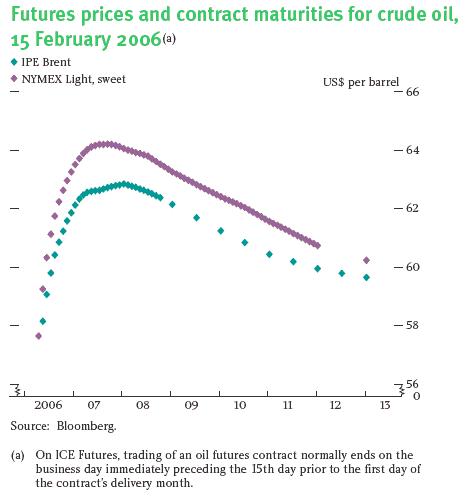
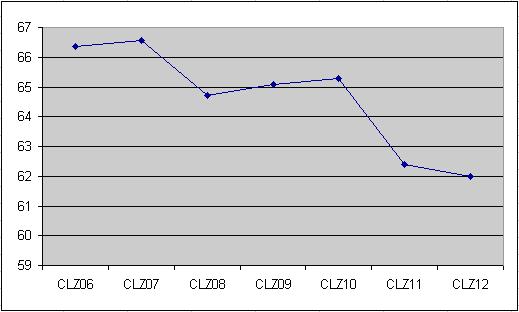
Chart 2: December NYMEX Crude Futures as of market close, March 21st
Click on a chart to see full size.
While the data presented are inconclusive, I think that this theory warrants further analysis--or outright debunking. Hopefully some TOD readers have access to the kind of economic expertise and historical data to shed some light on the subject...so have at it!
(This is Jeff's condensed version for TOD, if you would like to read a bit more of an in-depth post, find it here); also find a discussion of the same topic (in the second half of the post, after an interesting discussion of the memetics of peak oil) at Anthropik.
Contact
- Content: editors at theoildrum dot com
- Tech support: support at theoildrum dot com
License

This work is licensed under a Creative Commons Attribution-Share Alike 3.0 United States License.
Other future markets like wheat for example are not the subject of debate and scrutiny, and therefore less volatile. I think when supply is on the decline though there will be one last "flip" to contango. But that shift still has a few or several years to go. I work on a drill ship, in a fleet of such ships. My company is making record profits. Wells are pumped dry every day but new ones are drilled in deeper and deeper water.
This economic shift in theory would be gradual (see adam smith) it is the political and popular culture that drives the oil futures.
I expect we'll see much greater volatility in the near future, in part because the Bad People have likely figured out how easy it is to cause the West economic pain by staging a high profile (even if unsuccessful) attack on the oil infrastructure.
If I expect resources to be scarce in, say, one to five years, I will be willing to pay more for it NOW. As traders say, it's already in the price.
If the world believes we are past peak, they would be willing to pay 10$ gasoline prices NOW - simply because it will be harder to get in 5 years. That means that the price that it will take to produce the stuff in 5 years are already considered NOW and do not need to be put into the futures' prices which are due in five years. The futures prices will therefore remain a sort of running average of past prices MINUS what you would get by putting your money into bonds.
That is why we see a long period of constant futures in the 1990s for instance. Price went up and down, but the average was mostly the same - thus the futures (five years' difference, for instance) remained mostly the same.
If you see the futures price as "present expectations of the price in the future", you will be led down the wrong path. PRESENT PRICES already have the present expectations of future availability priced in.
If you try to use the future's price to tell us something about the future, you fall into the thought trap that Greenspan fell into a while back - that PO doesn't exist because the future markets don't show it. As he made his comments (not quite two years ago, if I remember correctly), oil was priced somewhere under 40$.
But after that, it's a question of "investment" (speculation) and what's going to give you the most return on your money. In that respect, all investments must be equal. That's why the comparison with the bonds comes in.
Anyway, the economist would say there's no free lunch - neither in the short term or in the long term, and the typical curve (Feb. 2005) demonstrates this wisdom.
Contango is not necesarily considered the "normal" state of affairs for all commodities. Grains are harvested once per year, and in a normal year that supply must be allocated over the coming year. Higher prices for the contracts late in the crop year are the market's way of encouraging storage. In a short crop year, price are higher in spot markets and nearby months to discourage storage.
Crude oil, however, is produced continuously. It is not at all unusual for the crude oil futures market to be in either contango or backwardation. Both conditions have prevailed for extended periods over the last two decades. The point still stands, however, that a backwardation reflects a tight current balance between supply and demand that is expected to ease going forward, and a contango would relfect the opposite situation.
The thing that is most interesting is that the distant contract prices can be interpreted as the market's long run forecast regarding the supply and demand balance. As such, distant contract prices are much less volatile than spot prices and the prices of nearby contracts, which reflect every short-run production/distribution interruption, the current year's weather, etc. The market anticipates such short-run issues working themselves out in some limited amount of time. Distant contracts' prices, by contrast, reflect more signal and less noise.
The prices for delivery of crude oil five years in the future were very stable at around $20 per barrel for most of the history of the NYMEX contract prior to 2003 (I wish I knew how to post a spreadsheet chart that I created that shows this). Since that time, the five-year forward price has gone up fairly steadily to its current level of around $65 per barrel. The market concensus regarding the long-run balance betweeen supply and demand is changing substantially. There is the big story.
I agree - it's the rise in distant future price that's a real sea change. No more "oil will be back down to $20/barrel" any more.
The prices are for NYMEX crude oil futures contracts delivering about 3 years in the future in the early 1990's, as the futures did not trade 5 years out back then.
subtr4ct
If the end is chopped off, here's the link to view it directly:
http://i78.photobucket.com/albums/j100/subtr4ct/oil.jpg
It really spikes up, starting around the beginning of 2005.
It would be great to compare it to then-current oil prices to see how it compares, but I need to know what the dates mean.
The first observation is the settlement price on 11/23/1990 of December 1993 futures. The last point is yesterday's closing price of Dec. 2011 futures.
This graph is one of the most compelling illustration of the "Peak Now" that I have seen this year.
This really helps to debunk the view that the current 'plateau' is just another little hiccup in the march on up to 120Mbd in 2030.
Thanks a lot for posting this graph. I hope Stuart can add this to his "why we're probably peaking now" page.
Note that I have used a dollars per 100,000 BTU price (not the conventional dollars per 1,000,000 BTU price) to make the two series of comparable magnitude.
But governments could intervene and your options may as well be worthless. But peak oil in combination with inflationary fighting measures could so devastate the economy (via deflation) that oil five years could cost only half as much as it does today. But one shouldnt rejoice if average income has fallen to one tenth of today's level.
Has anyone else thought about this? Peak Oil decimating the economy to the point where the price of oil falls simply because of deflationary pressures (think cascading unemployment reducing demand for virtually everything which in turn reducing pressure on scarce resources). Add in potentially restrictive government restrictions like gold confiscation or protectionist terrifs or high interest rates or permitting employers to unilaterally cut salaries).
Or is the inflationary route pretty much guarenteed?
What government intervention has been or could be used?
To me, if (or once) the market accepts Peak Oil, then the degree of contango--especially in the 3-5 year out range--will represent the best market information on interaction of declining production and demand destruction. This will, I'll argue, not actually be "contango" per se, as it will not be caused by the same market forces that cause "standard" contango--it might look more like contango in S&P500 futures back in 1995. That is to say, it will move upward sharply based on future assumptions of declining production. If global decline proceeds at 5% beginning now, how much could we expect to see the futures price increase year-on-year? 10%? I have no idea how to begin calculating this. It does strike me, though, that contango is constrained at some point by arbitrage: if contango is at 10% a year moving forwards, that will exert a strong pressure on current spot prices because of increasing demand from arbitrageurs who sell a future, buy and store the oil, and deliver. Depending on how well inflation risk can be hedged with other instruments, and the performance expectations of other markets, I suspect that contango exceed 15% a year because of arbitrage pressure... any historical data or thoughts to back up this concept of contango and arbitrage dragging spot prices up by the bootstraps?
It's harder to say exactly how big the increase could become before this is a major factor. And of course we might see short term fluctuations that are substantially larger. In principle any rate of increase above the prevailing interest rate could trigger the effect (this is the Hotelling model for production of exhaustible resources). That would be 5-6% per year. In practice it could probably be a little more than that but I guess I'd be surprised if it stayed above 10% per year.
Note that this effect looks to the naive eye like greedy speculators are artificially driving prices higher than they should be under conditions of supply and demand. And note too that we have heard exactly this charge in recent months, as oil prices have stayed high despite a short-term glut as evidenced in growing storage inventories. However Hotelling showed that this production profile is actually optimal in terms of maximizing the net economic value of the oil.
We should be glad when this happens; by slowing down current oil consumption we leave more for the future. Some people argue that this is not enough, we should tax it to make it even more expensive, but this is economically inefficient and will cause excess and premature consumption declines. It makes people poorer today and gives them fewer resources with which to deal with future challenges. The best method is to let the market predict future prices, let those future prices drag up today's prices, and trigger conservation on that basis.
The effect should work in the other direction, too, BTW; if future oil prices are not rising at a decent pace (i.e. keeping pace with inflation plus a few percent) then we would expect to see higher production today, leaving less for the future. This effect may have been operating in the past but we will likely see a transition away from it as we approach the peak.
http://quotes.ino.com/exchanges/?r=NYMEX_CL
I made a chart from this data:

As you can see, although it is noisy it does not look too different in shape from the first chart above. So I would not say that circumstances are all that different now.
2009:
April: volume 0 / open interest 0
June: 60 / 60
December: 103 / 33855
2010:
April: 0 / 0
June: 0 / 0
December: 387 / 22297
2011:
April: 0 / 0
June: 0 / 0
December: 328 / 14063
2012: (Only December contract is available)
December: 9 / 5923
Idea for a new measure: change in spot price as a percent of the change in December future price 4 years out. The significance is that it may reflect the degree of noise vs. signal of the latest price change...
Using January first observations of nearby and distant contracts (the distant contract is 3 years forward in 1992, moving up to 5 years forward by 1997 when the contracts starting trading that far forward) from 1/1/1992 through 1/1/2006, the nearby changes an average of 40.2% per year while the distant changes an average of 18.9% per year.
To a large extent, the 18.9% is driven by the recent run up in distant prices that I mentioned above. Using only data through 1/1/2003, the average annual percnetage changes in price are 44.4% for nearby and 8.5% for distant.
For example at the time of Katrina the near month price was 70 USD and Dec 2008 was at 64. Today the near month price is 63.9 USD but Dec 2008 is at 66.3 (it was above 68 in early March).
My conclusion is that in late August there was a stronger perception of shortage in the short time frame than there is now but now the longer term supply is percieved to be more of a problem. Sounds like peak oil is growing in acceptance (or the new of Burgan and Cantarell)...
For natural gas the picture points even more to PO gaining acceptance...
You really need to wait until short term prices have settled down for a week or two before you can say much about the relationship with long term prices. We are in that situation now - prices have been in a channel from 61 to 65 for a month, without much trend - so now we see the classical shape of forward contract prices as shown in the first figure above. But you can't compare with post-Katrina prices, because short-term prices had just shot upward so of course they were above long-term futures.
My main point is NOT the contango, its the gradual and steady increase in the long term futures...
So, today the market is more worried about long term supply than in August and September. That's my point.
On another note, I have such trouble understanding why the market reacts so negatively to the growth in the so called oil stocks reported weekly.
In a scenario where you (as a commercial user of oil) see increasing prices and perhaps even physical shortages you wouldn't mind growing stocks would you? I think the growing stocks are to be expected in rich countries like yours.
http://quotes.ino.com/chart/?s=NYMEX_CL.Z08&v=d12
It has not been as volatile as short-term futures but it has had its ups and downs. Looking at this chart, one could not be surprised by a drop back to 60 or even 55 later this year.
As far as the question of the market's negative reaction to increasing oil stocks (inventories), I'm not sure what you are referring to. Normally with an increase in inventories you'd expect oil prices to drop, but that hasn't happened. And the overall stock market is doing very well these past few weeks. The only negative reaction I have heard is from bears (with short positions in the market) upset that oil prices are not falling. Their disappointment is understandable but there are clearly good reasons for concern about oil supplies through 2006, even beyond the threat of Peak Oil.
Cherenkov? You want to go and hang with that lot? He'll just eat you - and burn your boots, no matter what the commie bastard says.
It looks suspiciously smooth, doesn't it? I wonder if this source is accurately reporting the prices or is interpolating and smoothing them somehow. Anyway this is probably more comparable to the first graph in the blog posting.
BTW where did you get that graph? I read an article a few weeks ago about oil future prices that I think was from the Bank of England. Can't find it now. But it included a graph like this as well as other graphs showing how different commodities tended to look on their forward prices. It was interesting to see that the shapes were quite variable for the different kinds of commodities. Gold goes upsteadily, some of the others are pretty flat, and oil has this up-then-down structure. If you have a link to that original article you should post it, it was good.
Different commodities have different forward curve characteristics because of they have have different storage, production, and consumption characteristics. This is the point I was trying to get at above when I was rambling on about grains above...
The forward market for oil
As you've alluded to, the study discusses that the 'normal' state of the oil futures market has been backwardation, not contango. For example, whereas gold and silver have been in contango 98%-100% of the time over the past decade, Brent Crude has been in backwardation roughly 75% of the time, and Nymex Light Sweet almost 70%.
From the study:
"One possible reason for a persistently downward sloping oil futures curve would be uncertainty about future demand and supply. Given that one has the choice to delay extraction, in the hope of benefiting from a higher price later, the decision to produce oil when there is uncertainty takes on the characteristic of exercising a financial option -- there is an option value in holding reserves below ground rather than 'disinvesting'. Because the total return of holding oil reserves in the ground includes this option value, the current price must be higher than the price predicted by Hotelling's theory to make a producer indifferent between extracting oil and leaving it in the ground. And if the uncertainty is large enough this can result in backwardation."
It's not clear to me whether this shape should be called contango or backwardation. For the most part the curve is down sloping so could be said to be in backwardation. OTOH most of the curve is above current prices so could be called contango.
Chart C on the next page is also quite interesting; it contrasts the futures-market prediction of $60+ with "expert" predictions that show the price falling about $5 per year, down to below $45 by 2010. They come up with some story about how the market could be overestimating prices, but I didn't find it very convincing.
I'm sure most people here will agree with me (this time at least!) that the market at $65 is more likely to be accurate than the experts' $45.
I don't think the market expects falling production just yet. A number of smaller disruptions are in the price, but not permanently falling production. That realization/fact will shake up the markets greatly, changing prices in the present. The basic curve shown above will however remain for futures...
As another poster mentioned, the theoretical maximum difference under contango, between future and present oil prices, represents storage cost plus time-value of money for holding oil during the storage period. Whenever expected future prices begin to exceed present prices by more than this amount, they motivate purchase and storage of spot oil.
Of course, for a producer, one way to "store" oil is simply not to pump it out of the ground in the first place. Thus an expectation of future prices climbing at a rate that exceeds (storage + time-value of $$) raises current prices by reducing current supply.
This suggests that high current inventory levels represent the market's expectation of more expensive oil in the future.
Paul Krugman examined this concept of high prices reducing supply in this article several years ago. Matt Simmons indirectly affirmed this in response to a question I asked at a recent presentation he gave, replying that while he didn't expect producers to "gouge", he did expect them to better shepherd their resources, and gave the example of Kuwait's recent announcement it was reducing production in order to sustain output for longer.
One thing that I think it is important to point out is the herd mentality of the market and I think futures prices represent something like a new consensus among speculators much like that which obtained between 1986 to about 2002 or so. Future contracts stayed in the $18 to $21 range that whole time. I believe - which was the point of my post - that this "consensus" is stabilizing but at a much higher price.
best, Dave
1)good post and good observation
2)contango isnt necessarily the default structure for futures markets - alot depends on the storability of the product - anecdotal evidence suggests there just isnt the storage capacity for crude oil right now, and the only people who WOULD store it would also be the people who could also refine it - for an airline company what good would it be to store crude, before it was processed into jet fuel? Other products, like gasoline, are hardly storable at all - they go bad after 5-6 months unless they are treated. Gold, on the other hand, is infinitely storable, and the 'carrying cost' is largely the interest rate.
3)During hurricane Katrina I had oil positions on in many contracts - Id have to do some digging to get exact price histories but front month at the time was over $71 while Dec 2009 was $60. Front month and 2009 ARE in backwardation ($63 vs $65). This has happened only in the past couple of weeks. I think youre on to something, but as a previous poster suggested, its one piece of a complicated puzzle.
4)Look at the futures strip for NG - clearly we have tumbled from over $15 for front month down to $7. However, backdated contracts are only $1 off their highs. AND, the entire structure gradually declines until 2011, suggesting that an increase in US LNG is priced in market. Another trend since October is the difference between summer peaks and winter peaks - it has gotten alot narrower, possibly due to expectations of global warmings impact on future demand for NG.
Does it always have this shape? Up and then down? That doesn't seem possible because it would allow a risk-free profit-making spread. Simply go short the month at the peak and go long the month from one year later. This amounts to betting on the difference between the two months, that it will decrease or even reverse.
As the peak moves out from the present day, the near term month will fall and the late term month will rise. It's like a wave moving across the sea. Seems like a guaranteed profit. Since the markets won't normally leave money lying on the table like that, something must be wrong with this strategy.
It could be that it usually works but not always. I've seen a lot of spread strategies that are like that. Usually gasoline and oil move together. Likewise with oil and NG. Usually spring and summer wheat move a certain way relative to each other. Betting on these usual relationships "usually" works.
Except when it doesn't. Sometimes something funny happens and the usual relationships break and stay broken for quite a while. Then all those people happily making regular small sums from their spreads, year after year, lose everything. I wonder if this might be something like that.
I think you nailed it in your last paragraph.
In addition to the astute comments of you and others posted above, I would like to mention the huge wild card of expectations of future inflation.
By implication, it seems to me the futures contracts are assuming inflation over the next several years will average about 3%--what one would expect on the basis of adaptive expectations.
However, a couple of things could happen
1. (very unlikely in my opinion) recession, depression, global deflation or
2. an abrupt upward shift in expectations of future price-level increases when expectations change from adaptive to rational. They can do so in a matter of hours. For example, a crash of the dollar against other currencies accompanied by no action on the part of the Fed to shore up the dollar would trigger a stampede such as we have not seen for many a dollar. (And if we were going into or already in a recession, do you think the Fed would raise interest rates? No way.)
James Hamilton describes the recent record of TIPS, Treasury Inflation Protected Securities, at:
http://www.econbrowser.com/archives/2006/02/gold_and_inflat.html
The difference between TIPS yields and regular bond yields produces a prediction of inflation rates over the next 10 years. For a couple of years now it has held steady at 2.5% inflation.
The famous inversion of the yield curve also points towards market expectations of low interest rates, which would tend to be inconsistent with high inflation over the next ten years.
Another place investors could look would be forward gold prices on the futures market. Gold is rising about $30/year for the next several years, corresponding to about a 5% yearly increase. That should put an upper limit on expected inflation.
Of course it is always possible that the markets are wrong and that various bad events such as you describe could lead to hyperinflation or other monetary disasters. The question is what are the chances of these kinds of changes. At this point it doesn't appear that investors are factoring these possibilities into their expectations.
Oil futures really are their own animal - gold is much more precise mathematically.
My general expectation is that by the time Peak Oil becomes well understood and accepted, as indicated by a front page on Time and Newsweek simultaneously (and with a concomitant rise in the price of crude to over $100 and with vast speculation by the public in oil stocks) there will be a huge recession and there will be the last significant drop in crude prices to ever take place - just enough to really wipe out a lot of the public. This could take place in 2008 or 2009. To cement the irony, that may be the exact time when Peak Oil actually occurs.
Remember, the market isnt designed to predict scarcity - all it cares about is how much is available in THAT month.
By the way, I just downloaded the last 6 EIA Annual Energy Outlooks since 1999 - they have been wrong (and quite wrong) 6 years in a row regarding prices. Also, not a single major wall st firm has predicted higher prices a year out in the past 6 years. (2006 is the first)
My forecast - front month oil will hit $90 by this summer then be back to $40-$50 next year due to severe demand drop. Next time up in 2008-2009 it hits $200 then drops to $100 after national rationing plan. 2015 its over $500. Thats really not that far away. Of course, why would my forecast be better than our government energy experts or wall st oil analysts? (hint - its free)
I don't get that at all, why would it be suggestive of supply insufficincy? Supply < demand should raise prices.
All I can come up with is that "suggestive of supply insufficiency" should read "suggestive of transient supply insufficiency in the spot market."
So it seems to me that backwardization is a signal that market particpants consider the spot market prices as out of wack with their long term expectations and that current shortages are an exceptional rather and a new order.
If the futures market is efficiently calling the pricing 5 years in advance, it totally missed the sharp turn northward '02 to '05. The futures contracts seem to be reacting more to current market pricing than to anything else. In fact, the "futures" look more like a lagging indicator here. I don't know much about futures markets. Do futures contracts do any better for copper, soy beans, or any other commodity?
when you consider this point, you will see there are not a lot of people who want to supply (sell) 6yr contracts at even $60. one possible entity that might sell some contracts is a hedge fund who is long an unhedged producer. if the fund thinks the producer is discounting $45 CL (i.e., their stock is priced as if the long-term price of crude is $45) then the fund might hedge the CL exposure by selling $60 longdated CL. in fact just this type of hedge was discussed in the latest issue of Barron's. but i don't think that is a very common trade, even among hedge funds.
so, getting back to the original point, the price action in the longdated contracts doesn't necessarily mean the "all-knowing" market is baking in Peak Oil. rather, the main "natural" forward sellers--the producers--have stopped selling in size. thus the supply of longdated contracts has decreased relative to their demand at lower price points.
Also, large hedgers' long open interest (across all NYMEX crude oil contracts - the publicly available data do not break open int. down by delivery month) has been increasing in recent years. The following chart is assembled from the commitments of traders data available at cftc.gov. For large hedgers to have decreased their long positions in the distant contracts, they would have needed to dramatically increased their long positions in the nearby contracts in order to make the overall average go up significantly. This is possible, but it is not the most intuitive scenario.
Sorry, I haven't updated these data since I first looked at all of this last summer...
huge hedging losses were very common over the last several years. i don't know of any systematic tallying of the hedges that have come off, but anecdotally i know many cos whose calls i listened to were actively reducing their hedging--not just in CL, but in other products as well. as an example, Valero lost half a bil last year on hedges that they are not putting on this year. a number of cos will have this type of incremental earnings boost due to hedges coming off.
maybe Coxe did some systematic tally. in any case, it is the explanation which makes the most sense to me, based on the limited info out there.
given the current high forward prices, we may be nearing a point where private equity firms would do LBOs of some of the cheaper public cos and take them private. then they would hedge out their production to the extent possible. if enough of this happened, we might see more pressure on the longdated contracts.
also keep in mind that producers are typically going to do their longdated hedges OTC, but intermediaries (their counterparties who buy their forward production) would then be in a position to sell contracts onto the NYMEX.
When a hurricane enters the Gulf (GOMEX), how quickly will production shut down?
Do they wait till it's within a certain 100 mile range?
How long does it take to "lock down"?
Once the hurricane threat has passed, and no damage has been assessed, how long does it take to restart production?
Throw in political unrest worldwide combined with hurricanes in the gulf. (regardless of category size) I think we'll see gasoline shoot well over $3.50, and oil prices shoot up to upper 70's. I am not an expert, but thats the way i see it happening. Am i the only pessimist?