| HC and MMS: Remaining Shut-in Production NOT Likely to Be Rebuilt... | The Oil Drum | Friday open thread |
Will Unconventional Natural Gas Save Us?
Posted by Dave Cohen on March 10, 2006 - 1:41pm
I hope you'll bear with me here. This is one of those really long posts I do from time to time to try to understand an important issue I didn't know much about. I even try here and there to emulate HO's "techie talk" tradition here on TOD though with, I'm sure, limited success.
- Liquified Natural Gas (LNG)
- The proposed Alaska pipeline
- Unconventional Gas in the Lower 48
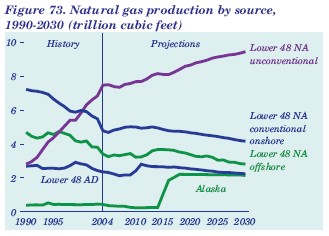
EIA domestic US natural gas supply -- Figure 1
Here's a relevant quote from the National Energy Technology Laboratory (NETL)
Despite seemingly large resources, we are becoming increasingly dependent on imports (imports' share of gas supply has tripled since 1985, and imports' share of oil supply has jumped to almost 60% from 27% in 1985). More importantly, the domestic industry has been unable to increase production despite strong price incentives and increased drilling.and also this quote from the EIA AEO 2006 overview.The root cause of this difficulty is the progressive change and difficulty in producing the remaining resource base. Industry has picked much of the Nation's "low-hanging fruit," and remaining resources are increasingly found both in deeper, more remote, more complex reservoirs (high cost and high risk), or in shallow, drilling-intensive, low-productivity reservoirs....
Lower 48 production of unconventional natural gas is expected to be a major contributor to growth in U.S. natural gas supplies. Unconventional natural gas production is projected to account for 45 percent of domestic U.S. natural gas production in 2030, as compared with the AEO2005 reference case projection of 39 percent in 2025. In AEO2006, however, unconventional natural gas production is lower in the mid-term (between 2006 and 2020) than was projected in AEO2005. The lower levels of production in AEO2006 before 2021 reflect a decline in overall natural gas consumption in response to higher prices. Starting in 2021, the projected levels of unconventional natural gas production in the AEO2006 reference case are higher than those in AEO2005, reaching 9.5 trillion cubic feet in 2030.Note from Figure 1 that conventional gas production from shallow-depth (onshore or off), permeable and porous deposits are depleting rapidly and will play less and less a part of the US supply no matter how many wells are drilled. You can also see that offshore production from the Gulf of Mexico will peak around 2012 or so and decline thereafter. Lower 48 AD in Figure 1 refers to "production of associated-dissolved (AD) natural gas from lower 48 crude oil reserves" and declines from 2.4 trillion cubic feet in 2004 to 2.3 trillion cubic feet in 2030 according the EIA. So, there are two rising trends in this graph: 1) Alaskan supply (assuming the pipeline) after about 2014 and 2) unconventional gas recovery over time. Of course, LNG imports are not shown here and have been adequately covered in other TOD posts.
This story is attempts to explain what unconventional natural gas is and how much its production will affect future US supply. This seems appropriate in so far as HO has mentioned the Barnett Shale Gas project lately. As Figure 1 indicates, expectations are high. What can we expect from production of domestic natural gas from unconventional sources to meet increasing US demand over the next 20 years?
First, let's list what the unconventional natural gas sources are.
- Coal Bed Methane
- Deep Gas (onshore or offshore in the GOM)
- Tight Gas Sands
- Shale Gas (from Devonian or Carboniferous sediments)
- Geopressurized Zones
- Methane Hydrates
- Coal gasification to make syngas (added to this list)
So what exactly is unconventional gas? A precise answer to that question is hard to find. What was unconventional yesterday, may through some technological advance, or ingenious new process, become conventional tomorrow. In the broadest sense, unconventional natural gas is gas that is more difficult, and less economically sound, to extract, usually because the technology to reach it has not been developed fully, or is too expensive.....Unconventional gas already plays an ever-expanding role in US production as this graphic from the World Oil (January 2006) publication What's New in Production makes clear.Therefore, what is really considered unconventional natural gas changes over time, and from deposit to deposit. The economics of extraction play a role in determining whether or not a particular deposit may be unconventional, or simply to costly to extract....

Unconventional natural gas production -- Figure 2
As you can see, there is no mention of coal gasification, which has been discussed on some recent threads like Coal gasification in National Geographic. I had added this arbitrarily to the list just emphasize that as far as I can see, production of syngas does not figure much in the future natural gas supply equation at least as the EIA is concerned. This may change, however. In addition, though the NETL has research program for methane hydrates, this source will not be a part of future US supply. My general analogy in this case is that the other unconventional natural gas sources are akin to the Canadian tar sands--they are in production and that production will increase. Coal gasification is a bit further along in the prototype stage but will not substantially add to future US supply. Production of natural gas from methane hydrates or geopressurized geothermal aquifers reside on the pie-in-the-sky part of the spectrum. Both of these sources seem to have just about the same status as oil production from kerogen embedded in marl rock, a source that is also known as oil shales. I doubt there is any prospect of increasing the North American natural gas supply from either source by 2025.
This post will focus on the unconventional natural gas resources referred to as Coal Bed Methane, Shale Gas, Tight Gas and Deep Gas. Below I provide a description of what the issues and current status are for each unconventional sources considered here. But before going into some detail, it is worth noting that the Rocky Mountain region does and will continue to play a pivotal role in future unconventional gas production as this quote from Tight Gas Technologies for the Rocky Mountains indicates. Read this pdf document from NETL's GasTIPs for the details.
As new discoveries from conventional supplies decline, future supplies of natural gas will increasingly have to come from unconventional reservoirs - and several Rocky Mountain basins (Greater Green River, Piceance, Wind River, and Uinta) contain significant volumes of such resources (tight gas sands and coal seams in particular).
Coal Bed Methane
NETL provides an excellent summary of the nature and production of Coal Bed Methane (CBM).Once a nuisance and mine safety hazard [a story from HO], coalbed natural gas (CBNG)—also referred to as coalbed methane—has become a valuable part of our Nation’s energy portfolio. CBNG production has increased during the last 15 years and now accounts for about a twelfth of U.S. natural gas production. As America’s natural gas demand grows substantially over the next two decades, CBNG will become increasingly important for ensuring adequate and secure natural gas supplies for the United States.They also provide a nice map of where this resource can be found.CBNG is the gas found in coal deposits. It consists mostly of methane but may also contain trace amounts of carbon dioxide and/or nitrogen. Most coalbeds are permeated with methane, and a cubic foot of coal can contain six or seven times the volume of natural gas that exists in a cubic foot of a conventional sandstone reservoir.

Sources of Coal Bed Methane -- Figure 3
Note that of those 700 tcf, only 100 Tcf are considered to be economically recoverable. But estimates vary a bit. This nice presentation, Overview of Unconventional Natural Gas and its Impact on Supply (pdf) estimates that 300 tcf are technically recoverable and that 110 tcf can be produced by 2020.
So, this would all appear to be good news. But in reality, production of Coal Bed Methane is fraught with problems. Here, we'll concentrate on production in Wyoming's Powder River Basin because these problems are evident there. A remarkable story from Forbes, a partial reprint from Oxford Analytica (pay for play) tells a remarkable story about CBM production and outlines the associated problems. Here are brief descriptions of those problems.
- Well Spacing --
For example, in the Powder River Basin of Wyoming, an area of approximately 9.1 million acres of formerly pristine rangeland, more than 15,000 wells have been drilled. Servicing these wells requires a network of 32,000 miles of roads and 73,000 miles of pipelines and power lines.
Imagine this. - Property rights -- it's simple really. Somebody lives there (they have the surface rights) but somebody else owns the mineral rights. And they have pretty much free reign to do whatever they want, including trashing the environment which residents cherish. Oh, you know that 10 acres out back you loved so much? Now there's a pipeline and a maintenance road running right through it...
- Government disputes -- "... the lion's share of the revenues generated by CBM exploitation will accrue to the federal and state level, while the direct impacts of development fall within local government jurisdiction". You get the idea.
- Water -- Last but not least. "The volume of water produced by CBM production is staggering. For example, in the Wyoming Powder River Basin alone, over 1.5 billion gallons of water is produced daily". Imagine this, too.

Coal Bed Methane Production & Water -- Figure 4
From the NETL source.
Vertical and horizontal wells, including multi-laterals, are used to develop CBNG resources. For the most part, the quality of a seam’s cleat system (high-conductivity flow paths) will dictate the type of well completion and stimulation employed. In high-permeability settings, flow enhancement may not be required. In other situations, hydraulic fracturing and cavitation stimulations are used.And where's all this water coming from? They put some in--and we can ask where do they get that--and they produce a lot more coming out. From Coalbed Methane--An Untapped Energy Resource and an Environmental Concern.Hydraulic fracturing is a process in which fluids, primarily water, are pumped at high pressure, creating a crack through which natural gas can flow easily into a well. The cavitation method involves enlarging the original wellbore and linking the wellbore with the cleat system within one or more coal seams. In all cases, water initially must be pumped out of the coals (dewatering) in order to reduce the reservoir pressure and allow the methane to desorb.
Most gas in coal is stored on the internal surfaces of organic matter. Because of its large internal surface area, coal stores 6 to 7 times more gas than the equivalent rock volume of a conventional gas reservoir. Gas content generally increases with coal rank, with depth of burial of the coalbed, and with reservoir pressure. Fractures, or cleats, that permeate coalbeds are usually filled with water; the deeper the coalbed, the less water is present, but the more saline it becomes. In order for gas to be released from the coal, its partial pressure must be reduced, and this is accomplished by removing water from the coalbed. Large amounts of water, sometimes saline, are produced from coalbed methane wells, especially in the early stages of production. While economic quantities of methane can be produced, water disposal options that are environmentally acceptable and yet economically feasible, are a concern. Water may be discharged on the surface if it is relatively fresh, but often it is injected into rock at a depth where the quality of the injected water is less than that of the host rock. Another alternative, not yet attempted, is to evaporate the water and collect the potentially saleable solid residues; this scheme might be feasible in regions having high evaporation rates.To sum up, they inject fresh water for fracturing and then must pump out (desorb) all the now to some degree saline water that they injected and that was down there under the ground in the fractures (cleats). This leaves them with a considerable "water management" problem. By the way, high evaporation rates are not a problem in the Powder River Basin. Since there is other ground to cover, I'll leave it right there. Nevertheless, we see that with Coal Bed Methane production, there is no free lunch.
Shale Natural Gas
The big news has been the new "play" in the Barnett Shale. This is a case where it is fuzzy as to whether this should now be considered an "unconventional" source. Recent technological breakthroughs have made gas production economical due to water fracturing of the tight sedimentary shale rock at Barnett and horizontal drilling--otherwise, some people in Fort Worth would end up with natural gas wells in their backyards or living rooms. The way things are going, that may still happen since Fort Worth basically sits directly above the Barnett Shale gas deposits. Here's the story.And it's not enough just to induce fractures to allow the gas to flow, as Barnett drilling pioneer Mitchell Energy discovered after years of applying gel frac treatments to the rock.Generally, there is great excitement (from the AAPG, 2001) about breakthroughs in shale gas production which is distributed in the US as shown in Figure 3.The gas did flow, but the pricey gel applications resulted in only so-so economics....
The play took off with water fracing, but it's horizontal drilling that has propelled it into a true "boom," noted Mitchell alum and consulting geologist Dan Steward at Republic Energy, which was one of the play's earliest operators.
"Horizontals have just swept through this thing," AAPG member Steward said. "As of 11-1-05, there were 2,135 permits issued for horizontals in the Barnett, with about 5 percent of these being duplicates because of things like changed locations.
Mitchell engineers cracked the economic barrier in the late 1990s when they ascertained water fracs performed much the same as the gel fracs while dramatically lowering stimulation costs -- and a play was born....
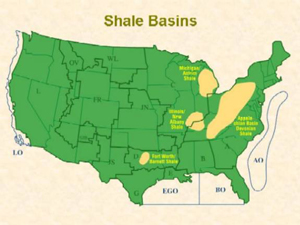
Lower 48 Distribution of Shale Gas - Figure 5
Generally speaking,
"Most shales have very low matrix permeabilities and require the presence of extensive natural fracture systems to sustain commercial gas production rates."Finally, what is the current production and recoverable reserves estimates? As of 1999, yearly production was 380 billion cubic feet (bcf). Reserves wereIn shale reservoirs, natural gas is stored three ways:
- As free gas within the rock pores.
- As adsorbed gas on organic material.
- As free gas within the system of natural fractures
The shale gas resource base in the lower 48 states is significant. According to GTI, gas-in-place resource estimates for the five main gas shale plays total 581 trillion cubic feet of gas, and recoverable resource estimates range from 31 to 76 trillion cubic feet [tcf].As Figure 2 shows, production is increasing and looks to be a about 1.0 tcf now. The Barnett play may substantially increase that output in the next decade although that remains to be seen. Now that we've beaten the shale gas horse to death, let's move on in a determined fashion to...These figures are considered conservative since estimates for the Barnett Shale in the Fort Worth Basin and the Lewis Shale are not available.
Tight Natural Gas
From our overview source (link cited at the top), we learn that a tight gas (aka low perm sandstone) accumlation is... gas that is stuck in a very tight formation underground, trapped in unusually impermeable, hard rock, or in a sandstone or limestone formation that is unusually impermeable and non-porous (tight sand)....Here's what tight really means.


A normal reservoir (left) and tight reservoir (right) - Figure 6
However, as Figure 2 shows, production from tight sands is currently higher than from any other unconventional gas source. From NETL, more is expected.
Natural gas production from tight, low permeability sandstones (generally rocks with less than 1/10th of a millidarcy permeability), is expected to contribute significantly to the U.S. future gas supply. The DOE, USGS, and other organizations have completed resource assessments of U.S. basins with tight gas accumulations indicating that a vast (~6000 Tcf) in-place natural gas resource exists. However, there is still much that is not currently understood about the origin and development of these accumulations....Wow. 6000 tcf is a lot of gas. Where is it?

Lower 48 Tight Gas Basins - Figure 7
So, again we ask what are the current production numbers or projections and what are the recoverable reserves? From this valuable document (which I refer to in the conclusion), we see where the current tight gas active gas plays are.
- The Bossier/Cotton Valley/Vernon fields in East Texas and Northern Louisiana. There are an estimated 6 tcf of recoverable reserves with an anticipated increase of 600-850 million cubic feet (mcf) per day.
- In the Rocky Mountain region, the Green River Basin, Piceance Basin and the Unita Basin comprise about 32 tcf of recoverable reserves with about another 0.9 mcf/day increase in production by 2010.
- The West Texas Canyon Sands with an undetermined recoverable reserves figure but an expected increase of 200 mcf/day by 2010.
- The Clinton-Medina development in Ohio with recoverable reserves of about 10 tcf and no estimate for increased future production.
To produce gas from tight sandstones, you must first find it. There are two major problems. First, you must locate tight gas zones with high natural fracture densities find via seismic & geophysical technologies. And second, you must avoid zones containing lots of water. Avoiding water production is an important consideration for producing this tight gas. From our Rocky Mountain source cited above, which sums up the technical challenges, we learn that
The presence of mobile water and high water production rates continue to plague certain producing areas in the Rocky Mountains. For example, Union Pacific Resources (now Anadarko Petroleum Corporation) drilled a 2,300 foot lateral section, with over 1,600 feet in the Frontier Formation, at 15,000 feet in the GGRB near Table Rock Field (Rock Island 4H well). The well has produced 6.4 Bcf of gas in just under 3 years and is currently making nearly 4 million cubic feet per day, supporting the potential benefits of drilling horizontal wells to intersect natural fractures. However, the well has produced a significant amount of water, at times over 1,000 barrels per day, and the high rate of water production has affected gas recovery. Portions of the Mesaverde Formation in the Wamsutter area of the GGRB are also known to produce water, and in the Wind River Basin, significant water problems in hot plays like Cave Culch are beginning to make operators apprehensive....So, production of tight gas from sandstones is not without its own difficulties. And now on to ...
Deep Gas
As Figure 2 above indicates, Deep Gas, which is defined as deposits at depths of 15 thousand feet or more, is already a major contributor of unconventional gas production. As the NETL overview indicates (link cited above)The Deep Gas program targets resources that face tremendous technical and cost challenges related to an inability to image any but the largest deep prospects. Also, these deep reservoirs maintain high temperatures and pressures that exceed the capability of modern drilling and evaluation technologies. Deep reservoirs currently account for about 7% of domestic gas production but only about 1% of the Nation's gas wells drilled. Vast regions of the Nation remain virtually unexplored for deep gas.This somewhat dated USGS document Summary of Deep Oil and Gas Wells in the United States Through 1998 lists producing deep gas plays at that time. I'm sure more have come onstream since. There are the usual two impediments to producing natural gas at great depths that involve such high temperature [HP] and high pressure [HP] conditions. First, the technology required to extract the gas at temperatures often greater than 200° C is a challenge. At those temperatures and pressures, the drilling equipment has a short time to obsolescence and must be switched out often. Naturally, this increases the costs of the extraction. Solving these problems present the biggest challenge for producing deep natural gas. Progess on these technological challenges are reviewed in the World Oil article cited above.
Taking a "techie talk" clue from HO, it is not simply a matter of sticking a drill bit in the ground and extracting the deep gas. There is a complex bottomhole assembly (BHA) attached to the drillstring. One part of the overall objective, as described by NETL is to "improve the data transmission rates possible for downhole to surface communication". This information is critical for guiding the extraction process. BHA includes both measurement while drilling (MWD) and logging while drilling (LWD). These operations also depend critically on the battery that powers the BHA.
It is these instrumented [BHA] tools that help the driller cut to the target in optimal time and identify drilling situations before they become problems. The tools are a great help, but come with certain tradeoffs.Finally, where does current US E&P expect to extract more deep gas? You guessed it--the Gulf of Mexico, a region which is somewhat prone to hurricanes as events last fall showed. This Mineral Management Services (MMS) document The Promise of Deep Gas in the Gulf of Mexico tells you what you need to know.Most downhole tools operate on battery power, mainly lithium-ion (LI). For industry's use, LI cells have the densest energy capacity of the main battery types: lead-acid, nickel-cadmium and nickel-metal hydride. Because LI energy density is twice that of NiCad cells, a single 3.6-volt cell can be constructed, instead of wiring three 1.2-volt cells in series. A single battery makes for easier tool construction, as well as improving reliability.... For very deep wells, the instrumented BHA is critical, but battery life and higher temperatures constrain their use and force multiple trips to change out tools or batteries well ahead of bit replacement. Much research is underway to overcome these limits.
So as far as deep natural gas production goes, there are technical, cost and weather challenges that constrain its future production. It is entirely unclear whether the growth curve shown in Figure 2 can be met going forward.
Conclusions
Compare this figure from the EIA AEO 2006 on natural gas imports with Figure 1 on expected supplies from unconventional sources.
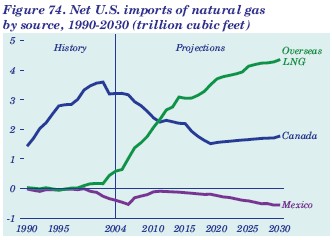
Natural Gas Imports To 2030 - Figure 8
As you can see, all natural gas imports are expected to contribute about 5.5 tcf by 2030 whereas unconventional gas production is just a little south of 10 tcf by that date. This gives you a relative idea of the comparative importance of the two in the long range projection for US supply. As you can see, our reliance on Canadian imports goes into severe decline starting about now in 2006. As an interesting footnote, consider this informative quote from the Forbes article cited above.
In Canada, which currently supplies most U.S. gas imports, gas production reached 16.71 billion cubic feet per day (bcf/d) in 2004. However, these figures are expected to level off, or even shrink. Conventional production at current levels will not be able to supply increasing demand in North America...I thought you TOD readers would enjoy that one.Canadian demand (7.7 bcf/d in 2004) is expected to increase substantially, with the oil sands industry alone consuming 1 bcf/d by year-end....
To finally conclude, unconventional natural gas production is the key to adequate future US supply and imports, though important in the near term, will not do the job. Gas from these sources is technically harder to produce and will no doubt cost more. Prices will go up in any scenario I can envision. And, we get the added benefit that we are trashing a large part of the environment of public lands as we develop these unconventional natural gas resources. But, as Jim Kuntsler signs his e-mails, It's All Good.
Contact
- Content: editors at theoildrum dot com
- Tech support: support at theoildrum dot com
License

This work is licensed under a Creative Commons Attribution-Share Alike 3.0 United States License.
Great post.
Correct me if I am wrong, but it is my understanding that big oil companies are bringing in LNG from overseas, as opposed from the Alaska proposed NG pipeline, for a simple reason. Money.
They figure it is cheaper to bring in from Indonesia LNG to Long Beach or Ventura, than to build the pipeline and pay Alaska and Canada the royalties they have demanded. In turn, it is held in reserve so to speak for a decade.
Funny thing about this, is the ex-Governor Jerry Brown & family got nailed on LNG from Indonesia 25 years ago.
1st Law--Energy can be changed from one form to another, but it cannot be created or destroyed. The total amount of energy in the universe remains constant, merely changing from one form to another.
2nd Law--In all energy exchanges, if no energy enters or leaves the system, the potential energy of the state will always be less than that of the initial state. This is also known as the law of entropy.
3rd Law--It is impossible to cool a body to absolute zero by any finite process. This is actually more of a postulate than a law. In any case, it has little application to our discussion and is presented here merely for thoroughness.
nothing more.
I was a little surprised to see you say:
"Coal gasification is a bit further along in the prototype stage but will not substantially add to future US supply." With large US coal deposits it's hard for me to believe they won't make use of them big-time at some point, both for gas and liquids. Are you saying they won't be able to, or what?
And what we will drink when the water is gone? :) Hm, I retract the smiley.
I had a question. I read that Nigeria plans to keep its exports at the same level dispite the disruptions. I guess inventories are building here but going down there. Does anyone know how long can they do this?
The West African Gas Pipeline project will distribute Nigerian gas to about 4 countries to the west. It is currently starting construction.
Often what is planned does not include disruptions of any kind, so it remains to be seen if the plan can be completed within projections, given the possibility of major disruptions as are now apparently in progress.
Global warming.
Damned if you do, damned if you don't. My guess is we will probably proceed with the our destruction of the environment in order to fuel our vehicles. We are pretty dumb as a species, and our greed is well known.
Why is it that no one can see the box we are in? Without fossil fuels, the economy collapses and people starve, but the environment eventually recovers. With fossil fuels, including gas and coal, we destroy the environment and the economy tanks and people starve. In one of the situations, at least the environment is saved.
Apparently we want to be able to drive to our own funeral. So be it. Let's start burning stuff as quickly as possible. Let's not linger.
"In one of the situations, at least the environment is saved."
Yes! Do we have to take everything down with us. Give other life a chance
http://www.eia.doe.gov/oiaf/archive/aeo00/images/figure_90.jpghttp://
http://www.eia.doe.gov/oiaf/archive/aeo00/images/figure_90.jpg
What this clearly shows is that the EIA is whistling a different tune now. In the years since they published this particular bit of fiction, they have acknowledged the rapid declines in conventional natural gas production and are now pinning their hopes on the supplies I describe in this post. Which is why I wrote it.
It's interesting to read about the Barnett Shale. I think the mine I work at supplies the frac sand for those projects. It's a small world.
Sounds very unconventional to me.
It's all about the technology!
Any techies out there know how much it would cost to drill that far through basalt?
There will be no protection of the environment. Everyone here is depressed.
We can, of course, choose to continue the way we're are going, more or less regardless of the "facts" we think we see looming on the horizon. Unfortunately, I think this stategy will lead us towards the disintegration/breakdown of our civilization and environmental disaster. Choose which one is worst, or maybe we'll get both!
Though I'm not a "Marxist" I do believe in the importance of the underlying economic structures and mechanisms on which our society is built, and that "economics" really does affect our politics, culture and international relations. So, I think we will begin to see the dramatic consequences of Peak Oil on our politics way before we see the effects on our economies. Are we in fact seeing it already? Are we exchanging blood for oil now? This is, of course, shorthand for very complex politco/economic relationships.
To sum up then, as I see it, we can either voluntarily change our culture through planning and organisation, or we can wait until "Fate" and "Chaos" do it for us. Of course, if we choose this path our ability to "control" the inevitable changes will be negligible.
Note that: "Will Unconventional Gas Save Us?" is the wrong question. Obviously, no source of energy, by itself, can "save" us. For that we need radical changes in culture and social structure.
Those are coming.
IMO, a better question is: "To what extent can Unconventional Gas Ease the Transition away from Cheap Oil?" My short answer is that it is one more "silver BB" that can help.
It is mistake to focus only on technological solutions. It is also a mistake to reject helpful new technologies, such as deep drilling for natural gas or ethanol from switchgrass.
Conservation is coming, but not before gasoline sells for $5 to $10 per gallon and natural gas and coal prices have gone up comparably.
Demand is exceeding supply in North America. Conventional gas production is in rapid decline. LNG import capacity will be slow to ramp up. Unconventional gas production, as I hope I made clear, has its own difficulties and is an environmental disaster.
Only the weather saved us from actual shortages this winter.
A point I should emphasize is the amazing lengths we will go to in order to feed the beast and get our fix. Will unconventional gas production save us? Of course not. We need to change the way we live and powerdown.
Already in June 2004, AWEA made a case for wind energy as a solution to address the natural gas shortage problem. By the end of 2005, the total wind generating capacity in the US reached 9149 MW, 35 % more then a year before. AWEA estimates that this capacity will replace over 0.5 Bcf/day in 2006. This is to be compared with 13 Bcf/day, currently being used for electricity generation in the US. And by the way, current wind energy capacity in the US is only a fraction of the total potential.
The wind energy sector is growing immensely these days. Last year, 11679 MW of new wind turbines were installed worldwide , representing a 43 % increase on last year additions. To give an example, GE last year saw its wind turbine business growing by 200 % in comparison with 2004, or 400 % in comparison with 2002, when they first entered into the wind business.
By comparison, in Europe already more than 40000 MW of wind power is installed, with a wind resource which is far less then available in the US. About 2.8 % of electricity in Europe is currently produced by wind energy, with countries like Denmark (20 %), Spain (8 %) and Germany (6 %) producing even more. Forecasts see 180 GW of wind, generating 14 % of total electricity in Europe by 2020.
Considering the economics of wind, I would like to refer to this excellent overview by Windpower monthly, dating back from January 2004. Today, wind power is competitive in places with very good wind resources. E.g. in New Zealand, with a splendid wind resource, wind turbines are installed without any form of subsidy. But also the US and Canada have some very good wind resources.
By the way, considering the much touted drawback of wind turbines, being its variability, wind combines perfectly with natural gas, as natural gas power stations have a relatively low installation cost (making them cheap to install), but high marginal cost (making them expensive to produce electricity). When the wind is blowing, electricity is mainly produced by wind turbines, whereas when the wind goes down, gas turbines could throttle up, producing the difference.
A good introduction to the potential of wind energy to replace conventional fuels can be found in this leaflet, however mainly focusing on Europe.
I hope some of you would more seriously consider the potential of wind energy as an important part of the solution to our energy problem, and especially the gas shortage problem.
Oh, by the way, I forgot to mention the advantages of wind energy considering carbon emissions, but that's another story...
12 GW worldwide may sound great, but the fact is that it is equivelent to 3 nuclear reactors.
I advise you to take a close look at the graph here:
Can you spot the wind? Aaaaah there it is, providing the impressive 0.06% of world energy... WOW!
However, the point was about wind as a solution for addressing the natural gas shortage problem, and 0.5 BcF/day in comparison with 13 BcF/day (i.e. more than 5 %) does matter. Especially when you realise that total installed wind power in the US is currently growing by 35 % a year. That's more than a doubling each 3 years. At this rate, within less than 8 years, we could have replaced more than 50 % of the natural gas needed today for electricity generation! Within 10 years, it could be 100 %...
I included the GE example to show that the wind energy business can grow (very) fast if deemed necessary. Compare with nuclear: it takes about a decade between the planning of a nuclear power plant and the first electricity generated from that plant...
How many nuclear reactors were effectively installed last year?
I could not find direct answer but you can take a look here:
http://www.iaea.org/cgi-bin/db.page.pl/pris.reaopag.htm
There are 4 one year old reactors with capacity 3821 MW, almost double the equivelent new wind capacity installed last year. If you sum up the last 10 years, with nuclear being bashed all the time, still it totals to 37288 MW, equvelent to 4 times the worldwide installed wind capacity during last 20 years. In 1992 alone there is installed capacity equivelent to the total wind installed now! Not to mention years like 1973 which were 4 times better than 1992.
It is typical to see a comparison between LCD screens and a wind farm from people that can not make a distinction between the two of them. A LCD screen requires some couple of pounds of plastic and a handful of cheap electronics to build. A wind turbine weights about 200 tons, requires lots of infrastructure to transmit the energy and to be maintained and if scaled will require also expensive, ineffective and not even projected energy storage.
The nuclear waste topic is long, but if you take the time to study it you will find out the dangers are way too exaggerated.
My comparison between LCD displays and wind energy had one intention: technological development is happening in many "products" whether it is consumer elcectronics or energy technology. By the way, every product has a eclogical backpack.
As far as I can tell, there is no country in the world which has found any long-term solution for the nuclear waste
How long term do you want it to be?
From Wikipedia:
Is 1 mln. years OK? Actually after only 50-100 years the waste will cool to a level that it will be harmless unless you decide to eat or drink it.

Honestly, I agree it can't stay growing like this, but it did so at least since 1990. The question is when this growth will become more like linear instead of exponential: 2005? 2010? or 2050?... In Europe, the growth rate already slowed down a bit, but in the US, with its enormous recources, and indeed its low base to date, exponential growth is expected at least till 2010.And like bjj says, there are bottlenecks (not only at GE), but these are temporarily, and these does not impede a further exponential growth. They only provide an upper bound to the growth rate. By the way, the main reason for these bottlenecks are that the suppliers did not expect this enormous growth till recently. Nowadays, I bet they are heavily investing in new production capacity.
Quite impressive, isn't it? When will it stop growing like this? Any idea? 2005? 2010? ...or 2050? Compare it with Moore's Law ...
A friend of mine works at the Pensacola GE plant where they assemble wind turbines. They are bottlenecked by global availablility of critical components, and chunk of their project time goes into expediting material. So there is an upper bound on the rate at which wind power can come online.
Problem is, that when managers or policy makers plan for something they are never concerned about resource constraints; they are thinking in terms of money. The money uniforms things and $1 mln. for consulting and $1 mln. for materials looks the same. Nobody thinks "outside of the box" and says for example: "Wait, if everybody starts building like mad aren't the prices of input materials/parts/infrastructure going to skyrocket?"
GE tripled production in 06. Now they've hit supplier bottlenecks. Do you know what supply items were most important?
What would your friend estimate as the limit to GE's expansion of wind turbine production per year?
The bottleneck may be carbon fibre for the wind turbine rotor blades. There are few companies providing this material, one of them being Zoltek (ZOLT on Nasdaq). Zoltek has had some severe production problems, which they say are now behind them. Apparently there are few companies providing carbon fibre for rotors, which is considered to be the best low maintenace, high durability material for building wind turbine rotors.
"The bottleneck may be carbon fibre for the wind turbine rotor blades."
That makes sense, given how simple these systems are. Obviously many of the parts are going to be customized and exquisitely finetuned for the application, but still, except for the controller the internal components have all been around for 100 years. It's not going to be hard for a company like GE to ramp them up. The bottlenecks will be the big components: the blades and tower, and even the tower is just a pretty simple steel tube (unless I'm missing something).
The most important manufacturer of wind turbine blades is LM Glasfiber. Check their technology pages for more information. Many major wind turbine companies (like Vestas, Enercon, Siemens) produce their own blades.
While more expensive than glass fibre, carbon provides more rigidity, strength and durability.
Renewable guy: Thanks for replying to my grid questions on the Wednesday thread, very interesting stuff.
US wind installation is projected to grow 64% in 2006 over 2005. This would be much higher if it weren't for limits to production growth at GE and the other turbine suppliers, who are maxed out through 2007.
World wind installations have been growing at 25% annually for the last 10 years (faster than any other source of electrical generation except solar, which is at 43% annual growth), and represents about .6% of world electricity production. This growth rate appears to be accelerating.
That chart is for US energy.
It appears to be out of date (as is common with DOE data, which is typically from 1999-2003): US Wind capacity at the end of 2005 was 13,149 MW, and produced about .9% of US electricity.
Keep in mind that overall BTU stats under-represent renewable sources like wind and solar by a ratio of 3-4:1, as BTU analyses look at INPUTS, not electricity outputs, which are much lower due to heat engine inefficiency. So, for instance, 40 quads (41% of the total 97 quads)are consumed in the US to produce 13 quads of electricity.
You are a little bit high on the underestimation ratio - contemporary thermal plants have efficiency ranging from 35% for coal&nuke to 45% for combined cycle NG, so the ratio is more like 2-3.
Otherwise I agree 0.9% of electricity is impressive. It will be fun when we reach 5% and start building pumped storages like Germany. Are we going to see NIMBYsm? I doubt it.
Yeah, electrical generation is pretty efficient, especially the newer forms. I think the average is about 3:1, based on the DOE's 40 quads input and 13 output, but that's from memory.
For 4:1 I was thinking of the transportation sector, where gasoline ICE's can be less than 20% efficient.
I suppose it's worth noting (for people looking for reasons to be opimistic about renewables)that distributed solar picks up another 10% advantage, through elimination of transmission losses.
I read about three months back about a new vertical wind turbine that had a record of eight years with no bird or bat kills. I want to say the company was in the mid-west, like Iowa or someplace like that. Can you or anyone else point me in the direction on that?
Bird/bat kills are an issue on wind.
"Between 100 million and 1 billion birds die in glass collisions every year in North America alone, Klem estimates. At the very least, that's an average of one bird a year slamming into each of the roughly 100 million homes, apartment buildings, office towers, schools, and storefronts that dot the American landscape."
http://magazine.audubon.org/features0403/alert.html
(If you disagree with the numbers argue with the authors)
Not to forget the number killed by cars, powerlines, planes, domestic cats, naughty kids (including "sports shooters")....
I guess the number killed by cars might go down in coming years.
Read what AWEA says about bird kills here, and bat kills here.
Nevertheless, there are even workshops being held about this. You find the proceedings of one of these workshops here. I wonder if there are any workshops about bird fatalities by e.g. buildings...
It can be used as a club and has been to stop projects. The hypocrisy of the Martha's Vineyard crowd is indeed an excellent example.
But it is also a real concern, just as noise is. The fast turning blades are the worst, such as up in southern East Bay pass places in the San Francisco Bay Area. That is my understanding why slow moving blades are being introduced.
The company that I can not find by googling has patented a small veritical turbine and they had test data that showed they had no, zero, nada kills in eight years of testing. (Thanks renewable Guy for looking for this too).
Frankly I would pay more to kill less.
Not only is the vertical turbine a much more robust design and much less of a bird killer, the good ones made in Finland do not break. Period.
An interesting sidelight: The old windmills to generate electricity built from (roughly) 1920 to 1940 were robust and did not break often, but when they did, you--i.e. the farmer with a ladder and some basic skills--could fix it. True they did not have the theoretical efficiencies of modern wind turbines, but many worked for 25 to 40 years and typically were abandoned only when the Rural Electrification Authority came by to give you grid AC power.
I found it. It is TMI out of cheyenne WY., and they are mentioned in the March 11 issue of the ECONOMIST.
Jack Greene
Yet Tom Miller and attorneys general from three other states said a six-month investigation found that the increases resulted from commodities trading that drives up prices in volatile, highly uncertain natural gas markets.
They go on to further claim that supplies are adequate for now, without examining future supplies. Looking at the chart presented clearly show that supplies should be adequate.
They seem to contradict whats being presented here and elsewhere as far as any natural gas crisis.. Who's correct??
Ans where can I find a supply/demand chart showing us how natural gas demand will outstrip supply??
I saw this in the DSM Register as well. What the politicians and the like are forgetting is that we just went through the warmest winter on record, North America wide.
People had prepurchased and hedged their NG supply to lock in prices and be certain gas would get delivered in a normal to cold winter. Without the cold weather demand was very light and supply coming out of the winter looks great. The company I work for got caught by this. We pre bought gas but didn't need to use it all, have to the end of the month to use our supply before it goes back onto the market. We don't get our money back either. The premium is to gaurantee supply in tight markets.
Demand was high to aquire rights to NG supply early in the winter. Lack of use means physical demand was lower than expected. Therefore we have surplus gas and prices were too high. Is this speculation or accurate pricing of the market in real time month to month?
I am seeing prices of heating a home or business quoted as being higher than last year. They even say people may have used less gas and had higher bills. No one is saying how much more gas we would have used in a normal year and how that extra usage compares to the current spare capacity everyone cites.
There is still this assumption by the political leadership that if people had used a lot more NG there would still be (and have been) plenty of spare capacity. There is little understanding of what causes demand.
Many think demand dropped this year because prices were high. I say demand dropped this year beacause we were 5-10F above normal temperatures mid December - February. Who is right? How does one prove their case?
I think we have to wait until next winter (or maybe very hot summer) to know for sure.
http://energycommerce.house.gov/107/hearings/05152001Hearing217/Buckley332.htm
This more properly feeds into the agricultural disscussion of a few days ago but I was too slow!
keep demand the same and it will outstrip supply. Current wells are depleting at 30% plus per year. The marginal cubic foot of gas is clearly available now, but we have this summer, next winter, the following summer, winter, etc until LNG can (if) take up the slack. front month NG has gone from 15.75 to 6.50 but backdated contracts are only down $1 from all time highs.
Reno,
And anyone else who would like a free book on Natural gas....essentially it's the summery of the report by the NPC (National Petroleum Council) on natural gas production and demand out to about 2030, commisioned by the Department of Energy in 2003. This is a fascinating document. The NPC has a long reputation of being unbiased and independent, and very methodical and detailed in their analysis. The are an extension of the consulting and planning body set up by Franklin Roosevelt in WWII to plan fuel for the war effort, quiet a pedigree.....
This does not make them infallable, however. The report I will link in a moment is actually a "corrective" report to the one they did in 1997. In that report, they concluded that there was indeed NO PROBLEM with natural gas supply and that when the gas price recovered, the drilling would take off and end the crisis. This turned out to be one of the great errors in energy planning and predictive art/science. The drilling boom failed to produce an equal amount of extra gas, and by 2001 it was obvious there was a serious problem. The 2003 report linked is the corrective report to that problem, and is very detailed data shows in it's main conclusions that:
>We are in danger of facing a major natural gas shortfall between now and 2010 unless demand levels or drops (weather and outsourcing of nat gas intensive industries are the two huge factors on demand
>Despite the claim that "enviro/green wackos" are the cause of the problem, the report takes the position that even if all "moratoria areas" are thrown open (they used a projected opening of all moratoria areas by 2006, which of course has not occured) we still face a large natural gas shortfall due to domestic U.S. production declines, Canadian production declines, and rising demand
>LNG is the only large scale "bridge" supply that can be brought on fast. The Alaska nat gas pipeline will take years, and a very high price for nat gas must be maintained to make it viable. Unconventional supplies, even if developed rapidly, produce at slower rates than conventional supplies and are expensive to this point.
>Now, here's the shocker. If demand continues at the current rate of increase, even LNG...IF IT IS IMPLEMENTED ON SCHEDULE, will fail to make up the shortfall. We know of course that the LNG plan is behind schedule, with lawsuits and bitter local opposition on safety concerns, increasing concern about where that much nat gas will come from, and financial backing pulling out of deals (the Florida Power and Light withdrawal from the Bermuda terminal and pipeline being the biggest example)
The principle conclusion is this: We must develop all the possible options listed above, and then on top of that, have SUBSTANTIAL DEMAND DESTRUCTION of natural gas demand to avoid a major shortfall.
The demand destruction through the outsourcing of the chemical, fertilizer, coatings and paint, plastics, brick, and furniture industries is already well underway. This is a HARD BLOW TO MANUFACTURING EMPLOYMENT IN AMERICA'S CRITICAL INDUSTRIES, chemical and fertilizer in particular.
So, here you go for some happy weekend reading...go to
http://www.npc.org
click on the natural gas link and look below the book at the top with the blue flame..."Balancing Natural Gas Policy"....For "Volume I, Summary of Findings and Recommendations", it is a large PDF file, but well worth the download, it has become my natural gas sourcebook....
Interestingly, two of the many big names involved in constructing this book are two of the warriors on the "Peak Oil" battlefield...CERA's Daniel Yergin and Matthew Simmons....Simmons beat almost everyone in an accurate call of the natural gas crisis, while CERA had called for a natural gas production boom in 1999 following increasing drilling. In one of the great turnabouts in the business, like the NPC itself, had to retreat and turnaround on it's own prediction...saying by 2003 that "U.S. natural gas production has almost certainly peaked, and is set for a long decline." At that time, the bet was on Canadian production increases and imports, another prediction that turned out sadly wrong. Such was the surprise in the natural gas peak that almost all sides have one thing in common...they almost all got it wrong.
This should be a lesson for those trying to "time the peak" on crude oil. This is what the famed Hirsch report is trying to tell us: The pattern of peak is that it hits fast with almost no warning, the price signal ahead of time tells us nothing, and then the depletion is very fast...(no "slow squeeze" scenario)
If you must build a fast "depletion" library, one you can carry about with you, get the NPC natural gas report....the Hirsch report...and Matt Simmons "Twilight In The Desert". All the rest are just mostly hysterical rantings.
Ok, this is all good and all the graph are great too but what I'm looking for and haven't seen yet are some numbers that will tell the story. Perhaps they were in another article that I missed and would like to be redirected if possible..
For instance, we know the US currently uses about 23 tcf of natural gas a year or about 65 mcf per day. What is the expected supply and demand numbers for the next 5 years. I know Dave stated we may be in trouble as soon as this year and I would like to see that.. SO who can supply me with these numbers for the lay person in me..
- Reserves = 5,488 billion cubic metres
- Consumption = 542 billion cubic metres
http://www.eni.it/eniit/eni/internal.do?menu=true&RID=@22VDF|0?xoidcmWopk&portalId=0&lan g=en&sessionId=8909734* Reserves - 187 trillion cubic feet
* Consumption - 22 trillion cubic feet
The US has proven natural gas reserves of around 187 trillion cubic feet (Tcf). It uses 22 TCF so it has less than 9 years left. However there is considerable exploration which finds new resources at almost the depletion rate, so far. Peter Dea had a plot along the lines of what you might be looking for in his presentation in Denver.
(They can be found at
http://www.aspo-usa.org/proceedings/powerpoint/
His is labeled the Built Environment.
In Fig 1, Lower 48 NA Conventional Onshore seems to make a near-miraculous uptick right about now. Maybe I missed it, but I didn't see any discussion about what enables the turnaround as your (excellent) post concentrates on unconventional production.
Also, elaboration would be appreciated from others on the differences in depletion characteristics between (primarily) liquid wells and (primarily) gas wells.
The EIA provides no explanation for this miracle and neither can I.
As to your depletion question, I would have to research that and might come up empty-handed even if I did. HO has posted that natural gas fields decline much faster than crude oil fields.
It is also the opinion of Matt Simmons and T. Boone Pickens that the gas depletion rate is pretty fast once it starts, but very hard to predict due to differing field geology from place to place.
One textbook example is occuring right now, however, and the depletion has been very fast...British North Sea gas. The Brits have gone from "oh, we'll just pick up drilling about and hold to our schedule", to "oh shlt" in only 3 or four years, and are now running double digit decline rates on gas production, an astounding number meaning that for all practical purposes by 2010 to 2012, Britian will have to import almost all of it's gas. No one seems to be talking about adding an economy that is at (what..I don't know the exact stat on this)...one half, three quarter the size of Japan's? What this does to the LNG demand side picture will be interesting to watch....much in the same way that watching a trainwreck is at least interesting!
This seems like a situation where the market did find a way. As conventional reserves began to dry up much more quickly than expected, technological advances in unconventional recovery pulled our butts out of the fire - if only to put us back in the frying pan.
This is the kind of development which gives me some hope, but the advances to get this type of gas still have not been all that great and are really borne more from trial and error (hey Earl, lets use X amount of TNT in this part of the pipe and see what happens) than anything really revolutionary.
I wonder how production costs will affect the cost of NG going forward? I follow several unconventional tight gas companies and they have certainly seen their production costs increase over the past couple years. The better ones have become leaner and meaner as they refined their extraction techniques, but their costs are still significantly higher.
Part of this is rig availability, but part of it is the cost of explosives needed for "big fracs" to make these wells produce. I would be interested to see a comparison of the production cost per mcfe for each of these unconventional plays in your article, and how much they might increase in the future.
You don't want to use explosives because these crack the rock in all directions and can create a lot of rubble around the hole that can reduce permeability. At the same time, because there is no directional control with the cracks that grow out from the well, you might not be able to control the direction in which the cracks grow, which is one of the things you would like to do.