The view from OPEC
Posted by Heading Out on April 19, 2006 - 11:50pm
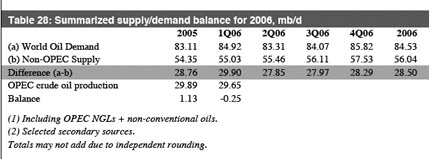
Put in words, their estimates are
On a quarterly basis, non-OPEC supply is expected to average 50.7 mb/d, 51 mb/d, 51.6 mb/d, and 52.9 mb/d in the first, second, third and fourth quarters, representing an upward revision of 99,000 b/d in the first quarter, downward revision of 285,000 b/d in the second, upward revision of 248,000 b/d in the third and 258,000 in the fourth.
They then compare this with demand.
By then comparing this to supply they derive the needed production from OPEC.
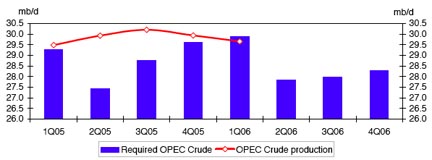
Putting that into words:,
The estimated demand for OPEC crude in 2005 has been revised to 28.8 m/d, representing an increase of 0.6 mb/d from last year and a revision of 0.1 mb/d. In 2006, the demand for OPEC crude is expected to average 28.5 mb/d, representing an upward revision of 0.1 mb/d versus the previous month. On a quarterly basis, the demand for OPEC crude is expected at 29.9 mb/d in the first quarter, 27.8 mb/d in the second, 28 mb/d in the third and 28.3 mb/d in the fourth, representing an upward revision of 0.4 mb/d in the second quarter and a negative revision of 0.1 mb/d in the third. Preliminary data shows that there was an inventory draw of 0.25 mb/d in the first quarter of 2006.(The last sentence is rather curious).
The report contains some interesting side comments, for example on Russia:
In April the new tax duty came into force for crude exports which may
affect some producers, particularly those that depend on rail exports. It is interesting to notice that despite the level of oil prices seen this year, recent drilling statistic shows that drilling footage is down 7% year on year in January, mainly due to the cold weather, but the trend over the last several months also shows a slight negative/flat slope for the growth in drilling footage, which correlates well with the slowdown in the rate of production growth seen recently.
And their prognostication for the United States may be a little optimistic, at least for the GOMEX.
US oil supply is expected to average 7.4 mb/d in 2006, an increase of 130,000 b/d versus 2005, but slightly lower versus the last assessment. On a quarterly basis, US oil supply is expected to average 7.2 mb/d, 7.4 mb/d, 7.4 mb/d, and 7. 7 mb/d in the first, second, third, and fourth quarters respectively. The revision reflects a slightly worse expectation for the recovery of the US GoM in 2Q06 and 3Q06. Assumed GoM losses in 2Q06 have been adjusted to 280,000 from a previous estimate of 200,000 b/d while for 3Q06 losses are now assumed at 100,000 b/d compared to a previous 50,000 b/d. Additionally, 50,000 b/d of permanent losses are not expected to recover in 2006, an assumption that remains unchanged. The main fields that are currently shut down include Mars (140,000 b/d), Typhoon (40,000 b/d), and K2 (15,000 b/d).The second reason for the revisions is related to the problems in Prudhoe Bay gathering centre No 2, which averaged 100,000 b/d in March. Some of these losses will extend into April, but recovery is under way with over 70% of the lost output back on line.
And in terms of non-OPEC supplies in general, again there is perhaps a little optimism:
In the first quarter of 2006 average losses related to unplanned shutdowns, deeper maintenance, weather impact, accidents, and strikes are estimated at 1 mb/d in January and 0.6 mb/d in February and March, the bulk of which is concentrated in the OECD. In April, early indicators suggest that total affected production may be larger than in March, but this is expected to be offset by increases elsewhere, underpinned by strong growth in non-OECD. Prudhoe Bay is likely to produce around 30,000 b/d below capacity, Ecuador is still facing challenges in restoring full output due to damage to the export pipelines and strikes, while in Angola the 200,000 b/d Girasol development will be offline for an extended period of time in April/May to under go maintenance and technical upgrades. In Norway, the latest maintenance schedule also suggests that some 300,000 b/d will be out for the month, much higher than previously anticipated. The US GoM is also not expected to see any significant improvement.
There is a wealth of other data on pipeline flow rates, tanker movements and the like, which space and time preclude me commenting on - but which are worth a read, if you have not been there before.
Contact
- Content: editors at theoildrum dot com
- Tech support: support at theoildrum dot com
License

This work is licensed under a Creative Commons Attribution-Share Alike 3.0 United States License.
DoD Broadens Energy Efficiency Focus
including consideration of an all-nuclear Navy.
http://www.military.com/features/0,15240,94739,00.html
Buried in that article is Bartlett's point that it makes sense for the Amphib carriers like our BATAAN Marine carrier (the smaller carriers that carry helicopters and harriers). Possibly/probably some of the large transports and the like could qualify for Nuke engines, but the navy is having a difficult problem with rapidly escalating costs and a lack of numbers in total ships.
At least they are talking about it.
If the nuke plant on board was hit directly and it shattered, it would spread out some more.
All the more reason for the good guys to win and the bad guys need to lose!
Think of it as an underwater exposed uranium deposit.
-pop
The main protection of our larger warships is precisely that. They are large. So it would come down, in my mind, to two things.
- where did it hit/explode? If it is the bow, not unusual for a mine, the power plant probably stays intact and the ship survives.
- a hit that is amidships and goes deep into a warship, such as from a missile, like the Sunburn, the damage is much worse.
And of course, one of the worst things the USN is at is mine-clearing and most damage since the end of WWII to our warships has been from mine related type stuff. I forget the exact figure but it is like 15 our 19 damaged warships since the end of WWII has been due to mine-related weapons.Armor plate is out of fashion these days.
There is the factor here that our older ships were built with the wrong material (light weight stuff that gets hot easily and burns too) while the newer warships are supposed to be better.
But you still run the risk of nuclear contamination. But it is not the end of the world.
One final thought, the size of crews on the new ships, especially those being built right now, have small to tiny crews compared to the old days. Less hands to do damage control. . . . it is a factor being debated in the halls of Washington and the Pentagon.
As to OPEC, the report offers no new information whatsoever. It does not repeat the bombastic promises of some member states.