| Friday Open Thread | The Oil Drum | HO v. Econbrowser: Title Fight...Round 20! (and another open thread) |
Do Oil Reserves Tell Us <i>Anything</i>?
Posted by Stuart Staniford on April 29, 2006 - 12:56am
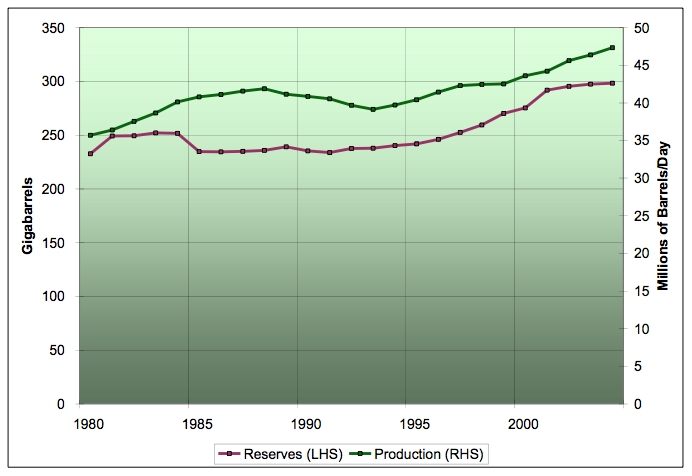
History of global proved reserves excepting OPEC in billions of barrels (also known as Gigabarrels = Gb. A barrel is 42 US gallons) on the left scale, with global production excluding OPEC on the right scale. Source: BP Statistical Review of World Energy. Click to enlarge.
Of course, the reason to ignore proven reserves numbers is that two thirds of the global total rests with characters like these:
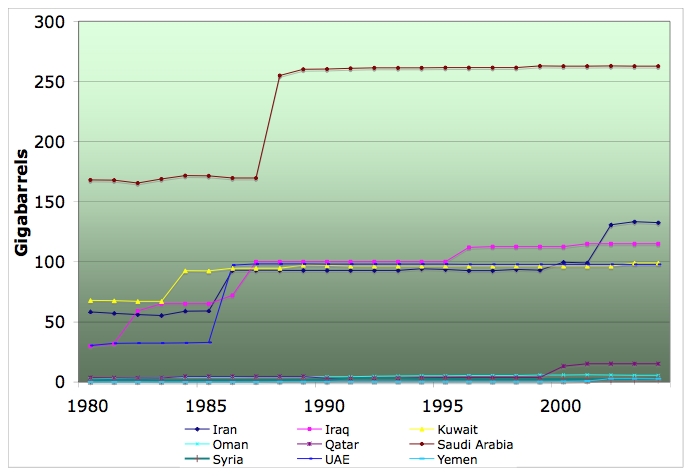
History of claimed proved reserves for various Middle Eastern countries. No major discoveries in these countries were announced in the 1980s. Source: BP Statistical Review of World Energy. Click to enlarge.
The only thing proven by these time series is that the sources of the data are dishonest and we won't be certain of anything useful about the situation until long after the fact.
But is there anything useful to be extracted from the rest of the world's data? After all, reserves data in other countries are covered by legal or professional standards which might count for something (Bubba wrote a nice summary a while back). I decided to take a look at the BP history of claimed proven reserves for various countries of interest.
Now, I note several cautions. Firstly, the data only extend from 1980-2004, and are annual numbers. Secondly, BP say as to the source of the data:
Notes: Proved reserves of oil - Generally taken to be those quantities that geological and engineering information indicates with reasonable certainty can be recovered in the future from known reservoirs under existing economic and operating conditions.
Source of data: The estimates in this table have been compiled using a combination of primary official sources, third party data from the OPEC Secretariat, World Oil, Oil & Gas Journal and an independent estimate of Russian reserves based on information in the public domain The reserves figures shown do not necessarily meet the the definitions, guidelines and practices used for determining proved reserves at the company level, for instance those published by the United States Securities and Exchange Commission or recommended for the purposes of UK GAAP, nor do they necessarily represent BP's view of proved reserves by country.So, we don't really know what these various time series are, but, with that caveat, let's go ahead anyway. I made a variety of graphs which show the reserves over time (plum colored lines) on the left hand scale, and the annual production (green lines) on the right hand scale. That way we can get a sense for what trends in reserves tell us about trends in production.
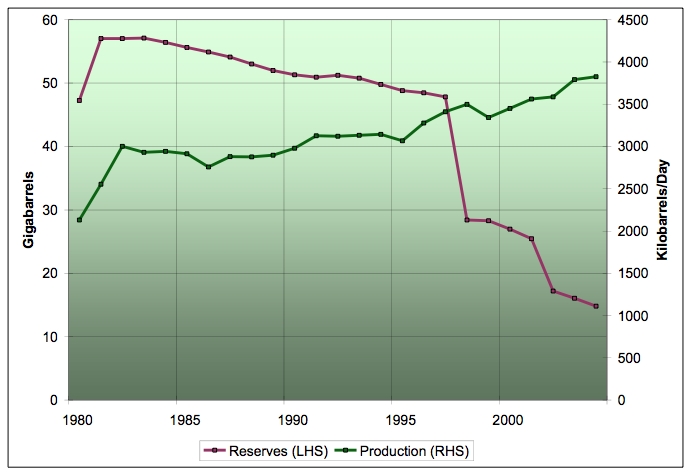
I started with countries that are known to have peaked in the 1980-2004 timeframe so we can see what peak looks like from a reserves perspective. Let's lead with the UK:
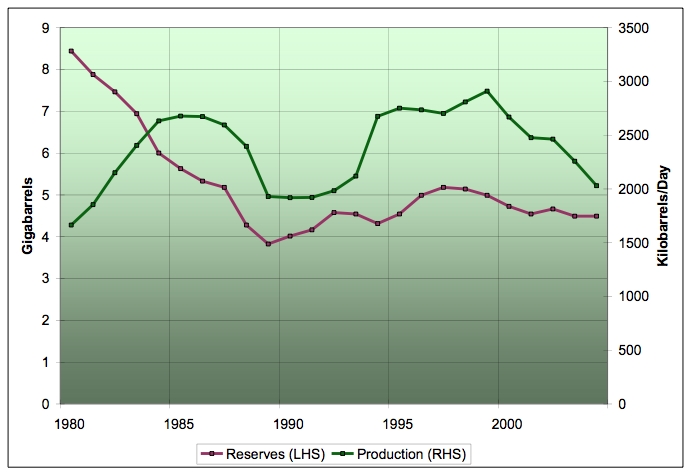
History of UK claimed proved reserves (plum, left scale) and average daily production (green, right scale). 1980-2004. Source: BP Statistical Review of World Energy. Click to enlarge.
So what I see in this data is that changes in the reserves tend to lead changes in the production. As we start in the 1980s, reserves are dropping steadily, which leads to a production peak in 1985-1986. However, then the second wave of UK North Sea discovery hits (we've discussed this before), and reserves start to go up again, with production increasing again shortly after. Reserves peak for the second time in 1995, and the second peak in production occurs two years later in 1997. Since then, reserves have been dropping steadily but gradually, while production has been plummeting.
Clearly, there is not a precise quantitative relationship, but it generally seems that when it gets hard to grow the reserves, it fairly soon gets hard to grow the production too.
What about Norway?
History of Norwegian claimed proved reserves (plum, left scale) and average daily production (green, right scale). 1980-2004. Source: BP Statistical Review of World Energy. Click to enlarge.
Well, there's a somewhat similar pattern, except without the lag. When reserves are growing, production is growing, while when reserves start to shrink, production starts to shrink too. In Norway, the reserves don't provide us with any warning, however. Also, in contrast to the UK, post-peak the reserves are shrinking faster than the production.
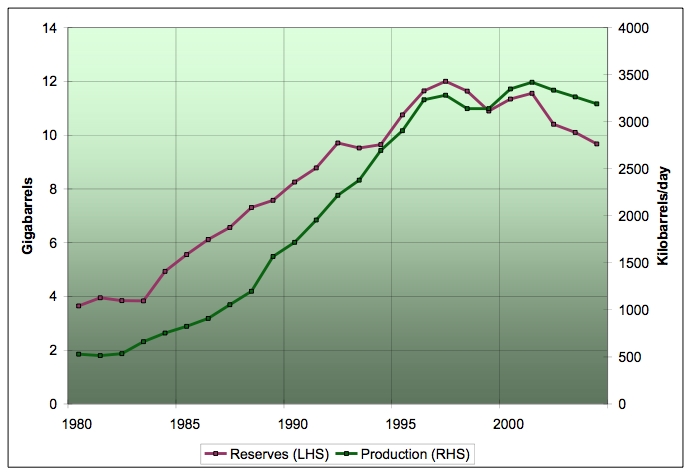
Another country that peaked in the same timeframe is Australia:
History of Australian claimed proved reserves (plum, left scale) and average daily production (green, right scale). 1980-2004. Source: BP Statistical Review of World Energy. Click to enlarge.
Australia seems to work like Norway. Reserves grow in rough co-ordination with production growing, and then as reserves peak and decline, production does too.
Next comes the Former Soviet Union.
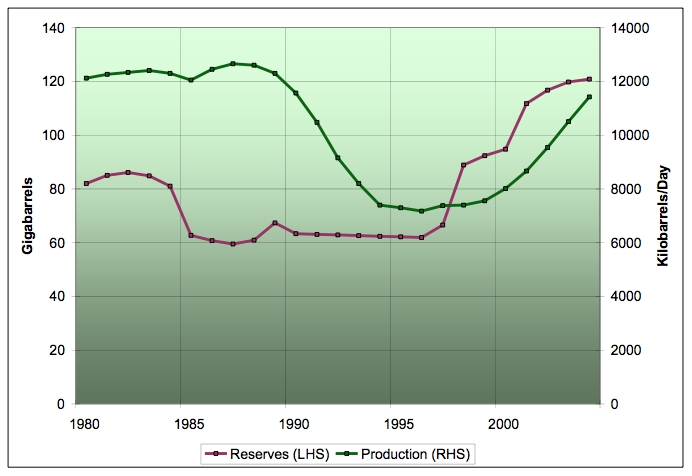
History of Former Soviet Union claimed proved reserves (plum, left scale) and average daily production (green, right scale). 1980-2004. Source: BP Statistical Review of World Energy. Click to enlarge.
The FSU is more like the UK. There's a clear decline in the reserves in the 1980s which predicts the production peak in 1989 (which tends to argue for the Douglas Reynold's theory that the Soviet oil crisis caused the societal collapse, not the other way round). Then the reserves start to really improve in 1997, which leads the improvement in production by 1-2 years. The reserves increase has been leveling off for several years now, which suggests that Russian production increases do not have much further to run (as the Russians themselves have been warning).
Note, Russia is exceptionally important in the overall picture. The great bulk of global production increases since the post-crash trough in production in 2001-2002 has come from just two countries: Russia and Saudi Arabia. The Saudi's stopped increasing some time ago, so Russia is by far the leading hope for folks who'd like to believe there will be significant production increases from here out.
If we look at the US - obviously the US was post-peak before the data begin:
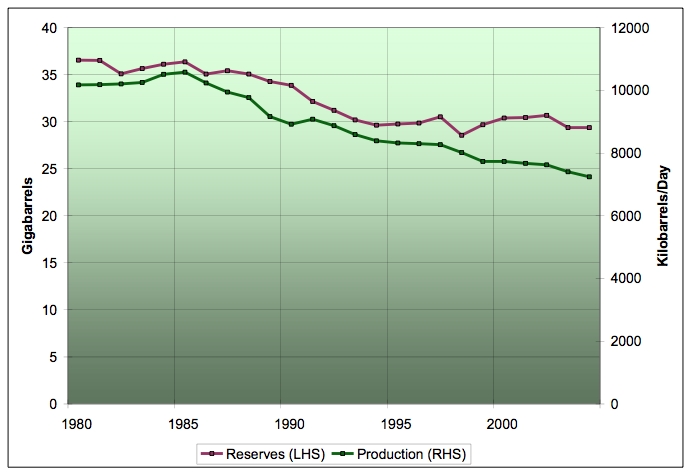
History of US claimed proved reserves (plum, left scale) and average daily production (green, right scale). 1980-2004. Source: BP Statistical Review of World Energy. Click to enlarge.
And indeed we see that reserves and production have generally declined together for 25 years. The one caveat is that the slight bump in reserves in the early 2000s (which I take to be due to deepwater Gulf of Mexico) did not lead to much if any amelioration in the production decline.
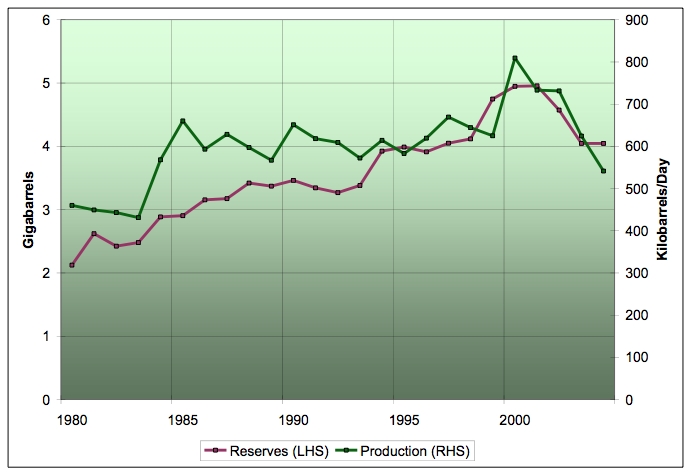
Finally, we look at Mexico, which is interesting because they themselves have been forecasting that their production was likely to go into decline shortly.
History of Mexican claimed proved reserves (plum, left scale) and average daily production (green, right scale). 1980-2004. Source: BP Statistical Review of World Energy. Click to enlarge.
I guess Mexico is the exception: reserves have been declining increasingly precipitously, but production has not (through 2004). I imagine part of the reason is that more than half of Mexico's production is from Cantarell, and the wells are at the top. The reserves graph suggests what WesTexas has been emphasizing: the declines here are likely to be horrendously fast once they start.
However, there's something else going on here. It looks like they've been writing off a lot of their reserves (which were perhaps inflated earlier). Eg from 1997 to 1998 they dropped 20Gb, even though they only produced about one Gb. That's a lot of oil to just evaporate! (Note that 1mbpd for a year is 0.365gb, so it takes a little less than 3000kbpd to use up a Gb in a year).
There may well be more reserves to be added in Mexico. OTOH, they might not be done with write-downs yet - they wrote-down a lot more than production in 2002 also.
Finally, we have the whole Non-OPEC picture:
History of global proved reserves excepting OPEC in billions of barrels (also known as Gigabarrels = Gb. A barrel is 42 US gallons) on the left scale, with global production excluding OPEC on the right scale. Source: BP Statistical Review of World Energy. Click to enlarge.
On the whole, reserves trends here seem to lead production changes, and the slowing in reserve increases from 2002 on seems to have successfully forewarned of the production plateau that started in late 2004. What we don't see is a sharp recent upturn in reserves getting ready to support the CERA storyline that the world will soon have plenty of oil production again.
All-in-all, these couplings are imprecise, but there seems to be at least a qualitative argument to suggest that the trends in proven reserves are consistent with the idea that we are close to the peaking of global production, unless someone comes up with a bunch of new discovery somewhere.
Contact
- Content: editors at theoildrum dot com
- Tech support: support at theoildrum dot com
License

This work is licensed under a Creative Commons Attribution-Share Alike 3.0 United States License.
Unfortunately, it doesn't appear to be that simple and that the pre 1980s data isn't reliable either. See JD's post regarding Ghawar:
http://peakoildebunked.blogspot.com/2006/02/239-ghawar-now-empty.html
If you take the numbers from the 1970s as gospel, then Ghawar is already empty.
I think the production numbers have to be more solid than the reserve numbers because the missing barrels number (oil that can't be accounted for when you subtract the known consumption from the known production and take into account known stock changes) is not usually more than a couple of percent of global production - ie comparable to the discrepancies between the different production series (EIA, IEA, etc. So whatever lies are being told about production numbers, they can't sum to more than a percent or two of the total.
So I think the only facts about OPEC that I have a lot of confidence is that for the last 12 months or so:
Were I writing an op-ed editorial I'd say, "Well, the editors at TOD have done it again. They say the sky is falling yet one of their main spokespersons said the following day, and quote, 'They are clueless about OPEC.' If they are 'clueless' about this what else are they clueless about...."
I don't want to belabor this. I knew what your point was. However, I believe it instructive how "quotes" can be used to support a position antagonistic to the position of TOD. It is this sort of thing that undercuts rational discourse.
Someone like Mike Lynch would (probably) have no problem writing a good piece obfuscating reality and attacking TOD based upon your words. It is truly unfortunate the world has come to this but, IMO, that's the way it is.
Todd is way off.
Stuart is correct in his analysis.
How would I know? I don't even really care. The basis of my optimism isn't that there's lots of oil left, although there probably is. The basis of my optimism is that we, humanity, don't need oil.
I also think there's lots of reason to believe that Ghawar has actually peaked, which is the only important point here.
I strongly disagree. You're basically saying "There's lots of reasons to think the poppy fields may be in trouble, which is the only important point here."
The status of the poppy fields may SEEM to be the only important point to the heroin addict, but it's not actually. The only important point is the fact that the person is addicted to heroin. That's the real root of the problem. The poppy fields are just a red herring -- a focus of junky denial which ignores the real problem.
When I said "the only important point," I didn't mean overall, just in terms of the specific discussion of Ghawar reserves. I didn't think the number of 60 vs 90 vs whatever was that important if the field's production was peaking (which I know is under debate - I've just expressed my intepretation of the data I have seen). Its production is what matters, not the number. Certainly it's not the most important issue in the issue of oil dependence.
BTW, I have to agree that circumstances have prevented validation or refutation of the USGS projections. I disagree that their analysis has been substantiated, but agree that we don't know how right or wrong they are about Iraq, Greenland, etc. I do know that as long as the oil remains undiscovered for whatever reason that it won't help against the peak oil concerns.
Note that non-OPEC reserves have actually increased over this time period despite producing oil all that time. So there is nothing in itself mysterious in OPEC reserves also increasing. Obviously the specific timeline reflects a political decision about when to upgrade "official" reserves, but that reserves have increased is very plausible.
From Stuart's graphs, non-OPEC reserves increased from about 230 to 300 GB over the time period, an increase of 70 GB or 23%. (And note that non-OPEC produced over 300 GB during this time, substantially more than initially estimated reserves! Yet it had more when it was done than when it began.) In comparison, Saudi Arabia increased from about 170 to 260, an increase of 90 GB or 35%. It's more than non-OPEC but not a vastly bigger increase.
First and foremost, the total inadequecy (sp ?) of the available data.
Second, while an interesting topic, it might not have too much bearing on the timing of the production peak. Extra reserves, even if real, might only serve to draw out the tail on the production downslope (not that there is anything wrong with that).
Third, Stuart's data ranges from 1980, when oil prices were near historic highs, to essentially now. Oil prices are always given as a reason for reserve growth, but shouldn't this have necessitated a reduction in reserves once the price came back down?
I suppose it gets complicated since discovery of new oil was greater in the '80's, but something about this data seems very fishy to me.
The lack of transparency, and the clear incentives various actors have to cheat only add to my suspicion.
You've got a number glitch. 170 to 260 is a 53% increase, not 35%.
Thanks for the great data!
A couple of questions:
I'm also not 100% convinced that Michael Lynch doesn't have a point about the distortions inherent in that method because one doesn't really know how much the recent discoveries will grow in the future. I haven't seen a completely convincing rebuttal that that issue has really been adequately taken care of.
That's for sure. The IHS database is called IRIS21, and here's some data on those $$:
So it seems that Campbell and Laherrere are not using the industry database, at least in its most up-to-date form. They can't afford it. So where are they getting recent data? Campbell gives Exxon/Mobil 2002 as a source for the "Growing Gap", but that isn't a genuine cite, and doesn't explain where he is getting post-2002 data.
I'm with Stuart, Khebab and the rest of the amateur sleuths out here. We can make good headway using good models and crunching data that we already have. Data acts as a big jigsaw puzzle, and you don't have to have all the data in one place to make headway.
So are you saying that oil discovery which in recent years only replaces one of every 4 (or 6 depending on who you ask) barrels of oil consumed will experience reserve growth with time. In other words, say 6 gigabarrels are discovered this year, will that "grow" to 12 or 15 gigabarrels on the books by 2020? This is one of the arguments that Lynch uses to critique Colin Campbell- that he complains about reserve growth hiding the trend of shrinking discovery, yet doesn't acknowledge that current discovery will likewise experience such "growth".
Heading Out, where are you when we need you??
This is not to say that I read Lynch as someone determined to come as close to the truth as possible. He very much reads to me as someone who's position is essentially partisan and impervious to evidence, and is looking to score any point he can whether it makes much sense or not - he is a contrarian cornucopian. That said, he's a smart one, so he sometimes makes good points.
Also, BP is getting their data from state-owned oil companies much of the time. It's not as if they have some team of people out there traveling around the world talking to the technical people who oversee production of oil fields. The BP data is something to work with but there is probably a lot of noise in it. As Stuart says above, a better data set costs $$$ and may or may not improve our ability to make predictions.
OK, so we don't have the data at the macro level. What about the micro level?
Do we have any good information for particular fields, or maybe a country? Norway is known for the high quality of its published data, for example, and I remember seeing a backdated reserve graph from Colin Campbell at one point. What about a a field like Prudhoe Bay? Any insider contacts in the industry that could shed some light on this?
I'm mostly curious about how countries/companies justify reserver growth in existing fields. Certainly the price of a barrel would be a factor, but then that doesn't explain the reserve increases during the '80s and '90s, or example. Any sandbagging going on? Do the companies tend to be conservative with initial estimates?
If the data isn't there, so be it. I'm just really curious about how this works.
Judging from the last excellent diagram I notice that R/P (Reserves divided with Production) for the world exclusive OPEC was about 17-18 at end 2004.
I assume data are from BP SR 2005, as the 2006 version is not due before June 2006.
And these countries part of the global production was about 57 % in 2004.
This to me suggests that when declines comes for these countries it will be steep.
Remember Hirsch report about peaking and describing the peak could take the form of a wavecrest.
So the 18gb haven't died! and 18/0.4 = 45gb (significantly more than BP states). But it looks like the pace of getting this stuff out may be very slow.
Using only production through 1970 for the Lower 48 and through 1984 for Russia, Khebab generated predicted production profiles for the Lower 48 and Russia. Actual Lower 48 cumulative production through 2004 was 99% of what the HL model predicted, and actual Russian cumulative production through 2004 was 95% of what the HL model predicted.
The HL analyses of the Lower 48 and Russia strongly support Deffeyes' conclusion that we have used half of our conventional crude + condensate reserves.
Stuart, a flaw
"it takes a little less than 3000mbpd to use up a Gb in a year"
3000 milion barrels per day?
As Matt Simmons has pointed out, the lack of reliable data on oil is one of our biggest challenges. It means that we are flying blind, and that partisans or demagogues can make some sort of case to support nearly any scenario.
There is a general analytic approach evolving at TOD, involving both your work and others'. Analyze what data we have, and then make an objective judgement about a) the quality of the data b) the robustness of the analytic method [which is often limited by the data] and c) the strength of the results.
There is one final step we can take, a meta-analysis of all the studies we have. You are actually doing this in your own stream by cross referencing previous posts, and we can take it a step further by tabulating all the credible work we've got. Even an index of analyses would help. There will be a bias--analyses from the cornucopian point of view are scarce, and usually proprietary--but it gets us to the best perspective on what we've got.
Thanks for your continuing work.
this one is a keeper.
Amen!
Amen is scary.
http://www.reason.com/0605/fe.rb.peak.shtml
He says, on this issue: "But the desire to boost quotas cannot account for the fact that non-OPEC reserves grew nearly three times faster than OPEC reserves between 1981 and 1996."
I don't see how to square that with Stuart's data. Is Bailey just full of it? He doesn't provide any references at all.
"Reserves are those quantities of petroleum which are anticipated to be commercially recovered from known accumulations from a given date forward. All reserve estimates involve some degree of uncertainty. The uncertainty depends chiefly on the amount of reliable geologic and engineering data available at the time of the estimate and the interpretation of these data. The relative degree of uncertainty may be conveyed by placing reserves into one of two principal classifications, either proved or unproved. Unproved reserves are less certain to be recovered than proved reserves and may be further sub-classified as probable and possible reserves to denote progressively increasing uncertainty in their recoverability."
Reserves are defined based upon economics and definition of "commercial:" when the price of oil increases, more oil in an existing field becomes theorectically commercial, and therefore redefined as reserves.
Another reserve growth is actual new discovery. A new discovery will add to overall production (if depletion/decline of other fields doesn't exceed the new production).
Another reserve growth is kind of a hybrid, which involves new, expensive technology which might enable more recovery than previously thought, and is possible at new higher prices, also increasing reserve estimates.
Reserve growth of an older field generally does not increase production rates. Instead, production will continue but on a prolonged declining course.
Technology improvements will likely increase production temporarily, but there is disagreement whether it actually increases total production in the long run.
Without knowing which reserve growth is occurring, I think it is difficult to estimate the impact on supply.
Thanks again Stuart for a great, provocative analysis.
This might be a bit off topic (but only a bit), but I was thinking it would be great if you aces at TOD would take one (or more) of the reports over the past couple of years that map future projects that are in development-- such as the Wood-McKenzie report-- and do periodic updates on the progress of the projects (including updated reserve estimates) with some SWAGs as to how these projects will affect the course of world-wide peak oil.
As an aside, I remember the Kashagan field story (debacle?) and the seriously declining reserve estimates as time went on. I don't know at what point any of these numbers from this field became 'official' reserve numbers, but maybe that is part of the problem.
http://www.econbrowser.com/archives/2006/03/another_look_at.html
Generally, he found that things were not going quite as well as CERA had predicted.
The EPA is offering a research grant opportunity that I believe is a perfect fit for this idea. I have sent an e-mail to a hand picked list of university professors who have experience with government research projects. I'm looking to form a research team to apply for the EPA grant, conduct a social-economic experiment and surveys to determine to what extent the American public will support it, project the economic potential of WPH, and identify logistical, social and political obstacles as well as opportunities.
All government grants are awarded based on merit of the proposed research. I believe WPH has merit but your help is needed to verify it. You can help by posting your feedback. Let the professors and the EPA know what you think about WPH. Do you think this idea is worth pursuing? We need to know if Americans will support a plan like this.
Do you have any ideas to improve the plan?
Share any and all of your thoughts.
Tell your friends and family about this Blog post and ask them to post their thoughts on WPH
http://wepayhalf.org
Thank you
Craig