Extreme Production Measures
Posted by Dave Cohen on July 23, 2006 - 3:55pm
[Robert] Hirsch doubts that the world can keep increasing oil flows for much longer. "CERA sees a long plateau ahead," he said. "But I can't find a plateau in the data I'm looking at." The downturn, when it comes, could take the world by surprise. "Peaking could come with little warning and sharp declines," he said....Hirsch is the principal author of the now famous Hirsch Report (large pdf). Skrebowski maintains the Megaprojects Database of future oil production. These quotes got me thinking about the shape of the peak in world oil production which Skrebowski projects as occurring in the fall of 2010."We have 1,500 days until peak and tomorrow we'll have one day less," Chris Skrebowski, the editor of Petroleum Review, told the ASPO-5 crowd today. Skrebowski's projections, which focus on oil flows instead of reserves, has the world peaking at between 92 and 94 million barrels per day. Unfortunately, he said, "collectively we're still in denial."
Skrebowski's analysis has provided one of the most important independent methodologies supporting the 'imminent peak oil' hypothesis proposed by Hubbert inspired modelers such as Colin Campbell, Jean Lahererre, Ken Deffeyes, Stuart Staniford and GraphOilogy. His most recent studies conclude that, should no major disruptions take place, global peak oil should be delayed until at least 2010, “but shortly thereafter production is more likely to decrease than increase.” ... Skrebowski's latest figures also include deepwater oil, Athabasca tar sands, as well as natural gas liquids and condensate production....One "poster child" of field depletion is Yibal in Oman.Over the last year or two there has been a great deal of discussion about depletion rates within certain countries. Usually what is described is the loss of capacity in existing fields that would occur if no remedial or offsetting action is taken and sometimes referred to as ‘natural decline rates’. Typically this is assessed at around 5% but an increasing number of reports now cite even higher decline rates. For Example the IEA’s ‘World Energy Outlook 2005’ which provided a detailed analysis of prospects for the Middle East and North African producers (all Opec members except Egypt) noted current natural decline rates of 600,000 b/d per year for Saudi Arabia and 270,000 b/d per year for Iran....
This information indicates that these two countries and any other with similar declines face considerable challenges in maintaining or expanding their capacity. However, this information on natural decline rates is of limited value unless the volumes that can be offset by infill and infield work are known....
Oman’s Yibal field, which began production in 1968, is an excellent example of a field that has responded nicely to MRC [Maximum Reservoir Contact] wells combined with water flooding. After many years of infill drilling and the use of water injection wells, PDO made the decision in 1994 to use horizontal wells. Today, the Yibal field contains nearly 500 horizontal wells, which helped the field reach peak production at more than 250,000 bbl/d in the late 1990’s. Horizontal drilling has led to a dramatic increase in water production and an equally impressive decline in oil production. In 2003, Yibal produced approximately 80,000 bbl/d and approximately 700,000 barrels of water per day. Such a high water cut speaks volumes about the maturity of the field and portends a field approaching the end of its productive life. It is estimated that PDO has already recovered approximately 42% of Yibal’s oil in place, although it hopes to get the field’s recovery factor close to 55%.

Sharp Decline at Yibal
At the top, Hirsch makes the conjecture that "Peaking could come with little warning and sharp declines". Skrebowski tells us that the world will peak at between 92 and 94/mbd in 2010. Together, these two statements suggest that what happened at Yibal could happen to the world. Let's use an analogy to explore Hirsh's conjecture. Enhanced Oil Recovery (EOR) is used to increase recovery rates in an oil field and usually refers to applied secondary and tertiary techniques. Among the former are use water flooding (to maintain reservoir pressure). Among the latter are the injection of other gases (eg. nitrogen at Cantarell, carbon dioxide or steam in other fields). Either technique can be accompanied by drilling of horizontal (deviated) wells to stimulate oil flow. Use of EOR often results in a recovery pattern that looks like this -- detailed in Technology and Petroleum Exhaustion: Evidence from Two Mega-Oilfields for the Forties field in the North Sea and the Yates field in West Texas.
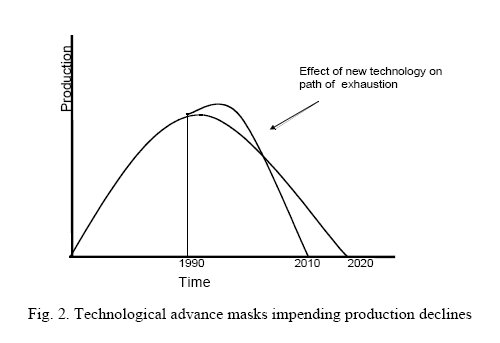
To pursue my analogy, I will invent a term Extreme Production Measures (EPM) which applies to various aspects of global oil production just as EOR applies to individual fields. As you see in the graph just above, the use of EOR often (but not always) has the effect of pushing the production curve higher and to the left followed by a steep decline and perhaps some reduction in the URR (ultimately recoverable reserves). This reduction is entirely hypothetical because it is presumed that declines in the field in question would have followed a bell curve, the natural decline rate as cited by Skrebowski above.
The net effect then is to compress the recovery in time -- recover more oil now perhaps at the expense of future production. So let's define our new term as follows.
Extreme Production Measures (def)What are some EPMs in the current world of oil production? Here's a short list, you may think of others.
- Any aggressive production technique or approach that is meant to increase short-term recovery rates or efficiency. Such techniques or approachs may also decrease longer term yields had these not been applied but that can not be known with any certainty after the fact.
- Tar Sands Development in Alberta. If we look at Of Oilsands and Caviar and Malthus, we learn that "Shell Canada and
Western Oil Sands announced that the price tag of their Athabasca oilsands expansion won’t be $7.3 billion (Canadian dollars) as initially projected, but rather $11 billion – or 50% higher! If that’s not inflation folks, then we don’t know what is.... It would appear that this purveyor of abundant energy is on its way to ignominity due to spiraling costs". These spiraling capital costs are due to various factors including commodity prices (eg. steel), lack of trained workers and infrastructure in the producing region and higher energy prices (oil and natural gas) affecting the EROEI.
The attempt to ramp up the tar sands production quickly has resulted in an unsustainable development subject to radical inflation. Shell's phase 1 expansion is supposed to add 150/kbd to tar sands production but they have overreached. Read Tar Sands Sanity Check for some background. It gets worse. Consider the Globe & Mail's article Cost of Athabasca could hit $20-billion.
The cost of the full three-stage expansion, pegged at about $13.5-billion last year, now might come in at more than $20-billion.
Future production is now in doubt due to investor uncertainty, unprofitable economics and logistical impossibilities. One can wonder whether a slower, smaller phased development would have been better but that is The Road Not Taken."Intense demand for construction labour, material and supplies . . . have resulted in unprecedented increases in capital costs. This demand is further intensified in Alberta by the development of multiple oil sands projects," said Western Oil Sands Inc. in a press release late yesterday. Western, along with Chevron Corp., is a minority partner in Shell's Athabasca operation.
The announcement is the loudest statement yet that development in the oil sands north of Fort McMurray in northeastern Alberta is coming unhinged and that the demand for steel and workers is reaching untenable levels.
- Ultra Deepwater Drilling. If you read Byrant Urstadt's The Oil Frontier, you will see that Chevron is using a single rig to drill six scheduled wells in the Tahiti field in the Gulf of Mexico. All six wells will be put into production and are being drilled to maximize flow rates. Initial production of an anticipated total of 125/kbd is supposed to come onstream in 2008.
From Urstadt's article.
"We don't want a straw down there," says [Senior drilling superintendent Curt] Newhouse. "We want to see a good 30,000 barrels a day." Stick with the bigger casing too long, and the deepest part of the well may collapse before it can be cased....
The view here is that Chevon's Tahiti will eventually be subject to "natural declines" in the future which mirror the experience in the UK's older Magnus field in the North Sea in which EOR was first applied (gas injection) in 1996 after a severe production decline. Note that this has not stopped the drop-off in production.Newhouse, though, isn't convinced the bit is close enough to the M17 sands to change the casing yet. He's thinking about the future of the well, 10 years down the road, and he wants to see a good flow, not an overly conservative casing decision.

Magnus Production (1983 to 2006)
Click to EnlargeThe Magnus field had high flow rates for about 12 years before starting its precipitous decline. The field's production pattern looks little like a bell curve. Now consider these slides from How Much Oil and Gas from Deepwater? -- The Brazilian Experience by Carlos H.L. Bruhn of Petrobras E&P at ASPO 2005.

Slide 1 -- Click to Enlarge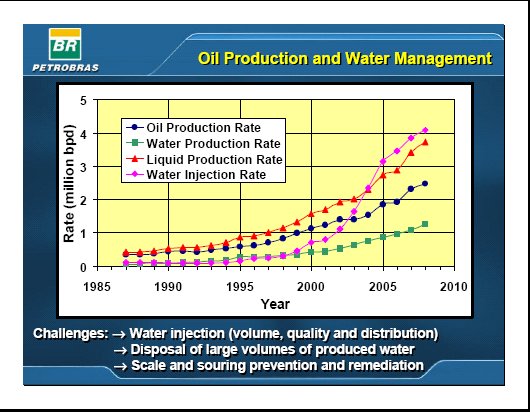
Slide 2 -- Click to EnlargeSlide 2 is the aggregate of production from Brazilian deepwater and ultra-deepwater fields. After you've had a chance to review both slides, consider that in this kind of production, a few horizontal wells are drilled using water injection to achieve high flow rates. The effects on recovery of deviated wells are well known from onshore areas. As you can see in Slide 2, the water injection rate is soaring, increasing by about 366% between the years 2000 and 2006. This has resulted in productivity gains that are substantially lower than the water injection rate. Water production, which is pacing oil production, can't be far behind. Though things may look rosy now, the pictures strongly suggest that these fields will be used up sooner rather than later followed by a Yibal-style sharp decline. Only by adding new fields will production be sustained.
My conclusion is that deepwater and ultra-deepwater production meet the criteria for extreme production measures. When global deepwater production peaks in the period 2010 to 2015, mostly due to diminishing discoveries, the declines may be sharp and rapid.
- Tertiary EOR and horizontal wells. This is the baseline example of an extreme production measure. Critiquing CERA's 2005 report, EconBrowser reports
The issue seems to be that modern methods of oil extraction appear to keep production high for longer, but then it falls fast on the back side. Eg, horizontal multilateral wells at the top of the oil layer keep up much higher production than vertical wells, until the oil is pretty much gone, and then it starts to fall very fast. Similarly, regular seismic imaging of the oil in place allows rapid exploitation of pockets of left behind oil until there are none, then it's over.
As far as tertiary recovery goes, nitrogen injection at Cantarell is fast becoming the exemplary case.As far as I'm able to tell, the use of this kind of technology is now widespread. So there is an argument that global depletion will be much faster than Hubbert, Campbell, Deffeyes et al have predicted. This is the basis for Matt Simmons saying things like "If we don't address this, no scenario is too dark".
- Saudi oil production -- The current issues with Saudi Arabia are nicely summed up in Saudi Arabia's Oil A Huge Question.
"When the price is high, that's when you want to take out your oil and sell it," said economist Ujjayant Chakravorty of the University of Central Florida. "I am wondering if they have some production issues."
I would like to de-mystify the question for Amy but unfortunately I can not. A standard view here at TOD is that Saudi production is peaking. For the sake of argument, I will take another stance. In this view, the Saudi's have engaged in extreme production measures in the past and are now realizing the folly of their ways, that time marches on. Saudi Arabia has been under a great deal of pressure from the OECD countries and their energy vehicle, the IEA, to invest more in new production. Subsequently, they have drilled more wells and put the newest Haradh-3 extension to Ghawar onstream. However, the Saudis have apparently starting restraining their production. Perhaps there has been a change in policy and the Saudis, knowing that they can not control prices or risk damage to old existing fields, have settled on a policy of preserving longer term yields. This thesis is not inconsistent with the view that their production is peaking but does not imply it. They can no longer pump like there's no tomorrow.In the past, the Saudis have repeatedly passed up the chance to maximize short-term profits. Instead, they have seen high prices as a threat to global economies and an incentive for development of alternative energies that would threaten their cash cow.
When prices have been high, they have pumped more.
"If your concern were energy market stability and not your income level, you'd put more oil out in the market," said Amy M. Jaffe, energy fellow at Rice University's Baker Institute. "Why do they see something different now? It doesn't make sense to me."
Here I have taken another approach considering what I defined as extreme production measures as they apply to various aspects of world oil production, which may or may not contain an element of truthiness. Even as an artifice, this has forced me to look at things in a different way. The four examples I used all point to an intuitively obvious common element: the rush is on to get to Skrebowski's production levels without heeding the future consequences of such actions. What are the combined effects of 1) failed tar sands development, 2) likely rapid depletion in deep and ultra-deepwater production, 3) diminishing returns for applications of EOR and horizontal drilling and 4) the Saudi production history for Ghawar and it's other older fields? I don't know the future but my intuition tells me that
- We will never see 94/mbd.
- Real declines, when they begin to occur, will be sharp, not gradual.
Contact
- Content: editors at theoildrum dot com
- Tech support: support at theoildrum dot com
License

This work is licensed under a Creative Commons Attribution-Share Alike 3.0 United States License.
Anyone?
- Redevelopment of mature fields - Ghawar et al - where drilling new producers into the attic is used to temporarily stave off water production.
- Developing new fields - where a smaller number of horizontal producers can deliver more oil more quickly than a larger number of conventional vertical wells. The URR may be the same but with horizontals you get the return faster.
- Reaching stranded pools off shore from existing platforms using long reach horizontal drilling.
- Developing poor quality reservoirs - with poor permeability and poor reservoir connectivity, certain fields are non-commercial using vertical wells. Using horizontal wells provides a means of contacting several productive horizons with a single well and this can turn non-commercial oil and gas into a commercial development.
1 & 2 run the risk of a production cliff edge while 3 & 4 actually add to global reserves.Horizontal drilling makes many low permiability reservoirs increase their economic recovery by 300% or more, and the same is true for waterflood and gas pressure maintainence.
I'm not suggesting that this is true for all reservoirs, butI do believe that use of language such as extreme can taint the debate.
Re: "many reservoirs need "extreme" methods to be economicially viable..." and "Horizontal drilling makes many low permiability reservoirs increase their economic recovery by 300% or more..."
In the interest of everyone, be more specific. It's not clear to me whether some deepwater wells can be produced in any other way or even if alternative methods have been developed and tried. And what about onshore drilling? When you've got a hammer, everything looks like a nail.
Any aggressive production technique or approach that is meant to increase short-term recovery rates...
I'm not an engineer, I am a landman. In other words I help contract with landowners to get the property to drill oil wells.
But, horizontal drilling has made a lot of areas economic, such as the Austin Chalk or the Barnett shale. As was pointed out above, pressure maintainence starts at day one on a lot of reservoirs.
The majors and the engineers claim that recovery has increased by 50% or more on reservoirs discovered now as opposed to oil fields that were drilled up in the 1920's. I cant prove that but I believe they are correct.
I feel that the real problem is population growth. There are at least 10 times as many oil consumers in the world as there were 50 years ago. We are looking at a very steep slope because of demand as well as the exhaustion of the big fields. There will still be a lot of oil produced in 20 or 30 years, just not nearly enough to satisfy demand no matter what the price.
Also, some reservoirs of heavy crude would not be economic at all without enhanced techniques. Look at Chevron's wells at Bakersfield that require steam to produce, or any of the tar sands that are going to save us all according to the majors.
I can't be specific about the math or what percentage of oil is produced with "extreme" techniques. I lack the knowlege, but I bet someone around TOD does have the info. I would love to know.
I would like to see any articles on the peaking of world light sweet crude.
Please check out this link:
http://www.opec.org/home/Monthly%20Oil%20Market%20Reports/2005/pdf/MR082005.pdf
It is the OPEC August 2005 report. Go to page 5 paragraph 2.
Basically they say that the future world refining capacity that is built should reflect the kind of crude being extracted, namely the heavier one.
Hope that this is the kind of information that you were looking out for.
Page 4 indicates that what growth has recently take place in light oil in the recent past is in light sour oil. Page 5 indicates that growth outside OPEC in the 2007 to 2010 period is expected to be predominantly medium, balanced between sweet and sour. OPEC capacity expansions in the same period are expected to be overwhelmingly medium and heavy and predominantly sour.
Makes sense to me, we have had a very long history of short-changing the future for short term gain..
You have a bottle of soda. You can only invest a limited amount of movement into the bottle to empty it.
Do you:
- Shake it hard, then open it and capture the gusher
- Open it and slowly tilt it sideways
pushing a field too hard means you will strand hydrocarbons. Somewhere you have to balance the cost of running the extraction equipment VS the resulting gain from the hydrocarbon.Wow! That's an increase of about 2 million barrels per day, each year, for the next four years. This guy is far more optimistic, in the short run, than either the IEA or the EIA. We haven't averaged a 2 million barrel per day gain, over 4 years, since the seventies. Now we are going to suddenly spurt up by 2 million barrels per day, for four years running, just when it looks like we are plateauing out?
But it just ain't gonna happen. That just defies common sense that we would suddenly start to spurt up that dramatically just when things are getting very tight.
T. Boone Pickens says we will never produce more than 85 million barrels per day. I would be more cautious and say we will never produce more than 86 mb/d. But 92 to 94 mb/d is absolutely ridiculous.
But that is all liquids. I track only crude plus condensate. We are currently at 73,594,000 barrels per day, down 753,000 barrels per day from last December. I predict we will never hit 75 million barrels per day, crude + condensate. And I feel very confident in that prediction.
Peak calendar year for oil will be 2006. Peak month for oil just may have been December 2005.
http://www.eia.doe.gov/ipm/contents.html
Click on:
1. Petroleum (Oil) Production
And this brings up:
http://www.eia.doe.gov/ipm/supply.html
Click on 1.1a for OPEC
Click on 1.1b for half the rest of the world and
Click on 1.1c for the rest plus world totals.
Frankly, I find it pretty amazing that big exporters like Saudi Arabia, Russia, Norway, Kuwait and Iran - countries that have highly centralised administrations - are not trying to reduce their exports in order to prolong the life of their fields.
I can only presume that they are afraid that if they openly declare this to be their new policy, they may be forced to make an about-turn.
Perhaps I am missing something and some of you may enlighten me?
IMHO, Norway is the most extreme example, they have a fund for future generations that is largely controlled by foreign investment bankers. I mean, they are swapping oil now for paper futures. How very odd!This project will displace Argentine natural gas in producing electricity for Chile and they are looking at another scheme just down river.
They have a series of these around the world.
IMHO, a good place to invest some of their oil wealth.
Correct me if I am wrong, but aren't a lot of Chilean rivers sourced from melting glaciers in the Andes? I have seen postings about how GW is making these glaciers melt faster--which temporarily increases river flow, but then the rivers will be reduced to mere trickles at some future point as these glaciers disappear Excellent before and after photos.
This would mean that these run-of-the-river hydroplants may have a shorter useful lifetime than expected. Do the engineers take sudden glacial outbursts called johkulaups into consideration? A huge downstream flood with rocks, mud, logs, and ice could quickly scour out an in-flow hydroplant.
Bob Shaw in Phx,AZ Are Humans Smarter than Yeast?
This is a reason that geographic diverity is desireable. Overall, GW should increase global precipitation.
Norwegian mountains are quite similar to Chilean mountains and the Norwegians are good, experienced engineers. Intakes have to be properly engineered.
This project expects to get maximum energy during the spring, from melting winter snows that do not go into glaciers. Glacial melt maxes in late summer. Add lower altitide rain.
On the map, the river takes a "C" curve and drops a couple of hundred meters in a series of rapids. The run-of-river "short circuits" the two ends of the "C" and takes (typically) 90% of the water (more water naturally added along the way to the river) in it's tunnel and returns the water to the river. Minimum environmental effect. Energy once lost to rapids now displaces Argentine NG.
As I noted earlier, at the Peak Oil debate to be broadcast on PBS, the energy consultant from Houston (recommended by Saudi Aramco) repeatedly suggested that exporters are going to start curtailing production (and exports). I wonder if the Saudis are sending a message. I expect to see more news releases from the Saudis stating that their production is down--but that the production decline is voluntary.
In regard to decline rates, I expect to see a somewhat gradual decline in world oil production, somewhat similar to the Lower 48, but I expect to see a very rapid decline in net export capacity, with a corresponding round of continuing auctions for declining net export capacity.
-Ptone
I find it fairly logical since their oilfields are off shore and off shore facilities must be high maintainance and have limited life lenght compared with on shore facilities. If they produce their fields slowly they will have to reinvest in new facilities to get all of the oil. This only makes sense with extreme oil prices. The big question for them is how fast they should invest in production in new oil and gas fields.
From my point of view they seem to be investing a lot in infrastructure and spending on keeping the kind of all encompassing social support system Sweden had running.
They use a lot of money to keep all of Norway functioning while Swedens population is contracting to larger towns. This has given fairly large sales of essentially abandoned 2-3 story apartments and individual houses in small towns with failed industries to Norwegians as summer cottages. This makes morse sense then tearing them down to avoid eyesores. They are very welcome to buy more of Sweden. ;-)
The invest abroad policy is also intended to keep the local economy from overheating. But there is anyway a massive border trade of Norwegians buying alcohol and foodstuff in Sweden, they have a higher price level and even higher alcohol tax. (And Swedes buy their alcohol I Finland, Denmark and Germany. )
I guess Don Sailorman could smuggle alcohol by sea to Norway. :-)
Norway is about as mountainous as Switzerland, not as high but more corrugated with all the deep fjords. They have an almost unlimited need for tunnels and a lot of the oil wealth is invested in bedrock tunnels. Rail investments seems to have picked up in recent years, earlier it were all roads since their road system were very weak and they still have narrow roads and will probably have them forever due to geography. Manny Norwegians find Sweden to be road speed heaven with wide straight roads and few police, Swedes who like high speeds travel to Germany for good roads, no max speed and hope to find early non congested hours.
The few highway police "problem" in Sweden is currently being solved by massive installation of automated speed recording cameras who seem to lower the average road speed by about 8 km/h where they are installed. Optimists thinks this could halve the number of fatal accidents but 1/4 would be good. The problem is now how to fine foreigners automatically and there is a cooperation between the nordic countries, the rest of the problem is so far unsolved.
I am going of on a tanget here but there is definately an "1984" big brother trend here. As accidents get fewer people expect roads to be safe and demand that the remaining problems should be solved. I expect we will get some kind of almost total speed and car handling monitoring within a near future. Such would have caught me with some mistakes but I anyway like the idea, they are after all public roads for other people to transport themselvs, not private roads for playing. This will be very much cheaper then motorways/highways everywhere.
Another trend here is to build large sections of sometimes slightly widened roads with direction separating wire fences, this and getting rid of boulders and fencing off hard objects along the road side lowers the ammount of accidents. I think the idea comes from UK. One drawback is that these fences could grate motorcyclists into a paste but this has hardly happened, probably due to motorcyclists being paranoid. Another unverified rumour is that some suicidal people have aimed for truck fronts when there no longer are any rock outcropings along the road suitable as goals for a sudden stop.
Getting this back to PO I think there is a minor benefit in fuel consumption in getting people from speeding and edging the normal cruise speed up and a major one in making roads safer and thus make light and fuel efficient wehicles safer.
And getting back to trains the original railway boom started while Sweden and Norway were (forcibly but probably economicaly good for both parties in that era) united and it were thus made with the same standards. This cooperation have lingered but now Sweden is leading in railway investments and adopting a wider load profile and so on. I am curious if Norway will follow this example, it would make logistical sense even if it is expensive. I also wonder if it would be possible to get Norwegian state money to finance part of better rail infrastructure thru Sweden and Denmark to Germany. It could make economical sense for them.
[Excuse me now while I go throw up.]
Good God this is depressing!
Though it took you 2800 words and a number of nice charts, what you have said is total common sense. In essense, oil is finite, pull it out faster and the peak comes faster, pull it out with advanced techniques and the fall is faster.
This is common sense and knowledge. I've said this in earlier posts regarding the Yibal and am glad to see others also acknowledging this emminent collapse.
I see the ASPO 1500 day countdown as generous. But that is often the way of scientists and those who are enmired in the politics of academia. Prudence is often the better part of tenure. Old habits are hard to shake.
As I need not worry about tenure, having never been trained to that bit, I will come out and say it -- the collapse will be inaguable within 800 days, and will actually begin within 500 days.
This does not mean that social and economic dislocation will hold off or remain marginal until some magic day when the starter fires his gun and all hell breaks for the first turn. I imagine that our beloved leaders will gin up some sort of cluster rape of the international "peace" such as it is and send us even further down the millenialist, neo-con, rabbit hole than anyone could ever envision.
In other words, we may reach peak civilization before we reach peak oil.
Could the singularitarians tell us what kind of stuff they drink or smoke?
Thus we too could enjoy the last days of the party.
The singularity, BTW, is just the geek version of the rapture.
Well, I will excuse people from the former Soviet Union, Yugoslavia, Iraq, Palestine, and Afghanistan for thinking otherwise, but from the perspective of the elite professional/investing class of "the west", the late 1990s were as good as it got. Despite NATO's barbaric depleted uranium attacks on Yugoslavia, most globalized citizens enjoyed peace, freedom of movement, and improving prosperity.
(For American wage earners the early 1970s - after the draft ended and before the oil shock - were as good as it got.)
I would argue that the decline of the values of "civilization" over the past 5 years has been steeper than the oil flow decline of Yibal. If you want to know when TSHTF, don't look ahead, look in the rear view mirror. Many things are only clear in retrospect. In 1946, many Germans would agree that 1933 was the start of something disasterous. But if you asked Germans in 1938, back then the majority still thought that 1933 was the start of something wonderful.
I like this sentence of yours: "... until some magic day when the starter fires his gun and all hell breaks for the first turn."
When I read this the first thing that popped into my mind was an image of 50 SUV-driving soccer moms with 150 kids barreling NASCAR style into a huge first turn pileup in frantic desperation for the very last ever 'blue light special' at the neighborhood big-box store.
Bob Shaw in Phx,Az Are Humans Smarter than Yeast?
Allstate Insurance was rewarding Milwaukeeans for having the safest driving records among the company's insured drivers in midsize cities. But the event generated a two-mile line, minor accidents and a few arrests among those in line, though hundreds of drivers patiently and peacefully waited for their 10 gallon fills.
As always, well researched and well written. I do believe, however, that there are several factors that will mitigate a steep decline in world wide production.
- Demand destruction and behavior modification from extreme price moves. This was seen in '79 and will likely be seen again as we move into the $80+/bbl world. This will provide a little of Yergin's undulating plateau - probably only one undulation though.
- The shear diversity of the types and geographical diversity of production will strongly mitigate the worldwide profile mimicing steep falls we see in a depleting field or basin.
Also, what you call extreme production measures I would call (in many cases you cite) good oil field management. Trying to get the most out of any field using any available and economic technology is a petroleum engineer's job. If we could get 50% to 60% recovery out of most oil fields we would not be worrying about Peak Oil for a while (or at least we wouldn't be worrying about a steep downward curve on the backside of Hubbert's Peak). My concern, from a perspective within the industry, is the lack of applying more radical measures on our existing fields, because we pretend not to see the urgency.Yeah, I know, I know! That's the problem.
Thanks for commenting.
-- Dave
http://www.theoildrum.com/story/2006/7/12/10421/4972
You must either increase the pressure...somehow...in a field or else put in down-hole pumps. And there is always natural water below the oil.
And I don't know that water injection decreases cumulative production if it is done right. That is, if the field is not overproduced.
The way that Petroleum Engineers make a living is maximizing the production from each individual well. And the science has changed a lot and become much better in my life. Its just not going to save us, there is a finite amount of grease and people just keep having more babies, while everyone in the world wants the lifestyle of the rich countries.
We are seeing huge increases in the previously underdeveloped world of new oil dependent transportation. There are a lot of people in China that are sick of riding bikes, and have the new cars to prove it. I am not sure that was the case in the late seventies.
One difference between the 1970s and 1980s and today, is the "Big Fat Man" of world oil consumption was actively building Urban Rail back then* (with 80% Federal match funding), but he is exercising birth control today (see recent posts on selected cities).
*DC Metro, SF Bay BART, Atlanta MARTA, San Diego Trolley, Portland, NYC new line Manhatten-Queens, St. Louis, First 21 miles in Miami, Sacramento from memory
I believe that people in China, India, Mexico, etc. will change their behavior as more and more of their discretionary income is eaten up by the price of keeping their car moving up and down the road. We are starting from a much higher production/consumption level than we were at in '78, and more people in the world are consumers, but I suspect that the "laws" of supply and demand (even for a substance with fairly inelastic demand such as oil) still apply.
The Hubbert model is a good empirical description, but it isn't a full-blown theory. We fit curves to a small data set, and see which curve fits best--with no theory-based rationale for what we're doing. I'm getting increasingly uncomfortable with this. A Hubbert model, when it is in its smooth post-peak form, implicitly assumes that the trend which is occurring now will continue into the future until it stops. Fine, if it's true.
What could modify the trend? Almost any geological, political, or economic factor, unfortunately. "Extreme recovery methods" could certainly change the shape of the curve. If the tail of the curve is smooth, a Hubbert model will predict just fine. If, however, there is a point of inflection, and the trend in the tail becomes nonlinear (either up, or much more likely, down), the model will be wrong.
The same issue of assumptions occurs outside the Hubbert framework as well. It's my recollection that Skrebowski has overestimated total world production in the past because of unexpectedly fast depletion of existing fields. Good method, bad assumption, faulty result.
On the plateau: World production output is simply the sum of individual wells, fields, countries and regions. If we have an average depletion of 8%, as Halliburton apparently projects, we need to find (or recover) a LOT of new oil to get to flat output, or even a 2% decline.
I hope we can, but it's not in the data that I'm looking at either. And that says peak, not plateau.
Campbell and Laherrere once were the spokesmen for Peakists ... until they revised upwards. Then Koppelaar was the new kid on the block ... until he revised upwards. Finally Skrebowski came forward as torch bearer ... but was unceremoniously dumped as he also revised upwards.
I correspond with each of them and they all agree that one cannot produce production outlooks w/o addressing the exhaustion of URR. 1+1=2. Except for the fatalist camp that has become a sorry entrenchment at TOD. It is a component of TOD that is increasingly dismissive of data and in its stead uses anecdotal baloney.
I was a late piler on a similar thread last sunday. Sorry for the cross posting but it addresses the futility of listeining to the nihilists:
Freddy Hutter on Sunday July 16, 2006 at 1:16 PM PST:
When we discuss the mathematics of net oil depletion, it is clear from these discussions that many do not fully understand the relationship between URR and production outlooks. To speak of 8% or 5% or 10% depletion rates is ok wrt fields and maybe nations, but u can use this rhetoric on the global level w/o jeopardizing one's credibility.
When i look at probably the only three gentlemen that have studied this (Leherrere, Campbell, Koppelaar), they can approach the issue two ways. Calculate the future use component of URR and target the production rates to get there, or vice versa: calculate the bottom up production rates and total that ultimate extraction volume to come up with remaing oil component of URR.
Looking at all liquids, these modelers have come up with URR's of 3-Tb, 2.45-Tb & 2.5-Tb respectively... as compared to our all-models average of 2.992-Tb. And please remember, URR is the estimate of feasibily removable oil ... not all oil in the ground. The latter is estimated to be about 8-Tb. To exhaust that recoverable oil over the next 150 years, the same modelers are using avg net depletion rates of 2.8%, 2.6% & 2.8% respectively. Not 5%. Not 8% Not 10%. Granted their overall avg net depletion rates are compilation of several rates thru the decades, but in general terms, which is what the rhetoric at TOD encompasses, it is foolhardy to speak of aggresive net depletion rates w/o addressing the concept of URR.
To be more clear, if we use the easily accessible data of ASPO, to use a 5% net depletion rate of 5% would in fact afford only a URR of 1.819-Tb. Almost 600-
Gb of what we define of "recoverable oil" would be stranded. URR becomes an oxymoron. ASPO currently foresees 1407-Gb of oil for future use. A 5% depletion rate would mean that almost half Campbell's estimate will never be extracted. Ridiculous and an insult to all his thankless efforts.
A 8% depletion rate after peak would leave 875-Gb stranded. 10% equates to 956-Tb of stranded oil.
Thus those proposing 8% depletion after peak are proponents of a 1.75-Tb URR. To put this in perspective, the lowest current estimate (conservative) of URR that i am aware of is 2.187-Tb by OPEC.
In translation: guess A and pretend your guess is based on B, or the other way round.
Hubbert linearizations tell us about K = the rate of depletion and the expected URR once the production data have "settled" into the linear regime. It assumes incremental flows will follow the linearization. I have reasons to call this assumption into question for the specific cases I discussed. In particular, deepwater or ultra-deepwater production may not be amenable to Hubbert analysis although the UK and Norway as a whole seem to fit very well. But the North Sea basin is mostly shallow and mimics onshore production. The Magnus field I referenced does not. There is no deep reason why Hubbert Linearizations work -- they are empirical studies that seem to fit reality. Nobody really understands why they usually provide a good fit matching reality. Hubbert didn't, Stuart doesn't and neither do I. However, if they have made good predictions in the past (eg. the US lower 48), then you can start to trust modelled predictions in the future. However, countries like Brazil, Angola and increasingly Nigeria who are mostly deepwater producers that may not fit this pattern in the future. It's a new paradigm. Or least that's the claim I'm making in this case. Everything is open for discussion.
That said, I don't give a **** about the URR. I am interested in the ceiling value of N measured in million barrels per day and incremental flows. Rapid depletion is a big part of that value. When Duffeyes says he's a historian because the world has crossed the halfway mark of global URR, I'm mildly amused. There's lots of hydrocarbons out there but looking at unconventional production like the tar sands, I am not (and should not be) convinced about it, as I said here. Tabulating idealized projections from Koppelaar, the EIA, the IEA, CERA, even Skrebowski, is a long way off from describing reality -- which I'm trying to get a handle on.
The dangers of empiricism A story from Bertrand Russell, mathematician, philosopher, and Nobel laureate: There is a farm where every morning the same scenario unfolds. The sun rises, the back door of the farmhouse opens, and the farmer strolls down the path to the turkey pen. He fills a pail with water, feeds the turkey, and leaves. The turkey watches this occur, day in, day out, over and over again. He concludes, based on past evidence, that every morning the farmer will come, offer water and food, and leave until the next morning. Then one particular morning in late November, the sun rises, the back door of the farm house opens, and the farmer strolls down the path and chops the turkey's head off.
Empirical evidence is right until it's wrong. Pointing out cases in which our implicit assumptions in the Hubbert model don't hold is important. It helps us to build a stronger theory of what might occur.
There may be 7 trillion barrels of oil in the Canadian Tar sands, but is it ever going to get us to 120mbd?
I believe we are facing a sharp drop-off of global oil production which will start fairly steeply, but then tail off in an exponential decay type pattern. That will allow the URR figures that people bandy around, but I think it will take us a long time (100 years?) to get to those URRs.
Too much of today's daily oil production comes from very large fields that could collapse like Yibal.
Nobody can take my musings serious? If nobody = you, then surely that's the case. But I see you didn't understand my response at all, did you? About the value of estimating the URR as opposed to looking at maximum daily production and achieving incremental flows.
Also, see Rick's post on the fallacy of induction (Bertrand Russell). I will add that it was not my intention in this post to knock Hubbert Linearizations. This kind of modelling is useful tool we can deploy to understand the realities of oil production going forward. A point I'm trying to make is that there's a new game afoot.
What Rick said, annotation added for clarity:
"World production output is simply the sum of individual wells, fields, countries and regions. If we have an average depletion of 8% [of existing individual wells, fields, countries and regions], as Halliburton apparently projects, we need to find (or recover) a LOT of new oil to get to flat output, or even a 2% decline."
And if I understand your main point, it is that we can't experience a fast decline in output because it would make our estimates of URR wrong.
Whatever. And thanks for your courtesy!
The most recent work on net depletion is being done by Skrebowski in his Megaproject Updates. While we collaborated somewhat on his ASPO5 presentation wrt to his outlook on post peak depletion, i am reluctant to comment on his targets that were given in confidence until i view the transcript of his subsequent delivered presentation in Italy. I would not be surpised if he refused to comment on post peak depletion on the global scale.
I will say that our July presenation of his model in our 2006 Scenarios was modified drastically from its Draft when he saw the effects of moderate net depletion rates. All the modelers use a blend of depletion rates to compromise between field depletion and new production. Thus, with time the average rises.
But i am confident that Chris will not utter "avg net global depletion rates" that approach 5%.
And herein may lie the problem. Pessimists freely use the aggresive mature field rate in global discussions.
We should see "average net global depletion" that is slower at first. However, long term, the only way we can get a total global depletion rate slower than the average individual field rate is if new production of significant size comes into the base (such as Skrebowski's megaprojects).
"All the modelers use a blend of depletion rates to compromise between field depletion and new production. Thus, with time the average rises."
I think we agree here. As the size of new projects falls, as it must because discoveries are smaller, the global rate of depletion will increase towards the average field rate even if individual field depletion doesn't accelerate. And if EOR techniques accelerate depletion, as Dave suggests it may, production rates will head down even faster.
Depletion rate(t)= K*Q(t)/URR
so the logistic-based depletion rate is not a constant and is in fact dynamic.
My understanding of David's post is that he's talking about regular oil depletion (as defined by the ASPO) therefore URR for all liquids should not be used.
The HL plots that I have seen for the world are pretty objective. All of the HL plots that I have seen have been in close proximity to each other for Qt.
The Lower 48 and the North Sea peaked right around 50% of Qt. Russia peaked in a broad plateau centered on 50% of Qt, in 1984.
The post-1970 Lower 48 cumulative production data and the post-1984 Russian cumulative production data have closely fit the HL predictions (using only production data through 1970 and 1984).
Based on Khebab's HL plot, Mexico is at the 50% mark, and they have started reporting production declines.
Based on Deffeyes' HL plot, the world crossed the 50% mark in late 2005, and the EIA reports that world crude + condensate production is down 1% since December.
I am not aware of any other predictive technique that has anything like this track record.
Here's my point: the production achieved from a given well or region (and hence the Hubbert curve that represents this) is a funtion of:
- geology (size, age, permeability, pressure, drilling and recovery techniques, etc.)
- economics (oil demand, price, interest rates, availability of capital, etc.)
- logistics (rig availability, pipelines, tankers, refinery capacity, etc.)
If these factors are pretty constant, the trends will be smooth. But we can affect production rate by what we do: cap a few wells, or drill more, or use EOR and pump harder, or refuse to export. It may not affect the URR we achieve by very much (if you don't damage the reservoir). But it will affect production rate, and a Hubbert model will be sensitive to the change (and perhaps wrong). We just get lucky that the conditions are usually constant, or shifting at a fairly steady rate.Look at the places where a smooth Hubbertian curve doesn't fit, like the kinks in the world curve in the 70's and 80's, or the "Russian twin peaks." The model is fine as far as it goes--but the data doesn't fit because this simple model can't adjust for economic and/or political factors.
Consider also most Hubbert linearisations. The late data fits like a glove, because we are extracting as much oil as we can as fast as we can. The early data is very choppy, probably because of market factors (such as the Texas Railway Commission), while the later data is a smooth geologic decline with no regulatory influence, selling into a market that will absorb every drop.
I agree that a Hubbert model can give a great production rate prediction post-peak. If the system all holds together, it will also give a good URR prediction. But if conditions change, the model will adapt only after we get a few data points (usually years, sadly) that incorporate the new trend. I think this is Dave's point also.
But the Hubbert model gives us prediction only, and it is at its best only in the late part of the production cycle. We don't have the rationale for why it works, nor can we look at the effects of changing conditions. Most hard and social sciences left this simple sort of trend modeling behind decades ago. Yes, it works to predict, but we should be able to do more explanation.
I will add that there's a basic incompatibility between the conjectures of Robert Hirsch and Stuart's slow squeeze based on linearizations. As for Skrebowski's 92.0 to 94.0/mbd by late 2010, I can only reiterate what someone else said on this thread -- that this projection requires about 2.0/mbd of new production to come onstream every year between not and then. I find this estimate completely implausible.
I agree with you. It is called Hubbert's model, not Hubberts Law. That in essence acknowledges the fact that there is no claim to be perfectly accurate, but its a useful tool. In my days working in physics we would add a second term into the function to model the EOR techniques, but even this would be JUST A MODEL. There is nothing wrong with this as it is the best we have and it gives a good first approximation. I think everyone here understands the limitations of HL as it seems to get discussed every day.
Regards.
Again, at my request, Khebab took the Lower 48 production data through 1970 and the Russian production data through 1984 and constructed post-1970 Lower 48 and post-1984 Russian production profiles. As you can tell, Khebab is an objective scientist. He just did a linear fit to the data, generated the predicted curves (with no expectation of how the results would turn out), and we then compared actual to predicted.
Through 2004, the post-1970 Lower 48 cumulative production was 99% of what the HL model predicted.
Through 2004, the post-1984 Russian cumulative production was 95% of what the HL model predicted.
The world is now where these two large regions (and the North Sea) were when they peaked and/or plateaued.
My bet is for a gradual decline in world oil production, similar to the Lower 48, with very rapid declines in world oil exports.
Given the delta between the current Russian production and the lower HL predicted production, when is it likely that that extra 5% be produced ? And cumulative post-1984 Russian production will = 100% of HL predictions ?
The blogpost
http://energikrise.blogspot.com/
Has a recent posting with some excellent diagrams (in English and click able for improved viewing) illustrating how oil production in Norway now is declining.
One of the diagrams illustrates how fields starting to flow post 2001 partly have offset the declines from the mature base. The mature base, is in the posting described as those fields that were flowing prior to Dec. 31 2001, have experienced accelerating decline rates that presently is documented to total close to 15 % year over year (second diagram). The diagram for the year over year decline rates also includes a 12 MMA smoothed curve.
Norwegian oil (regular) production peaked in 2001 at 3,12 Mb/d.
Preliminary data from NPD (Norwegian Petroleum Directorate) puts production at 2,26 Mb/d for June, lowered mainly due to scheduled maintenance.
The diagrams are based upon the latest published NPD field-by-field data.
Profiled energy analysts, like Matthew R. Simmons, have for a while predicted this would happen to fields that have applied the latest "state of the art" technologies assist drainage.
As of now it is hard to tell if this accelerating trend of production declines will continue into the future.
It is the prediction of the decline rates that makes it challenging to predict the down slope from the "Peak", which also Hirsch so elegantly has expressed.
This makes one wonder what shape the initial down slope for global oil production will look like; a smooth decline or more like a wave crest?
The Saudi's are using seawater because they did not reinject the water for many years and they are trying to rectify this situation, plus they need to replace the volume of fluid produced from the reservoir. It's cheap and available from the Persian Gulf.
As far as separation technology, oil companies can make money with as little as a 1% oil cut in the emulsion. The do this by gravity-letting the water settle out in a tank as oil floats on water, by using a surficant chemical to cut the oil loose or by using heat to make the water and oil seperate. It works pretty good,but I wouldn't suggest drinking it.
Another reason water is injected in the formation is that it disposes of the water in an environmentaly responsible manner. Until the mid-sixties an operator could dump the water in a pit to evaporate or in a creek or river here in Texas.
"Future production is now in doubt due to investor uncertainty, unprofitable economics and logistical impossibilities. One can wonder whether a slower, smaller phased development would have been better but that is The Road Not Taken."
I wonder some days how this crosses over to all areas of the economy, with the race on equipment for EPM's and drilling rigs, new refineries and expansions, tar sands, ethanol plants and etc etc. A business as usual approach to our capitol infrastructure based on short term profit, the costs appear to be rising faster than the logistical infrastructure can be completed as predicted by others. This one piece of a plant says a lot of what it takes in time and materials just to move it with the imbedded energy locked away in it with no real thought to the EROI.
http://www.perkinsonline.com/images/Ethanol%20PR.pdf
A peak oil cliff seems the most probable event with exponential cost increases in most everything for a time until people realize there is no going back or the situation getting better(alternatives will not ramp)which will be followed by a crash, IMHO. What is "The Road Not Taken" that we should be taking, that is the question I ask myself and look to TOD for possible answers? I read as much as I can and really value everyone's input.
After having spent the past 3 weeks watching cycling on TV, it strikes me that what you are describing in relation to oilfields reminds me a lot of the concept of bonking:
http://en.wikipedia.org/wiki/Bonk_%28condition%29
perhaps this is a useful metaphor.
Bonking seems to require a fair amount of athleticism in the first place, and pretty darned low body fat, which you've lost in the process of becoming very athletic. Some blame it on the loss of glycogen in the liver, others on the loss of fatty acids that your body uses as fuel, everyone who's been there agrees, the European bicycle racers' term "the man with the hammer" is a good one. You feel like you've been hit with a hammer! All you can do is poop along in a very low gear, and you feel like you're on autopilot. Or you just fall over. A burrito or something and some rest, preferably for hours, is the cure. Racers can't do that so they just eat constantly.
I've bonked in biking and also as a young adolescent, where the factors of walking/hiking, lack of food, and a body determined to try to put some growth on intersected.
To the average American, imagine no gas no SUV no bike, no lights in your house, walk to the bus stop but why bother there's no bus so just walk where you're going, oh yeah and no money for pizza. You're thrown into getting along on the minimum of energy.
Yes, the plateau may mark the top of the bell curve, and then it will be the peak. However, on the figures alone, one cannot exclude a wiggle up again. (I agree that the more detailed breakdown supports December 2005 for the Peak.)
I'd say much of the conversation on here overall is about extreme production, what else do you call seriously considering using Fischer-Tropf, ethanol grown organically for lack of petrochemical fertilizer, wind-powered trains for God's sake? Americans getting down to a somewhat normal energy useage is like asking Michael Moore to trim down to 160.
Read your post in some detail - and liked it - and skimmed the rest. Your most significant figure is figure 2. This I think is in the real world and it is possible that many super giants are now sitting on top of the extended hill. We had a long debate a few days back with Khebab about Stuart's Romanian post. DuncanK posted an HL for Yibal showing a dog leg that turns sharply down that I believe is a represntation of your "EPM". Nitogen injection in Cantarell is an example of "desperate measures" to retain reservoir pressuer above bubble point. And very successful too for a number of years and many bbls - but eventually the stuff you inject gets to your perforations and the fairytale comes to an end - very abruptly. DuncanK's HL on Yibal showed that the EPM measures there got more oil earlier (at a lower price of course) but that URR was probably not changed. I hope that Stuart pursues this one when he gest back from the mountains.
Only bit of technical info I can add is about the bp operated Magnus field. Magnus lies to the east of the Shetland Islands in the North Sea - it is one of the most northerly fields. bp built a gas pipeline from the Foinaven / Schiehallion Fields which lie on the Atlantic Margin to the west of Shteland to provide injection gas to Magnus - which one day they will re-produce and pipe southwards. This is pretty major investment for Magnus - which is a medium sized field - but I think this comes into the category of EPM - though for bp this clearly makes commercial sense.
I'm loking at the 2004 Campbell / Aspo scenario which shows peak around 2006 at 31 Gb per year. This works out at about 84.9 million bpd. This is close to current levels. How to get this to 94 million bpd? Where from? With most major basins in decline someone needs to pull a rabbit from the hat. The Saudis may well add 2 to 3 million new barrels / day in the next 5 years - but they need to take into account falling production they may experience in existing fields - that could well result in a net decline. In 2005 it was only Suadi and Russia that kept the world afloat and so far this year Russia's exports are declining - owning to higher domestic consumption.
I like Campbell's top down and bottom up approach - best to approach a complex problem from differnt angles.
So the bar has been raised and moved further out - once again?
I've just had a look at Chris Skrebowskis' mega projects report (Dave provides the link in his post) and find this to be one of the most useful sources I've come across recently. This shows a lot of new oil comming on from Brazil, Caspian and ME OPEC. I guess the main issue is to what extent the capacity erosion forecasts are accurate and to what extent the new supply gets delivered - though Skrebowski does erode the new supply figures for project slipage and capacity shortfalls.
- Annual Nat'l gas (47-mbd - Oil Equivalent)
- Processing Gains (it was 2-mbd back then)
- Total Liquids (84-mbd)
- Total Hydrocarbons (131-mbd)
Since mid 2004 he has dropped the Total Hydrocarbons in his table presentation albeit remains in his Depletion Model Graph.For comparison, last week's IEA Medium Term Outlook forecasts that refining capacity will rise 11.7-mbd by 2011 and see OPEC spare capacity rise to upwards of 6.8-mbd in the interim (from 3-mbd today). Bodes well for dampened pricing in the 2008-2010 era.
Obviously my faith is with those who crunch the numbers ... not blowhards with an agenda.
Where was that HL plot of Yibal?
Thanks,
New Era Investor
http://www.theoildrum.com/story/2006/7/9/134211/8155#more
Thanks Dave.
This is exactly what I was alluding to about EOR skewing the production curve and giving us much sharper declines (see comments here)
And, yes, HL plots give us a result that is too optimistic.
The graph above marked "Fig 2" says it all. We could be pushing the production curve upward and creating a cliff that we are going to fall off.
We really need to quantify how many of the super-giant and giant fields could be on the verge of this kind of collapse.
See my comment above in reply to Dave's comment about URR figures.
I believe we are heading for a steep decline followed by an exponential decay of oil production, the tail of which will be many decades long.
There will always be dribs-and-drabs of oil around the place to extract, but these large fields are giving us the high production we see today.
BTW, I'm heading over to Bonny Scotland at the end of this week to visit my folks for two weeks. Please keep up the fight about these sharp declines while I'm away. :)
Cheers, Duncan
Forgive me, as I am no expert, but could you or some other TODer answer a few questions?
When the Yibal field in Oman started it postPeak geologic depletion of dropping like a rock-- why didn't the country's leaders choke production to maximize export price/barrel? Why didn't the professional managers [SHELL, as I recall] advise them to limit their decreasing production as even Shell would profit more from this strategy? This seems like a blatant violation of common-sense.
Or is there some political or military reason that made Oman pump and sell every barrel as fast as possible? I am trying to understand why Oman CHOSE TO KEEP DRIVING DOWN THE CLIFF. Does the need for cash flow trump any rational consideration of hoarding?
TODer Westexas's Exportland Theory says the producers should be reducing exports as internal consumption rises, but have any countries that are now postPeak done this? Did Indonesia [now an importer] choke production and export amounts to try and slow their downslope decline, or did they just pump and export at the ever-decreasing maximum?
Another example, why is the US exporting NG to Mexico when the US decline signs have been obvious for so many years? When Cantarell & PEMEX start going belly-up: will something prevent them from hoarding? How come the US is not hoarding our internal reserves as Hubbert long ago suggested? Instead, it is burn, baby, burn!
Enhanced Production Methods [EPM] seem bad enough already in terms of how it skews the Hubbert Curve higher, but once a country slips to the downslope side: it seems they want the roller-coaster to go as fast and as steep as possible by maximizing the postPeak depletion rate even more.
In short, it is like starting to drink a beer with initial small sips, but moving to EOR gulps around the half-empty Peak, but then going for the EPM maximum OCTABONGtm 'chugging effort' to rapidly drain the last contents of the bottle. Gotta quickly get the last URR before it goes flat or warm!
Or have I got this all wrong?
Bob Shaw in Phx,Az Are Humans Smarter than Yeast?
This is not necessarily bad reservoir management but it is bad management of national resources. In effect you produce more oil earlier on and sell it at lower price.
My feeling is that the widespread use of horizontal producers has propped up world production (at the bidding of the OECD) and kept prices depressed for years now. The flip side is the production cliff edge that may be out there that could send prices spiraling up.
In answer to your second last question - no, I think you got the nail on the head.
In answer to your last question - probably no. You just need to look at US nat gas prices.
There are also tax considerations plus the details of the profit sharing agreement between Shell and Oman that can impact the assessment of whether to pump flat out or not.
Also, westexas does NOT say producers will reduce production. In fact, westexas does not care if they reduce production or not in his "exportland" model. What matters is that internal consumption in the producing nations rises. So assume that some country is producing 5 mbpd and in 2004 they consumed 1 mbpd of that, with 4 mbpd left to export. Then, in 2006 they may still produce 5 mbpd but consume 1.5 mbpd. Obviously they cannot export 4 mbpd anymore, can they? Instead they can only export 3.5 mbpd.
Now the nasty thing that happens is what if production goes down at the same time that internal consumption rises? So our fictional nation goes from producing 5 mbpd, consuming 1 mbpd, and exporting 4 mbpd in 2004 to producing 4.5 mbpd, consuming 1.5 mbpd, and exporting the remaining 3 mbpd (a 25% drop in exports).
The notion of voluntarily reducing production is another issue entirely.
Your Figure 2 is key in showing that peak production may occur some time after 50% of URR are produced. The HL guys need to take this message on board as this may lead them to underestimate the timing of world peak. Hubbert, after all did not know about how horizontal producers may distort basin-wide production profiles.
The flip side is that post peak decline (capacity erosion) may be more rapid than many bottom up analysts predict and this may lead them to over-estimate the timing of world peak.
There seems to be a growing consensus that peak oil may in fact be a peak and not a plateau. It is possible to envisage a scenario where a drop in Saudi production coincides with escalation of political tensions and a natural disaster - and that could be it - a million bpd lost, never to be recovered. Or is that what just happened - and things are about to improve? As you say, only time will tell.
So, Deffeyes could be right with peak last Dec while ASPO is right with peak in 2010 (now just 40 months away!), but Stuart is rightest with a plateau between the points. (Actually, the ASPO curve at Freddy's site looks just like a plateau during the current period, so maybe ASPO/Stuart are already in agreement.)
THoughts of an avg decline of 5-8% look way too high because most of the world's fields are not declining at this rate, and there is no reason to expect this to change even if some fields begin a relatively rapid descent.
(I do think of the exporters as the pussy cat chasing the bird/instant gratification - running horizontally off a cliff, and not falling/cutting output until looking down. Note its pretty easy to cut production if you have all the cash you need now, and your past experience in investing cash is not so good. OTOH, there's always a need to invest in swiss banks, useful following regime change.)