Well, could we linearize this, then?
Posted by Stuart Staniford on July 17, 2006 - 1:06am
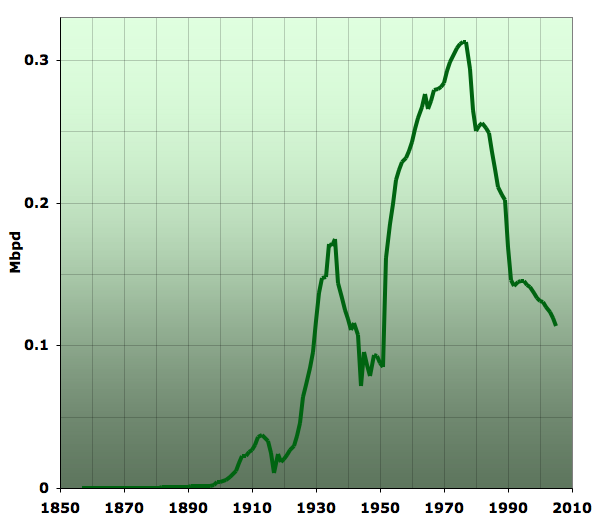
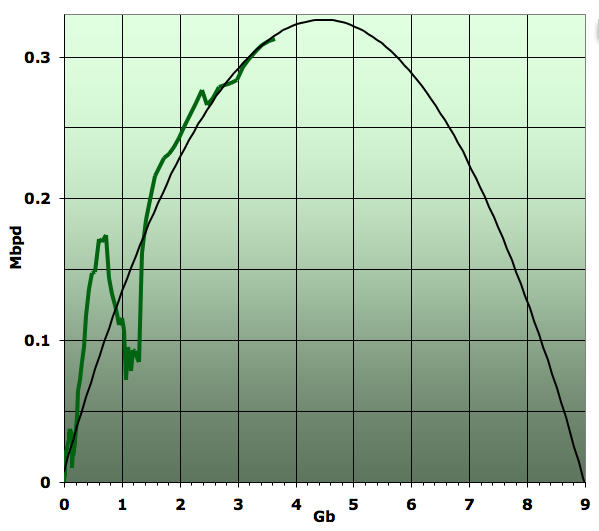
Following our discussion of Hubbert Linearization of the Middle East, I was inspired to take a quick look at Romania. Romania is similar to the US in that production began very early (in fact the world's first commercial-scale oil production occurred in Romania in 1857), and peaked in the 1970s (1976 was the year of peak production). However it differs in that the amount of production has never been that large - peaking at just over 300,000 barrels a day, an amount that a single large modern offshore platform might handle. It's also different in that the production profile (above) has been interrupted on a huge scale, especially by WWI and WWII, both of which caused an approximate 50% reduction in production.
Note that the scale on the bottom totals 160 years. The peak looks sharp, but really the peak is 30 years ago.
Thus the profile is at least as choppy as the Middle East. But it turns out that this does not render the curve-fitting methods useless, as you might imagine. Firstly, if one supposed that production followed some underlying dynamic that led to a Gaussian shape, then the log of production would follow an upturned parabola (quadratic):
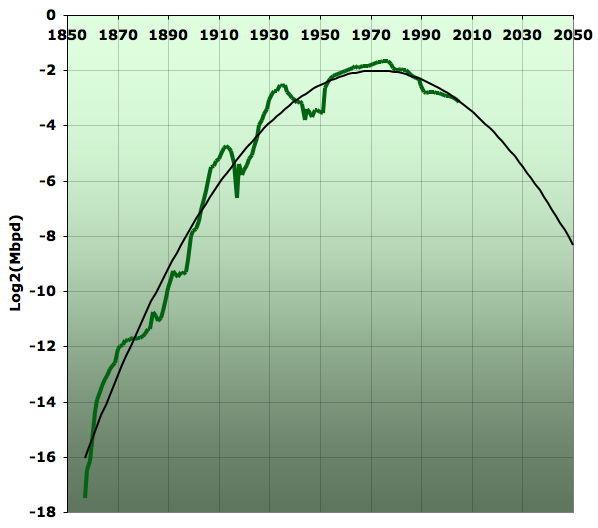
So it seems like the quadratic does about as good a job of modeling this as any smooth curve is likely to do with such a choppy time series. But could it have predicted anything, or does the noise just destabilize things too much? Well, I didn't have time to do a thorough investigation, but I checked at the peak year of 1976, and the Gaussian knew very well it was at the peak:
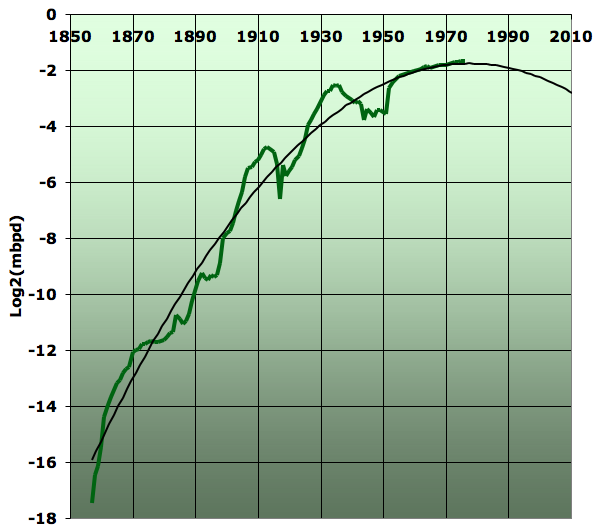
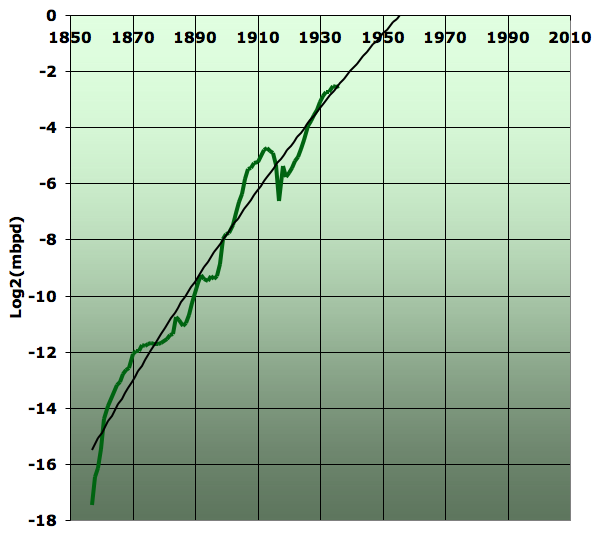
But maybe it would think that at previous points too? How about the pre-WWII peak in 1936? Well, it wasn't fooled. It knew perfectly well that wasn't the real peak, though it had a very poor idea at that stage of when the peak would be:
Ok, so how about the linearization? Well, as Laharrere has shown before, this is about the best poster child there is:
Not only would the linearization have given you about the right answer (or at least about the same answer it would give you today) at the peak in 1976, it would have been telling you pretty much the same answer from some point in the early 1960s on (I hedge a little since that falls in my missing data gap that I linearly interpolated). Also, this is the most mature country profile in the world, both because it started so early and also because the peak is narrower than the US peak (since K is around 6.7% versus the 5.6% for the US).
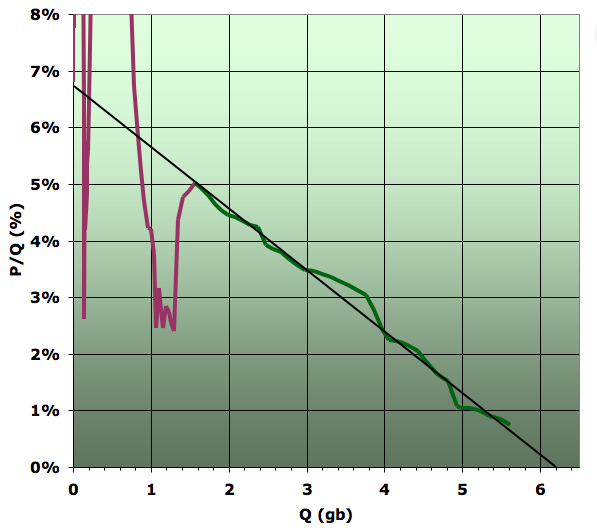
Next, I looked at the idea we explored the other day at the suggestion of WebHubbleTelescope of plotting P (annual production) against Q (cumulative production). Since the logistic differential equation is P = dQ/dt = KQ(1-Q), a plot of P versus Q should be a quadratic if the production was exactly Hubbertian. Again, this is very roughly true in Romania, though the production profile is so noisy that the fit is not as pretty as in the US case:

However, it predicts the same URR as the linearization. But it turns out that back at the peak it would have given you a much less clear idea of what was going on than either the linearization or the Gaussian fit to logP:
It's 50% higher on the URR estimate than a modern estimate would be, and also thinks the peak is still a decade away when in fact it has arrived.
So in Romania, linearization works despite a very choppy profile, and again it seems to be because the profile is roughly Gaussian (decorated with major ugly noise) and the linearization technique serves as a useful robust predictor in that situation. However, directly fitting the Gaussian in logP versus t space works quite well here also. Fitting the differential equation in P versus Q space works eventually but is less stable to noise early on.
< warning type="self promotion">
I make my living consulting for a high enough rate that I can afford to support a family and nonetheless contribute these posts to The Oil Drum pro-bono. If you have a project that you think could benefit from my skills and you would like to support this arrangement, talk to me -- Stuart Staniford.
</warning>
Contact
- Content: editors at theoildrum dot com
- Tech support: support at theoildrum dot com
License

This work is licensed under a Creative Commons Attribution-Share Alike 3.0 United States License.
I have been asked to be a panelist on a Peak Oil debate on the McCuistion program, which is in national syndication on PBS. They are taping this coming Tuesday night. I'm not sure when it will air.
Ed Blessing, with Blessing Petroleum, and I will be on the "Yes--we have peaked" side. A representative of ExxonMobil and an energy analyst recommended by Saudi Aramco will be on the No side. Michael Lynch is supposed to call in from Tokyo.
Does anyone know if Lynch has ever addressed Hubbert Linearization? As best that I can tell, the answer is no. Also, anyone have any good quotes by Lynch regarding production and price predictions?
Thanks,
Jeffrey Brown
Try this link:
http://www.gasresources.net/Lynch(Hubbert-Deffeyes).htm
sourced from Mobjectivist:
http://mobjectivist.blogspot.com/2006/01/linearization.html
I tried to do a 'Michael Lynch' archive search at the Yahoo: EnergyResources forum, but the server was down. He has a long history on this forum--great place to look for quotes. He also had a thread on this forum called "Michael Lynch - Disputing Peak Oil"
http://www.peakoil.com/post136763.html#136763
Good Luck!
Bob Shaw in Phx,AZ Are Humans Smarter than Yeast?
http://www.gasresources.net/Lynch(hubbert-deffeyes).htm
(hubbert-deffeyes).htm it works fine.
http://sepwww.stanford.edu/sep/jon/world-oil.dir/lynch/worldoil.html
http://groups.yahoo.com/group/energyresources/
Or you can contact the owner of the group, Tom Robertson, at:
t1r (at) bellatlantic.net
Good luck with your debate.
Ron Patterson
It is like saying France and Italy are in the world cup final; who will win?
There have been thirty other teams in the tournament. Each team had supporters predicting a victory. Each team was eliminated. All thirty predictions were wrong.
So obviously neither France nor Italy will win.
The market is telling us what is happening.
The New Pessimism about Petroleum Resources:
Debunking the Hubbert Model (and Hubbert Modelers) (warning: pdf file)
The paper is not new as I read it sometime last year.
Does anyone know if Lynch has an active web site? His EnergySEER, Strategic Energy & Economic Research, Inc. consultancy web site seems to be dormant.
COPING WITH OIL PRICE VOLATILITY: Welcome to the Roller Coaster (warning: pdf file)
In particular, see the last two slides. The first of these is titled "If pessimists are right" and the last is titled "If I'm right."
There are several other papers & presentations you might want to peruse. They are all here: http://www.energyseer.com/Presentations.html
I wonder what effect such a production pause had on eventual final recovery, since rate of production does seem to play a role in the eventual total able to be produced.
In which case, Rumania just might serve as an example to contrast long term production, at least in terms of 'rest periods' compared to what seem to be fairly modern, global practices of massive short term exploitation. In terms of offshore, this might make sense in a number of ways (for example, a shorter intensive production period also reduces the chance of a major incident involving oil at sea), but in terms of onshore, it might just be more proof that greed and short term thinking dominate - though was it here, or was it a Simmons presentation that talked about some Texas family which decided to produce oil from their land for the long term?
Of course, I doubt this would be practical (how do you control for technology? geologic particulars?), but it is something to think about.
And keeping with the tears of Allah theme, Rumania is currently one of the absolute poorest parts of Europe, and has been that way (more or less) since oil production began.
They have about 300,000 unexplored acres in the Frio, and Wilcox trends. The O'Connors are an extremely private family and very conservative in the good sense of being religeous and traditionalists not the NeoConartist sense. They have in my opinion the best unexplored acreage in the state, excepting the undrilled deep-seated salt dome under Memorial Park and River Oaks Country club in Houston.
This type of analysis is seriously the equal to that of Hansen of global warming fame, but has yet to take a foothold at that level of scrutiny. That has got to change pronto.
Whispers about WWIII have got me spooked something else.
Alas....for many in the world, WWIII has already arrived.
If all Florida votes had been recounted in 2000, Gore would have been sworn in in 2001. But we all know the sad tale of a corrupt Supreme Court that prevented that outcome.
For those that have not followed the electronic voting controversy, see www.bradblog.com .
As reported here before, I personally witnessed the ES&S electronic voting machines change Democratic votes to Republican votes during early voting in Dallas County, Texas for the 2004 general election.
If one lives in Mexico, this is how to protest a stolen election.
http://d.yimg.com/us.yimg.com/p/rids/20060716/i/r1029305457.jpg?x=380&y=179&sig=QiDjRkorpdTH yrC_e1ClMw--
Kudos to Stuart! What I found interesting is that Romania had a sharp production peak as visually presented in the first chart, but the production log chart [2nd graph] shows it as a 'peak plateau' for about twenty-five years {1950-1976}.
The question is: can that same phenomena be valid for world production too? Is that the reason for some Peakoil orgs, such as CERA, to say we will be on a gradual production upslope until about 2030?
The rest of the analysis seems to indicate HL is very valid if accurate data can be obtained, which is exactly why Matt Simmons pushes for oilfield auditing everywhere.
Bob Shaw in Phx,AZ Are Humans Smarter than Yeast?
I am assuming these small Romanian fields were developed with older extraction tech [1950-1976], not the superstraw tech present in many fields today.
IF this is true, then world production would show a early and exaggerated false quantity continuance of component exponential growth in the global log chart during the time period from when this superstraw tech was first applied [starting in the '90s?], only to crash harder postpeak like DuncanK's Sudia model. This would seem to preclude a long lasting plateau [as CERA suggests], because each modern oilfield's peak production rises faster and occurs sooner than if normal tech was applied. So the statistical 'trick' would be to somehow separate superstraw production from normal production to see how much false distortion is introduced into the global plateau we have been seeing for the past several years. In short, we could already be past worldPeak, but the superstraw production keeps us from seeing it in the HL charts because the equation doesn't mathematically account for the extra extraction.
I hope I adequately explained my concerns for others to understand. Feel free to add or dispute as I am not a statistician nor a petro-geologist.
Bob Shaw in Phx,Az Are Humans Smarter than Yeast?
In 1976 I was on a 1 week study tour of the oil/Petrochemical industry in Rumania.
I can confirm that at that time it looked completely worn out :-)
Regarding forecasting. You are aware of the latest Laherrere paper? If not, see the tour de force of forcasting on the ODAC homepage http://www.odac-info.org/ go to the bulletin board and see item 6.
snip #### Uncertainty on Oil and Gas Data and Forecasts
Jean Laherrere, member of ASPO France and who worked with Total for 40 years, has released his latest report, Uncertainty on Data and Forecasts (PDF, 3.7 Mb), prepared for the ASPO-5 conference in Pisa, 2006. This is an outstanding report that is full of fascinating Peal Oil and Gas information (70 pages), and discusses some of the more optimistic scenarios suggested by the US Geological Survey (USGS), International Energy Agency (IEA), Energy Information Administration (EIA), Michael Lynch and others.
[Posted 13 July 2006]### snip
regards/ AUC
He does detailed work you can't find anywhere else.
Everyone should review this.
Bottom line is theoretical all liquid peak around 2010, unless there are disruptions or limitations in supply (rig shortages, hurricanes, war, civil disturbance anybody?) in which case we get an undulating plateau.
Not much of a statistician myself, I can only point to decline rates in the North Sea and in Cantharell, which are spectaculair. And much higher then anticipated. I think your assumption is accurate, and thus disturbing
Off-topic: regular unleaded now 1,529, in Holland (in Euro's per Liter), ~US $ 8.41 per gallon. If you think that will cause some demand destruction, think again. It doesn't.
Some speculation at a distance -
To me, pretty much the only interesting discussion along these lines is whether America can limp along enough in recreating infrastructure thrown away over the last 60 years to prevent a broad collapse.
Obviously, opinions vary greatly. I tend to believe the pessimistic view is more likely - simply too many people have lived too stupidly in U.S. since the late 1970s. The 20 years for the crash program to deal with peak oil started with Ronald Reagan's election - I'm sure most people currently living in the U.S. are satisified at how things worked out since then, or did I miss something?
http://www.aph.gov.au/hansard/senate/commttee/S9515.pdf
Ali suggests that PO is now, and peak gas will then follow in 2008-09! He downplays the role of biofuels, despite the enthusiasm from Seantor Joyce, who represents the farming lobby. This parliamentary enquiry was initiated by ASPO Australia last year. Major media focus and reporting was on Ali's prediction that PO will cause oil majors to explore in Antarctica for oil. :)
- Texas: 56.5%
- Lower-48: 51.9%
- US: 51.3%
- Norway: 53%
- Russia: 48.4%
- Mexico: 48.3%
Saudi Arabia is at 58.1%, the world is at 48.2%.4. production decline seems to have slow down a little bit since 1990 with a K around 4% (probably small fields) and may produce a larger URR with time.
Could you plot the resulting Hubbert curve in the P vs time domain?
But obviously, there are a large number of factors involved in this. Still, something to consider - now with two data points, so to speak - that is, true interruptions in production, and the highest recovery peak. I can also imagine this as a simple one-off, though.
I believe Russia Peaked in 1987.
With respect to Romania I have computed that cummulative production (Q) from 1965 to 2005 (bp including NGL) is 3.245 billion barrels. I've had this checked - but would be pleased if others would check this too.
First question then is what is the Q figure from 1857 to 1958?
Following from that what is the Q figure 1857 to 2005?
You say "in Romania, linearisation works despite a very choppy profile" - I wonder how you know this? I do, however, tend to agree with you because the production data 1890 to 2005 has probably captured most of the reserves and production present in Romania.
I say probably because what if someone discovers 5 billion barrels with a wild cat well tomorrow? I agree that this is very unlikley in Romania but if it did happen how would this fit with the Qt value of 6.2 billion derived from your linearisation.
While this is very unlikley in Romania, it is more likely in other parts of the world, e.g. KSA.
I guess the acid test would be to do a linearisation on the data from 1857 to 1958. I see that Kehbab has done a post on the data from 1950 to 1970 ( a curious choice given that there is no data 1959 to 1964) - but the acid test is the period 1857 to 1958. You have pointed out that the HL knew it wasn't on peak in 1936 but does it give a good prediction of Qt using only the 1857 to 1958 data? If the answer to this is yes then I will happily eat humble pie and buy you drink if ever we should meet.
I want to emphasise that I think you guys are doing a great job and I'm really just wanting to probe the methodology to ensure that certain assumptions and weaknesses are not overlooked. I think the posts you did on the ME OPEC linearisations showed that "choppy data" can give misleading results.
I did a reply to the ME OPEC work a week or so ago but posted this too late for most folks to see - so I have posted it again below. Fire away!
In this and other posts there has been what I consider to be a great debate about KSA and OPEC reserves with input from mathematicians, merchant bankers (Simmons) and of course geologists (Campbell et al). I spent the weekend in the company of a senior production geologist who has worked all his life for one of the super majors and we spent a good bit of time discussing the Hubbert style approach and how it may be applied.
First point is that an oil field will only develop a bell shaped production profile if production builds with the successive drilling of production wells followed by a natural pressure decline of the reservoir. In practice this never happens as companies intervene with the natural decline process in a way that normally prioritises maximising flow rate early in field life, sometimes at the expense of lowering the ultimate recoverable reserves. Enhanced Oil Recovery (EOR) techniques commonly include water or gas injection designed to maintain reservoir pressure and sweep oil towards production wells, miscible CO2 flood and the drilling of infill wells and long reach horizontal producers which increases the contact area of the production well with the oil. Every time an intervention is excecuted the natural pressure depletion production profile gets distorted and there is a danger that any linearisation technique applied to this non- linear data will give a defective result.
Applying the Hubbert approach on a basin-wide or national scale also assumes that commercial forces have been allowed to dictate the development history in such a way that the biggest fields get found and developed first. The big fields provide infrastructure that allows for the developemnt of a large number of smaller fields. Normally there is a large degree of overlap in the development of the giants and the lesser fields and once the production for a complete basin or country is well underway then the Hubbert approach may well allow for prediction of peak production and URR for that area.
In KSA and other ME OPEC countries both of these features may be operative in opposing directions. The extensive use of water injection over the decades combined more recently with multi-lateral horizontal producers has been designed in recent years to maintain production from Ghawar, Abqaiq et al, no matter the cost. This is overalid upon historic production that has been choked back on many occasions for political reasons. The worry now is that production from the Saudi super giants may shortly collapse - giving rise to a highly irregular and assymetrical production profile for these fields - a far departure from any form of bell curve. Stuart's work in the Linearise This post of July 7th went some way towards highlighting and semi-quantifying the nature of this problem.
Western engineers who have visited KSA say that there is "bucket loads" of oil there still to be produced and this backs up to some extent what the Saudis themselves say. It seems likely that KSA and other ME OPEC countries may have a very large number of lesser undeveloped fields and in KSA these may be billion barrel+. This resouce base is not accounted for in historic production data. If work on developing these fields starts now then a production peak from these fields may be expected some time in the future - 10+ years from now? The main point is that development of this resource will come too late to delay world peak oil.
My main conclusion would be three peaks in ME OPEC production, 1974, 2006 and a third, smaller peak about 10 years from now - no mathematical basis for this but simply a geologist's gut feel.
Note that this is very similar to what the Western engineers at Shell were saying about the Yibal Field, which started crashing just as they were gearing up to handle what they projected to be a surge of new oil production.
The feel I get from some of these discussions is that HL may be less appropriate to fields developed with injection/horizontal drilling, etc., since it may radically change the production profile away from a Gaussian distribution.
Perhaps enough data exists for Yibal to test this hypothesis????
Just because Shell got things badly incorrect according to outdated international conventions on how reserves should be accounted doesn't mean that everyone else has to be tarred by the same brush.
So where does the truth lie?
Fire away.
Excellent Post CryWolf! Now we just need HL statisticians here to read your post.
>It seems likely that KSA and other ME OPEC countries may have a very large number of lesser undeveloped fields and in KSA these may be billion barrel+.
This is pausable. However a field with a billion or two isn't very big (about 11 days of global production). I suspect than when the big fields go under, that these smaller fields will remain for domestic consumption. However if the house of Saud is overthrown by a theoracry gov't its possible that these wells will never be fully utilitized. ME production has been plagued with Geopolitical issues since the oil began pumping out of the ground.
Having said that, I happen to agree with you, the reason being that 1857 to 1958 does not capture the whole Romanian petroleum system and production is puncuated by political intervention (sound familiar?)
I'm afraid I won't buy your suggestion of using the data post 1955 - because what we really need to know is if data punctuated with political interference (WW1 and WW2 in the case of Romania; 1980s production cuts in the case of OPEC) can be used to predict basin-wide reserves in the ME OPEC countries.
For instance, if you use only the years with Cum. Prod. corresponding at 25% of the URR, you will have around 30% of chance to be within 10% of the correct URR value (assuming an i.i.d gaussian noise). More details in the following posts:
How Reliable is the Hubbert Linearization Method?
Bootstrapping Technique Applied to the Hubbert Linearization
How Reliable is the Hubbert Lin. Method? the world case
But it is really KSA and other ME OPEC countries that are the main focus of the PO debate. Lets imagine that the 6 Saudi supergiants contained 60% of the URR of KSA and that these 6 supergiants are just past peak - produced 60% of all their oil? So that would leave 24% of Saudi URR remaining in the 6 supergiants and another 40% in the yet to be developed fields, meaning that KSA may have produced about 36% of URR and has 64% left.
According to your chart we would be about 50% certain that KSA URR estimates were accurate to better than 10%. In other words, we really haven't a clue about the reserves in the yet to be discovered and yet to be developed fields - if indeed these even exist.
Yes but the Parabolic Fractal Law tells us that the 40% to be developped will come from a large numbers of very small fields and will only push the peak for a few years (Norway is a good example: the top 5 field contribution peaked in 1994, the other field contribution peaked in 2001, the total production peaked in 1999-2000). Eventually the decline of the large fields will dominate.
I know this will not affect peak in KSA, ME OPEC or world peak - but it can have a profound effect on the shape of the down curve.
In order to present a really convincing case for politicians what I beleive is required is a really liberal model for KSA and ME OPEC - one that honours what Aramco says - but still has peak 2006. This model would include highly assymetric KSA production, going off the edge of a cliff (Simmons style) some time soon, compensated by a tertiary peak, produced by frantic drilling of all the rest, that may appear in a few years time on the down curve.
Obviously, HL may have actually just been a description which fit by chance into a particular technical/economic framework.
The problem is, all the counter examples based on current experience seem to point to more catastrophic declines than generally accounted for until now.
HL may be poor science, or just tweaking the numbers until they match up - the technical aspects are very much open to reasonable debate, and are obviously influenced by a number of variables and particulars.
Until now, HL seems to describe the real world processes at work, and does so with fairly brutal accuracy.
But to give a silly example of how easy it is to manipulate a data series over an extended period of time. One reason the stock market is such a sure bet over the long term is that every company which is listed and then goes bankrupt is simply erased - as modern examples, Enron and Worldcom counted while they were expanding, but their collapse doesn't subtract from increasing the stock market's value in the previous years, and the loss isn't included in the year's figures when they disappeared. Sort of sound likes current ME/OPEC reserves accounting, doesn't it?
And for those with better knowledge, do please step in - I was stunned when reading that was the way historical stock market performace was measured when I read it a few years ago. All the pluses and minuses are measured in the sense of change, but no negatives - that is, the disappearance of billions of dollars from the market was not measured at all. It even makes sense on the face of it - after all, Enron did just disappear, that is that, so why bother including any bankruptcy at all? - it would just be a meaningless measure, since the market only deals with existing companies, not failed ones.
There is no theoretical reason in the world why Hubbert linearization should work!
In particular, HL assumes that the shape of the curve going up is a mirror of the shape of the curve coming down. Yet there is no reason why this should be true, and there seem to be many reasons why it should not be true.
The shapes of the curves in the two regimes are due to completely different factors. In the growth phase, it depends largely on the rate of exploration and production investment, how fast oil companies are ramping up production. In the decline phase, it depends on the nature of the oil fields and the increasing difficulty of extracting oil from depleting reservoirs.
HL assumes that, miraculously, these two effects will turn out to be exactly the same. Somehow, the rate of production increase will mirror the rate of decline due to pressure loss, water cut, and factors relating to the shape and nature of the oil reservoirs.
Now granted, there are a number of existing examples where HL seems to have worked pretty well. But that doesn't change the fact that there is a deep mystery about why this should have happened. A priori there would be no reason to expect a field's production profile during its declining years to mirror the profile during the years when it was being developed.
Without a theoretical justification, skeptics are going to continue to characterize HL as mere numerology.
I'm not saying HL is without flaws, but the skeptics don't have a leg to stand on until they can show a pattern where it doesn't work.
Applying this technique to the whole world results in a morass of uncertainties, many of which simply cancel each other out to produce an accurate result. This is not a coincidence as transient errors become self correcting with time - see the Yibal example provided by Duncan K further down the page.
In terms of data sets that might provide totally false results - see Yibal further down the page. My gut feel (I'm a geologist) is that Romania 1857 to 1945 or 1857 to 1958 may not provide the 6.2 billion barrels URR suggested by the more mature data set. If it does then I will eat humble pie and profess the HL technique to be truly miraculous. Khebab's response suggested that in 1955 Q=1.5 Gb, and you can see from the plot that at 1.5 Gb the HL is all over the place - and that's after more than 100 years production.
My main point is that HL should carry health warnings - one warning that application of EOR techniques may result in gross overestimation of reserves - and one warning that in basins where political intervention has slowed exploration and production that underestimation of reserves may occurr.
Understanding and explaining limitations (if these do indeed exist) puts you in a much stronger position to argue the case to sceptics. I'm not a sceptic - and I'm taking some convincing here.
I've had a look back at Stuart's ME OPEC plots from the Linearise This post of 7th July (I won't try to paste the link in case this doesn't work). Looking at these more closely now (with more experienced eyes - its amazing what reading TOD for 2 weeks can do) - YOU SEE THAT SOME OF THE HLs FOR INDIVIDUAL COUNTRIES ARE ACTUALLY FLAT FOR THE LAST 7 YEARS - ESPECIALLY KUWAIT AND IRAN. This of course would point to infinite reserves. So if KOC or Aramco turn up at some conference with their HL data showing infinite reserves they might also claim that this methodology is certified by TOD and other luminaries. The ME OPEC HLs are actually more extreme versions of DuncanK's Yibal plot. In my humble opinion pointing that out has far greater value than defending HL to the death.
I hereby Chritine DuncanK's Yibal plot - Dog leg followed by cliff (DLFBC)
Fire away!
I also agree that Stuart and Khebab need to be warmly thanked for all the excellent work they do.
If, however, you are still reading this one Stu and K, how about a comment on the last 7 years of Kuwaiti and Iranian HL curves - which to my eye look flat. If they have flattened, then what geological / reservoir engineering / production interventions might cause this, and what might the future consequence be?
Using my SBM-PF model with an URR around 188 Gb, the best case scenario could be something like that:
The Iranian consumption data should of course get flashed at the Whitehouse - America shoud offer to build some alternative energy sources and free up 1 billion bbls/day for the world market.
Do you really think Iranian production wil peak 2025 - and not 2004?
A half dozen examples hardly qualifies as "works nearly every time"
It is just the theory that is so messy and unsupported, not the facts.
Regardless of how hard it is to imagine, HL seems to result from the fact that human desires still count for little in the real world. I remain convinced that the Saudis are just starting to grasp that fact in the most unavoidable way possible - regardless of their planning, promises, or secret nightmares, what comes out the end of the pipe is all they have.
In this way, though I didn't bother to post the link, an article today about OPEC forecasting declining demand growth was amusing - demand growth is becoming meaningless in face of no supply growth (still my belief, increasingly supported by facts).
HL is also a slap in the face of supply and demand - demand in this case has nothing much to do with supply in terms of oil in the ground which can be brought to the surface and refined. Whether Texas, the U.S., the North Sea - the plans are trumped by what comes out of the pipe, and till now, HL seems to work in real world terms, while most other methods (more technology or 'we need it, so it will be there') fail.
"Men argue; nature acts." --Voltaire
Seems to me that there's the possibility that certain elements of humanity will be arguing over the reality of Peak Oil and related production-decline even as the walls of industrial civilization may indeed be collapsing right in front of them.
-best
That's not completely true. Let's assume a gamma function which is highly asymmetric:
Clearly the Hubbert curve is a bad model. However, the HL will still be effective as an URR estimator as long as we can observe production points below P/Q< 5%:
That is the graphical representation of what I was trying to describe in my earlier posts whereby the EOR and superstraw tech distort the peak, but maybe not the URR. Ideally, if every oilfield was extracted using traditional tech at 'normal' economic requests for increased supply, with no political interference to periodically choke supply--every oilfield should have a smooth production profile.
Obviously, this is not what we see in most country charts from around the world. To make the HL method more accurately descriptive; to make it hew to what actually comes out of the pipe, and what will be cumulatively recovered at the end: we need to create a mathematically enhanced HL equation [EHL].
Now this is really getting out of statistical research limits for me--Hopefully others have the skill. But imagine if the EHL could mathematically account for the following Peakshifting effects:
- The superstraw and EOR tech effect [like your graph above]. This 'inflated burn rate' moves the peakdate earlier and higher than normal extraction. The HL equates to a normal bell, an EHL would mathematically account for the extended exponential growth over and above when production growth should become linear. The 'distorted' area under the Peakshifted graph, but over the idealized normal Hubbert curve could be calculated, then mathematically used to derate the EHL postPeak tail and URR. The Yibal field postPeak crash might be a good place to start this analysis.
- Political chokebacks, such as seen in Iran and Iraq country charts. Again, induced distortion compared to an idealized Hubbert curve. This production reduction act by TPTB Peakshifts the date into the future compared to an idealized Hubbert curve, but does not harm the underlying geologics. The area under the normal Hubbert curve could be calculated, then used to uprate the EHL postPeak tail, URR, and time delay from the idealized Peakdate.
- Geologic damage, such as when Saddam Hussein's retreating Iraqi troops torched off the Kuwaiti oil & gas wellheads. Compared to the idealized Kuwaiti Hubbert curve, this lowered ultimate peak production, and peakshifted the date earlier than would be expected. Additionally, it probably induced a faster postPeak depletion rate and lowered the advantages of any applied EOR tech. This area under the curve from the idealized Hubbert could be calculated, then used to derate the EHL equation.
- Accounting for inherent, but advantageous oilfield geologic development factors. The superviscous flow rates of many ME oilfields distorts the idealized ME Hubbert Curve because early extraction WAS TOO EASY. Recall Stuart's chart that showed how steep and vastly exponential the early ME development was until 1970. Then some powerful people said, 'Hell NO, not on my watch. They essentially were forcing production to a more idealized Hubbert Curve, but this early phase area, when production was greater than the idealized Hubbert curve, can be calculated then used to derate the EHL model.
There maybe some other vital factors I overlooked, but this might be a good starting point. As Simmons suggests: the hard part [the impossible part?], is getting the accurate data to prevent GIGO.Now I certainly do not have the skills to do this analysis, as it would require coming up with an idealized Hubbert curve for each country, then comparing with the four distortions listed above to see what happened in terms of Peakshifting and URR complications, then calculating the EHL that best describes the actual production history. Then the next step would be rolling up all this data into a Worldwide EHL.
But I believe if we had a supercomputer and a dedicated staff of statistical modellers and programmers: we could get much closer to actually determining what is really going on out there in the oilfields. We need a Foundation funded towards this end, or maybe the CIA/NSA is already way ahead of us with EHL modelling techniques. Perhaps since the early '70s?
Bob Shaw in Phx,Az Are Humans Smarter than Yeast?
Clearly as many of these techniques were developed in the 80's, then they would not have affected the 1976 peak, and the HL would give us good results.
However, as I theorised the other day with my fictional country of Sudia, there are clearly problems with oil fields and regions that have extensively used EOR techniques to hold production high until well past 50% URR (like Yibal - PDF).
Regions like Romania and the Lower 48 are good HL poster children because EOR came late in the piece, and therefore did not greatly affect the overall picture.
I believe HL is too optimistic when used on fields that have had extensive EOR techniques applied.
Two wrongs don't make a right.
Note that the EIA continues to report that oil production in Saudi Arabia and the world are both declining.
http://www.energybulletin.net/13575.html
M. King Hubbert's Lower 48 Prediction Revisited
Jeffrey J. Brown & "Khebab", GraphOilogy
How accurate has the Hubbert Linearization technique been in predicting post-peak cumulative Lower 48 oil production? What can the Lower 48 model tell us about the future of world net oil export capacity? Finally, we have a recommendation, a fundamental shift in US tax policy.
first published March 7, 2006.
http://www.energybulletin.net/16459.html
Texas and US Lower 48 oil production as a model for Saudi Arabia and the world
Jeffrey J. Brown & "Khebab", GraphOilogy
Based on the Hubbert Linearization (HL) method and based on our historical models, we believe that Saudi Arabia and the world are now on the verge of irreversible declines in conventional oil production.
I gotta agree. The present HL mathematically assumes free economic markets to push the uniform growth of oil demand, no political interference on production, uniform geologic structures, and no late extraction heroics like superstraw tech. All that considered--it still does a remarkably damn good job of indicating what is going on, perhaps due to the long worldwide production history and the nearly countless fields of all different sizes. The next HL mathematical leap needs to somehow account for the distortions from an idealized Hubbert Curve.
The Lower US 48 is the perfect poster child to determine the underlying economic and geologic math constants that make an idealized Hubbert Curve, which then can be used for other areas to help create an EHL. Mathematically accounting for the TX RR Commission, then OPEC, and possibly Russia's next geo-political role as the critical swing producer could be crucial to future accurate EHL analysis.
An EHL, with greater predictive tools, would be a lot harder for Halfin, Freddy Hutter, Michael Lynch, Yergin, et al, to logically dispute. If Simmons could convince the world to participate in full oilfield audits, this would be a giant first step.
Then, Who is our present day genius to Asimov's Hari Seldon?
Bob Shaw in Phx,AZ Are Humans Smarter than Yeast?
Here is the HL plot for Yibal:
Clearly if we only had the data up to that 1998 point, then the red line would have been our HL extrapolation of Yibal production, with a resulting URR of 3Gb. 1998 would have looked like almost 50% URR
But in reality, the sudden collapse of Yibal means that they are actually heading for a URR of about 1.7Gb, with 1998 being about 70% of URR.
Now if the major oil fields that make up about 10% of daily production (Ghawar, Burgan, Cantarell, etc.) have all been well worked over using heavy EOR activity, and these fields are at the same point that Yibal was at in 1998, then we are in for a very bumpy ride.
It would interesting to find out what EOR techniques were used at Yibal during this period.
If nothing was being used to boost production during that time, then this would suggest that HL works on oil production numbers that have not been held (artificially) high with EOR. Hence why it works for Romania, Texas, the Lower 48, etc.
- Production began in 1969.
- Water injection began in 1972.
- Vertical wells became obsolete in 1990.
- Horizontal wells recreated fabulous oil flows per well.
- Field production peaked in 1997: 250,000 bopd.
- By 2001, oil production was > 90,000 bopd.
- 2004: Yibal is producing > 40,000 bopd.
So it looks like they started drilling horizontal wells in 1990. Strange how it doesn't show up as a production increase until 1994.Great chart, big thxs. Is there any way to numerically determine what percentage of Ghawar is superstraw produced versus more normal extraction methods? This would be exciting to see how this distorts the HL for Ghawar.
Maybe you could makeup a ficticious Ghawar that resembles your Sudia model, but is a fairly accurate representation of the real numbers, but add in some computational formula that time & quantity accounts for an assumed late twenty year growth of superstaw tech. Then compare with a idealized HL with the superstraw component removed.
Sorry, I don't know how to do the calculus for this, but I am imagining a car accelerating and increasing velocity by floorboarding with superstraw tech towards a Peak versus a steady foot on the gas pedal. This faster late-date burn rate is what mathematically screws up the Hubbert downslope projected URR versus actual, like the Yibal surprise.
Bob Shaw in Phx,Az Are Humans Smarter than Yeast?
The effect of reservoir intervention here is to get more oil out earlier (at lower price) without actually affecting the overall URR.
The deceptive period is 1994 to 1998. If PDO / Shell actually increased booked reserves on Yibal as a result of production from this period then they must have been in adventure land - as you can't alter your STOIP with new wells. The red line might have indicated a false doubling of recovery factor.
This is a perfect illustration of the point you make further up the page about HL being too optimistic in fields with extensive EOR techniques deployed. It is in fact not just optimistic but false / misleading. If fields such as Ghawar are close to a turning point as indiacted by your 1998 marker (Matt Simmons cliff edge) then Aramco and the rest of the world are in for a very nasty surprise.
Yes, this is my biggest worry at the moment. How many Yibal-type oil fields are there out there that are just on the point of collapsing?
The HL plot for the world could be at 75% of URR just like Yibal was in 1998.
Oil CEO is putting together a database of the major fields, so hopefully we can have a look at that list and see how many of the big fields could fit this profile.
Also Cantarell. Khebab had some HL plots on 14 July - but not enough years to show the deceptive pattern. K also had data for all Mexico - a close look suggests that the last 4 years may just be turning down - pointing to a URR of 60 Gbs and falling?
Ekofisk is also very interesting to look at. Ekofisk is a chalk reservoir and for decades reservoir engineering dogma said that water injection can't be done in chalk. Eventually, they tried water injection (to support reservoir pressure) with miraculous results - I would hazard a guess that was around 1988 (though from memory I thought it was later). I note your HL is suggesting around 5 Gb URR for Ekofisk and I imagine this could be over the original STOIP (oil in place). My guess would be that Ekofisk HL will now turn down and perhaps end up around 3Gbs.
Any Norwegians out there with more information on this? This one is worth pursuing as water injection into chalk followed by watering out of production wells could be analagous to Ghawar.
GraphOilogy: Some Detailed Views on Norway's Oil Production
I agree that Ekofisk could start to turn down to a lesser URR, and 3Gb does not sound unreasonable. Again, this could have a significant effect on Norway's total production, just as the world production could be greatly affected by similar down-turns in the big super-giant fields like Ghawar, Burgan and Cantarell.
So are you working for the oil industry in Aberdeen at the moment, or are you just an outside observer? Do you have any inside information? I have a friend who has worked on various fields in the north sea including one field that was pumping 95% water.
I am originally from Galloway, but have spent the last 16 years out here in lifeboat New Zealand. I going back to Galloway for 2 weeks at the end of this month.
Now I'm trying to scartch a future out of investing - oil futures, gold, U etc - but on days like today the markets just ain't playing ball. I'm working up the energy to raise peak oil issues at local and national government levels - Nicoll Stephen (Deputy First Minister) is my local rep and I can have access at any time.
WRT to information, three years ago there were several small - medium cap oils stocks that had growing production but strange to say in most of those production has plateaued.
If you want to do some company research have a look at Petroceltic (pci.l) and Afren (afr.l). Pci will shortly start drilling gas exploration wells in Algeria. Afr is a new company offshore Nigeria with some noteworthy board members.
"Understanding and explaining limitations (if these do indeed exist) puts you in a much stronger position to argue the case to sceptics. I'm not a sceptic - and I'm taking some convincing here.
I've had a look back at Stuart's ME OPEC plots from the Linearise This post of 7th July (I won't try to paste the link in case this doesn't work). Looking at these more closely now (with more experienced eyes - its amazing what reading TOD for 2 weeks can do) - YOU SEE THAT SOME OF THE HLs FOR INDIVIDUAL COUNTRIES ARE ACTUALLY FLAT FOR THE LAST 7 YEARS - ESPECIALLY KUWAIT AND IRAN. This of course would point to infinite reserves. So if KOC or Aramco turn up at some conference with their HL data showing infinite reserves they might also claim that this methodology is certified by TOD and other luminaries. The ME OPEC HLs are actually more extreme versions of DuncanK's Yibal plot. In my humble opinion pointing that out has far greater value than defending HL to the death.
I hereby Chritine DuncanK's Yibal plot - Dog leg followed by cliff (DLFBC)
Fire away!"
Apart from arguing that these ultimately make no difference to various modelling techniques, perhaps exploring the game theory upshot for a major oil producing country which realises it has peaked would be interesting?
Assume a despotic government reaches the max oil output volume they can get, and know they will decline. They need to keep an edgy populous stable. They will be aiming to keep revenues relatively constant, and will therefore seek to offset quantity declines with price increases.
Now "normally" (lower equlibrium) suppliers to the oil market have no pricing power unless supplies are tight, however once it becomes apparent that the supplies are universally tight the rules change...
Here's an article from the March 2000 section of Paul Krugman's "unofficial" website to see what I mean..
http://www.pkarchive.org/crises/opec.html
Currently the psychology still seems to be than suppliers have to meet the demand, and hence you could argue we are still at the lower equlibrium... (I suspect Krugman's reasoning was sound, although he may not have seen where in the cycle he was at the time)
However, the prospect of peak oil blended with this simple economic reasoning is interesting.
Diddly Squat, IMO.
Assuming the bombing did not cause any underlying geologic damage, it Peakshifts the HL twenty years into the future. The Iran-Iraq war in the eighties did much the same thing--that is why their related Hubbert curves are so distorted.
Bob Shaw in Phx,AZ Are Humans Smarter than Yeast?
Why pump the precious black gold when it will only get more expensive if you leave more of it in the ground?
The practical side of that thinking in illustrated in the following article:
http://business.timesonline.co.uk/article/0,,8210-2275959,00.html
The theoretical side was in the economic argument in my post above.
It could get quite dangerous if producers decide to conserve their remaining production, because it will only get more valuable left in the ground, hence the dual or triple equilibrium model caused by a bendy long run supply curve.
(1) Take the production history for a country (say, Romania, which we have in hand)
(2) Take the minimum number of years at the start of the history needed to do a Hubbert Linearization - say, three years or something. Least-squares fit the logistic curve through these points. Extract the HL forecast for peak year and cumulative production to abandonment.
(In effect we will be trying to predict the entire production profile of the country based on the first three years, so I wouldn't expect the result to be very accurate)
(3) Append one more year's data to the cumulated production history, and repeat.
(4) Plot the following curves as a function of time
(i) Cumulative actual production to date
(ii) HL-predicted ultimate reserves to date
(iii) HL-predicted years to peak
Curve (iii) would start out as a large positive number as we would be fitting a Hubbert curve to rising data, with the peak far in the future. It should meander down to zero as actual production peaks (assuming the peak is fitted by HL), and then go negative as the peak recedes into the past.
What would this give us? It would give an impression of the general stability of the HL parameters in the face of actual noisy data being added to the history year by year. For mature countries like Romania, it would tell us how early in the development cycle HL begins to give a reliable picture of ultimate reserves.
(5) Repeat for every country in your database
Stu - If you can point me at your raw country data, I might have a stab at this myself.
http://www.theoildrum.com/story/2006/1/11/6047/13568
Question for the advanced student: what does it "mean" if the true historical cumulative for a particular year exceeds the lower decile HL estimate for URR? What if it exceeds the median? Are either of these scenarios possible?
Then repeat for all countries in the database, always starting at the earliest available year for each country.
One good "nasty" is Azerbaijan - three clear local maxima so far (something like 1899/250Mbd, 1941/450Mbd and 1965/400Mbd) interspersed by wars, revolutions and the collapse of the USSR. The all-time high (>1MMb/d) is probably 5-10 years into the future at the time of writing. I do NOT expect HL to work there.
As long as people are arguing that HL is predictive, then yes, it is fair to require that HL predict the actual production. The argument that oil is peaking right now (made by Westexas and others) relies heavily on HL analysis of Saudi Arabia and the World.
If the analysis used to arrive at a conclusion is suspect, then it becomes reasonable to question the conclusion itself.
Acknowledging that fact, there is nothing wrong about using a deterministic rate model to extract parameters such as discovery times, fallow time, time to construction, maturation time, and production rates to add to the global model.
Just looking at the discovery data, I think it is evident that Romania has slowly ramped up their extraction efficiency (and greed quotient) to the point where you see less latency to the time period between discoveries and production peak in the latter years:

One thing misleading about Laherrere's discovery curve (which I have noticed elsewhere) is that he tends to "connect the dots" between years of discoveries, which has the unfortunate effect of indicating more earlier discoveries than are warranted. You can see this more clearly when you look at his cumulative discovery curve:

The reason why I want to be exhaustive is - well, it's more exhaustive. How long do you have to wait before HL, or any other linearization, gives a good (within quartiles?) estimate of ultimate recovery? Of peak year? How well does HL work for smooth production profiles? How does the estimate respond to (say) a doubling of the production rate after a long plateau? The countries of the world represent the largest statistical universe available, so that is the universe that needs to be analyzed to answer the question of HL validity in a complete sense.
One interesting alternative would be to take the annual profiles for all the North Sea UK sector fields that are available on the UK DOE website, and draw random closed curves around subsets of the North Sea to make synthetic "countries" and run HL on those pseudo-countries. A sort of crude take-off of the statistical bootstrap.
I find this discussion that the three of you are having fascinating. I think you are really getting to the heart of things.
I'm glad Stuart's not here. Because we all know he is watching. Or will have the perfect view later. He will be here soon enough.
Stuart is in the desert. He is speaking with the Ghost of Muhammed. He will be back soon. Fear not.
A thought experiment:
Suppose we had to make a prediction of URR with less data then we have now. Let's say our data stops at Q=3.8 Mb. We would be inclined to draw a line which was a tad "flatter" than this one. That linearization would give us a far larger URR, I reckon even 10% too large. And that is what bugs me about these graphs: A small blip off will result in a large ΔURR.
Yes I can see that. But it might be usefull to keep in mind that +/- 10% is a large amount and as such could have huge implications. Couldn't it be a tad too early to draw reassuring conclusions from this graph?
http://www.theoildrum.com/uploads/linearization.gif