An oilfield in Arabia
Posted by Heading Out on August 16, 2006 - 1:32am
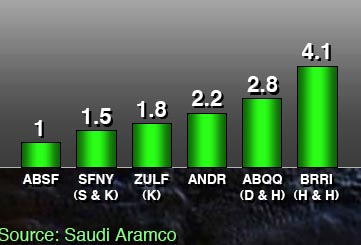
However, this allows me to grin again, because those of you who have read "Twilight in the Desert" may now recognize the dimensions of the Abqaiq field in Saudi Arabia. (Although all the exemplary numbers other than the geometric size of the field, and its porosity and depth were made up by me as I went along to illustrate the developments of the technology that have been applied to that field). The oil has a 36deg API, with a gas/oil ratio of 860 cf/barrel. (It is also sour). The rock permeability is 400 millidarcies in the Arab D formation (this info is from "Twilight"). We can get some other information on this field from a number of other places. So, as a contrast between the myth and the reality you might want to read on.
If the expansion of 1936 had struck some of them as a period of hectic confusion, this 1944 expansion struck them as bedlam. Their goal by the end of 1945, they were told from San Francisco, was 550,000 barrels a day, nearly 25 times what they were turning out now in their standby operation, and much more than the capacity of their existing wells. There would have to be a massive drilling program involving perhaps 20 strings of tools, and drilling that many oil wells meant developing adequate water supplies both at Abqaiq and at Qatif, where they had been instructed to put down a wildcat. . . . . . . . By June 13th, too, Phil McConnell had entirely shut down the Abqaiq field after completing No. 5, and had diverted his entire Drilling Department to Ras Tanura.. By 1962 only 72 wells had been drilled in the field. In 1962 the gas was being extracted with the oil, and 50% of it was being used. Most of it was pumped back underground to maintain pressure and in some cases it was mixed with LPG (Liquefied petroleum gas) and this helped dilute and increase the flow of oil from the reservoir. (But sometimes it did not work). It was used in Ain Dar part of the Ghawar field and right next door to Abqaiq. But in 1982 the gas was collected for sale abroad.
By 1972 Aramco was drilling a well at the rate of 1 every 2.1 days. Shortly thereafter Abqaiq peaked, at 1,094,062 bd. In the area of Abqaiq there were 4 drilling rigs and 5 workover drigs in the period around 1977, as the field fell back to a production of less than 800,000 bd. By 1981 production was down to 652,000 bd In the mid-80's it was partially shut-in, and flow was reduced to 200,000 bd as demand declined.
And while the rest of Saudi production continued to grow, in 1988 it had 550 wells in production by 1990 Abqaig had only 47 flowing wells, and by 2002 had dropped to 500,000 bd. It is currently 73% depleted, according to Aramco in 2004
Now beyond this point there are some conflicting numbers. Let me just list some of the information that is out there.
In the 50 years since discovery it yielded 7.5 billion barrels (pdf file) of oil.
The EIA considers that Abqaiq has 17 billion barrels of proven reserves. This is in contrast with the recent "World Energy Outlook 2005", which projected (through 2004) that Abqaiq had 5.5 billion barrels remaining and had produced some 13 billion. (But it got the start date wrong as well). It uses IHS data for its projections.
From that data, quoted by Jean Laherrere, one can estimate the total oil contained in the field. Using their anticipated total of 19 billion barrels, and that this is considered to have a recovery factor of 60% indicates that the overall oil in place is about 31 billion barrels. This is about half of the theoretical prediction I had made, using total volume and porosity, but given the variations in geology over the region, that the field has about 50% of the oil that the general assumption predicted is not bad.
However using the Aramco statement that the field is 73% depleted implies that the total oil that can be recovered from the field is around 11 - 12 billion barrels, which is in line with the HL projection created by Laherrere.  The field is variously currently reported as producing between 250,000 bd and 434,000 bd . The IEA consider the latter figure - which yields 158 million barrels a year, sustainable through 2010. (At 8% depletion, although Aramco are claiming that they are holding depletion below that - by continuing in-field drilling). However if the OIP is 31 billion and they are only able to recover 11.5 billion, then this gives a recovery factor of some 37%, which is a fair bit less than is derived by other approaches.
From the Saudi presentation in rebuttal to Matt Simmons, CSIS, 2004.
And, it was from this field that this image was derived.
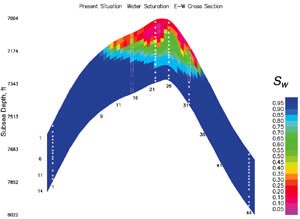
Original discussion of which was here
Contact
- Content: editors at theoildrum dot com
- Tech support: support at theoildrum dot com
License

This work is licensed under a Creative Commons Attribution-Share Alike 3.0 United States License.
For peak oil the most important factor is the decline rate post peak if the decline rates at the well level are dramatic a bottom up analysis indicates the final overall decline rate will accelerate rapidly post peak.
The one piece of information that I'm missing is what is the production profiles generally for these secondary wells ?
I found this
http://www.bbean.com/Business-Mall/bbus203.htm
The important part is that the paper claims that a well is only drawing oil from about 120 feet from the borehole. This seems very low to me I'd expect a well to draw oil in from several kilometers at least.
Sure the will be bypassed zones and infield drilling to recover these actually add to the overall recovery. However drilling more wells to keep production rates up only result in a increasingly steep decline profile.
This discusses depletion problems with gas but oil suffers the same problem.
http://www.daystaroilandgas.com/Articles/oil-production-wells.html
Finally in reading some of the material on recovery in advanced fields I found a lot of it sounded like a used car salesman when I see this type of marketing I get a bit concerned about the real benefits of aggressive infield drilling. It just seems to me that except for recovering bypassed oil your simply increasing the depletion rate.
Again sorry to keep harping on the topic but I can't seem to find enough information to alleviate my concerns and a bottom up analysis indicated very steep decline rates.
"I'm assuming that the way they're keeping decline rates low is via horizontal branch wells or bottle brush wells. These seem to serve to only deplete a field faster."
The idea that technological progress in oil extraction basically means getting the stuff out faster rather than getting out more of the stuff seems to be one of the Hubbertians' core articles of faith.
Isn't horizontal extraction also used to extract a greater percentage of the original oil in place (OOIP)?
Oh TOD experts, I am perplexed about this.
Hope I'm not being too heretical ....
The problem is that demand is increasing a hec k of a lot quicker than supply, and these new extraction methods are a lot more expensive on a per barrel basis. I doubt that horizontal drilling can do more than slightly slow the decline rate in production. But, the techniques ought to make a lot of producers rich.
"I doubt that horizontal drilling can do more than slightly slow the decline rate in production.
Now I'm even more perplexed than before (at least pending HO's upcoming contribution, which I'm looking forward to).
So does horizontal drilling slow down or speed up the depletion rate? It can't to both at once. Or does it all depend on the characteristics of the field in question? Or does HD speed up the depletion rate but at the same time convert a certain percentage of the technically recoverable oil into economically recoverable oil?
"Grass Roots" where wells are drilled from the surface and then go horizontal. These are new field development wells where as Oilmanbob noted they wouldnt produce anything otherwise. These are drilled horizontal or they are not drilled at all.
Then there are "re-entry" wells in existing fields where a whipstock is set in an existing vertical well, a window is cut in the casing and a slimhole tool is used to drill out at a very high build rate. These in my experience are only somewhat successful in increasing production and are high risk and expensive. It requires highly skilled people and most hands decline to work these jobs simply because of the stress involved. The better people can pretty much pick and choose where they want to work now anyway.
I can't speak for what is going on in Texas but in my part of the country...the Rockies, re-entry work is very limited. Most of the work going on in the older fields is simply workover. As far as increasing depletion I don't think anyone knows at present on horizontal re-entry on old fields.
Maybe this doesnt clear this up, but to people in my business it is considered apples and oranges between these types of horizontal wells.
Smart extraction slows the decline in production by accelerating the depletion rate. (I think)
Depletion refers to the exhaustion over time of URR which is itself some percentage of OOIP.
In my text, the extraction rate is the daily flow (barrels per day) as a percentage of URR.
So, here's what I should have said.
That's better. Now all our terms are defined and there is even the possibility that we can all understand what we are talking about.
Good post and to agian plaster the same message.
In field drilling esp with advanced recovery maintains production rates but ...
Once the wells start watering out the decline rate increases over time before finally decreasing with production at a low level. The basic cause is once a region waters out it waters out several wells at once the old producers plus the new ones drilled to keep up the production rates then net effect is production rates plumment and your left with stripper wells.
The unknown is what is the general production profile of these new wells how long do they last on average with a high production rate years decades ??? Assuming that the orginal drilling gave decent field coverage. My gut feeling is in field drilling only helps production rates for a few years at most esp with lateral wells since the depletion rate is doubled.
That is my thesis.
As mentioned before it does allow tight formation to be produced so it opens up new production.
Next it works well for extracting bypassed oil but the original estimates that I have seen seem to assume that bypassed oil is not a factored into the overall recovery.
But agian these methods in general seem to trade increased production rates for massive decline rates later since they basically increase the rate of depletion.
Wich in a bottom up anaylisis leads to a increasing rate of decline in production rates once depletion finally catches up.
Thanks !
I think a good explanation of the technical details of depletion and modern recovery methods at the well and field level would be fantastic.
What got me wondering lately is what happened in Prudhoe Bay: Because the flow rate got to low, corrosion got a chance. Is it at al possible that numerous unsuspected problems start popping up once the whole oil industry gets to a lower utilisation level?
for instance, once the water levels reach a horizontal well, a whole part of a field has to be shut down. Could this asymetrical shutdown influence the performance of the rest of the field? (I have no knowledge of oil field operation, other than via this forum, so i don't know if this sort of issue is at all relevant, was just wondering)
Variations of the Prudhoe Bay scenario is likely to be seen in most other gathering systems as the fields they support deplete (or is that decline?). Anybody got any links to TAPS flowrates, viscosities, densities? I could probably find the TAPS pipe size pretty easy. The question in my mind is: at what flowrate will TAPS have the same Reynolds Number (Re) as the BP Prudhoe piping did at 400 MBPD? Is it reasonable to assume that low Re is somehow contributory to the BP problem? And if so, will TAPS exhibit similar mechanism?
However after 10 years the figures are 20,43 and 31. So really '8% decline' is meaningless unless the context is defined.
(PS better check my calcs)
Arithmetic decline gives negative numbers afte 13 years, which makes no sense.
I am not sure what do you mean by logistic decline, but going from 100 to 48 and then to 46 is a weird decline.
100
92
85
78
72
66
61
56
51
47
etc. etc, rounding to the nearest whole number of course. Hell, 8% is 8%, what part of 8% do you not understand. It is just like compounding money, except in reverse.
Except that it seems to me that modern fields don't have a fixed overall decline rate they suffer a increasing rate of decline.
Say 1%-4%-8%-16%-32%-16%-8%
The cause is simple when decline starts you do infield drilling to keep extraction rates up. As these well fail
along with the orginal ones the decline rate increases.
In the real world the rate you can drill infield wells to offset decline is also fixed along with the number and spacing of the wells. The ability to handle increasing water
cut is also basically fixed or grows slowly.
Decline rate only stablizes later when you quit drilling new wells and pump at a constant rate.
Its easy to talky about a fixed decline rate but its not clear to me at all that this represents the real world since
the number of wells that water out increases over time causing there production to basically drop to zero. Once you start capping wells there is a huge drop in production.
Did you use a number for the water saturation in the reservoir?
So the question was asked, what's 2 times 2, and the geologist thinks for a while and says "well it's probably more than 3 and less than 5". The geophysicist punches it into his calculator and answers that it's 3.999999.
The petroleum engineer gets up, locks the door, pulls the curtains, unplugs the phone and says, "What do you want it to be?"
The prediction of Jean Laherrere of URR of 11-12 Gb by the plum line does NOT use HL.
In the cummulative (Q) versus annual production (P) plot, a Hubbert curve translates into a parabola that passes through the origin. If we use a parabola the URR would be IMO even less then 11 (I just did eyeballing).
The plum line that Laherrere uses in his plot corresponds to fixed decline. I estimate that his line corresponds to a 4.6% decline (this is because his line has equation P=-0.046 Q + 0.55 where P and Q are expressed in Gb).
I wrote a litle bit about this here:
http://www.theoildrum.com/comments/2006/7/24/91650/2843/45#45
arithmetic 100(1-.08t)
geometric 100(1-.08)^t
logistic 100 exp(-.08t)/(1 + exp(-.08t))
Re the latter see
http://en.wikipedia.org/wiki/Sigmoid_function.
If you are more of a visualiser think of a curve which flattens out as it declines ie more effort less relative reward. OTOH a downward sloping straight line always gets to zero.
Under all three measures 8% annual depletion means world oil output in a decade will be less than half what it is now. That's a pretty heavy scenario.
k = 5%.
Outside that, we don't really know, do we?
Perhaps I should have said "Loose lips sink ships"
I wasn't trying to globalize, but used the Saudi comment that 8% was what they were seeing, and for which they were compensating with in-field drilling. I am going to try one more post on this to try and tie up some of these "looser ends."
Here is the original statement, from Schlumberger's own web site.
This follows from my earlier post my understanding is that at the field level decline rates are not a constant but increase over time then decrease to a constant as infield drilling is stopped and geologic depletion takes over.
I think the assumption of a constant decline rate is not correct since the fundamentals seem to point to a geometric increase in decline rates.
So the real world decline rates should actually go 2%-4%-8%-16% over time.
Again sorry to keep hammering the topic but recognizing this is important.
I might add that I do the same math for global warming. If follow global warming then you read all the time that scientists are surprised at the rate of change saying yes there models predicted this but not for 50 years. A good example is the melting of the Greenland icecap the rate of the rate is increasing i.e its accelerating our current models are not good enough to handle acceleration caused by positive feedback.
Another scary positive feedback loop that scientist don't like to talk about to much is that the rate of C02 buildup in the atmosphere is subject to some obvious positive feedback conditions. There is a fundamental limit on the rate the Ocean can absorb CO2 once the top layers get close to saturation the absorption rate plummets. For plant once the temperature exceeds certain levels they turn into C02 emitters this causes the rate of C02 build up in the atmosphere to increase dramatically in a fairly short period of time.
I'm not joking.
http://yosemite.epa.gov/oar/globalwarming.nsf/UniqueKeyLookup/SHSU5BPHBE/$File/chapter1.pdf
Scared yet ?You have exactly the same situation with oil recovery. Infield drilling maintains the flow rate at the cost of a geometric increase in the rate of decline later since you have increased the number of wells that water out. So there is a nasty negative feedback loop as increasing numbers of wells water out until you quit drilling and let natural decline occur.
Humans it seems have initiated an experiment on the effects of positive and negative feedback in complex systems. If were lucky our descendants will be around to analyse the data.
Sorry html formatted and I forgot to make that a link
http://yosemite.epa.gov/oar/globalwarming.nsf/UniqueKeyLookup/SHSU5BPHBE/$File/chapter1.pdf
I think it's not that simple, and we would be facing bigger problems than CO2 saturation anyway (ocean acidification, circulation changes). This is too big a topic to address in a reply and, anyway, this is a PO board not a climate board. But you could try Googling something like "CO2 saturation upper ocean"
I agree its not simple but there are some simple basic chemisty at play here. There is a limit to how much CO2 the ocean can absorb and that limit seems reachable with our current CO2 levels.
And yes I know its a peak oil board the point was to point out that positive/negative feedback loops are real in complex systems and as there triggered you build up massive changes.
My point is Peak Oil or more correctly production rates suffer the same systematic feedback effects mainly caused by new recovery methods the laterel wells lead to field collapse eventually.
The two things are distinct and ought to be referred to separately. I note that certain cornucopians like to intersperse these two terms. I often wonder if this is deliberate in an effort to confuse the issue or from ignorance.
best --
I think the problem is the important factor is decline rates
not depletion peak oil is about depletion. But the basic premise is once you are 50% depleted there is a decline in the
production rate. Depletion and the rate of production are not actually tied together in the simplest analysis since is long as there is oil you can theoretically get any production rate you wan't based on the number and types of wells drilled.
In reality there is a tie between the two simply because extraction i.e keeping the production rate steady gets harder as a field becomes depleted. Peak oil at its most basic assumes that the rate of production declines at a certain percentage after a field is about 50% depleted. Its a empirical observation by Hubbert based on the general production profiles of individual wells as a field is depleted. And pretty much common sense.
Modern extraction methods seem to primarly keep the rate of production up well past 50% depletion in exchange for massive declines in the rate of production later.
I don't think I'm mixing the two. My concern is that Hubbert analyis is actually underestimating the decline in production rates we may experience since his curve fitting is really a match to production profiles for the traditional well along with the typical effects of infield drilling.
It important to me to be aware that there is no simple relationship between depletion and production rates.
All you know is that before a field is 50% depleted the production rate depends simply on the number of wells drilled.
At some point after a field is 50% depleted the production rate drops based on how the field is produced.
What impacts the world is not peak oil but how the production rate changes as a field is depleted.
Now at the field level we see production profiles generally peak stay at some value then drop some point after the field is generally at least 50% depleted.
The fact that depletion and production rates are related in a complex way is the cause for a huge misunderstanding and in my opinion hubbert anaylsis tends to initially over estimate declines in production rates and then under estimate.
The reason is almost all production profiles I've seen are actually a step function with production going rapidly to the top rate slight declines as the field ages managed by infield drilling etc. With a finaly massive collapse in production. The fact that you get a overall smooth curve is because the fields are aging at diffrent rates with smooths out the overall production profile.
Fine ...
Except that the world is dependent on a few large fields and a lot of small fields that are depleting. Once the large fields production rates crash and your not making up the loss of small fields with new finds you should see a overall massive drop in production with production declines much higher then a Hubbert anaylsis wound indicate based on the empirical matching of depletion to production rates.
I'm convinced that the current peak oil analysis is painting way to rosy of picture of production rates once depletion passes a certain value.
It pretty simple once Ghawar and Cantrell or any of the two large fields in production now crash were done if three crash then were well done. If too many small fields crash in production too close together were done.
Now were is the flaw in my analysis 8% overall declines in the rate of production looks high to me.
http://www.rrc.state.tx.us/divisions/og/statistics/production/ogisopwc.html
This table has production data from 1935 to 2005 for Texas, and you can see some real world year over year net decline rates--net after new wells, reworked wells and secondary/tertiary recovery techniques. Mathematically, Texas has shown about a 4.1% per year net long term decline rate. The peak year was 1972. Note that production did not fall below the 1971 level until 1976.
ExxonMobil estimates that existing wellbores worldwide are declining at a rate between 4% and 6%. This is gross decline, before new wells, reworked wells and secondary/tertiary recovery techniques. Post-peak, I would expect to see this gross decline rate increase. In essence, this is what happens at peak--the gross decline overwhelms new production.
Case in point, eight of the top 10 net oil exporters are reporting net declines since December.
I'm also obviously quite concerned that decline rates can increase significantly you know more then me about the subject can you expand on why you think they will increase and also what the percentage increases will be.
Also note Text was generally drilled with "old" technology using modern methods seem to result in far higher decline rates see North Sea, Yibal, Cantrell. In fact the seem to result basically in production collapse I'd not even call it decline. This is in exchange for a longer plateau of production around the peak.
I'm not sure Texas's decline is a good model for today's fields. There has been discussions in the past about a potential cliff in production the experts seem to feel it won't happen but I've not seen convincing evidence presented for postulating future decline rates.
The world seems to be at the same position as Texas and I suspect we have a few more years say 3-4 at a plateau which is good news in a sense but the bad news is it seems that when depletion finally does lead to decline it will be with a vengeance. And of course collapse of any of the big fields is not recoverable now. Lurking in the background of course is the potential for a large number of small fields drilled about the same time to collapse together. The boom bust cycles of the oil business leads to a clustering of discovery and production were probably near the end of the cycle for small fields opened in the 70/80's and even fields opened in the 90's that have been aggressively produced.
I guess my main point is the focus on peak oil is not quite right at least as far as production rates are concerned. On the good side the rate of production seems to hold steady till about 60% depletion on the bad side with modern methods decline in production rates may be tremendous once decline sets in. In Ghawar I suspect they will be able to keep production up till say 70% depeletion because of all the lateral wells and water flood but when it goes down it will go hard almost overnight as large numbers of laterel wells water out. This may very well have just happened this month if rumors are to be believed. In any case if I'm right Ghawar produciton will collapse in a matter of months when it finally goes.
I am not aware of any technological advance in the last thirty years that will result in slower rates of oil production from fields. Economically you want to produce the maximum amount of oil in the minimum amount of time so as to make the maximum amount of profit for the minimum amount of interest on the money you borrowed.