| Stumbling Blocks to Figuring Out the Real Oil Limits Story | The Oil Drum | Peak Oil Update - Final Thoughts |
Tech Talk - Oil Supply, Oil Prices and Saudi Arabia
Posted by Heading Out on August 18, 2013 - 3:17am
From the time that The Oil Drum first began and through the years up to the Recession of 2008-9, there was an increase in the price of oil, and that resumed following the initial period of the recession, and in contrast to the price of natural gas, oil has recovered a lot of the price that it lost.
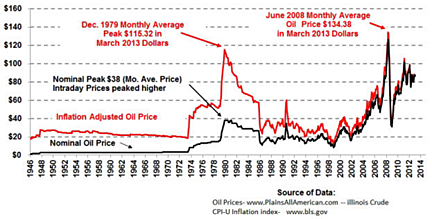
If one were to draw a straight line on that graph from the low point in 1999 though now, there hasn’t been a huge variation away from the slope of that line for long. That, of course, does not stop folk from pointing to the very short, roughly flat bit at the end and saying that oil prices are going to remain at that level, or are even about to decline.
To address that final point first, I would suggest that those making such a foolish prediction should go away and read the OPEC Monthly Oil Market Reports. Remember that, for just a little while longer, oil is a fungible product. OPEC make no secret of the fact that they continuously examine the global economy and make estimates on how it is going to behave. This month they note that the economies aren’t doing quite as well as expected, and have revised down global growth to 2.9%, though they expect next year to be better, and hold to their estimate of a 3.5% growth rate.
But OPEC go beyond just making that prediction - they use it, and data that they have on consumption and oil supplies around the world to estimate how much OPEC should produce each month to balance supply against demand, so that the price will remain at a comfortable level for the OPEC economies. And based on those numbers they tailor production.
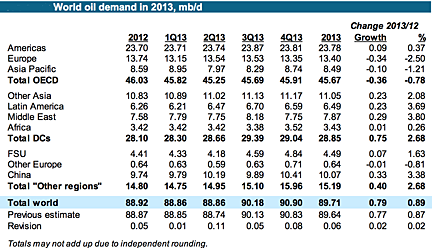
This month, for example, they note that global oil demand is anticipated to grow by 0.8 mbd this year (and by 1.04 mbd in 2014). They anticipate growth in production of around 1.0 mbd from the non-OPEC nations, with projected increases from Canada, the United States, Brazil, the Sudans and Kazakhstan contributing to an additional 1.1 mbd next year. From these numbers they can project that demand for OPEC oil will be slightly down this year, at 29.9 mbd down 0.4 mbd on last year, with next year seeing an additional fall of 0.3 mbd on average.
Thus slight reductions in production from OPEC, and particularly the Kingdom of Saudi Arabia (KSA), can keep the world supply in balance with demand and more critically for them keep the price up at a level that they are comfortable with. Note that in relation to the overall volumes of oil being traded, they are not talking much adjustment in their overall volume (around 1% of the total 30 mbd) in order to sustain prices. The USA produces more, OPEC produces less – not much less because global demand is growing – and the price is sustained.
This has virtually nothing to do with the speculators on Wall Street and the corrections they might impose, this is all about supplying a needed volume to meet a demand and controlling that supply to ensure that the price is sustained.
There are a number of caveats to this simplified explanation, one being the short-term willingness and ability of some producers to keep to their targets. One of the imponderables is the production from Iraq. Although Iraq has been given a waiver through 2014 on the need to limit their production, the increasing violence has led to a drop in production, back below 3 mbd.
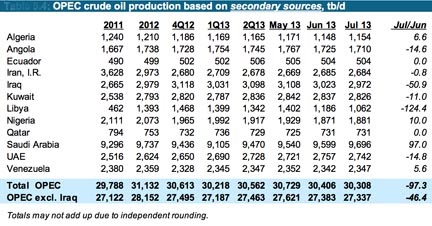
As I have noted in the past, OPEC is sufficiently suspicious of the reported numbers from the countries themselves that they check from secondary sources, and provide both sets of numbers.
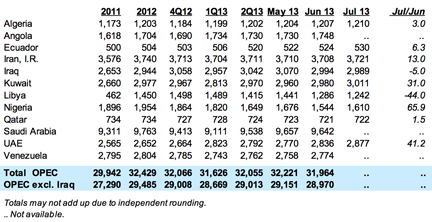
Note, for example, that Iran says that it is producing over 1 mbd more than other sources report, and Venezuela is around 400 kbd light. The balancing act is largely the charge of KSA, since it produces the largest amount and can adjust more readily to balance the need.
One of the other caveats is that the internal demand in these countries is rising, and that lowers the amount that can be exported. This will in time require that OPEC produce more, just to sustain the amounts that they export. And the problem here is the biggest caveat of all. Because KSA cannot continue to produce ever-increasing amounts of oil.
Just exactly how much the country can produce is the subject of much debate, and has been at The Oil Drum since its inception. But if I can now gently admonish those who think it can keep increasing forever and that it has vast reserves that can flood the market at need. This fails to recognize that the major fields on which the country has relied are no longer capable of their historic production levels, and that over the time that TOD has been in existence, production has switched to the new fields that KSA had promised it would, back in time.
But these new fields, including Manifa and Safaniya produce a heavier crude that, for years, KSA struggled, usually in vain, to find a market for internationally. It is only now that it is building its own refineries to process the oil that it can find a global market for the product. Yet those refineries have only a limited capacity. If you can’t ship, refine and market your product in the form that the customer needs, it can’t be sold, regardless of how much, instantaneously, you can pump out of the ground. And so KSA is starting to look harder for other fields. They have increased the number of rigs employed to 170 by the end of the year (in 2005 they had about 20 oil and 10 gas rigs operating), going beyond the 160 estimated earlier, seeking both to raise production from existing fields, but also to find new ones. This is almost double the number that Euan reported at the end of last year. That this is being expedited is not good news! Because new fields will very likely be smaller, and more rapidly exhausted, and may not have the quality of the oil produced from Ghawar and the other old faithfuls.
Realistically, over a couple of years, I would suspect that the oil price line that I mentioned was rising at the beginning of the piece will continue to rise and we are just going to have to accommodate to it.
Contact
- Content: editors at theoildrum dot com
- Tech support: support at theoildrum dot com
License

This work is licensed under a Creative Commons Attribution-Share Alike 3.0 United States License.
HO
Thanks for all the Tech Talks.
A nice note as TOD draws to its conclusion!
Does the recent fairly prolonged difference between WTI and Brent price alter the price graph at the end much?
I understand most fungible oil has changed hands worldwide last few years around the higher Brent price?
(Except oil sold for local consumprion by some exporters.)
best wishes
Phil
If volume is increasing 1% a year but EROEI is decreasing by 1% in net energy terms we're standing still since 1.01 X 0.99 = 0.9999. That's for now. How about when volume decreases by 1% or 2% but EROEI also decreases by say 5% a year? I'm assuming the more unconventional the lower the EROEI, examples kerogen shale and coal-to-liquids.
The top graph also suggests the rebound ceiling for oil is $100, not $150 as we thought in 2008.
I define the ECI (Export Capacity Index) ratio as the ratio of total petroleum liquids + other liquids production to liquids consumption. So, production of 2.0 mbpd and consumption of 1.0 mbpd would result in an ECI ratio of 2.0 (or they were consuming half of production). Mathematically of course, a declining ECI ratio means that the net exporter is trending toward zero net oil exports (and an ECI ratio of 1.0).
Note that some countries with flat net exports, e.g., Russia, which had net exports of 7.2 mbpd in 2007 and in 2012 (EIA), showed declines in their ECI ratios. Russia's ECI Ratio fell from 3.7 in 2007 to 3.3 in 2012.
If we look at 2005 to 2012 data, as annual Brent prices increased from $55 to $112, only seven countries showed increases in their ECI ratios--Canada, Colombia, Iraq, Libya, Kazakhstan, Azerbaijan and Nigeria. If we look at the last three years of data, 2010 to 2012, as annual Brent prices were respectively $80, $111 and $112, only four of these seven countries still showed increases in their ECI ratios--Canada, Colombia, Iraq and Libya. The other three--Kazakhstan, Azerbaijan and Nigeria--showed declining ECI ratios from 2010 to 2012. And of course, Libya comes with an asterisk, because of political unrest.
So, only 4 of the (2005) Top 33 net oil exporters showed: (1) An increasing ECI Ratio from 2005 to 2012, and (2) Maintained an increasing ECI ratio from 2010 to 2012.
Incidentally, some other countries did show increases in their ECI ratios from 2010 to 2012, but they remained below their 2005 levels, e.g., the UAE's ECI ratio increased from 4.6 in 2010 to 5.1 in 2012, but they remained well below their 2005 ECI ratio of 7.6, i.e., the UAE is (so far at least) on an "Undulating Decline" in their ECI ratio. At the 2005 to 2012 rate of decline in the UAE's ECI ratio, they were on track to approach zero net oil exports in less than 30 years.
The overall (2005) Top 33 net oil exporters' ECI ratio fell from 3.75 in 2005 to 3.26 in 2012 (EIA).
Yet that is what most people seem to believe is most responsible for high gasoline prices. Well that followed by Obama and 'big oil' depending on if you are a conservative or liberal.
thanks HO - so - ballpark, what would you say oil price would generally be, say in 2 years, 5 years, 10 years time?
Ah, well see that is why I write the technical stuff so that I can stay away from those tricky prediction questions. Because it is becoming increasingly difficult to see where the future is going. The vulnerability of pipelines in the Middle East is starting to become a little more evident, and if Iraq cannot bring in the extra oil in time I am not sure that - because of the heavier crude available - it will be possible for Saudi to fill that gap in the longer term.
As I noted I find it worrying that the Saudi's are accelerating their drilling program, they don't do that if they are confident that they have enough supplies in hand for the foreseeable future. And those are the potential big players in MENA - Euan seemed to think that the Kurds could work their end of Iraq and send it to Turkey and make things work that way, but the bombings suggest that this may be wishful thinking.
Rune's great work on the Bakken suggests that this isn't going to be the savior that everyone is expecting, and there is a fair amount of smoke billowing around Texas production, where Eagle Ford and total Texas production seem to get interleaved on occasion.
Not that I would bet the lunch money, but if pressured I would expect prices to follow that upward trend somewhat slowly for another year or so and then kick up as some of the more optimistic predictions floating around today are shown to be unfounded.
Yeah, the prediction business is extremely difficult and any prediction can be thrown out the window by an unforeseen event. A war could break out somewhere in the mid-east which could shoot prices higher . . . Libya, Egypt, Bahrain . . . who knows? On the other hand, peace could break out and send prices lower. For example, if a grand bargain were reached with Iran and sanctions were dropped then Iran's oil could hit the world market driving prices down a little bit.
Sadly, I think war is more likely than peace though. :-(
Its a crap shoot. I doubt they are going to fall back to the sub $40 range
The great irony is that $40/bbl may be as dangerous at $140/bbl since there's a higher percentage of high-priced oil production in the mix these days - the fracked oil, deep ocean, and ultra-deep ocean oil. At $40/bbl the super-risky and difficult arctic oil goes flying out the window too. Then when (if) you get another recovery upswing - the price will skyrocket because you've pulled the carpet out from under future production - leading to another economic crash.
As I have noted before, the cyclical pattern of higher annual oil price highs and higher annual oil price lows is very interesting, especially in regard to “Higher lows.” Following are the last three year over year declines in annual Brent crude oil prices (1998, 2001 and 2009), along with the rates of change for 1998 to 2001 and for 2001 to 2009.
1998: $13
2001: $24 (+20%year)
2009: $62 (+12%/year)
If Brent averages $108 in 2013, down from $112 in 2012, it would be a +14%/year rate of change (since the 2009 price of $62), which would be between the +12%/year and the +20%/year rates of change.
Following is a chart of the GNE/CNI* ratio versus annual Brent crude oil prices for 2002 to 2011. For 2012, Brent averaged $112, and EIA data show that the GNE/CNI ratio fell from 5.3 in 2011 to 5.0 in 2012.
*GNE = Combined net oil exports from (2005) Top 33 net oil exporters, BP + EIA data for graph, total petroleum liquids
CNI = Chindia’s (China + India) Net Imports, BP data
Watch out what is happening in India
Not that I would bet the lunch money
Well, why not put a little of your portfolio into something a little risky? If you feel you have even a slightly better insight into the path of oil prices than "the market", you can make pretty decent money going long on WTI futures.
So, is anybody putting their money there??
Westexas?
Heading Out, Nate, etc etc etc....going to miss you. Where might you be posting your thoughts in the future? I apparently will have to change browsers to get to theoildrums.com.
I have been running my own site for some time at Bit Tooth Energy . It covers more than just Peak Oil - there is a weekly column on the use of high pressure water (which I actually did for a living once) and other OT matters - come on over, the water is fine!