This Week in Petroleum 6-6-07
Posted by Robert Rapier on June 8, 2007 - 9:25am
It seems like every week for the past month, there has been a disconnect immediately following the release of the weekly inventory numbers. Yes, gasoline inventories have risen for 4 weeks (and are predicted to again this week). Some will look at that, and think that we are digging ourselves out of this inventory hole. But then after digesting the numbers for a day or so (or even less, as was the case last week), the market reacts differently. The story must be more complex than it seems on a superficial level. And it is.
An OPIS report from June 4th pointed out that some regions are worse off than others:
New England and the Southeast, both regions that could suffer a direct hit in this year's hurricane season, have some of the lowest inventories in the U.S. Just how thin is the supply cushion? About 11 gallons per person is all that is available, according to an analysis of inventory data by Oil Price Information Service.
Here are some excerpts from a story that came out after analysts had digested last week's numbers for a couple of days:
Investors wary that domestic refineries aren’t producing enough gasoline
Gasoline and oil futures jumped Friday on continued concerns that domestic refineries aren't producing enough gas to meet peak summer driving demand.
"The market's realizing that we're just not seeing enough of a supply build," said Jim Ritterbusch, president of Ritterbusch & Associates in Galena, Ill.
"The overall 1.3 million barrel build in gasoline inventories this week is pretty lackluster by seasonal standards and when one factors in that 800,000 barrels of the build happened on the West Coast, it looks very much below par," wrote Barclays Capital analyst Kevin Norrish in a research note. "The East Coast is starting to look very tight indeed."
Despite the increase in gasoline supplies, the Energy Department report showed that refinery utilization was flat last week, at 91.1 percent of production capacity, compared to the previous week.
The increase in gas supplies comes mostly from imports, analysts said.
"An apparent recovery in domestic gasoline output is illusory," wrote Antoine Halff, an analyst at Fimat USA, in a research note. "Refinery crude runs actually fell on the week and a headline gain in gasoline yields is entirely attributable to a surge in imports, which soared to the third highest weekly average ever."
If you look at the historical trend, what has happened is that in every year since 2001, the gasoline inventory gains of the spring flattened starting in June, and then decreased in July and August. The inventory draw was as much as 21 million barrels in 2005. And it is almost universally true that levels at the end of August are lower than levels in June, because July and August are when demand really starts to pick up. This is why many still feel like we have a potential problem.
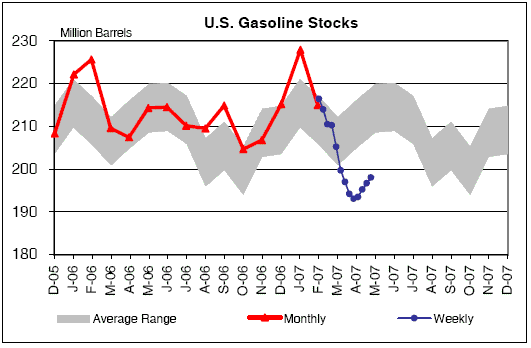
Figure 1: U.S. Gasoline Inventories Through May 2007. Source: EIA
In Figure 1, you can see that while inventories have been on the rise, we are just about at the point that they historically flatten out. Then, toward the latter part of June to early July, they take a nose dive. From current inventory levels, that would drop us below the 190 million barrel mark, which could once again cause prices to spike again.
Yet, we may in fact skate by if there are no unforeseen problems. If we have no disruptions from hurricanes, imports stay strong, and we have no major refinery outages, we are likely to slowly climb out of this hole. But recent history suggests that we are likely to see more draws over the summer, exacerbating an already tight inventory picture.
I also want to include some tables this week that really provide a nice overall picture of what's going on. These tables are courtesy of FTX.
| U.S. Gasoline Data 2006 vs 2007 | ||||||||||||
| Capacity | Prodn | Imports | Stocks | Stock Chnge | Demand | |||||||
| W/E | 2006 | 2007 | 2006 | 2007 | 2006 | 2007 | 2006 | 2007 | 2006 | 2007 | 2006 | 2007 |
| 4/6 | 85.6 | 88.4 | 7.87 | 8.53 | 1.10 | 0.95 | 207.9 | 199.7 | -3.9 | -5.5 | 9.30 | 9.47 |
| 4/13 | 86.2 | 90.4 | 8.10 | 8.66 | 0.91 | 1.04 | 202.5 | 197.0 | -5.4 | -2.7 | 9.10 | 9.25 |
| 4/20 | 88.2 | 87.8 | 8.47 | 8.54 | 1.34 | 1.16 | 200.6 | 194.2 | -1.9 | -2.8 | 9.01 | 9.16 |
| 4/27 | 88.8 | 88.3 | 8.60 | 8.78 | 1.02 | 1.15 | 202.7 | 193.1 | +2.1 | -1.1 | 9.10 | 9.26 |
| 5/4 | 90.2 | 89.0 | 8.92 | 8.93 | 1.65 | 1.22 | 205.1 | 193.5 | +2.4 | +0.4 | 9.35 | 9.34 |
| 5/11 | 89.8 | 89.5 | 9.18 | 9.05 | 1.45 | 1.53 | 206.4 | 195.2 | +1.3 | +1.7 | 9.33 | 9.40 |
| 5/18 | 89.7 | 91.1 | 9.20 | 9.20 | 1.63 | 1.30 | 208.5 | 196.7 | +2.1 | +1.5 | 9.19 | 9.43 |
| 5/25 | 91.4 | 91.1 | 9.21 | 9.26 | 1.55 | 1.61 | 209.3 | 198.0 | +0.8 | +1.3 | 9.43 | 9.48 |
| 6/1 | 91.0 | 9.14 | 1.40 | 210.3 | +1.0 | 9.37 | ||||||
| 6/8 | 92.7 | 9.21 | 1.41 | 213.1 | +2.8 | 9.41 | ||||||
| 6/15 | 93.3 | 9.35 | 1.08 | 213.4 | +0.3 | 9.43 | ||||||
| 6/22 | 93.8 | 9.33 | 0.96 | 212.4 | -1.0 | 9.54 | ||||||
| 6/29 | 93.1 | 9.21 | 1.27 | 213.1 | +0.7 | 9.65 | ||||||
| 7/6 | 90.5 | 9.18 | 1.10 | 212.7 | -0.4 | 9.62 | ||||||
| 7/13 | 92.9 | 9.23 | 1.05 | 214.2 | +1.5 | 9.57 | ||||||
| 7/20 | 92.5 | 9.09 | 1.01 | 211.0 | -3.2 | 9.57 | ||||||
| 7/27 | 90.8 | 9.04 | 1.33 | 210.1 | -0.9 | 9.64 | ||||||
| 8/3 | 91.6 | 9.17 | 1.22 | 207.7 | -2.4 | 9.70 | ||||||
| 8/10 | 91.5 | 9.24 | 1.34 | 205.4 | -2.3 | 9.53 | ||||||
| 8/17 | 92.8 | 9.27 | 1.32 | 205.8 | +0.4 | 9.57 | ||||||
| 8/24 | 92.9 | 9.14 | 1.18 | 206.2 | +0.4 | 9.61 | ||||||
| 8/31 | 93.6 | 9.23 | 1.03 | 206.9 | +0.7 | 9.62 | ||||||
| 9/7 | 93.0 | 9.07 | 1.08 | 207.0 | +0.1 | 9.37 | ||||||
| 9/14 | 93.4 | 9.16 | 0.80 | 207.6 | +0.6 | 9.23 | ||||||
| 9/21 | 92.4 | 9.26 | 1.46 | 213.9 | +6.3 | 9.29 | ||||||
| 9/28 | 89.9 | 8.90 | 1.11 | 215.0 | +1.1 | 9.08 | ||||||
[These are weekly estimates, subject to revision. Data source - EIA. Week ending dates are for 2007 (2006 is a day more). Capacity is utilization% of fully operable. Imports, production and demand are million barrels per day. Stocks are millions of barrels]
| U.S. Gasoline Stocks 2007 by PADD District | ||||||||||
| East Coast | Midwest | Gulf Coast | Rocky Mtn | West Coast | ||||||
| 5-yr avg | 60.0 | 52.1 | 64.0 | 6.2 | 30.5 | |||||
| W/E | Stock | Chnge | Stock | Chnge | Stock | Chnge | Stock | Chnge | Stock | Chnge |
| 4/13 | 52.8 | -1.5 | 47.6 | -0.4 | 63.1 | -2.4 | 5.7 | -0.1 | 27.7 | +1.7 |
| 4/20 | 52.7 | -0.1 | 46.7 | -0.9 | 62.4 | -0.7 | 5.4 | -0.3 | 27.0 | -0.7 |
| 4/27 | 53.2 | +0.5 | 46.4 | -0.3 | 61.8 | -0.4 | 5.4 | 0.0 | 26.3 | -0.7 |
| 5/4 | 52.6 | -0.6 | 46.7 | +0.3 | 61.4 | -0.4 | 5.4 | 0.0 | 27.4 | +1.1 |
| 5/11 | 51.9 | -0.7 | 46.4 | -0.3 | 62.8 | +1.4 | 5.5 | +0.1 | 28.6 | +1.2 |
| 5/18 | 52.5 | +0.6 | 46.1 | -0.3 | 63.7 | +0.9 | 5.6 | +0.1 | 28.8 | +0.2 |
| 5/25 | 52.3 | -0.2 | 46.9 | +0.8 | 63.8 | +0.1 | 5.5 | -0.1 | 29.6 | +0.8 |
| 6/1 | XX.X | YY.Y | XX.X | YY.Y | XX.X | YY.Y | X.X | YY.Y | XX.X | YY.Y |
[Source: EIA. 5-yr average is the average inventory level at the end of May]
Update:
The numbers are out. Gasoline made a strong gain this week, as imports remained high. Demand remains well above last year’s numbers. Given that imports were down slightly over the previous week (but still near all-time high levels), I am going to have to look at this a bit more to figure out why gasoline inventories made such a strong move up.
The highlights (as I see them):
Refineries operated at 89.6 percent of their operable capacity last week. Gasoline production dropped slightly compared to the previous week, averaging over 9.2 million barrels per day, while distillate fuel production also declined, averaging nearly 4.3 million barrels per day.
U.S. crude oil imports averaged over 10.2 million barrels per day last week, up 222,000 barrels per day from the previous week. Over the last four weeks, crude oil imports have averaged nearly 10.4 million barrels per day, or 147,000 barrels per day more than averaged over the same four-week period last year. Total motor gasoline imports (including both finished gasoline and gasoline blending components) last week averaged 1.5 million barrels per day. Distillate fuel imports averaged 229,000 barrels per day last week.
U.S. commercial crude oil inventories (excluding those in the Strategic Petroleum Reserve) inched higher by 0.1 million barrels compared to the previous week. At 342.3 million barrels, U.S. crude oil inventories are just above the upper end of the average range for this time of year. Total motor gasoline inventories climbed by 3.5 million barrels last week, but remain well below the lower end of the average range. Distillate fuel inventories increased by 1.9 million barrels per day, and are just below the upper end of the average range for this time of year.
Total products supplied over the last four-week period has averaged nearly 21.0 million barrels per day, or 2.4 percent above the same period last year. Over the last four weeks, motor gasoline demand has averaged nearly 9.5 million barrels per day, or 1.5 percent above the same period last year.
Contact
- Content: editors at theoildrum dot com
- Tech support: support at theoildrum dot com
License

This work is licensed under a Creative Commons Attribution-Share Alike 3.0 United States License.
For me, Robert, it just boggles the mind that "This Week in Petroleum" (gasoline section) shows prices were almost 27 cents higher than a year ago (6/4/07) and here's the demand graph.
As I've said before — and I've been criticized for saying it — this is not the way they teach it in Econ 101.
Prices go up, and Americans put the pedal to the metal... So if we really do have shortfalls, these so-called "consumers" are going to go looking for someone to blame. It won't be themselves.
best,
Dave
One way to explain it--prices are up because of a demand curve shift, not because of a supply curve shift. That's the econ 101 explanation. We can get to marginal elasticities in a later course.....
That's possible.
I think it is partly because gasoline has been priced quite a bit below its inherent value. This is because the retailing of gasoline is hyper-competative. In most places there are dozens of nearby gasoline retailers all selling the exact same product and all advertising their prices on big signs for all to see. The result is that gas is very cheap relative to what it can do for you. Now that the price is rising, people complain because they were used to something cheaper, but it is still a bargain.
Peaople who use gasoline on a discretionary basis mostly (like for vacations, joy-riding etc) recognize that its still a bargain and aren't inclined to cut back. To the extent that higher gas prices cause some people to use less, it makes the use more enjoyable for those who continue to use (by reducing congestion).
People who have put their self in a position where they are required to use substantial amounts of gasoline just to accomplish the daily necessities of life are going to be squeezed, but can't give up the gasoline so they have to give up something else.
How all this summer fun is going to run? The standard response to blame Oil has been seen but there are a lot of people out there that don't read TOD that will start looking beyond to more realistic answers,... maybe.
My thought is that I would like this to happen gradually. I think that if the realization that there is more to prices, than gouging and lack of diligence, comes at too swift a rate then the wheels could come off the financial market cart and we could all be suddenly sitting in shit creek after breaking through the bridge of orderly conduct. (well that should bring the literati after me with pitchforks and rusty shovels). Anyway is our course to publish or not to publish, is it wiser to sit quiet pen on desk or take up electric publishing and disseminate widely? To warn or not to warn, that is the question. (Oh my they will beat me badly now). Rate of change laddies, rate of change what is the appropriate rate of public awarness change?
CrystalRadio, publish away, unless you've got the nation's attention somehow, you're not going to get a very wide audience. The way I see it, TOD and others have been announcing this with trumpets for years. And no visible change in the tides of public opnion.
Now if we could get Paris Hilton to start giving press conferences on peak oil... But I do think it would behoove all of us to warn our families, friends, etc, who are likely to be most impacted.
Hi sylviah,
I feel awareness in groups comes suddenly like a fire does once the kindling temperature is reached . I think with what has been happening through TOD's efforts along with these price hikes we could be getting to that point. (Remember 1973?) Once the fire starts is it controllable? Publish yes, but what? We don't want to be shouting fire in this crowded auditorium once the fire starts. Maybe more stories along the line of 'This way to the exit ladies and gentlemen'?
One hobby horse I have been riding, where the ecological bunch are missing it,is that it has emphasized the blood sweat and tears and not really touched what the upside of change might be. How about Westexas's ELP ideas with the codicil of 'and Enjoy it', because there will have to be enjoyment or that's it, enter Conan.
Publish yes, but what?
I am trying to "pre-position ideas".
http://www.lightrailnow.org/features/f_lrt_2006-05a.htm
http://www.lightrailnow.org/features/f_lrt_2007-04a.htm
Perhaps we will start mitigation beforehand, but we may only react "after the fact".
I want viable concepts to be scattered about that desperate people can grasp, instead of corn ethanol, sarconol and snake oil.
Best Hopes,
Alan
Hi Alan,
'publish yes, but what?'
I bought a nuke of bees the other day and today I put them into a hive ... those guys are fun (as long as you can keep them from 'dieoff') I once caught a swarm and looked like those pictures you see of beekeepers with beards and hair made of bees. Anyway maybe there is a real beekeeper on site that knows the stuff who could give a primer about bee keeping post P.O.?
Have Fun,
CR
After-thought ... maybe TOD could make a list of articles that would be good P.O. material and those who have the info could write them...start with of course Bee Keeping. :>)
I think Eric Blair said he keeps bees.. It was somebody who said that their hives only work organic crops, and are apparently healthy and fine. (Maybe a month ago or more)
Bob Fiske
Alan, I agree. Best to get some ideas for the MSM to grab ahold of.
Add to that list less than 6x per week mail service. 3 x?
Mail Service 3x/week when postal person has to drive more than, say, 8 miles for the daily route and 6x/week for walking routes and <8 mile routes. Perhaps 5x/week for routes in the 8.1 to 12 mile range.
An incentive to move into TOD ! And no energy is really saved by reducing walking routes. EV Postal Vehicles can work well for short routes with existing lead-acid batteries (perhaps with a PV Panel roof to self charge much of the time).
And that way I get to keep my 6x/week service (only back these last 4 months in New Orleans).
Good Idea,
Alan
I also added to my "Saudi Arabia has Peaked..." list the suggestion made by another TODer.
For six years, any car that meets Japanese or EU standards for safety and pollution AND gets x1.5 (50% better) mileage than that years CAFE can be sold in the US.
Re: shift in the demand curve
We can get to marginal elasticities in a later course
Shift to the Right
Have a good one,
Dave
I may have missed that positive news report about oil and gasoline, can somebody fill me in ?
Well, there was the new Expedition commercial that touted how fast one could load the family + luggage for an "outing" whilst their hapless neighbors were still packing/cramming their minivan.
If one looked at the marginal cost of operation between an Expedition and a minivan, the cost of that time saved should be well in excess of $10,000/hour.
And of course, Hummers were explicitly designed to appeal to the reptile brain, which operates under different demand curves (eat or be eaten).
Let us not forget the mother who dropped off Johnny at a new school in a Hummer and the other kids muttered "How cool" as Johnny confidently strode in the school door with his Hummer status.
Such is the power of advertising.
Best Hopes for Mammal Brain Thinking,
Alan
MTBE-free gasoline just tastes better! But seriously, population growth, economic growth, and growing numbers of automobiles/trucks/etc all act to shift the aggregate demand curve. That would account for higher prices with higher demand, especially if the supply curve is steep (relatively inelastic). As long as supply grows, we shouldn't expect to see "demand destruction" in the aggregate, because we have been seeing demand growth pushing up prices. Aggregate demand destruction comes (has come, will come?) with shrinking supply, and we will know it when we see it, because consumption will be lower and prices will be moooocho higher. Unless b.cole is right.....hah.
I think of it this way: the aggregate demand curve is just the sum of all of the household demand curves in the country. Unfortunately, it's a form of average, in that you can't see the demand curves of the vast lower and middle classes separated from the demand curve for the wealthier classes. I suspect that for the top and bottom of the income spectrum, the demand curves are basically vertical. The poor have very little opportunity to change their consumption and for the wealthy gas is too cheap to think about.
That leaves the middle of the income spectrum that can change their demand. Unfortunately, that portion of the population has been shrinking over time, and I suspect their changes in consumption are simply being drowned out by increasing populations of lower income people and the wealthy who are ignoring the prices. We either need more time for the middle class to make adjustments, or higher prices to force the lower income population to stop driving.
The big reduction I expect to see is in the commercial sector. Eventually the reduction in construction will result in less consumption for business. I don't think most people understand how much of a bubble we've had in real estate. We need far more builders, lenders, and real estate agents to lose their jobs before we clear out this overhang. Of course, that probably means a recession as well, as in the early 70s. The stagflation is so painfully obvious now, it's a wonder the word isn't on the front pages of the papers.
It's true that the poor have very little opportunity to change their consumption in the short run, but they have plenty of ways to change it in the medium term: They can move closer to work, get a job closer to home, start carpooling, start bicycling to work, etc.
For these changes to get made, though, gas prices need to stay high long enough for these changes to make sense. A year might be the relevant period for signing a new lease.
That seems right, in general. But in my neighborhood construction projects continue and some are accelerating their plans. One large, mixed use project that was to be phased is going ahead all at once:
http://www.saulcenters.com/properties-metro/va/clarendon/index.htm
Another, that is currently held up by NIMBY lawsuits will include a lot of affordable housing (60% of median income qualify) within 2 blocks of metro
http://www.1bc.org/dp_template.html
Other developments are also going forwarded and more in the hopper waiting approvals. I hear similar things from other localities that have transit access and established plans for walkability.
It's amazing given the increase in construction costs, but that's what is happening so far in areas like where I live it seems.
More people moving from car dependent areas to places like this would affect the elasticity of demand over the long term.
As biofuels get added to the mix mpg goes down(less bang for the buck!).ie. higher demand for same miles driven.It would interesting to see stats on miles driven.
Cheers.
If you read my article Unhappy Motoring, you will see that I discuss miles driven and touch on the ethanol explanation. There are claims of fewer miles driven.
best wishes,
Dave
Well, 27 cents is not much higher than one year ago, though I confess I would expect the cumulative effect of higher prices over the last several to depress gasoline demand.
A few q's for RR or anyone: There are 200,000 gasoline stations in the US (quick and dirty research, includes con. stores which sell retail gasoline). Is the capacity of these 200,000 stations included in inventory data?
Are the gasoline inventory figures an actual count, or derived from seasonally adjusted sampling? Have there been any changes in the sampling techniques? Methods of computation? Large budget cutbacks which might decrease accuracy of sampling or polling?
Or, has the sampling been improved lately, and now we have better grip on reality than last year?
The reason I ask these q's is that in one stage of my somewhat doleful career, I worked with federal figs constantly. To the point of calling up mid-level fed staffers and "getting the poop." Deep in the bowels of the BLS or elsewhere.
When the numbers look wacky, it often was a collection glitch, not a real world glitch.
The way this year gasoline inventories shot up far above norms, then shot down below norms, and now are rebounding sharply looks like a seasonal adjustment factor, or sampling assumption, which has gotten out of whack. I am not saying that is a fact. I am only asking.
I believe the weekly data from DOE comes from actual data supplied by a sample of refiners. We used to get them from our domestic affiliate for our system the day before the report. If you knew other players in the game who had similar info from their own systems, you could make a slightly educated guess a little early. But in reality, the week to week swings are really pretty trivial volumes (1-2% of the total in primary storage. Secondary/tertiary/auto tanks have quite a lot of stock as well).
Longer term info is based on data supplied by all the players added up IIRC. If you are really interested, I'm pretty sure DOE has their methodology described somewhere in that huge website. I doubt there has been any improvement in data collection. Still, if you are trying to see the forest, look at the rolling 4 week averages. Tends to take some of the noise out.
These swings are not that unusual compared to other periods. We just don't have as much slack in the system anymore to catch up quickly.
Also, keep in mind we didn't really "shoot up far above norms". We were a few million bbls high then over shot a little low. At 10 MMBD production +imports, the swing is no more than 3-4 days production. And the variation to the "5 year band is less than 1 day's production.
My gut is that the warm Dec we had led to heating oil prices crashing down dragging crude with it. OPEC cut production and actually made the cuts instead of lying which was the historical norm. Refiners starting making/tanking gas for spring since heat demand was low (shifted production into spring mode). Then a normal to cold Jan came and drew heating oil stocks. They switched back to making heat and then the shutdown season hit. The excess gas piling up faded away as a result.
Right now, we're building gas stocks even with lower than usual refinery % operated. That's bearish for price and futures have dropped from $2.4 (June contract in late May) to sub $2.2 (July contract). Players are assuming that if refiners can keep up with only 90% operating, when we gat back to a normal 95%+ in summer, supply will surge. We'll see.
Prices go up, and Americans put the pedal to the metal... So if we really do have shortfalls, these so-called "consumers" are going to go looking for someone to blame. It won't be themselves.
I think that a mentality takes hold when the situation is hopeless. When the future is bright and there is hope, everything is measured and planned. When it's dark with little hope, people live for the day. There's no other way to explain US spending (and borrowing) habits.
When there's a plan and hope and a reason to sacrifice, people do it and have done it. No one's providing that these days, not here, not yet. Warning about peak oil and other calamities on the horizon, although a crucial first step, doesn't do it. There has got to be a political movement that takes these issues up and organizes people to deal with them.
Re: live for the day
I agree. The best explanation for all this is lies in the psychology of groups under threat. Americans are partying like its 1999 (to quote the musician/analyst Prince).
Why?
The vast majority of Americans don't think they're under threat from peak oil - they probably don't think about it at all - so it doesn't make sense to analyze them as if they did. You appear to be assuming that most people have seen and have believed the same information you have, which is almost certainly not true.
The behaviour of American oil consumers is verrry simple to explain: they don't see a peak oil threat, so they don't see a reason to stop consuming.
(Whether they're right is another matter...)
There is thing, you may have even heard of it, called the unconscious.
Dave
A lot of people know things are going very poorly. They are angry. They don't know at who. So they do retail therapy. Go shopping.
What else are they going to do? Save? Work harder? No, they are building up fat because they sense the sky is falling. You only go around once. Grab for all the gusto. Etc....
cfm in Gray, ME
Generally income elasticity is much larger than price elasticity. Since the economy grows each year, it takes more and more price to keep demand down.
GDP growth is not mirrored by average wages, which according to the New York Times (here), were an inflation-adjusted $17.44/hour in February and are now falling. In late 2001, the average wage was $17.24 (again, adjusted). Each gallon of gasoline bought today as opposed to in 2001 is obviously costing people money. Yet they buy more and more. How can this go on?
I think it is due to easily available credit and people's apparent willingness to accrue (unsustainable) debt. The credit debt is not "real money". Only the minimum payment is "real money". And since I am poor, I am only too aware of the difference.
Of course, I am dealing with the short run, as the economists say.
Does anyone have a graph that plots crude oil prices, gas prices and household debt about 10 years back? Interested to see the results.
Here's an alternative explanation that draws from Von Mises:
People arrange their wants on a scale in order of preference with the most desired things being at the top of the list and those less desired being lower on the list. For each thing higher on the scale of wants they would prefer it to something lower on the scale. THe inter-meshing of these scales of desires is what causes trade to happen. A baker has too much bread and wants bread less than the shoemaker wants it so they trade, etc. The scale is not static though and changes regularly in regard to satiation of wants, changing conditions, etc. More about this kind of reasoning over here.
So anyway, most people prefer driving to work over eating anything at all besides top ramen and having zero entertainment besides watching tv. People will live in their cars or simple temporary shelters next to walmart before they give up driving. Most suburban tract homes and neighborhoods are unlivable without cars, they might as well be located in the middle of the Sahara for most people if they couldn't drive to them.
abelardlindsay
I had a short conversation with a woman with a Winebago-type vehicle at a barbeque joint last summer. She and her husband were waiting for the social security check to get fuel to move. Since the government doesn't include fuel price inflation in the consumer price index, I'm sure they are screwed even worse today. Wonderful life, living in a cheap trailer park in a bad part of Houston.
At any rate, I'm not sure its a concious choice being made by folks. Right now GMAC and Ford Motor Credit are offering a $5,000 rebate to anyone who purchases a gas guzzler, no matter your credit status or income. For Joe Sixpack, who is already over his head in debt, it looks like a way to pay the light bill and have a sexy truck. It doesn't look like the trap closing a little tighter. Its the same with the suburban house. The fact that both adult members of the house have to stay employed and that one or both of them may have a 20 or 30 mile commute doesn't enter in to the purchase decision-its a new, shiny house and the kids can go to an all white school district. After a year or two the 2nd mortgage as an ATM sets in, and the poor slobs are swallowed by debts.
What I'm saying is that its a series of impulse decisions and bad judgements. Television is their only news source, and they flip the channel at any news that doesn't feature Paris Hilton. They get home after 3 hours of commuting and 9 hours of work, dealing with the kids and mowing the grass at the McMansion and a "reality show" helps 'em relax, and Glenn Beck helps 'em hate and focus blame on everyone but their own poor decisions. Their parents aren't any help, their own poor decisions put them in a RV without the funds to drive away until the social security check arrives.
Aristotle said 2500 years ago that most people were natural slaves. He thought that moderation in all things was the key to freedom. Its an excellent ideal, but I've never figured out how to moderate-with me its William Blake's "Too much, or not enough" and "The road of excess leads to the palace of wisdom" (these are some of the proverbs of hell from The Marriage of Heaven and Hell).
I do know that for my own personal peace I have to be kind and compassionate to people, and since I'm blessed with a brain (or maybe cursed), some small measure of articulateness, and a f@#kin' guilty liberal consience, try to be politicially and socially active. Its probably just pissing into the wind, oh well.
Lose the liberal conscience, bob, it's just a genetic throwback to when humans lived in small inter-related bands. The people out there are not your brothers.
Interesting comments above about people subconsciously putting on fat because they think hard times are coming. There's a definite 'end of empire' feel about. Perfect alibi for a lard butt like me!
I just blame the food in New Orleans :-)
If I did not walk so much, it would get out of control !
Best Hopes for good walking weather this summer :-)
Alan
Not just as another Bob, but I have to say we certainly are brothers. To counter Alan's take on it, I think it pays to treat others as 'family', to what degree you can. It may be good for them, it certainly is good for yourself. As Twain said, "Always tell the truth. This will gratify some people and astonish the rest."
Or Kevin Kline in Silverado.. (With Scott Glen)
"..Offend anybody lately?
Not for five years.
- Jefferson City?
- No. Leavenworth.
Never been in there.
They jumped you
out of the blue?
I had to get up anyway.
Me, I'm riding along
minding my own business.
Four cowboys come by, and we decide
to ride together. Friendly as can be.
I figure you should approach life like
everybody's your friend or nobody is.
Don't make much difference.
Suddenly everybody's
pointing their gun but me.
Guess they admired my horse.
Looks like that's not all
they admired.
Yep. My whole rig.
I don't care much about the rest...
but I surely will miss
that bay.
'Running on Empty' might describe the American Consumer, who accounts for about 70% of the US economy.
http://www.atimes.com/atimes/Global_Economy/IF09Dj01.html
Above is a link to a short read by Max Fraad Wolff describing the recent state of the American Consumer. It is not a rosy picture and shows among other things: 1) Real and disposable personal income is falling while personal spending is still rising.
2) US GDP growth flat to possible recessionary.
3) Disposable personal income vs personal outlays were negative 132.8 billion in April - Negative 67.8 billion in March. The problem of more borrowing? Or, do these numbers show that the high end of consumers are distorting the picture? Nettlesome...
4) April new housing report shows 10.6% year over year sales decline and a 6.5 month inventory backlog. Decline in median home price year over year 11%. The housing sector since 2001 accounted for 20-35% (I know, a large spread) of employment growth and loaned Americans hundreds of billions of dollars for discretionary spending.
IMHO - While the term 'American Consumer' takes in a wide spectrum of people with an equally wide distribution of incomes and expenditures one has to wonder when the low end of the spectrum will begin to be priced out of the gasoline market...since we all presumeably need an address to obtain a drivers license and we all must eat and bathe occasionally. Another recent economic survey of American Consumers (appeared in my local newspaper) has shown that contrary to popular belief, the 'discretionary spening' mentioned above has been used primarily on medical emergencies, emergency household repairs, emergency vehicle repairs and other real needs vs the common myth that most home mortgage borrowing goes to purchase yachts or other luxury items. Common sense, which in no way resembles economic reality, is telling me that the low end of the spectrum of American Consumers is going to be pinched very hard and very soon.
Good work, as always, Robert!
Any more insight into 2 Million barrel difference in gain?
Just EIA accounting catching up with it's errors, or ...?
Looking at FTX's chart going forward from here, looks like there is only ONE (1) more week of potential serious gains, and then it starts to weaken from there out. Not encouraging.
Last point, isn't the 6/1 data out already? Your chart stops at 5/25. I thought we were reviewing 6/1 yesterday on the drumbeat.
Thanks
Nice analysis, Robert. Things don't look very good to my eye, especially considering refinery utilization dropped an eye-opening 1.5% despite the inventory gain. I suspect US refineries are, how to say, wearing out like an old automobile. "Last year I fixed the brakes, this year it's the door hinge, tie rods and universal joints."
Driving, to my thinking, and like so many other things we use, enjoy or on which we grow to rely, has a habitual element based partly on convenience and pleasure, partly on necessity, so is somewhat inelastic. Also to my thinking, marginal gasoline costs need to rise considerably before people will change those habits. I mean, so many purchased items in our culture (like those lousy CDs I bought yesterday) can more easily be foregone than driving to the gym, work, ski hill, dog house hotel, whatever. Short Wal-Mart, in other words.
Just in from Yahoo/AP:
Oil dips on profit-taking, Gonu relief
http://news.yahoo.com/s/ap/20070608/ap_on_bi_ge/oil_prices
bloomberg saying the same thing
http://www.bloomberg.com/apps/news?pid=20601087&sid=aSG7tpjGOsyg&refer=home
also says that after memorial day things ease up on the demand from gasoline, which is not what Robert says, and I think the July August vacation time is a driver for gasoline as people rush to the beach, and other locations.
Also in a side note Gold is supposed to climb to 850 in the medium to 1000 according to JP Morgan
http://www.business-standard.com/common/storypage_c.php?leftnm=10&autono...
Quid Clarius Astris
Ubi Bene ibi patria
Cost of car
You buy a car, which may last a decade (I've done better). That's $1500 or $2000/year of ownership or even more, assuming you pay cash. You need insurance, which runs the better part of a thousand dollars a year (I'm in Massachusetts, but have a flawless driving record so far). Then there is other maintenance, wich over the lifetime of a car is hundreds of dollars a year. You are now up to $3000 (give or take a lot) in *fixed costs* on the car, without taking it out of the driveway. Suppose you drive 12500 miles a year (there's a lot of range here) at 25 mpg average. That's 500 gallons a year.
Until gas reaches $6 a gallon, your car is primarily a *fixed* cost, independent of how far you drive. If you drive a $50,000 SUV, the cost is even more fixed. The cost of driving to a store or whatever every day, adding 1000 miles per year to distance traveled, is under 10% of the cost of car ownership, and doubling the cost of gas changes this very little.
Ah yes, insurance and the auto,
I am curious as to how many states have a rule that you must have insurance to get plates etc.
In some states there is no such law, and in some its weak as in TN.
In TN there is a law but its weak. You don;'t have to have proof of insurance to get the tags. If you're in a wreck and don't have it then you get a ticket for that and you will loose your license until you pay of the damage and other costs from the accident if you are at fault.
There is also a "loophole" in the law. You can put up a bond of I think 500 bucks. This bond takes the place of "insurance". they can't take your license away, but you would still be liable for the money's from the accident.
I am betting people when they can will start dropping insurance because of the high cost. Which is another hidden way to still afford the gas.
Quid Clarius Astris
Ubi Bene ibi patria
Don't forget road tolls. In Toronto, the only toll road is highway 407, where they bill 17.6 cents/km. This road is packed during the rush hour. http://www.407etr.com/About/custserv_fees.asp
My car, a full size volvo sedan, uses ~9l/100km at 120km/h. So I'm only paying 9.9c/km in fuel (@$1.10 per litre). So driving on the 407 is like paying an extra $1.96/litre for fuel. Gas prices have a long way to go before people really start driving less.
I have noticed small used cars for sale have vanished...
even the older rusty civics and metros are being put back to work.
Correct.
I've been saying that for years.
It's also true for houses. The major expense for my family is the taxes on our house (close to 50% of the cost of ownership - after the mortgage is paid) followed by maintance and insurance. Energy costs would have to increase by 3x to be signif. but then we'd face the receding horizon problem because rising energy costs would increase taxes ....
Energy cost factors will not force the prudent middle class or rich to give a damm. There must be a better way - a consumption tax like a carbon tax.
We can't consume our way to sustainability.
My cost of car
A different strategy.
I bought a 1982 Mercedes Benz 240D (manual transmission) with 68,000 miles in pristine condition for $11,500 a couple of years ago. I still spent over $2,500 restoring any worn parts even if they were not close to failure (shocks were the biggest $ item). So far thus year, an Optima battery and stainless steel braid over teflon brake lines (a precautionary upgrade over rubber) were the major cost items.
Liability insurance is $720/year.
In a normal month, I drive about 120 to 180 miles and burn 4 to 6 gallons of diesel/monthly annu. Add some exceptional months (helping someone rebuild on the other side of town, evac) and I am about 2,000 to 3,500 miles/year.
Absent an accident, this should be the last car I ever own. 30 more years of driving and I will be *FAR* short of the mileage limits of this car (4 to 500,000 with excellent care). New/Refurbished seat springs & horsehair in 20 or so years, rubber will not last forever even with Armorall. New tires every 7 or 8 years to avoid dry rot.
Still, overall reasonable costs. Perhaps $1,500/year plus sunk cost to buy (and hopefully not replace).
If I drove more, repair and running (fuel, filters, tires, oil change) costs increase, as do the odds of an accident. And at 12,000 miles/year, I might actually wear the car out before I die or stop driving !
In summation, driving an extra 5,000 or 10,000 miles/year not only costs more fuel, it also requires more oil changes, filter changes, tires, batteries, windshield wipers, tolls, front end alignments, shocks, brake jobs, belts, headlights bulbs, wheel bearings, transmission work, accidents and more. And cars need to be replaced more often !
Extra miles are hardly "fuel only" charges !
Best Hopes for Ultra Low mileage cars,
Alan
Alan- That is a great car. In Los Angeles, you could convert it to run on vegetable oil or diesel you make yourself, and many are doing that here. I am keeping my 1986 Isuzu Trooper 'till is has 400k on it. I am halfway there. Unfortunately, it burns gasoline.
AlanfromBigEasy...You should consider doing your oil and oil filter changes on a time instead of mileage basis. Simply driving your vehicle a few miles after an oil/filter change will create a thin layer of acids from the combustion process that will rise to the top of the oil in your autos crankcase when you turn off the engine. The acid will etch a fine line into the steel that it is contacting and can cause serious crankshaft and bearing problems if left floating on the oil for long periods of time.
I have a 2001 Dodge Dakota pick up that I bought new and the odometer just turned over 27,000 miles. It has a large V6 engine but since the vehicle is light it gets decent milage for a truck, about 18 mpg around town and 22 on the road at 75 mph. Obviously I dont drive it often but I still change the oil/filter every three months and sometimes just start the engine and let it idle for 15 minutes or so to charge the battery and circulate the oil in the engine. I have a couple of Harleys that I ride 90% of the time and they get about 43-50 mpg depending on how fast I run them. With the large saddle bags and luggage racks on Harleys I can carry a lot of groceries and often do. I have found the newer Harleys to be much lower maintence vehicles than the older ones that I have owned. I also keep a large stock of spares and two extra sets of tires for the bikes. Anything that might prove hard to come by in the future. During WW2 tires were among the hardest items to aquire for Americans that were issued ration books. Most people simply didnt qualify for tires according to war time regs so they resorted to innovative ideas to patch and continue to use tires that were showing cord with no rubber or tread left. Of course, they were driving at much lower speeds. There were no interstates then. Best of luck.
I use Mobil 1 5w40 "Truck & SUV for Gasoline and Diesel Engines" motor oil (7 quarts/change for a 2.4 l engine) and change every 15 or 16 months. ALL of the diesel certifications available for this "not cheap" oil.
I talked to a Mobil lubrication engineer (got the # from a Mobil distributer). LOTS of acid buffering and since sulfur in diesel fuel dropped to almost nothing in mid-2006 (combustion blowby adds sulfuric acid to the oil), the acid buffering will be excessive. They formulate the oil for sulfur levels x600 today's levels (diesel for off road equipment in Mexico).
Since I usually walk or take public transportation for trips of a mile or two, I warm up the radiator fluid to operating 90 C, which should boil off water condensate in the oil from "just sitting".
These engines are incredibly robust and over-built/over-engineered (and heavier than a V-8). When abused, they still last 250,000 to 300,000 miles. The diesel fuel pump uses engine oil, and not the fuel itself, for lubrication. To quote one "Grease Car" converter, the fuel pump can push pureed bananas. Designed for congealed #2 in sub-zero weather.
I put in an Optima battery which is supposed to hold a charge longer and be 15x as vibration resistant. No need to "charge the battery".
The bumpers are steel, the doors "clunk" when closed, steel window winders, every detail seems well engineered and well built. The 240D got the "simple solutions" instead of the more complex ones of the higher models.
Thanks for Your Concern :-)
Alan
Just got a wood and leather steering wheel for Otto.
http://cgi.ebay.com/ebaymotors/ws/eBayISAPI.dll?ViewItem&item=2601228031...
LOL, I got enough parts under the bed to build two more bikes.
what is the difference in reliability in the EIA inventory numbers vs. those of the API? they are often quite different, are they not? is it too facile to assume that the "gummint" numbers have inventory too high while those of the "industry", API have them too low?
Here is a visual map of the "PAD districts":

and here is a page showing the graphs for each district, including this week's jump upward:
http://www.eia.doe.gov/pub/oil_gas/petroleum/data_publications/weekly_pe...
What we see is that the only real problem is in PAD 1, the Eastern district. In PADs 3 (Gulf coast) and 5 (West coast) we are actually well within the average range, in fact towards the high end of average. PAD 4 (Rockies) is just barely below average, and PAD 2 (Midwest) is similar to the U.S. as a whole, below average but rapidly climbing back towards the average range.
In PAD 1, the East, not only are inventories below average but they are actually declining. This looks to me like a management snafu somewhere; hopefully in the next few weeks they can rebalance deliveries to alleviate any possible shortages back east.
And of course we should keep in mind that these alarming looking graphs are not zero scaled! We are zooming in on 10% of the total range.
Of course you might want to look at the inventories in terms of Days of Supply in excess of Minimum Operating Levels.
For the US as a whole, MOL may be as high as 185 mb, which is supported by the spot shortages we saw in the 195 mb range.
Basically, the US has probably operating on a cushion of one to two days of supply in excess of MOL. Currently, we have 1.7 Days of Supply in excess of MOL (assuming 185 mb = MOL nationwide).
In years past, the industry used to carry a much greater margin of Days of Supply in excess of MOL.
Halfin, thanks for the graphic, for a european, it's helpful to be able to visualize the districts.
Re your analasis of the stock levels, here's another slant:
The Gulf and West Coast have seen strong increases over the last 4 weeks, and are now well within the average range.
Stocks in the Rockies (small compared to other districts) have not seen equivalent gains, and remain marginally below te average range (ie lowest stocks in relevant week for 5 years).
In the Midwest, despite strong gains, levels remain well below the average range as we enter a period of expected high demand.
The situation on the East Coast is particually alarming, with levels well below the average range, and no sign of an increase in stocks.
Changes the message a bit hey? ;)
Re zero scaling, I've heard 185M bandied about as the MOL, so I'd say those graphs are pretty well presented - I imagine shortages would be kicking in well before the red line dropped off the first graph!
In some districts the MOL may be substantially higher than current stocks. Once people become aware there is a shortage, they will rush to fill their tanks (including tanks of cars they don't drive much), moving millions of gallons of gasoline out of gas stations, causing gas station tanks to go dry overnight. Imagine the nations's fleet of 200M cars moving from half full to 3/4 full... this would take nearly 1B gallons, which of course we don't have.
Note that both gasoline and crude, as measured in days of consumption, are much lower today than in the late seventies. Today we have more cars, more people, more driving, much lower relative stocks.
We will repeat all that happened in the 70's, and then some.
A billion gallons is just 50 million bbls. We have 200 ish in primary storage (refiners + import tank farms and pipeline terminals IIRC). There's another big chunk in distributors tanks. Then the stations themselves.
You are correct that the urge to hoard exacerbates shortabes but we do have the bbls.
PAD 1 is the main import zone whereas 3 is the main internal surplus area. Colonial had a hiccup shutting down pumping from 3 to 1 for a day or so and have also put ht lines on proration which means there's more production in 3 than can fit up the lines. So makes sense that 3 is fat and 1 is lean at the moment. If demand in 1 gets beyond what imports +Pad 3 imports +local production can meet prices there will have to rise to attract more from Europe/Mid East/other to balance th system.
And you are very correct. The industry goes into a big flap over a 1% change at times when the 4 week average is nominal. I guess speculators have to have something to get the juices flowing.
What I wonder is how long we can continue to import record amounts of gasoline when the IEA keeps stressing that the world overall is undersupplied with crude oil, that global inventories are dropping, and that unless OPEC significantly increases output we will soon get into a serious problem with inadequate supply. I wonder if the drop in gasoline imports this week is reflecting this issue, although this would have to become a much longer pattern before you could make much of it. In addition, we saw gasoline imports starting to fall at this point last year as well.
PE,
Clearly, are still operating under the assumption that a physical world has physical limits.
The "New Math:"
Declining crude oil production + Increasing Consumption in exporting countries = Increasing Oil and Petroleum Product Exports.
Therefore, we can extrapolate the following US import trend "To infinity and beyond:"
http://www.theoildrum.com/uploads/28/Data_4weeks.png
(Khebab's graph)
Reminds me of something Bush said in Germany about climate change...We'll just send the signals that something needs to be invented. That ought to take care of everything.
----From the WP:
Here's Bush's view of how to address climate change, from his joint appearance with British Prime Minister Tony Blair today: "And I told Tony that we're deadly earnest in getting something done; this is serious business. And the fundamental question is how best to send proper signals to create the technologies necessary to deal with this issue."
The technologies necessary to deal with this issue
The Washington DC Metro (not far from GWBs residence) can be thought of as an 85,000 b/day oil saver field (data from a couple of years ago). Probably 90.000 today.
An oil saver field that never depletes and only grows in output over time. And in an emergency, it can "pump" out an extra 40 or 60,000 b/day !
DC Metro wants to expand "production" by going to Tyson's Corner, Dulles airport and a mile+ beyond. An extra 15,000 or so b/day initially with growth after that.
Bill Clinton and GWBs father funded expansions of oil saving like that with 80% Federal Funding. GWB is playing coy with 30% funding.
Build the equivalent of 22 new DC Metros (2,3 or 5 smaller systems = 1 DC Metro unit) and the US can save 2 million barrels/day !
http://www.lightrailnow.org/features/f_lrt_2007-04a.htm
We built new streetcar systems in 500 cities and towns in just 20 years ! (1897-1916 with coal, mules and sweat).
New technology is nice and useful (if it arrives in time) but NEW TECHNOLOGY IS *NOT* REQUIRED !
Best Hopes for Proven Solutions,
Alan
this way of thinking may actually be appropriate.
discount the cost of the service against it's savings and just invert the axis. This way people understand 'production' is going up, and feel good!
Alan: It is very very seldom that you write anything that I disagree with, however when it comes to funding the president only flaps his jaw, the do nothing congress provides the money, or changes the funding ratio. So it could be reversed.
Also a century ago most all communities were more homogeneous. Zero safety concerns in construction, no environmental impact statement. No alternative local transport means other than a team of horses, a riding horse, or a good pair of walking shoes, also a much less complicated infrastructure.
Please tell me where these thoughts are in error.
The President cannot spend (unless rules are bent) money that Congress has not appropriated. OTOH, the President can refuse to spend monies that Congress has appropriated.
The "Small Starts" program was appropriated $300 million for streetcar projects of $75 million or less (from memory#) in Bush's second year (with 80/20 matching). Not one grant awarded to date. The FTA is twisting it to fund bus projects now.
The law still says 80/20 matching for other rail projects. FTA cuts this down to about 1/3rd by funding a small section of the project, with the rest being 100% local funding.
Worst Hopes for GWB policies,
Alan
On your second point, the French can build new tram lines in 3 to 4 years from financial decision and a vague route plan to ribbon cutting. They have done this two+ dozen times !
The US has created a (IMO with evidence) deliberate methodology to "go slow" as a means of reducing spending (although costs per mile climb, the annual budget is smaller).
I guess French bureaucrats are just twice or three times as efficient as American bureaucrats ! (When an issue of vital national importance is involved, the French CAN move quickly ! See nuclear power, the building of the TGV and trams in almost every town of 100,000 or more.
# I tried to confirm, but FTA website is down from last Wednesday till this Sunday for scheduled ...
Just add technology. No other annoying changes required.
Technology is the answer, of course, because it is unthinkable that any changes be made to the American life style, the cars we drive, how far we drive, where we live, how we live, how big our houses are, how much insulation we have, how much solar thermal we have, how much solar PV we have, how much wind power we have, on and on and on. None of these changes, of course, would require any new technology.
It helps, when attempting to solve a problem, not to be completely ignorant, stubborn, selfish, and uncaring about the future of the planet.
Will we spend another decade trying to answer what Bush calls the "fundamental question"?
Bush is deadly earnest in wanting to study and discuss the problem until he leaves D.C. for Crawford, Texas.
Yes, of course. Conservation is a private virtue.
His Crawford Winter White House has 25,000 gallons of rainwater storage, gray water collection from sinks and showers for irrigation, passive solar, geothermal heating and cooling. “By marketplace standards, the house is startlingly small,” says David Heymann, the architect of the 4,000-square-foot home. “Clients of similar ilk are building 16-to-20,000-square-foot houses.” Furthermore for thermal mass the walls are clad in "discards of a local stone called Leuders limestone, which is quarried in the area. The 12-to-18-inch-thick stone has a mix of colors on the top and bottom, with a cream- colored center that most people want. “They cut the top and bottom of it off because nobody really wants it,” Heymann says. “So we bought all this throwaway stone. It’s fabulous. It’s got great color and it is relatively inexpensive.
I think Crawford has solar PV as well now.
Best Wishes for Al Gore hiring the same architect,
Alan
The technologies necessary to deal with this issue
The Washington DC Metro (not far from GWBs residence) can be thought of as an 85,000 b/day oil saver field (data from a couple of years ago). Probably 90.000 today.
An oil saver field that never depletes and only grows in output over time. And in an emergency, it can "pump" out an extra 40 or 60,000 b/day !
DC Metro wants to expand "production" by going to Tyson's Corner, Dulles airport and a mile+ beyond. An extra 15,000 or so b/day initially with growth after that.
Bill Clinton and GWBs father funded expansions of oil saving like that with 80% Federal Funding. GWB is playing coy with 30% funding.
Build the equivalent of 22 new DC Metros (2,3 or 5 smaller systems = 1 DC Metro unit) and the US can save 2 million barrels/day !
http://www.lightrailnow.org/features/f_lrt_2007-04a.htm
We built new streetcar systems in 500 cities and towns in just 20 years ! (1897-1916 with coal, mules and sweat).
New technology is nice and useful (if it arrives in time) but NEW TECHNOLOGY IS *NOT* REQUIRED !
Best Hopes for Proven Solutions,
Alan
Anyone care to take a stab at the "MOL" for crude oil in the US and/or the rest of the world (country by country)?
How about "MOL" for gasoline and diesel in other countries?
I think those numbers would be very interesting!
DD
Notionally, 270mb for crude and 185mb for gas (according to the IEA, p.35).
However, it's worth noting that those levels appear to be too high, given that US crude stocks fell below that "minimum" in Dec 2003.
That's not entirely surprising, since the US's minimum operating requirement fell 10% between 1988 and 1998, despite higher demand. If that trend continued, MOR would currently be about 250mb for crude and 172mb for gas.
Given those minimum levels, the EIA puts the US's discretionary petroleum (total-minimum) at about 90mb for crude and 30mb for gas, as compared to 90mb and 42mb this time last year. i.e., crude is the same, but gas is about 30% lower.
A problem? p.29 of the latest IEA OMR tells us that the OECD as a whole as of March was well-supplied with both crude and products, with more days of forward cover in stocks than 2006, 2005, or (especially) 2004.
So it looks like there should not be a problem, assuming refining and transportation of petroleum products follows its normal pattern within the OECD. An early hurricane hit to major US refining or import areas could cause difficulty, though.
Nice assessment.
I would note from your latest IEA report, however, that the concern is not current inventory but current supply. Even apart from any hurricane or other disaster, IEA is stating that unless OPEC substantially increases output, we will get into a very tight situation later this year. Supply doesn't equal demand right now. Whether OPEC can or will increase production is the big question, and even IEA is expressing concern that OPEC will be unable to meet the call on their oil.
From the report:
• Preliminary OECD stock data continue to point to a 930 kb/d draw in
first-quarter total oil stocks, following on from a draw of similar
magnitude in the previous quarter. Forward demand cover provided
by total oil inventories remains around the five-year average, but
gasoline stocks are low in all regions.
• April world oil output rose by 55 kb/d to 85.5 mb/d, with OPEC
supply levelling off near 30.3 mb/d. Non-OPEC growth in 2007 is
trimmed to 1.0 mb/d, plus 0.2 mb/d of OPEC NGLs, which leaves the
2.3 mb/d rise in the ‘call on OPEC’ by 4Q running well ahead of
expected OPEC capacity additions. This implies lower spare capacity
later in the year.
i.e., accusations that KSA is lying about having 2+mb/d of spare capacity look like they'll be put to the test later this year. Should be interesting.
If the spare capacity isn't there, it could be rough for some poorer countries. If the US's price elasticity of 0.05 holds for most of the world, it'd take about a 50% increase in price to produce the 2.5% drop in demand needed, or prices of about $95/bbl. There's plenty of money in the West to absorb that - it's only about a 15% increase in petrol prices for Europeans - but poor countries would have more trouble.
We might finally see some US action on fuel efficiency legislation, though.
I suspect that the EIA and the IEA may be counting gasoline stocks different ways, but in any case, the EIA puts US total gasoline inventories at 204 mb at the end of 2003: http://tonto.eia.doe.gov/dnav/pet/pet_sum_sndw_dcus_nus_w.htm
Note that on a Days of Supply basis, in early June, 1991, the US had 30 Days of Gasoline Supply on hand, versus 21 Days of Supply in early June, 2007.
As I noted above, since we saw spot shortages (I witnessed them) at 195 mb in the US, 185mb seems like a reasonable estimate for MOL. So, using 185, nationwide we have about 1.7 Days of Supply on hand, in excess of MOL.
Map of OECD countries: http://en.wikipedia.org/wiki/Image:OECD-memberstates.png
I wonder what's going on in the rest of the world?
http://www.energybulletin.net/22775.html
Published on 18 Nov 2006 by Wall St Journal. Archived on 23 Nov 2006.
As Fuel Prices Soar, A Country Unravels
by Chip Cummins
Conakry, Guinea
Hmm, you're right - the only 185mb I see in that table is the end of August 1997. Not sure what that means for the IEA's noting that 185mb is a soft limit.
If we take 185mb, the US is at 16mb vs. 25mb discretionary last year (201.5 vs. 210.3, from the table), meaning the US is down about 35% from last year, or about 40% from the 5-year average.
There are lots of possible reasons for spot shortages, though, and not all of them represent wider problems in the system. The US has been at or below 195mb many times in the last 10 years - two months in 1997, late in 1999, below 190 for a month in 2000, two periods in 2001, and so on - so it's not at all clear that your observation is indicative of any kind of general trend.
Spot shortages were widely reported in many areas at the recent 195 mb level, such as Iowa and Colorado:
http://www.gazette.com/articles/gasoline_23297___article.html/colorado_l...
Oil firm: Gasoline shortages may stick around
By DEBBIE KELLEY
THE GAZETTE
June 6, 2007 - 12:21AM
I think we are ok, for the moment. The problem is not where we are so much as where we might end up if even a single serious event occurs, such as a large coastal evacuation, particularly along the east coast (where the PADD is in the worst shape).
About the last thing the oil companies need right now is televised images of consumers stranded on highways, out of fuel, as a Cat-4 or Cat-5 comes barreling down at them. The political fallout from that could be massive.
Ghawar Is Dying
The greatest shortcoming of the human race is our inability to understand the exponential function. - Dr. Albert Bartlett
the thing that constantly surprises me is the trade offs tht are occuring between demand elasticity, demand destruction, product substitutions.
We see price go up, and we see supply decline, and yet the world keeps on turning. in Europe and North America, nothing much has changed. its business as usual
China is booming as usual, and consuming much more oil, despite their lower incomes (car purchases up 23% in May in china. Its mind boggling)
Japan, as we know, produces almost 3X in GDP what the US does per barrel of oil
I now think the oil market is so big, and so ingrained in the world economy, that there is still a LOT of room for innovation and adjustment and improvement in efficiencies. If the price stays in the 60s for the next three years, say, we may be OK: Good old Yankee ingenuity and the profit motive will push us in the right direction.
a gradual increase of 10% a year may be OK - just guessing - and we could end up with $150 oil in 2015 and still be moving along
The thing that will kill us is sudden spikes in price
Right, right, right. Conservation and substitution will get us to a more prosperous and cleaner world. We can consume radically lower amount of fossil crude – indeed, the US consumed less crude in 2006 than 2005. Mr. Price Mechanism is already stepping up the the plate. At more than $60, he is working on his power swing. Look for some home runs in years ahead, then grand slams.
Baseball is great for analogies.
The low build in crude was not a red flag as crude inventories are above the upper end of the average levels. $3.00 gas might cause less conservation in the US than in Romania.
The builds of gasoline indicate that gasoline is availble in increasing amounts. Oil dropped 2 dollars today. LNG will not build enough natural gas for worlwide substitution of natural gas for gasoline in the near term. Tar sands development might peak in more than 20 years. There are 3 trillion barrels of heavy oil/tar in place with technology improving in each decade.
Properties near public transportation stops was generally of greater value than more isolated properties. 100 people jammed into a subway car is better for the GDP and corporate profits than touring the US in a Winnebago.
Every month this year has been a "swing and a miss" for Mr. Price Mechanism ! Not even a foul tip !
Maybe he will do better at $135/barrel.
Best Hopes for the Nonexistent US Price Elasticity of Demand for Gasoline,
ALan
Alan-
Well, the US consumed less fossil crude in 2006 than 2005, despite a growing economy. So did OECD nations. EIA stats.
World demand was up 3.1 percent in 2004, then only 1.8 percent in 2005, and then only 0.9 percent in 2006. These are EIA stats, not mine.
The bad news: EIA predicts a 1.4 percent increase in 2007. I wonder, and I hope for a flatline in 2007. Fossil Flatheads believe that is where we are headed. A flatline, or plateau. I am hopeful that at $60 a barrel and above, we have seen Peak Demand for fossil crude. Now. And forever, as long as oil stay above $60. We are right on the cusp.
I confess, Mr. Price Mechanism better work on hitting a curveball when it comes to US gasoline consumption. But, gas is cheaper now than 27 years ago. Nothing yet really over the plate.
My anecdotal surveys of anybody I talk to suggest that at $4 a gallon, we might see some changes. Also, a lot of people I talk to say that at current prices, the next time they buy a car, mpg's will talk big. I am hopeful we see a flatline soon.
The real hope is PHEVs. Then we will see radical reductions in demand.
A far out prediction: Urban cores, all around the world, will start banning internal combustion cars in 10 to 30 years (or tax heavily). You will not have the right to pollute the air where people live, play and work in large concentrations.
Far out? Maybe. What if 30 years ago I sidled up to you in a Milwaukee bar, and lit up a cig, and said to you, "You know what? In this very bar, we will not be allowed to smoke, when our kids our grown." You would have had me thrown out.
And yet, and yet.
Demand cannot exceed supply.
Point #1: The drop in consumption was not large between 2005 and 2006. In 2005 the US consumed 7,592,789 barrels of crude. In 2006, the US consumed 7,514,459 barrels of crude - a drop of less than 1.04%.
Further, consider this table:
Depending on events, 2007 could see consumption return to 2005 levels.
Point #2: Gas recently passed the previous high, adjusted for inflation. Saying that it is cheaper than 27 years ago is disingenuous at the very least and outright propaganda at the most. Of course, coming from you, this is to be expected.
Point #3: You are apparently are incapable of realizing that a peak in supply would look exactly like a peak in demand so you keep asserting we have hit peak demand, with no facts to support you other than the flat supply structure. Meanwhile, abundant data is growing that demonstrates that it is supply that appear to have peaked. Given the abundance of data that supply has peaked or is very near peaking, versus your statement that it is only demand that has peaked, it becomes incumbent upon you to prove your point - NOT to simply reiterate it over and over.
Proof, please?
Reference: http://tonto.eia.doe.gov/dnav/pet/xls/PET_CONS_PSUP_DC_NUS_MBBL_M.xls
Ghawar Is Dying
The greatest shortcoming of the human race is our inability to understand the exponential function. - Dr. Albert Bartlett
When did he claim it was?
All he said was there was a drop, despite robust growth in the economy, demonstrating that such a thing is indeed possible.
You're claiming that since gas was more expensive a few weeks ago than 27 years ago, it's disingenuous to point out that gas is now cheaper than it was 27 years ago.
For someone complaining about "disingenuous" and "propaganda", that's rather hypocritical. Gas prices in the US are cheaper than they were in the early 1980s (March 1981 was $3.15, adjusted for inflation).
If you wanted to point out that they were more expensive a few weeks ago, that would have been a good point. So why didn't you just do that, instead of being needlessly insulting, inflammatory, and incorrect?
1) You may not realize that two people can disagree without one of them being "incapable of realizing". Or that that person may be you.
2) There's no reason at all to believe a peak in demand would look the same as a peak in supply. If demand is constrained by supply, we'd expect to see rising prices. If demand had stopped increasing and supply continued to rise, we'd expect to see falling prices...unless supply growth was prevented by artificial reductions in supply by a cartel or similar entity, which might be done to maintain prices.
i.e., exactly what OPEC claims it has done.
3) Your own link shows that the average level of petroleum product supplied to the US over the last 3 full years has been 100.0% of the March 2007 level. i.e., US demand has been flat for three years, despite solid economic and population growth, which might reasonably be taken by some to suggest that US demand has peaked.
(That being said, I don't think that either US or world demand have truly peaked.)
Then why don't you link some instead of just claiming they exist?
Here, I'll start.
Oh, wait, my mistake - the IEA tells us that oil supply grew from 2004 to 2005, and grew from 2005 to 2006, and grew from 2006 to early 2007, which is where we are now, and is forecast to grow into 2008.
So maybe you'd better do this - it looks like you have to pick the information pretty carefully to have it tell you supply has peaked.
But, no, SS's (excellent) analysis of North Ghawar doesn't count - he's shown us that that region is nearly tapped out, not that KSA is.
And, no, WT's HL of Russia doesn't count - he's been telling us it's "on the verge" of collapse for over 18 months now, and production would have to enter a permanent 30% decline - unprecedented for a such a massive region - today to fit his plot. In fact, HL doesn't count at all - it has too many false alarms and is too unreliable to convince someone who's not already predisposed to agree with you.
You could try EIA - their supply numbers show little or no increase in the last few years - but their numbers also beg the question of why their figures on OPEC NGL are 2/3 IEA's numbers. (Perhaps they're adjusting for energy content? That would be nice.)
Given that the vast majority of the world - including most of the oil&gas world - appears to disagree with you, I'm afraid the onus is still squarely on you to justify your belief that oil supply has peaked.
Might not be fair, but that's the way it is.
Texas and US Lower 48 oil production as a model for Saudi Arabia and the world
Jeffrey J. Brown & "Khebab", GraphOilogy
first published May 25, 2006.
Key Graph: http://static.flickr.com/55/145186318_27a012448e_o.png
Based on EIA data, world crude oil production is down by about 1% from May, 2005, and Saudi crude oil production is down by 11%.
In the comment thread to the Net Oil Export post in January, 2006, I commented on the HL model that Khebab did, at my request. The results are summarized in the following post from today's Russian thread. Note that Russian crude oil production has basically been flat since October, 2006.
From the "Russian Car Sales" Thread:
We don't stop finding new fields when a region peaks. However, what we can't do is to offset the declines from the older larger fields, and the Russians themselves have started making public statements to the effect that Eastern Siberian reserves may not come on line fast enough to offset the declines from older fields.
Russia's absolute peak was in the 1980's on a broad plateau centered on 1984. They produced from just below 11 mbpd to just above 11 mbpd for five years on both sides of 1984 (1979-1983 and 1985-1989, all inclusive).
Russia's post-1984 cumulative oil production, through 2004, was 95% of what the HL model predicted it would be, using only production data through 1984 to generate the model. (Post-1970 cumulative Lower 48 production was 99% of what the HL model predicted, using only data through 1970 to generate the model.)
The recent rebound in Russian production was largely just making up for what was not produced after collapse of the Soviet Union. Russia has now "caught up" to where they should be, based on the HL model, and Russian production has basically been on a plateau since October 2006.
Since the Russians showed lower exports, year over year from 2005 to 2006, with rising production, I would expect that flat production equals an even sharper drop in exports--thus my question about the shutdown of the pipeline that I referenced above.
The bottom line, as I outlined above, is that IMO we will see a catastrophic decline in Russian oil exports, probably starting this year, no later than next year.
Those same people said that they would change at $3/gallon gasoline. and they will say the same thing about $5 gasoline.
Perhaps at $6 gasoline, Mr. Demand Destruction will get a bunt.
In the batting line-up. Mr. Warm Winter batted first and hit a standing double off the first pitch.
Alan
How many manufacturing jobs did we send to China to get that dip in consumption? How long can we keep transferring consumption to China?
And most importantly, how long will it take all of us to see the connection between demand destruction in the rest of the 3rd World and growing political chaos? They're protesting in Pakistan against both blackouts and Musharraf. The Ukraine, Pakistan, Argentina, Mexico, these are important countries, and their political alignments collectively matter. They're all at risk politically because of energy issues. Yet it's never described that way in the media, because that would mean a "global energy crisis", and then, God forbid, the rest of the globe might start criticizing how the corporations set up America and China with infinite trade and credit to engage in infinite consumption.
Just like it won't be our fault if the Iraqi government we created orders the Iraqi army we paid to slaughter the Iraqi oil workers.
if you sidled up to me in a milwaukee bar ....... i would have said get the fuck away from me faggot.
No, the thing that will kill us in lack of oil.
Price is not a very good measurement because it assumes that more will eventually be available and the price will come down. Price does not reflect the fact that oil is running out. Eventually Gov. will have to get involved to allocate a scarce resource according to the common good. Otherwise only the very rich will get oil and that is a recipe for social revolution.
We will be at 55MMBD in 13 yrs. Do you really think we can conserve 31 MMBD by then? And have a peaceful world?
allocate a scarce resource, ah ha finally a nice diplomatic way of bringing up the R word. Good work.
There are things about this belief that worry me.
The poorer third world countries are our "canaries" so to speak. And what it looks like is happening is that they use fossil fuels right up to the point they cannot afford them, and then the lights go out (rolling blackouts, shortages, etc). No biofuel industry. No PV systems. No Wind. Why? Why, if price will save us, has price not saved them? Why is their standard of living going down and not transitioning to a bright green future?
I think we need to answer a few questions to know if the problem will solve itself based on ingenuity and profit motive.
1. If the Profit Motive is active, then why has gasoline demand risen as prices have increased 50%? (Where are the new technologies? Why are the US automakers fighting legislation to become more efficient, if they are heading that way because of the market?)
Guessing the answer is "It takes time for innovation and efficiency". Ok, fine, then:
2. What are some plausible techniques for reducing consumption? (Try a parato chart of consumption)
3. How *fast* can those technologies be put into place? (preferably based on studies of prior circumstance and not just optimistic "best case" reasoning like everyone buys the most efficient vehicle money can buy).
Stuart made some efforts this direction early on (his posts can be found by following his name link on the right)
They are kind of scary. He looked at building rates, and they seem too low to rebuild our existing housing to be more Japan like in a reasonable time frame.
His analysis of vehicle efficiency was interesting, but I think it was optimistic on how fast the fleet will improve in mileage (The Hirsch Report had a more conservative set of values).
It would be really useful if someone could find data on how the US fleet MPG shifted from 2004 to 2005 and from 2005 to 2006.
Jon Freise
Analyze Not Fantasize -D. Meadows
I was wondering about Senegal. Most of their electricity generation comes from diesel generators and as of May 17 they had enough diesel for only 8 days. So they probably ran out around May 25.
Does anyone know what is going on in Senegal? There is no recent news.
"Ask not for whom forced energy conservation comes, it comes for thee."
New Scientist 09/June/2007
US loath to give up gas guzzlers
It is no secret that American drivers
are fond of their gas guzzlers. But it may prove tougher than anyone thought to persuade them to switch to greener vehicles.
Jeroen Struben and John Sterman of MIT developed a computer model to study the impact of government policy, economics and consumer behaviour on the adoption of hydrogen-powered and hybrid cars in the US. They found that even with new laws and funding to help educate the public on the merits of alternative fuels and build fuel cells stations it could still take 20 years before half of the US fleet is vcnvereted
"Even the current hybrid cars will take a while, maybe 15 to 20 years before they make any significant impact on fuel consumption", says Struben.
Incidentally was the headline article on the worlds rare metal depletion in the New Scientist from a few weeks back authored by 'our' very own Dave Cohen?
Records
Hello R-squared,
Thxs for this keypost and to the other TODers for comments. If you meet with the API again: can you suggest my Hell's Angels' gas-station idea?
I think a lot of people would be interested in personally storing gasoline safely at a nearby neighborhod station by prepayment, as opposed to dangerous home storage, and it will also allow personal arbitrage of gas prices. My previous posting on this topic outlined how it could help speed hurricane evacuation and subsequent recovery if carefully designed and implemented.
The FF infrastructure, due to inherent competitiveness, will obviously seek to minimize JIT inventories. Retail gas-stations are getting squeezed: there are now four fewer retail outlets closed within a mile of my house, and no new stations have been built. What this ominous trend means is that increasingly drivers will have to go ever further to refill as more and more gas-stations close.
I have no idea how this will work out in the marketplace, but I can do Wild & Crazy speculation. =D
Let's say at $3/gal, my avg. Asphalt Wonderland motorist has to drive 1 mile for a refill. Hypothetically:
$4/gal: 2 miles
$5/gal: 4 miles
$6/gal: 6 miles
$7/gal: 10 miles
$10/gal: 20 miles...and so on exponentially. I would imagine this trend might be even worse in rural areas.
So, as in my last example: the Phx Area might only have 10 gas-stations for the whole metro area instead of the current plentiful number. Legislation allowing personal storage and price arbitrage might slow the rate of gas-station closures, and reduce the risk of home fires and home invasions to steal gasoline. My feeble two cents.
Maybe Khebab, or some other TOD statistician, can really put some meat on these bones to paint a more likely declination rate on gas-station closures.
An early pre-car historical example was horse stables/tack shops in urban areas. They are non-existent now.
Bob Shaw in Phx,Az Are Humans Smarter than Yeast?
horse stables/tack shops in urban areas. They are non-existent now
There at least 4 that I am aware of in New Orleans. Three servicing mules for the tourist buggy trade and one for City Park pleasure riders.
Best Hopes for Being Prepared for Post-Peak Oil,
Alan
This is a great topic. I'm glad there is so much information about the oil market. I recently found an article that really opened my eyes to the so-called "diminishing" oil reserves.
"How to Profit With the Oil Service Trifecta"
Take a look if you want some insight on the actaully GROWING market opportunity...enjoy!
...Cheers...
dan cap
I'd sure be careful of that Haliburton recomendation, although Schlumberger and Baker Hughes are great companies, Haliburton is thoroughly tarnished itself. Their latest plan is to move the company headquarters to Dubai.
Why? Their official reason is to be closer to their customers, but I think its because they, like Michael Jackson, have figured out that they can't be extredited for their crimes. They've been implicated in billions of overcharges to the US Government, and ask old Brown And Root retirees what's happened to their stock and pensions.
So My question is: If they'll screw their employees and customers, what makes you think the investors are exempt?
There are plenty of great oil service companies out there-Corelabs, BJ Hughes, Cooper-Cameron-that haven't a hint of wrongdoing attached to their name. Look seriously at Keystone Valves, or Patterson UDI, Transocean, Rowan-but mark my words well, Halliburton is bad news.
the end is near
there is a strong "doomer" trend on TOD - I guess its natural when you looks at the stats on the average contributor.... 40 year old male, high level of formal education, sitting at home, inclined to analysis rather than social interaction, time on his hands, in a job that does not stress his intellect, or reward his intellect...
so you have to balance against that trend, when you read the posts (including this one! - OK 50 is the new 40)
anyway, I think the evolution of the oil shortage and impacts on society will be a fruitful field for books, theses and grad papers during the next Renaissance
many are calling for the decline of the US based on the decline of oil. could be.
I think there will be a 'shock to the system' in 2008 and a twenty year, grinding, inflationary depression.
the upside is that North America (US, and Canada its younger brother) are posed to rebound (who knows - i wont be here)
we have the infrastructure and the culture of innovation
we were born in change
the reason is language and culture homogeneity (sp)
north america is basically an island - just as england and australia - no external threats, same language, same culture, - and no other geography of that size and that population can claim that 'sameness' China is homogenous but is surrounded
Hello Polytropos,
I respectfully disagree. I think you are overlooking the thousands of TODer conservation and mitigation suggestions. Most posted by what I assume you would call Doomers. The trick is successfully getting this Peakoil Outreach message out to the everyday public and key leaders.
I hope you are not being a Doomer by not emailing everyone who needs to hear this message. For example: have you yet written the PGA, Tiger Woods, and Phil Mickelsen as I have done asking them to start plowing up golf courses?
Have you asked GOOGLE to feature an unlucky button as I have asked them to do?
Have you emailed various foreign embassies to warn them about Peakoil and the need for mitigative change? I have.
Have you written your govt officials asking them to go to full-on Peakoil Outreach? How often do you hit Reddit or Digg?
Have you emailed the G8 Conference asking for discussion of the ASPO Energy Depletion Protocols? I did.
Do you hand out cards, as I do, with your favorite Peakoil websites to strangers in public places? and so on.......
Bob Shaw in Phx,Az Are Humans Smarter than Yeast?
Hello TODers,
I have posted much on this before, but it is worth repeating: rising prices does cause demand destruction, but it also shrinks the FF-spiderwebs as blowback forces become ever stronger. Which only adds further to the cycle of demand destruction and more blowback.
For example: take the upthread African posts of WT and others. I have no idea what the actual numbers are for Senegal, but assume at the Peak Wealth point of their society that they had five hundred gas-stations scattered about the contry. They might be at less than 50 stations now with very intermittent resupply or worse. Maybe only the military and top Govt. officials have access to fuel now.
Some of these poor people are now looking at very long walks to even buy a gallon of cooking kerosene. I think the same will happen here in America as the gas-stations start to close more frequently and those cities at the far-flung spiderweb ends of the FF-pipelines get cutoff from resupply.
Bob Shaw in Phx,Az Are Humans Smarter than Yeast?
I have several questions for the TODers here who have more knowledge and insight into the oil markets:
Can you explain the reason for the Brent premium of approx. $4-5 that has been occurring recently? In the face of this, does it not make sense that W. Hemisphere exporters (ie Venezuela would divert exports to other markets besides the US), thus reducing US imports until the price of WTI equalizes?
I mean right now even the OPEC basket price is on par with WTI crude, which doesn't make much sense to me. I don't really understand the pricing mechanisms of the various blends (besides the obvious of lights being pricier than sour), and how it relates to international markets, import/export flows, etc. Also, how much does the weak dollar play a role?
I'm really confused...
WTI is low because of logistical bottlenecks in landlocked Cushing, OK.
Brent is probably the best indication of world prices.
Ditto, or Tapis or Saudi Light. US Refineries are still not refining at top capacity, and Cushing, Oklahoma is a long way from a port.
Just got back from reading what Joe Everyman thinks of peak oil over here (the comments, not the article):
http://digg.com/environment/Everything_You_Wanted_to_Know_About_Peak_Oil...
It seems Joe Everyman has gone from Denial to Anger....
A few choice quotes:
Even the most informed think the only problem is money. The idea of EROEI will never really penetrate the mainstream. After all, to Joe Everyman, money creates energy (which is actually somewhat true if you burn dollar bills in a fire for heat!).
Which is why when gas is unavailable or upwards of $10/gal society will start to unravel. And this totoniela guy is worried about how many gas stations there will be. Who the F cares??? When people can't afford to drive to do basic things like drive to work and the store watch out!! They will blame the Oil CO's, Govt, Arabs, and whoever else is at hand. The vast majority of the public have no clue about PO or ANYTHING about oil. They just know that Arabs and the Oil Co's are greedy evil bastards. True? No. But that will not make a difference. They will go down with their preconcieved notions of how the world works.
The only people that have a chance of surviving are the people that realize that PO is real, and are ready to act on it when the time comes...
Korg,
Acting on PO when it becomes obvious will put you, or anyone else, behind the curve.
Its possible to prepare now, just in case, without really impacting your life.
...then they'll find other ways to deal with the necessities of life.
Can't afford to drive to the supermarket? Have one guy with a van or pickup truck do a single trip for 10 families in the neighbourhood.
Can't afford to drive to work? Carpool. Or sleep in your car. Plenty of people in poorer countries do it.
This is why the peak oil community is dismissed as a bunch of paranoid crackpots - "...and then society crumbles!" seems to be some people's answer to everything, even when there are very simple solutions that many people in other countries are already using.
This blind faith that people would rather tear apart society and die screaming than carpool is utterly absurd, not to mention remarkably counter-productive. While only a minority may hold these types of apocalyptic beliefs, the fact that they constantly go unchallenged makes it looks as if the entire community gives them their tacit approval. And hence the entire community gets tarred with the same "paranoid end-of-the-worlders" brush and ignored.
Throwing off that stereotype will require challenging those kinds of beliefs when they come up. You're judged by the company you keep.
When people can't afford to drive to do basic things like drive to work and the store...
Really, and your evidence for this turn around in the American way of life is based on what evidence. Blanket statement with no basis or backed up by not a single shred of data. Why, I assume because there is not any.
And who organizes this, what if you can't pay. Is this a free service or will someone expect reimbursement for doing the driving, gas, wear and tear. Why do you assume all people have friendly neighbors in this country. From what I see most stay in their houses and don't know the person a few doors down at all. Are you watching to many re-runs of Leave it to Beaver. Are you married to June Cleaver, where do get off making such a statement. You also overlook that many people don't live close together, but are in the country or other.
You are assuming that you have work, and that there will be room for everyone and it all works out. HAVE YOU EVER CAR POOLED, I doubt it. Its a friggin hassle with todays spread out society. Who gets picked up first and gets one hours less sleep a night than the last person, how do you divide up the cost. Sleep in your car. Now there's a real stupid idea. Its not hard at all to break into autos', and you tell people in a situation where things are really really tough to just sleep in their car. You go sleep in your car for a few nights and let me know how it goes, then do the same in a major city. Got money to pay for a meter or parking space. Think you can just park anywhere and the police (if they are around will not hassle you). I doubt you have done any of the things you suggest.
And who dismisses it, care to name them and what their agenda is. What is your agenda Pitt, you have one, and its not constructive either. All you do is make insinuations and judgments based on your baseless opinion, with no data again. Who, who who, are you referring to. No one except unnamed sources with unnamed opinions. Your agenda is to disrupt, and mitigate a message you don't approve of at any cost. That the statement of malcomX isn't it. At any cost.
This statement is so low on the intellectual scale and based on such faulty logic, I don't think anyone with a real brain needs to even read a comment on how stupid and illogical it really is, and full of attempts to influence opinion based on no facts, but attempting to only attack, sign of a person without the ability to make a logical statement or agrument because they have no facts.
and you're judged by the arguments and the logic you use, so what do you think people think about your statements Pitt. Based on your lack of ability to state a case on facts, or logic, you use propaganda, misdirection, pleading, and much more.
But that will not stop you from making such statements in the future to try and influence by opinion or baseless claims. Your ilk never learn.
Quid Clarius Astris
Ubi Bene ibi patria