Does the latest IEA number matter?
Posted by Stuart Staniford on December 3, 2007 - 11:00am
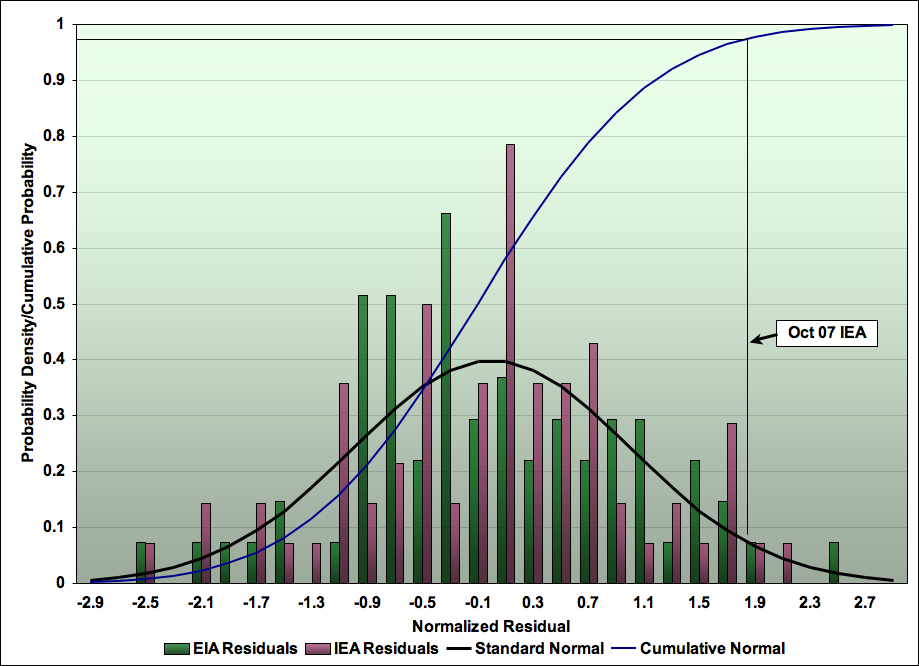
Normalized histogram of residuals from moving average for EIA and IEA total liquids production, Jan 2002-Oct 2007, together with standard normal distribution, and cumulative probability function for normal. October IEA residual value is emphasized with construction lines and label.
Here's what the data point looks like in the context of the rise and then plateau of the last five years:

Average daily total liquid production, by month, from EIA (green) and IEA (plum), together with 13 month centered moving averages of each line, recursed once (LHS). WTI spot price (blue - RHS). Click to enlarge. Graphs are not zero-scaled. Source: IEA Oil Market Reports, and EIA International Petroleum Monthly Table 1.4. The IEA line is taken from Table 3 of the tables section at the back of the OMR in the last issue for which the number for that month is given. WTI spot price is from the EIA with November estimated from average of daily figures available through the 27th of the month.
I would argue that, just as it's premature to declare that oil is already in overall (ie net) decline, so it's also premature to declare that this month's data proves oil supply is growing again. As the graph above should make clear, in addition to the overarching trend of flattening supply, oil production experiences substantial month-to-month fluctuations (aka noise).
Stuff happens. One month a big new project ramps up, another month there's a fire or a storm or a hijacking. Every month there are outages for maintenance and accidents. All this causes production to be more or less each month - some months everything comes together and there is more oil than the average trend would predict. Other months everything falls apart, and there is less. So the question about this most recent month should be whether or not it is a large enough increase to stand out from the background fluctuations that are normal for the globe's oil operations?
And the answer to that appears to be no.
A quick, slightly rough, but I think adequate, way to get at this question is to look at how the monthly production data in the plateau graph above fluctuate around their average trend. If we subtract the moving average of each series from the data, we get what is called the residuals:
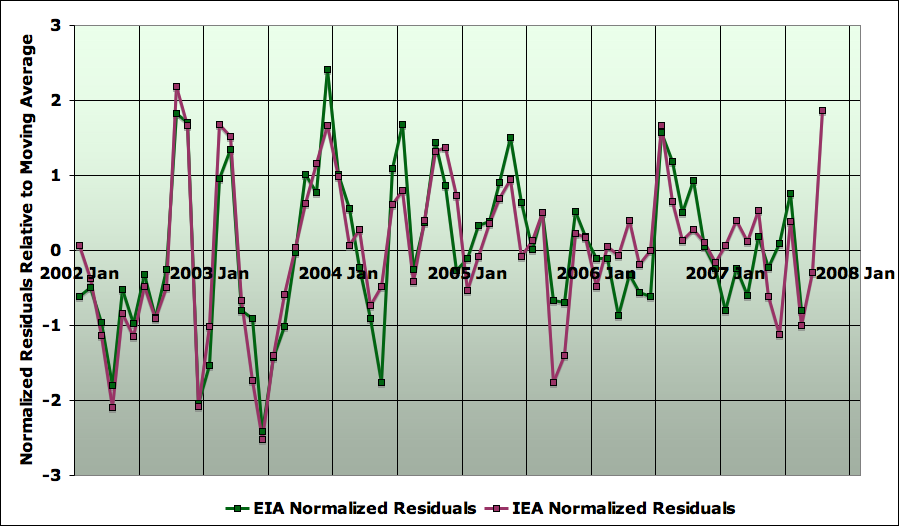
Residuals from moving average (13 month centered moving averages of each line, recursed once) from EIA (green) and IEA (plum), normalized to have a standard deviation of one. Each series is residual to its own moving average. Click to enlarge. Graphs are not zero-scaled. Source: see previous graph.
There's also a modest level of auto-correlation in the series - each point is somewhat biassed to be near the previous month's observation, rather than fully independent of it. More on that later.
Another thing to note is that, looked at this way, the IEA's most recent point looks high, but not unprecedentedly so. We can formalize this. Since the noise in global oil production is the sum of many different things all over the world which can cause oil production to be somewhat more or somewhat less, the Central Limit Theorem suggests that the noise will roughly follow the normal distribution. If we make a histogram of both sets of residuals, we can see:
Normalized histogram of residuals from moving average for EIA and IEA total liquids production, together with standard normal distribution, and cumulative probability function for normal. October IEA residual value is emphasized with construction lines and label.
So, you might look at this graph and notice that the October 2007 point is at the 97th percentile which is more than the 95th percentile; isn't this data point a statistically significant departure from trend? (At least if you were convinced oil production had to rise, so you were willing to declare significance on a one-tailed test, and were willing to ignore the slight indication that the tails might be a bit fat for a normal distribution).
I don't think that's the right way of looking at this observation. If we had not had any data till now, and had just obtained this data to do a particular experiment, that would be a valid analysis. However, that's not what's been going on here. At least here at TOD, we've been staring at this monthly data regularly for two years, and debating the meaning of the plateau (and I think the peakoil.com community may even have a few more months of consideration behind it). At any time during that period a rise like this would have seemed significant to some people and led to cries of "the plateau is over!".
So we have to be careful here to take account of what is called data mining bias. This is the general problem that if you look at a dataset long enough, in enough different ways, you can find statistically significant observations just by chance. In our case, if we watched the monthly data for a thousand months, even if it was perfectly flat in trend, we would likely see a 1 in a 1000 jump up in the data at some point just because eventually unlikely things happen if you look long enough.
So, in this case, if we've been looking at the data for 24 months, perhaps the right question is "What is the odds of seeing an observation in the 97th percentile of a standard normal distribution if we try 24 times?" If that number was less than 5%, perhaps that is the criteria for this observation to be significant? Clearly, the odds of hitting the 97th percentile are a lot better with 24 tries than with 1, so this suggests the observation is less significant.
Well, I don't think this is quite right either. The reason is the auto-correlation in the series. The effect of this is to make it as though we have less truly independent data than the number of points in the series. This next graph shows the auto-correlation at lags of 1, 2, and 3 months for both IEA and EIA total liquids residuals.

Auto-correlation for residuals from moving average for EIA and IEA total liquids production, at lags up to 3 months.
So roughly speaking, only 60% of the variance in each data point in the residual series is really "new" noise, while 40% is "old" noise left over from the last point. Ditto for the next point, and so on. Thus it's as though we have 0.6*24 ~ 15 independent data points. So, with 15 data points, what is the odds of one of them hitting the 97th percentile? Well, the distribution that tells us the odds of hitting a certain number of things out a lot of independent tries is the binomial distribution. We'd like to know the odds of getting 1 or more thing out of 15 tries at getting something which has a 3% probability per try. We could look it up in a table, but this case can actually be computed from elementary probability. The odds of not reaching the 97th percentile on a single try are 0.97 (actually, the odds for our particular residual are 0.9704). The odds of not reaching it on any of 15 tries is 0.970415. And so the odds or reaching it on one or more tries are 1 - 0.970415 = 36%. In other words, watching the IEA data for two years, the chances of seeing a residual this big are more than a third.
Thus, it isn't significant at all, and is not meaningful evidence that anything is going on more than the usual noise that affects the amount of oil produced each month.
Nor will it be particularly significant if the EIA series also makes a big jump up when we finally see their October number. The 87% r2 between the two series makes that more likely than not.
Of course, if the IEA series stayed this high for another couple of months, that would be another story altogether. Given the lag-one auto-correlation, a single extra high month wouldn't compel. But three consecutive residuals this high would be very unlikely based on the past history.
And for that reason, my bet is that it won't happen that way. If it were to happen, I would accept that as pretty strong evidence that something new was happening and oil production was now increasing again.
Finally, as an aside, there's a slight mystery here. With a one month lag autocorrelation of 40%, I'd have expected a two month lag of around 15%. The fact that both EIA and IEA lag 2 and lag 3 autocorrelations are very slightly negative seems to me rather odd. Anyone got any ideas for a mechanism that would tend to push oil supply slightly in the opposite direction from where it was going, with a lag of about 2 months? OPEC adjusting based on OECD inventories maybe?
Contact
- Content: editors at theoildrum dot com
- Tech support: support at theoildrum dot com
License

This work is licensed under a Creative Commons Attribution-Share Alike 3.0 United States License.
Matt Simmons suspects that a lot of the recent increase in NGL production is due to a number of gas caps being blown down, in oil fields that are in terminal decline.
In any case, since we talk about prices in terms of crude oil and since about 98% of the input into refineries consists of crude oil (C+C), I think that it makes sense to talk about the volume of C+C.
And the best way I have found to handle the monthly data, in what IMO is the early stages of the world decline, is to look at the cumulative shortfall between what the world would have produced, at the 5/05 rate, and what we actually produced. This shortfall is now in excess of 700 mb through August (EIA, C+C).
WT - Can you explain to someone with an MBA what a 'gas cap being blown down' means? Thanks
And more importantly, what other obscure technical reasons might be trotted out to explain away further increases above and beyond the projected declines?
Maybe it's not so obscure to those in the industry, but I find it amusing how people are wedded to certain ideas to the point of dismissing any alternative scenarios, and then something like this happens and all of a sudden there are new rabbits in the hat to explain away what has happened. Explanations that were previously not even on the radar screen.
www.spegcs.org/attachments/studygroups/11/SPEGCS_RSG_Matt%20Simmons_2-24...
This is a good early 2005 presentation by Matt, which describes the three primary drive mechanisms. He also talks about the Yibal case history and Ghawar.
As they say, the simplest explanation is often the best. And the simple explanation is that it is a virtual certainty that every oil field that has ever produced one mbpd or more of crude oil is now in decline.
Texas and the Lower 48 couldn't match their early Seventies peak production rates, because of the declines from the old large oil fields, and so far Saudi and world crude oil production numbers are showing the same pattern as Texas and the Lower 48.
There are three principal drive mechanisms in oil reservoirs: solution gas drive, water drive and gas cap expansion drive. To some extent, gravity drainage is a factor, especially in gas cap expansion drive reservoirs.
Not all oil fields have a water leg and not all oil fields have a gas cap, but let's assume a large field with a water leg, an oil column and a gas cap--gas on top of oil on top of water, e.g., Prudhoe Bay.
The best way to produce an oil field with a gas cap is to minimize the gas production from the cap and to produce the oil from the lowest practical point in the oil column. As the oil is withdrawn, the gas cap expands, pushing the oil down, aided by gravity drainage. Frequently associated gas is processed, to remove the NGL's, and the dry gas is reinjected back into the gas cap. Also, in many cases supplemental water is injected into the water leg in order to keep the reservoir pressure up. Prudhoe Bay is unusual in that water is also being injected into the gas cap in order to keep the pressure up.
In time, the oil column thins to the point that so much water, from the underlying water leg, and gas, from the overlying gas cap, is being produced that it is no longer economic to continue producing the thinning oil column. At that point, the operator will deliberately produce the gas in the cap, which is basically the final stage of depletion in the field. This would result in a short term boost in NGL production.
So, Matt's point is that a lot of the recent increase in NGL production comes from oil fields in their death throes.
The Brent Field being a good example! An oil field that became a gas field and will likely be decommissioned as a gas field within a couple of years.
Another factor is that it seems that KSA is now selling more Arab Heavy they increased the markdown to make viable for simpler refineries to handle it.
http://www.peakoil.com/fortopic34425.html
I think most people agree that its known that KSA has excess capacity that consists of heavy sour crude that its been unable to sell at the price it wants.
The combination of this entering the market blowdown of gas caps and some increased production from Iraq would explain all of the current increases if they are real. I'm not saying that these are not new increments but its not clear yet if they are enough to have overcome drops in other places. I'm guessing that the increase in how heavy oil is which drops the amount of gasoline per barrel is being offset by increased production of the lighter NGL's. So overall even though it seems that light sweet crude is decreasing the combination of NGL and heavy oil is in a sense offseting the loss of light sweet at least for now.
I guess this shows up as processing gains ?
I'll admit I don't know enough to understand NGLs vs heavy etc etc maybe one day Robert Rapier could post on the finer points of oil.
Interesting regards gas caps and depleting fields. Big bid up now for big Nat'l Gas pipeline from...Alaska. Canadians, yanks and Chinese bidding on it. Have a friend up there working that area. North Slope has been in pretty steady decline (no news there) and...they've been cross drilling over into ANWAR. Not getting as much as they would have liked.
Old Wash Post piece on Prudhoe decline; http://www.washingtonpost.com/wp-dyn/content/article/2005/06/06/AR200506...
That's dead serious that this valuable oil is now used for consumption. We actually need it as an energy input for all those future projects required to de-carbonise our economy. NASA climatologist James Hansen has calculated that if we burn all oil and gas WE MUST PHASE OUT COAL OR USE COAL ONLY IN COMBINATION WITH CO2 SEQUESTRATION.
Implications of "peak oil" for atmospheric CO2 and climate
http://arxiv.org/abs/0704.2782
These sequestration projects are huge projects requiring free-flowing diesel for construction equipment. A 1 GW coal fired power plant generates 150 Kb/d of liquid CO2 to be sequestered away. Geological surveys, drilling rigs, pipelines etc. If that has to be done on the backside of peaking oil and gas curves how will that work?
I repeat again we have to set aside oil and gas fields for the sole purpose of serving as an energy input into those de-carbonisation projects.
Oh, really?
How far do you have to drill to get there? 1 Mile? 50 Miles?
He's not really serious about that, now, is he?
Cheers, Dom
That's what my guy told me. Also told me that Prudhoe is pretty much tapped out and has been in death throes decline for 5yrs. He's lived and worked up there going on 40yrs.
Figure this; they can drill deepwater, horizontal drill tech isn't in its infancy. Why not X-drill long distances on land? Alot easier than dealing with 1,000s of meters of water and liquid salt caps (like the new Brazil field) even more 1,000s of meters down. Kuwait X-drilled far enough into the Basra area to cause a noticeible decline in Iraqi field pressures and thus set themselves on a crash course with Iraq in '89. Why not slide horizontal into ANWAR? Actually less impact that way.
Did anyone really think they'd just go "Oh well..." and let that crude just sit there?
Now, that doesn't mean that they're going all the way in, but if they can get at what's on the perifery, why wouldn't they?
Like I said, this was just my source. I don't have reason to doubt him, but I'm not up there. So there it is for what it's worth.
Could be. Evidence would be that production stops falling, for instance.
Just ask him how far they have to drill. I have an email address..-), just in case it takes a while..-)
Cheers, Dom
Well, you've got pipeline to Badami. 20-30 miles to ANWAR from there. I'll see what moroe i can find out. Who knows up there.
Back several years ago, I downloaded a document from Alyeska Oil website that indicated that without drilling into both NPR-A and/or ANWR (Area 1002), the pipeline would reach it's transport minimum by 2017 (200,000 BPD) and ready for "abandonment in place" status.
The combined effects (and building the required infrastructure, particularly for ANWR since it's a long way from the TAP) of NPR-A and ANWR could extend the life to roughly 2034 if the USGS Mean estimates we actually found and recovered. A temporary boost in throughput up to a level between 1.4 and 1.5 million BPD would be likely if the oil from ANWR really exists.
The oil resources in NPR-A are bit more certain because of the greater amount of drilling and seismic work in NPR-A and some of the reserves are currently being drilled and being readied to be brought online to slow the decline caused by the Prudhoe Bay fields reaching the end of their lives (average water cut is now greater than 75%).
The argument (in Alaska at least) really is less about a Wildlife Refuge turned into a Wilderness Area (although there are some fairly strong opinions about THAT process), than it is about the availability of infrastructure to move any oil that might actually exist. It seems pretty clear to me that once the TAP is shutdown, oil in ANWR (1002) becomes a moot point.
Well, since you've depreciated the pipeline, why not just turn the gas in place into GTL and send it south on the pipeline? When the oil is gone, just convert the pipeline to methanol. A lot better than just scrapping it for the molybdenum alloy steels.
it might be of some benifit to point out that for an oil reservoir, pressure depletion(solution gas drive) is not very efficient. and this is because low viscosity gas is not very efficient in displacing higher viscosity oil (typically 15 - 25%). water is more efficient than gas and a typical water displacing oil efficiency is 40%.
gravity drainage trumps all.
for a gas reservoir, depletion (or blow down) is the most efficient mechanism. a gas reservoir generally behaves according to the real gas law, pv=zNRT. so the lower the pressure, the fewer moles, N, of gas remaining and the higher the recovery. recoveries from depletion of a gas reservoir are typically in the range of 85% or better. typical water drive recoveries from a gas reservoir is about 65%, about the same as an oil reservoir produced by gravity drainage.
ghawar is produced by gravity stable pressure maintence by water injection and a reasonable recovery estimate is about 65%.
"Matt Simmons suspects that a lot of the recent increase in NGL production is due to a number of gas caps being blown down, in oil fields that are in terminal decline."
What is the source of this statement by Simmons?
What recent increase in NGL production? the OPEC dataset is the only one that breaks out monthly NGL. It only shows a recent 50,000 bpd increase.
What is meant by recent? The data we are talking about in this thread or does Simmons simply mean "in general the last few years"?
In other words, is Simmons suggesting that NGL production the last few months is the reason for a new liquids peak?
You will have to contact Matt directly if you want his supporting evidence. He addresses the issue on Slide #12, in his ASPO-USA presentation. Go to www.simmonsco-intl.com and click on his speeches and look for the ASPO presentation.
In any case, Euan just provided a concrete example of a giant oil field, now in its death throes, showing an increase in gas and NGL production.
It is a little ironic that the cornucopians are probably celebrating increasing NGL production as evidence of the "death of Peak Oil," while in fact it is probably just a side effect of many oil fields being in terminal decline.
My cornucopian aspect wants me to remind everyone that 'cornucopian' means that humanity can solve problems, NOT that oil is inexhaustible OR that peak-oil is not imminent.
My doomer aspect thinks my cornucopian aspect is stupid anyhow, and really doesn't care.
:-)
Cornucopian means that one doesn't believe in limits, that resources are going to be plenty forever, because substitution or new advances in science.
Today they are called "Perpetualists".
A Perpetualist believes in one or more of the following:
1. Peak Oil is just a hoax to help the oil companies game the markets and make gazibillions of dollars.
2. Planet Earth is filled at its center with a creamy-naugot of biotic and abiotic oil-generating gnomes. They replenish the reservoirs every time the markets say pretty please. It's always been that way. Always will be that way. (We've been at the Malthusian ha ha end point five times before and will be there again an infinite number of times in the future.)
3. Progress is forever. "We" have always had progress and always will. Besides, anybody with half a rational mind knows the "World is Flat" and is heading inevitably towards the "Singularity" if they read their Thomas Friedman and Kurzweil Bibles.
4. Human ingenuity solves all problems. Always has. Always will.
5. God will not allow the human race to go extinct because God is perfect, God is forever, and God created man in his own image. Therefore because God is perfect and infinite, He will never admit that creating man was an environmental mistake and He will never let mankind go extinct. (Oh, and as for the dinosaurs, Satan made those, not God. Why do you think they looked like dragons anyway? They were Satan's creation. Good had to triumph over evil and thus the dinosaurs went extinct. There is an "ingenious" explanation for everything. Always has been. Always will be.)
A good term, actually - in part, because it actually seems fair and accurate. Without being condescending or insulting.
Now if we can just find a good term for people who don't believe in that framework.
.finalists..fatalists..fatualists..finitalists..entropists..party poopers..manic depressivists..alarmists..limitists.? exaustionists ?
"realitycountants"
=those who account for real things (i.e., EROI, barrels of economically recoverable crude left in the ground and number of rigs (straws) and men (suckers) available "above ground")
This is opposed to the other kinds of people:
"fictioncountants"
=those who account only for fictional things (i.e., money, the everlasting perpetual compound interest and the ever growing, strong and robust free market)

Ahh, yes, the old "pro-life vs. pro-death" sophistry. Nonsensical, self-serving labels only serve to mark you as irrational and arguing in bad faith.
Ahhh God. You've thrust the mark of Cain upon my forehead.
I am irrational.
I am invincible.
I am sophist man.
Thank you for setting me straight oh pitted one.
;-)
I left out *realists* for a reason..
It's a prefered subjective way of looking at oneself.
Of course my accounting is realistic. I just happen to be counting beans and the other is counting peas...
Cheers, Dom
Not so! Opec Natural Gas Liquids increased from 4.83 to 4.99 mb/d September to October. That is an increase of 160,000 barrels per day.
Ron Patterson
Yes So! You're looking at IEA numbers. I'm looking at EIA numbers which are 4.50 and 4.55. 50,000 barrels. Regardless, it is only roughly 10% of the overall increase which was more to my point.
But the EIA is not the one showing the sudden surge in October production. We are talking about this new record reported only by the IEA. Also, you are looking at the EIAs Short Term Energy Outlook. That is just a preliminary guess by the EIA. Their official figures come out in their International Petroleum Monthly.
You cannot mix apples and oranges GC, if you are talking about what Simmons was talking about, (the new IEA record), then you must look at the natural gas liquids he was talking about, those reported by the IEA and they report OPEC NGLs increased by 160,000 bp/d in October.
I believe strongly that there will be no new EIA record set in October, not in crude + condensate anyway. And it is highly unlikely that they will find any new "all liquids" record either. At any rate, when the EIA data comes out for October we can discuss it then.
Ron Patterson
The EIA (International Petroleum Monthly) data go only up to August 2007 (published in November) which was a minimum month. So we have to wait until January 2008 to get their October figures.
With all respect, since you obviously follow these numbers, they are all guesses. EIA, IEA, or BP. And anybody else. They undoubtedly all get their figures from the same dubious sources. In reality, you will admit that the "preliminary guesses" never change much.
There are revisions, to be sure, but not very many and they don't add up to much. I already know your objection(s) - but please, hear me out, I can prove it.
make a database of preliminary figures and one of "final" revised. Run a training moving average on both columns (12 months). Then tell me by how much they differ on average and make a graph of the two lines.
Then try to make a monthly graph that spans back to 2002(5 years) where you can see daylight between the two lines.
Am I right?
The IEA October 2007 spike came about in this way:
in mb/d Oct07-Sep07
Saudi Arabia 0.1
Russia 0.07
Iraq 0.12
Nigeria 0.09
OPEC NGLs 0.16
UK 0.09
Others FSU 0.26
China 0.2
Angola 0.1
Brazil 0.04
Others Asia 0.08
Australia 0.04
Others 0.05
Total change 1.4
The main characteristic was that the total increase was the result of many increases spread over many countries and that there were no significant drops elsewhere in the supply system. The question of course is now whether those increases can be maintained and/or are not canceled out by those other disruptions in the next months.
That's a good catch Matt. In my mind that tends to make it seem more random, rather than some systematic change.
I have the entire IEA dataset going back to Jan 2004 and there is approx. 1mnpd more NGL now than there was nearly 4 years ago. But it doesn't explain last months sharp increase.
I think the saying goes: "A single swallow doth not a summer make". In other words, this new elevated production level now needs to be maintained, month in and month out for years to come, otherwise any decline will only be more visible. If I was IEA director I would have thought long and hard about releasing that number. Maybe I would have spread it over 6 months or something. This brings me to the my next point: the veracity of the data.
I am an accountant. I have spent my life interpreting and presenting figures and I have seen enough to know that what you see is not necessarily what you get. WSI-NN-WYG if you like. I have wondered for a long time about the consistency of the data. The data is more a political statement than a statement of fact. It is hard otherwise to explain the consistancy of both the EIA and the IEA data, even the noise! However to be fair, both agencies are using a wide variety of data sources including estimates for tanker movements and the like and there will be a great deal of interpretation and adjustment going on.
I have even wondered whether KSA for instance would go so far as to fill tankers with water to mislead production estimates.
So for a long time I have tended to take the data from both agencies as components in a trend. It is much harder to provide false data that is also credible over a period of time than falsify a single data set. Lets see what this month brings, then next month etc. If production levels hold we should try and find out why. If they don't, it was just noise.
Trust me and I'm a super doomer their is enough slop in the numbers that we will probably be in bad shape well before we actually get the numbers to prove it. KSA is already playing games by increasing shipments to the US and decreasing to Asia and vice versa. Non-OECD demand could have dropped because of prices by 1-4mbd and we would never really know. We do get the reports eventually of shortages but most of these countries also have storage facilities so that means the actual shipments started decreasing before the final shortage hit the papers. Without invoking any nefarious actions the worlds oil supply is so badly accounted for your basically losing the exports of Mexico in the noise. Thats pretty bad.
This is a very important statement from an accountant. I doubt it is possible to fudge data consistently in such a way that one does not leave a statistical signature in the data set ultimately providing clues where the fudging was done. So Stuart's exercise is one valuable contribution towards this analysis.
Liquid natural gas production is rapidly increasing. A byproduct of LNG liquefication is natural gas liquids/condensates production. Since natural gas production has not peaked, the supply of NGL's is increasing. Some natural gas to synthetic oil/diesel will produce more liquids. The rapid increase in natural gas discovery in West Africa, Egypt, Australia, and other parts of the world is a positive sign for the energy consumer. New technology may make heavy oil production more profitable. The ASPO peak oil forecast includes the increase of natural gas liquids expected.
Natural gas is being substituted for oil wherever economically feasible.
To repeat a phrase found on the cover of a German weekly newspaper - 'no bread for oil.' I am not in the least surprised at an increase in all liquids - it has been the policy of several major economic blocks, such as the EU and the U.S., over a long enough period of time, that an increase in biofuels is simply to be expected.
And accepting the idea that the plateau/decline will be mild at first (though we may be in for a surprise when the super straws start slurping loudly), a ramp up in biofuels could quite plausibly outweigh the initial signs of oil production turning down.
Which is why 'all liquids' is such a fascinating concept. As has been pointed in terms of Orimulsion - 'Orimulsion is made by mixing the bitumen with about 30% fresh water and a small amount of surfactant. The result behaves similarly to fuel oil. An alcohol-based surfactant recently replaced the original phenol-based version; improving the transport properties of the fuel and eliminating the health concerns associated with the phenol group of surfactants.' That's right, part of IEA's 'all liquids' is fresh water.
Orimulsion is '...obtained from the world's largest deposit in the Orinoco Belt in Venezuela. Reserves are estimated at more than 1.2 million million barrels (190 million m3) of bitumen, an amount greater than 50% of the world's estimated oil reserves.' http://en.wikipedia.org/wiki/Orimulsion
Which means that according to IEA's measurement methodology, the quoted figure for these reserves is understated by 30% - the sort of number which will warm the cockles of CERA's and ExxonMobil's hearts.
...no longer produced.
That was quite an interesting link. The basic reason for discontinuing Orimulsion production at the time was price, apparently, and it seems as if Orimulsion was 'invented' to get around OPEC quotas.
And what replaced it? Mixing crude with bitumen, so the resulting mix could be sold at a higher price, instead of at a price point in competition with coal.
Which then raises the question of how much 'crude' is Venezuela producing for refining, if some arbitrary percent (10% of the amount of new and improved Orimulsion, say) is being mixed into bitumen, which is then burned essentially as a coal substitute? The definition game will become increasingly difficult, since in this case, it would seem to be fair to argue that the crude so diverted is not exactly the same as crude from 1990, when Venezuela was over its OPEC quota. In other words, though Venezuela's crude production is not lowered by the amount mixed into today's Orimulsion, the amount available for refining is lowered by that amount.
The article, from a year ago, is interesting for another reason, found in its concluding paragraph -
'Venezuela, which consistently produced in excess of its OPEC quotas during the 1990s, is now producing below its quota after losing production capacity in recent years due to a lack of investment.'
Venezuela has certainly not been doing a good job managing its oil industry under Chavez, at least in the eyes of those that want to buy oil, but could there just possibly be another reason for declining production, one just a bit beyond the grasp of free market solutions?
I will admit when searching for Orimulsion, I simply relied on Wikipedia and the first few Google results - and felt that it was adequate, but with a certain reluctance (which is not always the case). And now, looking further, this little gem popped out from http://www.gasandoil.com/goc/company/cnl42911.htm -
'Victor Poleo, an oil economy professor at Venezuela's Central University and former Venezuela’s vice minister of energy, is on record saying "the decision to stop producing orimulsion was actually hatched in Washington and implemented by Caracas," because the United States, like Germany and Britain, wanted to get rid of a competitor for their coal.' Take it with a grain of salt, but an interesting perspective.
When looking for the new product, merey 30 from Sincor, I didn't have much luck. I am guessing it is merely a higher priced form of bunker fuel.
http://science.reddit.com/info/620pq/comments/
thanks for your support.
So 86.43 million barrels a day is a big deal. Remember, next year the world has to get near to 88 millions of barrels a day. Still 1.5 million barrels a day short next year, by my calculation.
Stuart:
As I believe you (or others) have pointed out, something clearly happened to the way that the IEA started looking at "liquids" compared to the way that the EIA looks at liquids as you have the curves passing each other and the IEA now being the greater numerical value of the two. It is remarkable the way the residual errors correlate, though not terribly unexpected.
No visually apparent heteroskadacity in the data either, at least from a cursory look at the residuals. But, I would not rule out periodicity that looks a bit like a sine wave in the residuals. When I've looked at the data before and the autocorrelation effects there was a hint of this pattern which looks a bit like the seasonal changeover (but I haven't rigorously tested this hypothesis. Just a thought).
As for your negative correlation question, it could be just "where we are" on the curve (along with available surplus capacity). But the negative correlation (looking at 2-month autocorrelation is so small that is, for all intents and purposes, not correlated at all beyond 1 month>
You are correct: stuff happens. And we can overcook the data within an inch of its usefulness. It's the difference between liking our data al dente or having it turn into mush.
The second largest monthly decrease in oil production occurred from December 1976 to January 1977 (drop of 5.629 MMBPD) to be followed the next month by the largest monthly increase for January to February 1977 (increase of 3.816 MMBPD). The largest monthly decrease occurred between Decmber 1977 and January 1978 (at 5.645 MMBPD). But if you look at the period of time in the 1970's, large swings at this time of year seemed the norm. It's been a long time since we've had swings this large.
The issue with the absence of second month autocorrelation is that we would sort of expect some because there's first month autocorrelation. If month 1 is correlated with month 2 and month 2 is correlated with month 3, then we would expect at least a little bit of the correlation from month 1 to bleed through into month 3. If you knew nothing else, 40% * 40% = 16% would be the best guess. So I'm a bit puzzled by -5%. I suppose it could be noise (Excel doesn't give me the error term on the autocorrelation, and I haven't had a chance to work through it myself), but I doubt it given the way it shows up the same in both series.
It's in the monthly production data itself. If you look at the monthly change it's more than just random scatter (an argument for autocorrelation but not the only one) and a periodicity of about 3 months is apparent. I don't have SAS on this machine, otherwise I would probably drop it in and see what spits out.
A quick run through on Excel shows that a high-pass filter will show this transient effect. A filter of more than 6-months, however, justs smooths it out and starts showing the same sort of trend seen in the recursed average.
Now that I look at it a little more, I'll tell you what it looks like. It looks almost like a system with hysteresis and/or time delay (which makes some sense as a descriptor on demand and transport of oil and refined products through the system) because the pattern actually looks more like a control system that is "ringing" between two a maximum and a minimum, where the "control" at the gain and resonance as the underlying system.
Just a note my super dumb pond model was based on the concept of a 3 month wave like pattern in oil supplies. I based it on the time it takes super tankers to move oil around the world.
Coupled with the days of storage. The extra 3 months are transition months.
So oil usage seems to follow a
Sept switch month
Fall(agriculture/get ready for winter)
Dec switch
Winter ( heating oil)
April switch
Summer (driving season)
Sort of seasonal supply pattern. Noteworthy this time around is we experience a price increase in Fall instead of decrease with no Hurricanes As far as I know this was unusual.
The 2nd and 3rd month correlations are negative because the trend line is not a "true underlying function", it's a moving average computed from the original data. You simply can't have a bunch of same-sign residuals in a row, or you would have drawn the trend line in a different place.
Well, that effect is real but I wouldn't have expected it to be very important at a two month lag when I have a window that extends over 25 months.
"Something has happened to the IEA numbers" - a new director started a few months back and now "his feet are under the desk" so to speak, I guess he may have made his first executive decision (under pressure from member countries) - to show growing all liquids supply. After all: who is going to argue?
If shortages are in third world countries (and who cares about them anyway? We can all go and do some cooperative handwringing later) and they truly believe that it is sentiment and speculators that is driving prices, not the fundamentals, then so their thinking goes, by fixing the reporting (the IEA numbers) they may fix the speculators.
I think the data just got worse than it already was. Now it is not just bad, it is becoming deliberately misleading.
This sudden jump is strange. Too bad they don't precisely say where this increase is coming from. The EIA is showing a big drop for August:
The seasonal peak within the other liquid category is around June-August (Ethanol production) so the total liquid is expected to drop unless there is some growth coming from NGL/crude oil. This drop should continue by at least 0.8 mbpd until next January.
One concern is that the IEA numbers are not revised frequently (at least on their public site) contrary to the the EIA's numbers which are revised every month.
Khebab (or anyone)
Corn is harvested in the autumn. Is there a disparity in the monthly production of ethanol during the year - correlated with harvest, or is it smoothed out over the 12 months due to storing the corn? I should know this answer but do not.
It is smoothed out due to the storage of the corn by farmers and elevators. Ethanol plants generally carry only about 10 days of corn in their bins. If they are short of corn they simply raise their bid a few cents and generally get all they need. Corn is still a commodity in surplus.
http://www.ethanolrfa.org/industry/statistics/#A
Thank you!
That makes sense.
Nate,
A comment on corn/soybean harvest and ethanol/biodiesel production.
At the risk of showing how little I know, what I have seen over the last couple of years is that the price of corn and bean oil is not known for the current harvest until after October when the crop is in. So prices fluctuate but more or less get a floor after October each year.
Many large producers lock in prices for the next 12 months delivery based on this floor knowing prices will not go lower. Spot price is not what large users typically pay. They contract most of the delivery and hedge a smaller amount on spot pricing or shorter contracts. Farmers who have storage try to do the same only in reverse to make the most money.
What I see happening now is that all the energy costs and demand for corn and beans is already built into the price of this years crop. This means ethanol and biodiesel cost more to make now than this time last year because raw materials are up.
The problem is that fuel prices are usually at their lowest in the fall so the spread between biofuels and petroleum fuels is the smallest now. If fuel prices rise in the spring and summer (as they have in the past), the spread will grow because the commodity prices are locked in and biofuel prices can be held low, making biofuels more competitive again. This cycle repeats every year with all prices going up. The problem is that the commodities market has a firm price until next fall (or spring if you count South America) but no one knows what Crude will do between now and then.
In the last two years biofuels have always looked economically viable in June, July and August. I predict they will again this year. Unless of course OPEC floods the market with crude permanently driving prices down.:-)
The IEA revises its numbers every month in table #3 of its Oil Market report(usually around page 50). It revises for the previous two months.
They break out about 30 countries, OPEC NGLs and condensate, biofuels, and refinery gain.
I don't have the numbers here, but it is very easy to see precisely where the changes occur.
The EIA (contrary to something I saw written here the other day) breaks out the same data, minus biofuels but with at least 5 additional countries every month for the previous month(November data will be published on December 11th).
The IEA says liquids production is up 1.9 million barrels per day from August. The EIA gives this same figure as about 1.75.
If people are interested in C+C, these are the numbers that are always three months behind. But since they obviously correlate well with the overall liquids numbers, there is a high probability that they will be about 1.5 million barrels per day higher for November/December and very close to if not setting a new peak.
I will try to post my numbers on where the 1.4 million barrels came from exactly for October later.
If I remember correctly, Sudan, Angola, Saudi, Algeria, Kuwait, UK, Norway.
According to the IEA, OPEC has increased production in September (+0.37 mbpd) and October (+0.57 mbpd). This increase comes mainly from Iraq (+0.30 from August). It looks like the US long term investment in Iraq is finally paying off :).
Re: The EIA gives this same figure as about 1.75.
Where did you find this figure? the last EIA estimate is for August.
Got to this page
http://www.eia.doe.gov/emeu/international/contents.html
Then click Short Term Energy Outlook on bottom of page center.
http://www.eia.doe.gov/emeu/steo/pub/contents.html
This will bring you to a page highlighted in yellow, on the right side there are links to tables 3b OPEC production and 3c Non-OPEC production
click on the "html versions" which will bring up a dynamic html page where you can choose annual, quarterly or monthly data. Then choose years. I just set it to 2007 and 2007.
You can then download to excel. There is a glitch where it does always move from annual to monthly correctly, but I've found you can move to quarterly to reset the widget and then back to monthly.
Last month is October, but it also lists projections for Non-OPEC.
You have to add the OPEC and non-OPEC yourself to get all liquids total. Be careful OPEC-non crude liquids are contained in both totals so you have to subtract one out.
Compare result to IEA's last OMR. That's where I got my numbers of 1.90 an 1.75.
One other note: There is something at the bottom of the page on "historical data" that says something about the IEA. So it looks like both agencies are getting their numbers from the same place(s).
I hope this helps.
Very useful links, thanks!
Let's just say it gets you close between the "short-term" energy reports and the other longer look back reports.
For example:
http://www.eia.doe.gov/emeu/ipsr/t14.xls
does not reflect the same numbers as the STEO tables. Close, but not always the same. The STEO might be a good rough first cut while we are waiting for more complete data.
However, you will find correlation between the IPM and the MER (as numbers are updated in the MER at the end of any given month, new numbers are then reflected in the next IPM early in the following month (or at least that what I've found). But sometimes the STEO numbers look like they came from a sampling of one-eye-vegetarian monarchists.
"For example:
http://www.eia.doe.gov/emeu/ipsr/t14.xls
does not reflect the same numbers as the STEO tables."
Thanks for pointing that out. I just checked one month (Oct 2006) and they were off by 50,000 barrels. Good to know.
The non-OPEC figure for October is virtually identical to that for July, the OPEC figure about 800 tbpd higher (the increase widely spread among KSA, UAE, Kuwait, Angola and Qatar). So one can predict with some confidence that the EIA's October figure will be close to that for July 2006, and lower than those for May and December 2005. Thus no record.
Khebab, I'm left too assume that the latest number that is the subject of Stuart's post is for October, and you refer to a "large" drop in EIA figures for August. Its important to remember that areas like the N Sea hit summer maintenance lows in August and will be climbing out of that by october.
I'm always warning about reading anything into monthly figures. But I read the OMR linked to by Stuart. Its a load of rubbish. The IEA is funded by our taxes. My feeling is that we should start dissecting every word and statistic they produce - all the time.
You're right but some seasonal monthly fluctuations are pretty easy to predict also. For instance, the other liquid category peaks in July-August and reach a low in January. So in order to increase total production in the next few months it would have to come from C+C/NGL only.
Here is the STEO/IPM/IEA chart:
The STEO is predicting a wall of oil coming in the next few months (as usual!).
I agree with your skepticism, but you must admit, it is not outside the realm of possibility. If we go back and look at a monthly production chart to 2002 or 2001, it is clear that this happened before, circa 2004(what they are predicting for the next year).
I don't know what their model is for coming up with this stuff. The new peak this month seems to have caught a few people on The Oil Drum by surprise.
I think it would make sense for people on both sides of this argument to start speaking of events in terms of probability. Otherwise there are going to be a lot of losers.
The IEA numbers are revised in the 2 months following the original publication, then they remain unchanged. The EIA (IPM) can revise data going even years back.
As "Stuart Staniford" pointed out, revisions in IEA figures appear in quarterly numbers after the first two months.
Yes the EIA revises figures going back some . But it is 99% of the time irrelevant. Look at the examples. Azerbaijan by 10 barrels a day going back 36 months. Big deal. (I'm just meaking that up - but that is what they amount to). And does anybody pay attention? No. People only pay attention to the front-end numbers and how they compare to the back-end.
It looks like "Khebab" and "Darwinian" and "SailDog" pay close attention to these databases. Could any of them off the top of their head tell you the major revisions in Norway's production for the last year? I rest my case.
The focus is on Saudi Arabia. We all know that. And apparently the real focus is on future production not published statistics.
We've noted before the revisions IEA makes. Are the numbers for the other months revised or original? If regression to mean applies, the current number should drop some anyway. Thanks for your work.
The situation is that each monthly report lists the most recent three months production in (in Table 3). So a given month appears three times before falling off the radar. During those three appearances, it will typically be revised. So the bulk of the data has gone through two revisions, but this most recent point has not been revised, and the September point has only gone through one revision. Thus they could change as you note.
Also, the quarterly numbers (which show up in the table for longer) indicate that further revisions happen. However, I don't incorporate those in my series since there's no way to reliably impute the changes to individual months.
Stuart,
How about: Oil is going above 90 US$/barrel and even OPEC thinks that's a bit much. So they sell the oil stored in tanks?
Well, one can come up with all kind of explanations, let's just wait until next month.
"Well, one can come up with all kind of explanations, let's just wait until next month."
I think the point was a quick refutation of the plethora of articles popping up like weeds being like "Look, see I told you Peak Oil was a scam!"
"So, you might look at this graph and notice that the October 2008 point is at the 97% percentile "
I think you mean October 2007
Thanks - fixed the typo.
Would it be possible to add a 13 month moving average to the price graph as well? The smoothed price is probably a better guage of the current effect of price on the economy.
The daily price spikes make news, but they don't convey the "time at price" effect. The real 'pain' of a yearly average $95/bbl oil is much different than the jolt of a one day spike to that price.
Don't forget that the $95 price is the spot price for WTI. Hardly anyone pays that much. Most oil is sold under long term contracts. So correlation with volumes should match those contract prices, not the spot, I would guess.
Stuart
A quick off-the-cuff suggestion on the autocorrelation. How many tankers does it take to shift this much oil around the world and how long does the journey take?
In the same way you tend to get three London buses turning up at once, are you seeing the effect of discrete shipping timescales becoming aligned over time? IIRC the amount shipped is estimated from tankers counted leaving port, a discrete event?
What looks like shipping in one period would tend to result in a shortage after a defined period of time related to the average journey time of those ships.
In the last 2 weeks tanker rates have surged the most in the last 2 years. The oil is definitely there and being moved, because tankers were losing money previous to this. Last week nobody could find the ships to pick up cargoes in the Gulf.
http://www.forbes.com/2007/11/26/oil-tankers-opec-markets-equity-cx_ra_1...
http://www.bloomberg.com/apps/news?pid=newsarchive&sid=amMvFUC7o4uM
http://www.bloomberg.com/apps/news?pid=newsarchive&sid=a7hdSTsasjNo
Wow, nice graphs. This is a lot of good information.
My superficial observation is that the production spikes have some correspondence to the price spikes, and the production drops have some correspondence to the price drops. Is there any hard data to support this observation? After all, I wouldn't expect production to be entirely insensitive to price. Maybe Richard's idea of drawing down storage tanks, or some other heroic production measures in the time of $80+ prices, explains the jump.
Re. the 2-month negative correlation: candidate explanation could be an "oscillation" of crude going into and coming out of storage. That is, if there's a period of more-than-average oil going into storage (therefore less shows up in IEA and EIA accounting) followed by a period of withdrawal, this would show highs and lows oscillating around the average trend. A positive must be followed by some period of negative because storage limits don't grow significantly; it balances out to the average trend in the end. Of course the period is unlikely to be exactly 2 months, and it's hard to explain why it would have that periodicity unless it's a feedback mechanism responding to the previous data itself.
Of course all this is dancing around the real question, which is: how much of this variation from the trend reflects "accounting noise" i.e. independent of production reality, and how much reflects true variations in oil production? The fact that there's positive and negative correlations in the data (it doesn't exhibit random noise characteristics) suggests there's at least an element of real production variations behind the data, and that raises additional interesting questions about where they come from.
- Dick Lawrence
ASPO-USA
A bit unscientific but actually correct I've always used 4mbpd decline as the signal that we have past peak oil. Its a good number for a lot of reasons since once we are down 4mbpd we are for sure out of the noise and it would basically be impossible to overcome a 4mbd drop without finding another Ghawar like field. However one thing thats not included in this analysis is price variation which suggests that overall exported oil has dropped. Probably the main reason right now is WT export land model.
A second concept that WT has presented is a bidding war for oil I think this will actually start once we are down about 5% from peak production.
Finally if I'm correct and a lot of the production increases since the 1990's are from advances in technology not real increases in reserves then we should come of this plateau sharply. In fact the longer the plateau lasts the steeper the final decline. So from my perspective this plateau is not a good thing. Its to early to tell but given the worlds at a 80% water cut I don't think its going to undulate for much longer. And since this number does not include gas driven reservoir's it a fair bet that we are probably past 80% globally for depletion of oil extractable via primary and secondary recovery.
So in my opinion once we do come off this plateau the decline rates will be steep and obvious. And I cannot see us making it through 2008 before this happens if I'm right. If I'm wrong then I freely admit I don't understand the current situation.
If its a peak production at 50% URR in my opinion advanced technology and drilling driven by price increases should lift us higher and we should actually see a slowly rising production curve. Basically we still have a lot of oil accessible esp at todays prices/technology and the market should drive production higher and we should be able to increase production to 60% or higher overall URR. So if true we should now see a slow increase in production in 2008 given the current price levels.
Maybe with the data we have we could calculate the probability of staying on a plateau for X number of years.
Given the nature of the problem I tend to think in 2008 we will see a clear move one way or another.
but given the worlds at a 80% water cut I don't think its going to undulate for much longer.
This seems to me to be the most signifigant figure in the discussion where can i find some discussion/validation of this?
http://www.touchbriefings.com/pdf/2590/Ferro.pdf
Much of this is over my head. Not an oil industry type. Just a regular Joe who has read The Globe & Mail for the last 10 years on Saturdays only. Heard about the suspected decline in the mother of all fields in Saudi Arabia about 5 years ago on Al Jeezera site. Noticed all the new big players wanting in on the Tar Sands, China's aggresive advances around the world. Got most of my web oil info since Jan 07 from Sprott Asset Mgmt. Peal Oil Page and most recently starting last month, our dearly beloved TOD has given my life, or at least the oily part, a new lease on life!
Memmel I think you are right about the end of the Plateau and that we might not know it until it is upon us. Actually, if gut instincts have anything to do with it, I suspect we are in decline now. It seems the oil industry is flat out trying to find and produce more oil and has been in that mode for a decade or more. Fields appear to be dying off in unprecedented numbers. For some of you who are so involved in the day to day oil industry goings on, I wonder if you can't see the forest for the trees? Sometimes, if it looks like a duck, walks like a duck, talks like a duck, then it is a duck.
Regards to my favorite site
Well I think I'm right in one sense the total oil production profile will be fairly asymmetric so when production finally begins to decline it will be steep. This is assuming we passed 50% URR back in 1995 and most of the production increases since have been technically driven. But this means the current plateau has two interpretations since we are assuming technology is the driver. First the oil industry simply hit a bottle neck in its overall ability to use technical advances to increase production rates. This boils down to a simple shortage of men and supplies esp since they are on a treadmill and have to effectively exponentially increase drilling efforts. This bottle neck could well be temporary and starting to lift resulting still in a asymmetric peak but with the final decline probably several years off. It really all depends on how fast/long in a sense the technical extraction methods can increase oil production.
Or we have reached the end of our ability to enhance production and given a average lifetime of less than 10 years for a lot of our production we will start to see this cascade of declining production. For example a lot of the smaller fields drilled at the start of this price ramp up are already in decline. Does the oil industry have enough shear technical capability to overcome this and increase production some more ?
So I am pretty confident we will see a very asymmetric profile but its not clear if the current slow down is "the peak" or simply a result of a bottle neck in deployment of advanced extraction methods.
To put it a different way I think we are past 80% URR but we have managed to increase production in the past up to this point its not clear how long we can continue to do this. Can we keep throwing technology at the problem and actually increase production to 90%+ ? Given past performance this is very possible. Which means we see growth for the next 5 years or so. Then a final drop. Or or we at the end now ?
So I think either we soon overcome what ever was holding back production and start increasing again or we see steep drops soon. A gentle decline seem to be out of the picture if its a "technology" problem.
Is this realistic?
Deffeyes says 50% was 2005, for example, doesn't he?
We use ca. 30BBL per year (26c+c), meaning since 1995 we have used more than 25% of all oil ever used, or 13% of URR, meaning we will be pushing 65% by year's end.
Or Deffeyes was more accurate and we are presently under 55%URR, which would help explain why we're still waiting for the cliff.
What are your numbers, i.e. assumptions?
Cheers, Dom
I caught this downthread. Memmel, you're always good for a new definition. You not only deserve JD's rant, but also rants from half-doomers like myself.
We could also call Peak 1991 with Iraq's invasion of Kuwait, 'cause that's where the resource wars began.
Or you could say that Peak was wenn 50% of all oil producing countries peaked - also around 1990? Or you can say Peak was when the inventor of the oil industry, the US, peaked in 1971. At least that, JD, was not a non-event.
When did the West peak? 2000? That was probably the real Y2K..
Cheers, Dom
Sorry I mean real 50% URR. The problem is that technical advances in extraction have decoupled peak production from the 50% URR. The assumption that peak production occurs at 50% URR is probably the weakest part of peak oil theory. Its sensible that peak production will probably occur at some time after 50% URR. Given that production level may not be reliable because of technical advances which have lead to what Simmons calls the SuperStraw effect. You could look at discoveries but in the US they have been heavily backdated leading to extensive reserve growth that has at least in the case of Shell eventually resulted in a serious downgrade in reserves.
So most of our discovery estimates contain enough backdated numbers thats its probably impossible to use them reliably in models such as the Shock Model. Your just basically convolving a projected production number with the current production.
Given that the production numbers are distorted by a undefined technical effect and that discovery estimates are so corrupted by production data esp since the late 1980's its difficult to use these numbers for URR estimates.
However we do have two other sources of information that can be used to ferret out the peak. The water cut paper I've referenced and a intense but un-compiled survey of average field lifetimes and well lifetimes.
The water paper indicates that we have a global water cut of about 80% a conservative estimate of URR using water cut for a region is 50:50. And this is being generous and also ignores declines in gas driven reservoirs. Its also making a allowance for higher recovery factors from more advanced recovery methods. This was reached around 1995 and water cut began increasing about 5 years later in 2000. So from the water cut view we hit a broad peak centered on 1995 and began to decline in 2000.
The absolute value of oil production was influenced by some withdrawal of production around what should have been the peak and economic issues. We should have hit peak production in 1995 at around 70-75mbd and near 50% URR. Globally this was too much oil for the economy at the time and we saw two things happen production was curtailed on one hand but on the other we continued to make significant technical advances in our ability to extract oil.
So why has oil production continued to grow even though we are probably now past 80% depletion ?
Also as far as using water cut M. King Hubbert was a hydrologist.
Superstraw wells and other advanced methods including our ability to find oil give us the ability to extract oil 2-5 times faster than we did with 1970-1980's technology. So this alone accounts for the steady increase in production. The problem is well and field productive live spans have dropped to down to the 10-5 year range and of course fields have gotten smaller. And of course as the price increases has spurred simple physical expansion i.e drilling more wells. Its actually reasonable to expect given our technical advances that we should be able to continue to increase production well past 50% URR yet non of the peak oil modlers to my knowledge have attempted to take into account this "technical" effect.
And last but not least the HL model has been shown to show increasing URR if points around the famous dogleg are included. Increase from technical advances would be buried in the production data but HL can still be used to get a indication of the effect of technology by noting that a increasing URR from HL indicates technical over extraction.
If you have water cut numbers for a region you can use it to restrict the HL method to a time period before you hit 50% water cut so you can be fairly confident that your not picking up on technical upgrades in extraction technology.
Your still getting some but this is balanced by a probably higher recovery factor. A HL plot under this restriction should give something pretty close to the "real" URR.
This can be checked by HL plots using later production numbers and then you actually have a good handle on the technical effect and how much your over extracting. In general you end up seeing that technology has resulted in at least doubling the rate of extraction vs what a symetric production profile would predict.
What this means is that globally we have gotten so good at extracting oil that the production profile is no longer symmetric but will probably exhibit a shark fin like production profile similar to that of most of the fields in production. This is a ramp up period long plateau followed by a sudden steep drop in production past 80% URR.
Now KSA is a interesting case since they chose to water drive most of their fields from the very beginning. Thus even HL may be over optimistic since the intrinsic production profile was probably already asymmetric because of the early use of water drive. West Texas estimates they are at 60% URR and the higher estimates of reserves are around 240 barrels. Given the early use of water drive and the fact that the HL plots that use the earlier better data its more realistic to assume they probably have a URR of 120-160 GB or so so they are probably closer to 80% depleted than 60% esp for Ghawar. Offsetting this to some extent is the fact they have not produced a number of fairly large fields generally the oil from these is of low quality. But they do have a lot of heavy oil thats they can produce and it does not really show up in this sort of analysis since these fields are just now coming into production. So KSA is still a bit of a strange beast by bringing their worst fields online late they will probably get top dollar for their worst oil and still continue to export even after Ghawar and their older fields collapse if they can control internal consumption.
Also note that Al-Naimi was also a Hydrologist that studied at Standford the same time that M King Hubbert was there.
I've been digging for obvious proof that the two met without success. But Al-Naimi's professor Konrad B. Krauskopf and M King Hubbert were it seems close contemporaries and peers. Paula Hatfield dug up this info.
So the key trick seems to be doing what I did and taking into account water production and not just oil production.
And we have one hydrologist that predicted peak in 1995 and a URR of 1250 barrels and from the water profile this looks correct. And another Hydrologist that has worked hard to manage KSA's production. So I'd suggest you follow the water if you really want to know how much oil is left.
My theory is related to Dick's: The correlation is due to market conditions. Price goes up, gives an incentive to increase production, increased production decreases price, decreased price decreases production, and etcetera. Two months would just be the price-production round-trip-time.
Comparing the price curve to the production curve could disprove this theory.
I don't have time for more than quick comments till this evening, but since we seem to have a number of statistically literate commenters here, I wanted to put up CSV of the raw data quickly in case anyone is inspired to make additional graphs or analyses. This is the month name, EIA monthly production, moving average (13 month centered, recursed once), IEA monthly (last monthly figure from Table 3), MA, and the monthly average WTI price.
Month,EIA,MA(EIA),IEA,MA(IEA),WTI
2002 Jan,76.40,76.78,76.38,76.35,$19.71
February,76.52,76.83,76.16,76.41,$20.72
March,76.31,76.90,75.75,76.49,$24.53
April,75.88,76.98,75.21,76.57,$26.18
May,76.72,77.05,76.10,76.65,$27.04
June,76.53,77.13,75.98,76.73,$25.52
July,77.00,77.20,76.50,76.82,$26.97
August,76.80,77.34,76.38,76.97,$28.39
September,77.34,77.50,76.82,77.15,$29.66
October,78.76,77.68,78.75,77.34,$28.84
November,78.87,77.85,78.60,77.53,$26.35
December,76.80,78.04,76.36,77.72,$29.46
2003 Jan,77.32,78.25,77.28,77.95,$32.95
February,79.06,78.50,79.27,78.19,$35.83
March,79.53,78.74,79.42,78.44,$33.51
April,78.49,78.98,78.24,78.68,$28.17
May,78.67,79.23,77.80,78.93,$28.11
June,78.03,79.49,77.56,79.20,$30.66
July,78.90,79.78,78.57,79.49,$30.75
August,79.46,80.08,79.40,79.79,$31.57
September,80.36,80.39,80.11,80.10,$28.31
October,81.29,80.70,80.80,80.41,$30.34
November,81.46,81.01,81.46,80.71,$31.11
December,82.75,81.32,82.09,81.02,$32.13
2004 Jan,82.21,81.61,81.95,81.32,$34.31
February,82.21,81.88,81.62,81.59,$34.68
March,81.99,82.14,82.02,81.85,$36.74
April,81.84,82.40,81.63,82.11,$36.75
May,81.60,82.67,82.06,82.38,$40.28
June,83.58,82.93,83.02,82.63,$38.03
July,84.18,83.18,83.37,82.86,$40.78
August,83.22,83.39,82.79,83.07,$44.90
September,83.79,83.58,83.50,83.25,$45.94
October,84.60,83.75,84.25,83.40,$53.28
November,84.40,83.89,84.42,83.54,$48.47
December,83.85,84.02,84.12,83.65,$43.15
2005 Jan,84.06,84.14,83.40,83.75,$46.84
February,84.44,84.25,83.79,83.85,$48.15
March,84.57,84.35,84.17,83.95,$54.19
April,84.96,84.43,84.47,84.03,$52.98
May,85.38,84.49,84.71,84.10,$49.83
June,84.90,84.52,84.10,84.16,$56.35
July,84.53,84.54,84.29,84.22,$59.00
August,84.85,84.56,84.59,84.27,$64.99
September,84.15,84.57,83.17,84.32,$65.59
October,84.15,84.58,83.47,84.38,$62.26
November,84.89,84.59,84.60,84.46,$58.32
December,84.70,84.60,84.64,84.53,$59.41
2006 Jan,84.53,84.60,84.29,84.61,$65.49
February,84.52,84.60,84.72,84.69,$61.63
March,84.06,84.59,84.72,84.77,$62.69
April,84.38,84.59,85.10,84.85,$69.44
May,84.23,84.59,84.79,84.92,$70.84
June,84.21,84.59,84.98,84.99,$70.95
July,85.54,84.61,86.13,85.06,$74.41
August,85.30,84.61,85.52,85.10,$73.04
September,84.89,84.60,85.22,85.14,$63.80
October,85.13,84.59,85.35,85.18,$58.89
November,84.59,84.57,85.27,85.21,$59.08
December,84.38,84.54,85.11,85.22,$61.96
2007 Jan,84.02,84.51,85.27,85.24,$54.51
February,84.34,84.50,85.50,85.25,$59.28
March,84.11,84.49,85.32,85.25,$60.44
April,84.59,84.48,85.58,85.24,$63.98
May,84.32,84.47,84.83,85.24,$63.45
June,84.50,84.46,84.50,85.23,$67.49
July,84.89,84.44,85.47,85.23,$74.12
August,83.92,84.41,84.56,85.22,$72.36
September,,,85.02,85.22,$75.96
October,,,86.43,85.23,$85.80
Stuart - how about sticking the spread sheet on the server and linking to it?
That would require cleaning it up to a condition where I would be willing to publish it, and that would be work :-)
Can you clarify these numbers? Is the MA(EIA) column supposed to be the average of the previous 3 data points (months)? For example, the MA for April is 76.98 but the previous 3 months are all well below that. Or are you using a different interval? Thanks.
Month,EIA,MA(EIA),IEA,MA(IEA),WTI
2002 Jan,76.40,76.78,76.38,76.35,$19.71
February,76.52,76.83,76.16,76.41,$20.72
March,76.31,76.90,75.75,76.49,$24.53
April,75.88,76.98,75.21,76.57,$26.18
May,76.72,77.05,76.10,76.65,$27.04
Forget it! Answered my own question...
You take the current month, the six months behind, the six months in front (or as many as actually exist) and you average all those with equal weight. That gives you a 13 month centered average with no recursion. Then you repeat the procedure, only applied to the moving averages you just generated, rather than the original data. That second column (the 13 month centered moving average, recursed once) is what I settled on a long time ago because it seemed to nicely capture the trend in this data in a smooth curve well centered in the data.
FWIW, I took the difference of your EIA and IEA data and had Matlab perform a 512 point FFT on it to see if the discrepancy had any major cycles. It did, but the major cycle was the expected one associated with the fact that the IEA data crossed the EIA data roughly in early Jan 06. Doing the same thing on the absolute value of their difference produced a fairly flat spectrum.
FWIW, the linear fit to the last 12 months of (IEA-EIA) differences is a flat 0.69Mb/d. Subtracting that from the IEA figures for Sept and Oct gives 84.33Mb/d and 85.74Mb/d resp., suggesting there's a good chance the EIA figure for Oct will surpass the previous high of 85.54Mb/d.
It'd be nice if it did, if only so people will stop harping on one particular month's data point. The trend is what matters, not the noise - either way.
Stuart, given that OPEC thinks in terms of what their oil dollars will buy from a variety of countries, wouldn't it make sense to show the price of oil in Euros, or as adjusted by a standard currency index?
Wouldn't that be a more accurate way of presenting price, as perceived by sellers?
Here's the time series for Euro/Dollar exchange, from
http://sdw.ecb.europa.eu/quickview.do?SERIES_KEY=120.EXR.M.USD.EUR.SP00.A
Dataset name: Exchange Rates; Frequency: Monthly; Currency: US dollar; Currency denominator: Euro; Exchange rate type: Spot; Series variation
,EXR.M.USD.EUR.SP00.A
,"ECB reference exchange rate, US dollar/Euro, 2:15 pm (C.E.T.)"
2002Jan,0.8833
2002Feb,0.8700
2002Mar,0.8758
2002Apr,0.8858
2002May,0.9170
2002Jun,0.9554
2002Jul,0.9922
2002Aug,0.9778
2002Sep,0.9808
2002Oct,0.9811
2002Nov,1.0014
2002Dec,1.0183
2003Jan,1.0622
2003Feb,1.0773
2003Mar,1.0807
2003Apr,1.0848
2003May,1.1582
2003Jun,1.1663
2003Jul,1.1372
2003Aug,1.1139
2003Sep,1.1222
2003Oct,1.1692
2003Nov,1.1702
2003Dec,1.2286
2004Jan,1.2613
2004Feb,1.2646
2004Mar,1.2262
2004Apr,1.1985
2004May,1.2007
2004Jun,1.2138
2004Jul,1.2266
2004Aug,1.2176
2004Sep,1.2218
2004Oct,1.2490
2004Nov,1.2991
2004Dec,1.3408
2005Jan,1.3119
2005Feb,1.3014
2005Mar,1.3201
2005Apr,1.2938
2005May,1.2694
2005Jun,1.2165
2005Jul,1.2037
2005Aug,1.2292
2005Sep,1.2256
2005Oct,1.2015
2005Nov,1.1786
2005Dec,1.1856
2006Jan,1.2103
2006Feb,1.1938
2006Mar,1.2020
2006Apr,1.2271
2006May,1.2770
2006Jun,1.2650
2006Jul,1.2684
2006Aug,1.2811
2006Sep,1.2727
2006Oct,1.2611
2006Nov,1.2881
2006Dec,1.3213
2007Jan,1.2999
2007Feb,1.3074
2007Mar,1.3242
2007Apr,1.3516
2007May,1.3511
2007Jun,1.3419
2007Jul,1.3716
2007Aug,1.3622
2007Sep,1.3896
2007Oct,1.4227
2007Nov,1.4684
I cant put my finger on it but my gut tells me this is relevant - like perhaps EIA/IEA differ in something they include or one consistent datapoint/country is causing the variation- how could the residuals be so much closer than the actual series??? Something fundamentally explainable underlies this observation....Though I can't explain it...:)
I think the straightforward explanation is in the nature of the idea of "noise". If the noise is errors in reporting accuracy, you wouldn't expect correlation. If the noise is variation out in the real world (fields being opened or closed, maintenance, variation in arrival of deliveries, etc), then you would expect the two reporting sources to be very close to each other, much closer than to a moving average.
I would note that Stuart guessed that the "residuals" agreed more closely than the trend lines, but didn't do the analysis. 87% is pretty high, and it looks to me like the R2 would be lower for the two series of "residuals" (I use quotations, because they're not true errors, as noted above).
87% is the r2 between the two residual series (residual to the moving average, that is). The r2 of the two underlying series would be higher, but that's because they aren't stationary, so it would be somewhat spurious. A better comparison might be the root mean square differences. The RMS difference between the two moving averages is 0.42mbd over Jan 2002-Aug 2007. The RMS difference between the unnormalized residuals is 0.32 mbd. So the residuals do agree moderately better than the trend.
Hmmm. Ok.
Well, you would hope that both the trend lines and the residuals would agree. That the residuals agree reasonably well makes sense - the puzzle is why the trend lines don't.
As you note, the difference suggests something systematic.
It suggests to me that the differences between the two series are systematic - something(s) is(are) being systematically included/not-included or counted differently month after month.
What does this mean in the grand scheme of things? Is the IEA fudging the numbers to intentionally give the impression that oil production is increasing, while in fact it is simply bio-fuel surges or tankers being offloaded?
I don't know the reason for the discrepancies.
Might I suggest that someone take the month in the last two years with the biggest discrepancy and analyze where it comes from? Then you can check to see if that country or countries repeats as the source of the difference. Venezuela for instance. There was a time when the IEA changed how it counted their different crude sources and everybody that counts seems to have a different idea of how much Venezuela produces every month. It shouldn't be that hard to isolate.
CG - that sounds like a good place to start - do you have time this evening for a little sleuthing???
Sorry, I've got to get to bed. When I posted earlier I didn't have my spreadsheets. That's why all the guesses and rough numbers.
I refigured this one last month. I've known the answer for at least a year. I've already done my sleuthing. SailDog posts an xls on IEA. It's pretty good. Although, I might venture there are some errors.
I thought you TOD hotshots would be more help. Tell me when you work it out. We can compare answers. Darwinian looks like he might know what he's talking about, too.
No just that they differ its neither good or bad.
I suspect the error is actually worse since most oil produces have quite a bit of tank storage to handle production problems . So you have a lot of storage on both sides of the equation and a lot of tankers in transit so the amount of oil in transit any one month is itself a big number.
What we don't know is the status of storage in the producing countries. But in general you pretty much have to give the numbers 9 months 6 months to ensure that its not a draw down of storage somewhere and and additional 3 to ensure that the decline is not from some storage being filled in a producing country and maybe storage being drained in a consumer country.
Spot WTI prices might give a bit better idea of what the current situation is like and so far they seem to be increasing even though we have not seen big changes in oil supply to justify the increase from a supply side.
Yet...
May/June is going to be a important time. If they are drawing down storage now and don't have serious real production increases then eventually by then we will see the truth.
If memory serves, didn't we say that 6 months ago??
Yes and we did get a unprecedented increase in prices. So in a sense we past milestone one of peak/post peak. The next step is seeing a real decline beyond the noise level so 2-4 mbpd and probably just as important the decline rate.
Think of it this way the oil supply can't stay in balance either price and other forces etc are going to eventually result in a increase small but significant or we are going to see a decline. I can't imagine us able to continue this balance given the forces at play.
If we do manager somehow to stay on a slowly decreasing plateau I'd be surprised. I think we have already started on a steep decline in oil production that started late last summer.
By steep I mean about 200-400kbd losses in real production each month. But given the number of buffers and variance in the system we won't know until this builds into a 2mbpd or so decline which takes almost 10-20 months. One time events like new heavy oil increments from KSA and blow down of gas caps could easily distort even this steep of a decline rate for a few months.
Thats why the spot price which indicates crude availability this month vs oil production numbers which have a large error term indicates to me that I may be correct. But we simply won't know until the numbers we get are greater than the error. Also of course we are hitting the spring which is traditionally slow.
Look at it this way assume Iran quit producing oil and simply drained its storage facilities. It could take 3-4 months before it had a big impact on overall stocks in the OECD countries and a few more months before gasoline supplies are affected thats the sort of lag you have between the well and final delivery. So even this super doomer recognizes that my steep decline concept will take a while to percolate through since current production is up to six months behind.
Btw unless I read this wrong the claim that tanker rates are increasing does not seem to be true.
http://shipping.capitallink.com/
A link to some Saudi storage.
http://saudinf.com/main/y5406.htm
And 1991 says they have 60 million barrels of storage.
http://query.nytimes.com/gst/fullpage.html?res=9D0CE7DC1538F937A3575AC0A...
So even this they could do 1mbd for 60 days from storage alone. So I'm guessing that once oil is pumped it spends 30-90 days in storage/transit and a bit more in finished product form before its actually used.
Btw unless I read this wrong the claim that tanker rates are increasing does not seem to be true.
http://shipping.capitallink.com/
I'm not sure what you are saying here, but I think you are skeptical about tanker rates increasing. If I am wrong, then nevermind.
Tanker rates are currently flat. For the last two days. Previous to this they spiked in almost unimaginable fashion for two to three weeks.
Go to the link you provided. The Capital Link Shipping site. One of the best.
In the left-hand upper corner is a graph with a list of graph links below it.
Click on the one that says BDTI(or Baltic Dirty Tanker Index) These are the "TD rates" 14 or 15 of them I think in the index. Gulf to Asia VLCC, Gulf to US Gulf VLCC, West Africa to US Suezmax, Carribean Aframax, etc.(the most important routes).
If you don't understand rates Worldscale rates or routes or ship classes, try this site or wikipedia:
http://oiltankers.blogspot.com
It is now at about 1500 I think. It was 1000 three weeks ago. If you have computer skills you can download an image of that graph for 3 months, six months, 2 years, whatever and then post it here.
I think it would be interesting to see a retrospective look at the EIA and IEA production forecasts for one, two and three years forward, vs the actual production during those years over the last ten years.
This focus on production puzzles me for the following reason:
Oil producers and exporters are not required to "produce", in other words extract from reserves, 100% of what is possible to extract at any given time. For production figures to be in any way relevant, there must be a strong linkage between the amount of oil present in the ground available to be extracted and the amount of extraction which takes place.
For any reasonable prediction of the timing of "peak oil" which isn't a wild-assed guess, you need to know how much oil is in reserves and is extractable from those reserves at a cost of, say, less than one barrel of oil for every two barrels extracted, and you need to figure in the effects of using enhanced oil formation characterization and extraction technologies in making these estimates.
If I were in charge of oil extraction in KSA, I'd be telling the world that I was extracting as much light sweet crude as I possibly could, and making offers to substitute heavy crude for light sweet crude to make up deficits of extracted oil which enters into the supply stream for refineries. At the same time, I'd be holding back as much light sweet crude from extraction that I possibly could. KSA has only one exportable asset, aside from Islam, and that's light sweet crude. If KSA knows that their supply of the stuff is finite and depleting, they would be fools not to keep as much as reserve in possible, against the day when prices ramp sharply upward. I'd be looking at walking the thin line between maximizing prices for KSA light sweet crude on one end, and on demand destruction from various sources (pump prices, conservation, efficiency, alternative fuels) on the other. I think that this is what they're doing, and they have the market trading in a range which is acceptable to them, and which is acceptable to the US as well.
If I were KSA, I'd also be looking at buying up hard assets in other countries as well. Of note in this regard is the fact that Abu Dhabi recently bought one of the oil sands companies in Alberta, Canada, Penn West, in a deal which effectively limits participation in the resultant limited partnership to Abu Dhabi nationals. It would be interesting to see if KSA made any moves, either outright or through nominees, to do this kind of thing.
Things are not that perfect. They have been working for a long time to also get a premium price for Arab Heavy and they would obviously rather sell that first. They recently caved in on price. On thing that is certainly true is the world is short refining capacity for the worst grades they have to offer. And they want other people to build the refineries to refine this crude and buy it at a premium price. They just recently caved in on the pricing.
So there is some truth to what your saying. And some truth to the Saudi statement that refining capacity is a problem if you add on the rest of the sentence for our heaviest sour crudes.
The US which is the largest market seems to have met the Saudis half way to some extent and upgraded a lot of our refining capacity to handle the heaviest high sulfur crudes.
And we have seen a steep discount so the two together gets the US some cheaper gasoline for a bit longer. It could well be the reason that gasoline prices are not tracking as high as they normally would with WITI since we have in effect a pretty nice discount. The problem of course is that even with the spread the refineries don't seem to be making much if any money so its sort of a last good will gesture to the American consumer.
This actually brings up a interesting situation. If the Saudis are now selling more and more heavy oil at a discount to WITI then they need the price of oil to be quite a bit higher to make up for the shortfall in light sweet capacity.
This would imply a probable drop in production from Ghawar.
So if they are down to heavy sour they may need quite a bit higher spot price to get the same amount of money because of the spread. A lot of producers could well be in this boat depending on the quality of their oil and the discounts.
Now previously the problem was no one would even buy the stuff.
The Venezuelan crude is all heavy sour, and I think the same case holds for the newly-discovered Jack field in the Gulf of Mexico, so it makes sense that US refineries would be adding capacity to refine heavy sour crude. If the US ever withdraws or is forced to withdraw from Iraq/Afghanistan/Iran(?) I'll bet the supply of light sweet crude from that part of the world ends up in Chindia, by hook or by Chindian troops moving in to take over US bases...
Incidentally, the new Petrobras discovery off the coast of Brazil is claimed to be between 5 to 8 billion barrels of *light sweet* crude...
I still think by 2012 we'll see some sort of gasoline rationing start up in the US. I think a lot of our gasoline use is not discretionary, it's built in to the design (lack?) of our cities and transportation infrastructure
Actually a good bit of the crude purchased in the US is heavy and a good bit sour. For the US at least I've never quite understood the claims of not enough heavy sour refining capacity but I tend to believe they must be true.
A oldie but goodie.
http://www.gasandoil.com/goc/news/ntn44964.htm
Now that its 2007 one has to imagine that heavy sour refining capacity has been expanded. I can buy that it was a problem in 2003-2004 but its almost 2008 now.
Being the doomer I am I think refineries are reluctant now to do a lot more expansion in sour crude capabilities until the see significant increases from KSA. At the moment refinery margins are low to non-existant which indicates that we have plenty of refining capacity.
This give a nameplate of 17,443,492
http://www.eia.doe.gov/neic/rankings/refineries.htm
Our total oil usage seems to be 15-16 mbd. Finished products makes up the difference to get us to 25mbd.
So dunno looks like we are importing more oil than we are probably using at least in 2006.
And whats weird is it seems we are actually loosing refining capacity.
http://tonto.eia.doe.gov/dnav/pet/pet_pnp_unc_dcu_nus_m.htm
But looking at the history.
http://tonto.eia.doe.gov/dnav/pet/hist/mocleus2m.htm
In general we have seen a steady increase in refining capacity overall and I'd assume extra heavy sour was added.
Its a bit weird that people are claiming refining capacity problems since I don't see any real changes outside of slow increases since the 1985 start date.
Same for utilization seems to be no real trends.
http://tonto.eia.doe.gov/dnav/pet/hist/mopueus2m.htm
So dunno.
More old data
http://www.apachecorp.com/Explore/Explore_Features/200601/Topic_Report_I...
However and sorry for all the links this is interesting.
http://www.seekingalpha.com/article/34390-implications-of-valero-s-refin...
The only reason I could see Valero doing this deal is because the expect excess refining capacity esp for heavy sour.
Valero seems to be prescient concerning oil. I've noticed they seem to make moves which makes me think they are very peak oil aware.
Some ideas from a novice. You covered this, but I'll put it in simple terms. If 3 month averages are used there probably won't be a new peak when we look back in a few months. Using one month is arbitrary. If we used one day production we would really have variation.
MORE IMPORTANT, if someone graphs EROEI from liquids, we probably peaked a long time ago, especially if biofuels [negative EROEI] and oil sands [EROEI stinks] are included in liquids. Even if we use just energy produced in the liquids, as opposed to volume, we peaked long ago. If someone can give me estimates on these 2 it would be useful to me. I know that this stuff is hard to graph as the data are not readily available, but some of you have the knowledge and brains to make estimates and graph them. That would be useful in clarifying the reality -- we are sliding down the oil/energy curve and headed for terminal depletion. The reality is that we peaked on energy production. Who cares about volume? Maybe the energy peak is 2004 or earlier. Please someone could do some nice graphs on this stuff. I did some work for y'all, not fancy, but you may find some interesting stuff here (soon to be updated): http://www.peakoilassociates.com/POAnalysis.html
I think whats more important than peak oil is what our decline rate is. If its a very gentle slope or "undulating plateau" over decades say varying by 4-5 mbpd and oil exports hold up
(export land slows down) then we can transition our society.
Just about anything less then this probably leads eventually to some pretty serious dislocations.
Right now the chances of a serious increase in oil supply 1-2mbd per year is looking pretty dim so its probably more important to look forward and figure out what our decline rates might be.
Most of the scenarios have us in a tight spot within 5 years given WT export land model even with a slowly increasing supply. So almost regardless of the model used the economic effects are pretty much the same its simply a matter of say 5 years or so between models given export land.
Expensive oil in short supply is thus practically certain now and worse its not clear that we have all that much time left to move off oil. The focus on peak is actually a detriment IMHO.
If "we peaked long ago", then peak oil was a total non-event. It had no ill effects, even on the economy.
That liquid energy peak may have reduced otherwise stronger economic growth; it certainly is having an impact on oil company profits; and the cost of natural gas will be higher than otherwise due to natural gas use for oil sands production.
If you go off of water cut and put peak at 50% water:oil then we peaked in 1995 by 2000 water cut started to increase fairly quickly this in this link.
http://www.touchbriefings.com/pdf/2590/Ferro.pdf
So we where heading downhill already by 2002 even though production was still increasing. The expansion of our monetery supply closely tracks water cut.
http://en.wikipedia.org/wiki/Money_supply
Pure supply

Vs GDP
Pretty wild IMHO this supply vs GDP.
In any case we have staved off the effects of expensive oil by robbing peter to pay paul to the point that our monetary system is on the very of collapses. By inflating like mad we have staved off the effects of peak oil at the expense of eventually collapsing the system via defaulting debt.
Needless to say considering I think we will fact a steep drop in oil supplies I just don't think that this situation is by random chance. In this case the cure may well have been worse than the disease.
scratches head concerning graphs...
I believe there's a point worth making, if anyone has done so above I apologize, but I can't go through all the comments. October 2007 presents the highest residual since the Summer of 2004, the time when supposedly OPEC hit it's practical celling. Higher residuals are present only during times of clear production movement.
Running this analysis solely with the IEA data from that time onwards presents October 2007 as a clear outlier.
Personally I'm waiting for the EIA C+C number for October and the IEA number for November (all liquids) to reason upon this.
What really has to be done is to calculate the differences between EIA (IPM) and IEA (OMR) data country by country and then analyze trends. For Saudi Arabia, for example, the IEA - compared to the EIA - underreported production in 2005 but then started over-reporting. A linear trendline starts at -130 kb/d in December 2004 and ends at +120 kb/d in August 2007. The R2 value, however, is only 0.31, suggesting a lot of noise, but an upward trend is certainly visible.
There are other countries where the difference trend is flat, for example in the negative (Nigeria, Qatar); in UAE the trend is not linear, peaking in the first half of 2006.
As a trader and investor I have to often come up with working explanations to get me across certain stretches of time. I run portfolios (I call them jokingly "operations") that are geared for both the near, medium and long-term. I'll just chime in then and say that the uptick we saw in the last IEA Paris number is one I have accorded to increased production from--gasp--Iraq. The Iraq explanation therefore is a working explanation for me until some other idea crosses my screen (like this post from S.S.). Until then, Iraq works for me doubly because they have alot of latent/ready production while at the same time they're a war zone. It's a perfect candidate therefore to be the culprit behind volatile data, kicked out to the several global tracking agencies.
Gregor
Well, I may be naïve and simple-minded, but...
OPEC would dearly love us to believe they (still) control the world oil supply. They had agreed to raise their "quotas", and, more importantly, their actual production, by half a million barrels, to meet rising demand.
And, hey presto, the IEA data shows something like the extra half million barrels they promised.
* Is it all smoke and mirrors? Possible, but not necessary.
* Are they pumping down their storage? Perfectly plausible, and obviously not sustainable.
* Are they temporarily boosting production by all available means? The big jump in NGL (about a quarter of the increase?) would suggest a concerted effort... Is this sustainable? Are they producing more gas? (how much more gas is needed to produce the extra NGL?) or stripping liquids and re-injecting dry gas? It doesn't seem likely to be a sustainable increase.
* Did they get lucky with a windfall increase in production from Iraq? Seems likely... or maybe OPEC negotiated with some insurgent groups and paid them to protect some pipelines? (This would actually make a lot of sense, and suggests an exit strategy for the US...)
In sum : OPEC is putting on a Christmas pantomime to reassure the anxious oil consumers. They are currently meeting, and pretending to consider a further half million barrel increase. I confidently predict that they will opt, instead, to maintain the current output level (i.e. that they are utterly incapable of producing any more).
For the moment, it has worked a treat... spectacular drop in the oil price. The illusion that OPEC can just open the taps and make everything alright has survived...
Can they pull the same stunt again? I think not.
Actually I think KSA has more heavy oil capacity but I think they are concerned about prices. The heavy oil sells at a fairly steep discount so KSA would like to see higher prices to offset the discount. I think your right that at least in this meeting the probably won't increase again. But I think they still have some more spare heavy oil capacity that could be turned on later once prices are higher.
My best guess is they will turn this on once prices are north of 100 dollars. More important than oil is how many refineries are upgraded to handle the heavy sour oil from KSA. I think for the US this is also linked to the availability of the heavy Mexican Crudes and tar sands. The problem is once you get to the situation that we seem to be in that a lot of the oil is difficult to refine KSA is actually technically correct about lack of refining capacity at least for heavy sour crudes.
What we lack is clear information on the ability of refineries to handle new increments of heavy sour crudes.
The crucial point is, that it seems that they really had to pull all the stops out to produce an extra few hundred thousand barrels per day of the sweet stuff. I am especially intrigued by the NGL increment.
As far as I know we did not get any more "sweet stuff" from KSA. If some of the production increase was sweet and its down around a few 100 kbd then its impossible to tell where it came frome storage new production increment etc until it lasts for over six months.
http://www.peakoil.com/fortopic34425.html
So given this new data point what would be the probability of another data point outside the 97th percentile: 0.36*0.36 = 13%. How about a third: less than 5% probability. So should this occur it would convince me that production is in fact increasing. Unless the numbers are revised of course later or OPEC has the ability to make it look like more was produced (as some posters have suggested). How much control do they have over the total number? At some point, however, like the accounting shenanigans of the banks and subprime lending, Enron, Boston Market, and countless other companies, it would have to come crashing down.
That's the chance of getting one of those data points in two different sets of 24 data points.
If November's production is as high, we'll have seen two consecutive data points with unusually high residuals within the span of 16 data points (since we're only interested in finding a new high value, we only use data since the last one).
Discounting correlation, that'd be 15x14/2x0.97^14x0.03^2 (15x14/2 places to put those consecutive months in the last 16 months x the probability of any one of those combinations), or about 6.5%. If we hackily correct for correlation by reducing the residual value by 40% of this month's, we get a new residual of 0.72, which is at the 13% probability level (stdev = 0.648); using that instead of the second 3% gives a value of 25%.
Of course, that's using a standard deviation for the residuals derived from the last 5 years. Over the last two years, the standard deviation is much lower - 0.433 - which makes the associated probabilities much lower - 0.5% and 7% resp. - for a total combined probability of 0.2% (basic) or 3% (corrected).
So if November's production figure comes in like October's, that'd be quite strong evidence that it wasn't just noise.
(Of course, just reading the news could have told us that; these aren't wholly random data points, after all.)
Unfortunately, few people will see these posts because they are so far down the thread and so relatively old in blog-time. But don't underestimate the probability of the right people understanding their brilliance. Keep it coming, Pitt. Thanks again.
Absolutely.
However, the moving average of oil supply was stable this year - and higher than last year - even before the recent OPEC production increases (which we know from multiple sources were substantial). That in and of itself practically guarantees that the moving average will start increasing again, at least for the short term. Even if production immediately drops back to average (85.23Mb/d), the 13-month simple average will increase to an all-time high of 85.33Mb/d over the next year.
Production hasn't dropped like that, though - tanker rates have shot up, and all indications are that OPEC shipped more oil in November than they did in October. A second data point like this one will pull the (simple) average up to 85.33 immediately, and up to 85.41 over the next year, even with production in December and beyond falling back to 85.23Mb/d. So the available evidence strongly suggests that oil supply is growing again.
And that's exactly why prematurely calling a peak is counterproductive.
Instead of focussing your energy on the important questions - like what is the best way to get society to move towards sustainability - your time and energy is focussed on whether or not one noisy data point is statistically higher than another noisy data point.
Either way, it does not matter.
Oil supplies are tight, technology exists to move away from oil, the sooner we start the better. The minutia of whether this month of this measure of oil is statistically higher than this other month makes no fundamental difference.
That's not the question; the question is, "given the previous highest value, what are the odds of seeing a higher value within 15 months after it?" This is important since July/06 also had a large positive residual (1.07Mb/d over trend).
Seasonal variation.
Take the three-month centred average of the residuals at each month, and then average the averages for a given month from each year (i.e., Aug from all years). You'll find that the winter and spring residuals tend to be positive and the summer residuals tend to be negative (for the IEA, at least).
If you compare that with how demand changes over the year, you'll find they match up just about perfectly, and that a two-month lag often shifts the data into a different season, and possibly over into a different demand regime (e.g., summer maintenance vs. winter heating).
Similarly, the difference between the IEA and EIA figures tends to grow in the spring and shrink in the fall, which perhaps has to do with their methodological differences.
Give it a rest!We don't know.From where I sit,OPEC Nov prod may be up only 100m bl/da over Oct/07.Decline of 600m bl/da for UAE barely matched.Looks like some fields for UAE will be out a couple more weeks.Different methods and starting dates by tanker trackers has caused confusion.Gulf tanker rates have shot up because of Frontline taking tankers out of circulation rather than more crude avail.Besides, with Brent at a prem to WTI and prod prices holding their own thing are not that bad.ST bottom likely today or to-morrow.(may have to wait for stats/OPEC).
Cheers!
Except that given the forces on the oil market higher prices leading to more drilling and depletion a plateau is not a stable condition we are either going to clearly go up or clearly go down at some point. So its not a bad thing to over analyze each months data as long as you recognize thats whats happening. For me at least my belief that we are well past peak and production increases since 1995 have come from advanced technology not more oil means that we will have a very asymmetric production profile. So instead of a gentle decline we will see a plateau and sharp drop. The problem is trying to figure out when this would happen is maddening if its possible at all. So I'm also over analyzing looking for a clear signal. Given technical factors I've pretty much concluded that peak with a gentle decline now is not possible. Either we have have a slowdown in production growth for above ground factors that will be cleared and production will continue to grow well past 90mbl's a day with peak later past 2010 or my sharp decline model is correct. I believe the symmetric production models that predict peak now are incorrect. This means that I expect given the variation in the data to see at some point a fairly sharp turn in one direction or the other.
We have IEA telling us otherwise.
We have OPEC telling us otherwise.
We have tanker trackers telling us otherwise.
We have tanker prices telling us otherwise.
These have been covered pretty extensively here, so at this point, it's up to you to provide evidence for your counter-claim. For example:
That's the kind of thing that would be useful to know, if you had evidence it was true. Especially considering that major analysts disagree with you.
Besides, you've totally missed the point:
Posted here last week about Frontline.Most analysts I know are lazy and spend too much time talking.Their research ast don't do a thorough enough job before passing up the latest stories.Lloyds has best tanker info but is late.I trade for a living so I have to cut through a lot of noise.Yes I agree with you,things are tight.You could say the $10 drop this past week has eliminated any war/outage prem!The last useful piece was Nov 19 by Staniford on accelerating Base prod decline.I rarely post because I don't have time for this kind of debate.I will pass on a few crumbs once in a while though.
Saying you posted something isn't evidence. For all I know, you just baldly asserted it with no support last time, too.
That acceleration was almost certainly an artifact of his assumptions, namely that full production starts instantly. If you use realistic production ramp-up times from real projects, you get about a two-year delay, and suddenly the acceleration entirely disappears. (The details are in the comments to that story.)
You could say all kinds of things; saying them doesn't make them true. That's what evidence is for.
Ah, so your argument based on the production profile of a single field has now become "almost certainly" true, huh? That's a pretty low standard of evidence ya got going there.
You've misread.
I'm saying that your argument - which is based on an assumption that you know to be false - is almost certainly wrong.
That's sentence one.
I'm further saying that replacing your incorrect assumption with a production profile derived from the real-life experiences of a major project as well as the production graph you supplied for a second major project completely explains the anomaly.
That's sentence two.
So what's "almost certain" is not that my production profile is correct; it's that yours is not, and hence that your conclusions derived from it are not either. The production profile you've assumed completely fails to match the production profile of two recent, major, real-world projects - that's strong evidence indeed that it's an unrealistic production profile.
As for mine? Well, it directly fits those two projects, but that's because it was based on them. It also results in entirely-sensible results when applied to the data - roughly constant decline rate, which is what we'd naively expect. Accordingly, that's decent evidence that it's not too far off the mark.
So are your model and conclusions wrong? Almost certainly.
Are mine right? They're probably close.
Is decline rate mysteriously accelerating? Almost certainly not. There's no physical basis for it, and that result only comes about after applying an unrealistic assumption to the data.
I completely disagree, but don't see much point in further arguing the point until we have a better megaprojects list.
About which part?
That your assumed production profile is unrealistic? It doesn't fit the observed data.
That your conclusions are wrong? Well, they're based on an assumption that doesn't fit the observed data, and they produce a counter-intuitive result that is lacking a physical explanation. Why would decline rate be rapidly increasing? By what mechanism?
That my assumed production profile is better? It does fit the observed data, so it's more realistic, but it may or may not be good enough.
That my conclusions are right? They're based on an assumed production profile that fits the observed data, but hasn't been extensively tested. The result is entirely consistent with what one would expect, though.
So which part(s) do you disagree with and why? I think there is still value in examining how sensitive the argument is to different assumptions, and in examining what are reasonable assumptions about production rates.
As I said - I'll respond after I've gotten better data with which to assess the situation.
http://www.seekingalpha.com/article/18512-frontline-s-dividend-yield-tan...
This is from 2006 but the point is its about Nov-Dec.
I'd have to see historical averages to see if the current increase in tanker rates are unusual. From this article I'd assume that the conditions that existed in 2006 probably exist now.
http://www.forbes.com/feeds/ap/2007/12/04/ap4403691.html
Frontline at least does not seem to be doing well right now.
Which no doubt explains why you expended your time and energy commenting on it...
The reason I chose to put some of my time on it was because a number of people prominently commented that this data point meant something new and significant was happening (and by implication, perhaps peak is later, and perhaps taking action is less urgent). I wanted to explore whether they were right, and once I had concluded that they were at least premature in drawing the conclusion, point that out.
Finally, "Instead of focussing your energy on the important questions , like what is the best way to get society to move towards sustainability"
Actually I have written about that quite a bit, and will continue to do so. Feel free to also devote your time and energy towards it instead of haranguing me :-)
Has the IEA's data collection process changed recently?
I have discovered several times in my career (bond markets) that an economic survey question or data set method got changed and created some significant additional noise.
The JODI newsletter on IEA mentions an expanded questionnaire, but it doesn't sound active; looks like a beta test being run in parallel.
http://www.iea.org/Textbase/stats/jodi/jodinewsletter.pdf
I don't even know if the IEA collects their data through their linked table formats at all, or if they get their info from another method or source. Can anyone shed additional light?