TWIP (This Week in Petroleum) 12-19
Posted by nate hagens on December 19, 2007 - 5:41pm
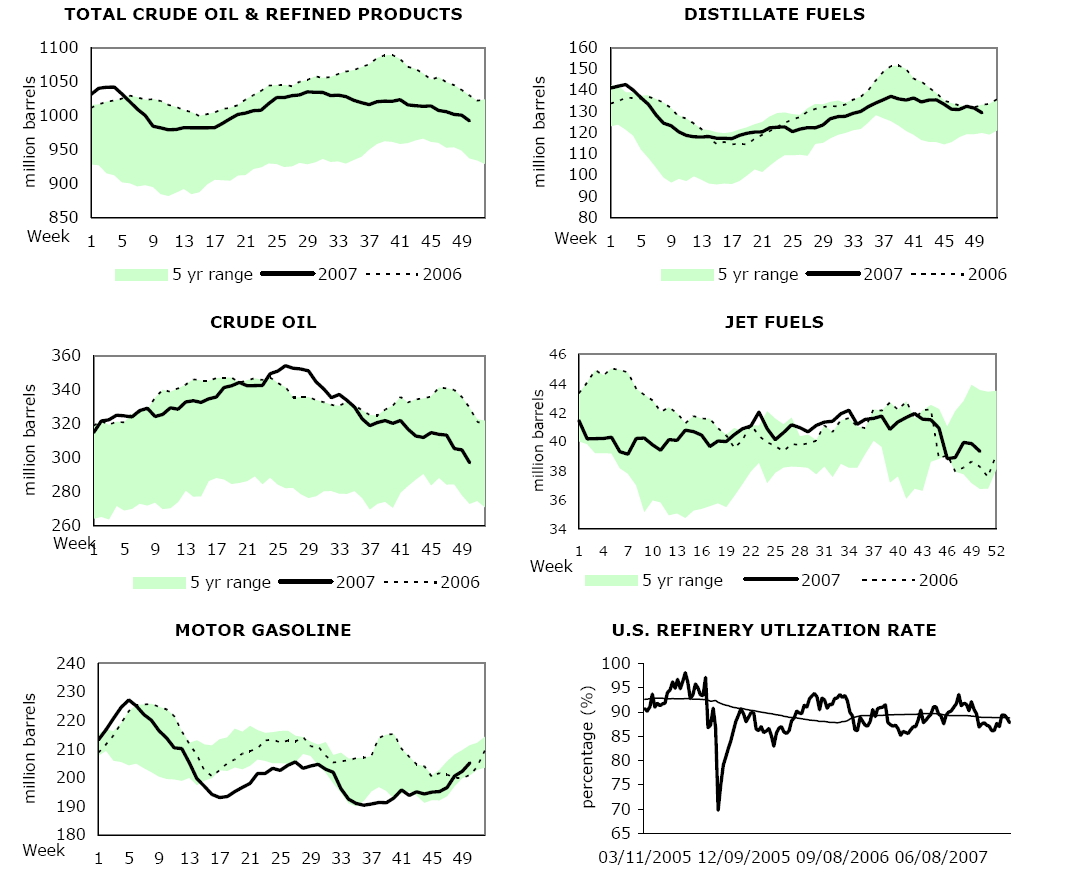
Here is a link to the DOEs This Week In Petroleum. US crude inventories fell 7.6 million barrels. Consensus was for a drop of 1.5 million barrels. Total gasoline inventories rose 3 million barrels, much higher than an 800,000 expected rise. Implied gasoline demand fell .7% relative to the previous week. Crude oil, after trading as low as $89.70 for Feb delivery, rallied $1.50 to close at $91.70. The text, and some graphics from Lehman Brothers research report are below the fold:

Released on December 19, 2007
(Next Release on December 27, 2007)Waiting for the Goods to Arrive
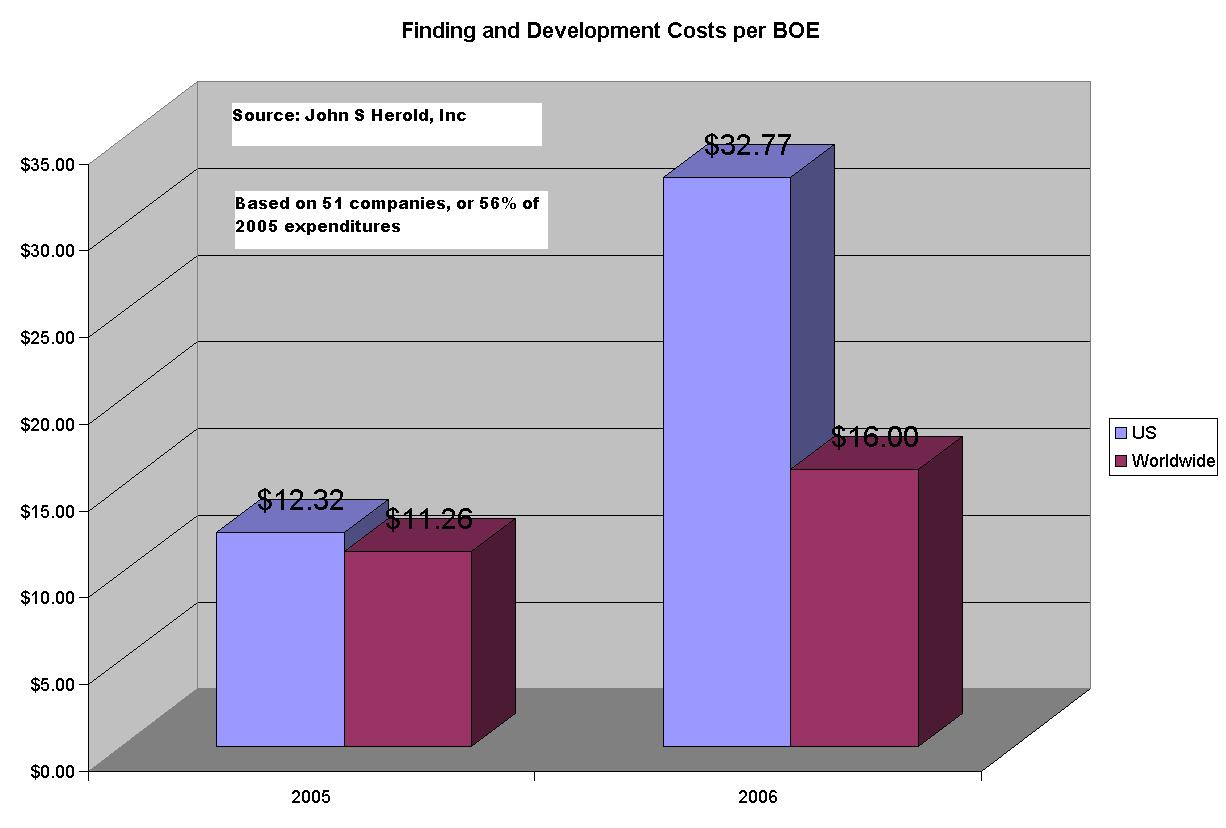
The internet has made holiday shopping much more convenient. From the comfort of their homes, consumers can do lots of research, make their decisions, put up the money, and then simply wait for the goods to arrive on their doorstep. But anxiety can increase as the holiday draws closer and consumers begin to wonder if the goods will arrive on time. Oil companies are also out shopping. They do a lot of research, make decisions, and put up billions of dollars in the search for oil reserves that they can then produce and sell. While consumers can be fairly certain that their goods will arrive, even if a few days late, oil companies are much less certain about being able to turn their exploration and development investments into producing reserves.Much has been made about recent increases in oil company profits. Profits have increased sharply in the past five years, greatly increasing the amount of cash that companies have available for investments. At first, companies were hesitant to invest. The projects they invest in are multi-year, multi-billion dollar endeavors and decisions are not made quickly. If companies feel that increased profits may be temporary, they may be wary about increasing investments. But starting in 2005 and continuing through 2006, companies significantly increased spending. As the figure below shows, expenditures to find and develop oil and natural gas reserves in 2006 by the major U.S. oil and gas producers that report to EIA’s Financial Reporting System (FRS) were more than 60 percent higher than in 2004, even after adjusting for general price inflation. (See Performance Profiles of Major Energy Producers 2006 for more details on expenditures and reserve additions by companies that report to the FRS.)
Recent Increases In Exploration and Development Expenditures by FRS Companies Have Not Provided a Corresponding Increase in Reserve Additions
However, to date, the big increase in spending has not resulted in significant increases in reserves. In fact, reserve additions (measured in barrels of oil equivalent) for the FRS companies in 2006 exceeded only two of the previous 17 years. There may be several reasons for the delayed response of reserve additions. It sometimes takes years from the start of exploration before oil is discovered and then designated as “proved” reserves. Also, higher costs for raw materials and drilling rigs mean that some of the additional spending went into just maintaining what companies were already doing. In the next few months, oil companies will report their 2007 reserve additions and we may start to see some results of the higher expenditures. Oil markets are anxiously waiting for the goods to arrive.Residential Heating Oil Prices Set New Record High
Residential heating oil prices resumed their upward course and reached a new record high during the period ending December 17, 2007. The average residential heating oil price increased by 3.5 cents last week to reach 329.4 cents per gallon, an increase of 85.0 cents from this time last year. Wholesale heating oil prices jumped up by 10.3 cents, reaching 268.0 cents per gallon, which was an increase of 89.0 cents compared to the same period last year.The average residential propane price increased by another 1.6 cents to reach 248.7 cents per gallon, notching an eleventh consecutive record high. This was a gain of 50.9 cents compared to the 197.8 cents per gallon average for this same time last year. Wholesale propane prices rose by 3.1 cents per gallon, from 158.0 to 161.1 cents per gallon. This was an increase of 54.6 cents from the December 11, 2006 price of 106.5 cents per gallon.
Average Retail Gasoline Price Drops Below $3 a Gallon
The U.S. average retail price for regular gasoline dropped below $3.00 a gallon for the first time since October 29. Following the fifth consecutive week of reduced prices, the average totaled 299.8 cents per gallon as of December 17, 2007, 0.2 cent lower than last week but 67.8 cents above a year ago. All regional prices decreased except for the Midwest where prices advanced 4.8 cents to 294.3 cents per gallon. The East Coast was lower by 1.4 cents to 301.7 cents per gallon. The Gulf Coast weakened 2.6 cents to 285.0 cents per gallon, the lowest regional price. The largest drop occurred in the Rocky Mountain region where a 4.2-cent reduction sent the price to 296.6 cents per gallon. The West Coast continued as the highest regional price, dwindling 3.9 cents to 320.5 cents per gallon. The average price for regular grade in California tumbled to 328.5 cents per gallon, 4.4 cents less than last week but 72.4 cents per gallon more than last year.The retail diesel fuel price declined for the third straight week, falling 1.6 cents to 330.9 cents per gallon, but still 70.3 cents higher than last year. Regional prices were down across the country with the East Coast decreasing 1.3 cents to 335.9 cents per gallon. The Midwest logged the smallest decline, a half cent, to dip to 327.1 cents per gallon. The Gulf Coast price was reduced by 2 cents to total 324.5 cents per gallon. The Rocky Mountain region price plunged 7.8 cents to 331.9 cents per gallon. The West Coast sunk 2.5 cents to amount to 341.5 cents per gallon. California prices slipped 2.9 cents to fall to 342.6 cents per gallon.
Propane Inventories Sharply Lower
The cold temperatures left behind following the winter storm that swept through the Midwest and Northeast last week continued to impact propane inventories that showed primary supplies of this fuel dropping sharply by over 1.6 million barrels. As of December 14, 2007, propane inventories stood at an estimated 57.9 million barrels, a level that continues near the lower boundary of the average range for this time of year. The Midwest region posted the largest weekly decline last week that measured 0.7 million barrels, followed by the Gulf Coast with a drop of 0.5 million barrels. During this same time, East Coast inventories fell by 0.3 million barrels while inventories in the combined Rocky Mountain/West Coast region moved down by 0.2 million barrels. Propylene non-fuel use inventories also moved lower by more than 0.2 million barrels last week, but accounted for a higher 2.9 percent of total propane/propylene inventories compared with 2.4 percent from the prior week.
In pictures, from Lehman Brothers:
Revisiting this graphic again,
are there any other potential explanations why costs on finding and developing reserves are escalating but resulting in fewer reserve finds in the headline graphic? I suggested some here (points #6 and #7). At what point do we reach energy break even on the marginal barrel in USA? 25 years? 10 years? 2 years? This chart is almost a year old already....
Contact
- Content: editors at theoildrum dot com
- Tech support: support at theoildrum dot com
License

This work is licensed under a Creative Commons Attribution-Share Alike 3.0 United States License.
Days Supply of Crude and Distillate is really getting hammered now, compared to last year's levels. Days Supply of Gasoline is slightly above now, last year's levels. My current focus is on US distillates, ULSD, and European GASOIL. The complex is getting back into position again to send oil above 100.00. Led, in my opinion, by global distillates.
Of course Wall Street still measures inventories on an Absolute basis. Upon virtually no other sector of the economy would you find M.B.A's applying non-relative metrics, but, the Street makes a special case for Oil. Of course, this explains why the Street missed the bull market in oil until it was well advanced, smirked at the single House that got the story right (Goldman) and still has in -house oil, oil company analysts, and economic strategists that emmbarass themselves every week on TV. One could pick any of them but Jason Schenker from Wachovia was notably laughable this Summer on prospects for the next 12 months. Lehman, on the whole, has been just a teensy bit less-bad, but has also been asleep at the wheel. Other notable clowns are at Bernstein, and Merrill too has provided me with much entertainment. Recently however, Fadel Gheit has been YouTube worthy.
The bottom line is this: the headline Wednesday numbers from EIA Washington, except for providing a 1-2 day trade, have had almost no part in the 7 year bull market. You would never get the story from the absolute numbers. Again, this is why the Street never saw it coming. They combined the "We are the world" mentality with no ability to understand global OECD inventories, or the notion of Days Supply.
As I have said before, I hope none of them ever wake from their slumber.
Gregor
days supply:
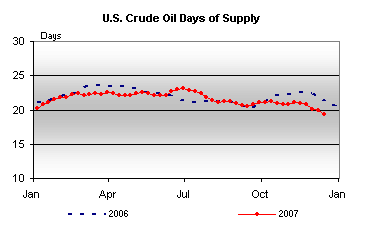
People need to also bear in mind that 'Days supply' is not the most useful concept, a la the idea that 'The world has 40 years supply of Oil at current rates of usage'. Currently the USA is at about 20 "days" supply of crude, excluding the Strategic stockpile. However, massive problems would be encountered long before this number reaches zero days.
And all the analysts who predicted only a 1.5 mb drop didn't know this? Or maybe the problem is they didn't know how much oil a ship holds or how many ships were held up.
In reality, I think it is hard to make the case that the fog is responsible for much more than a 1.5mb drop.
The fog had nothing to do with it. In fact more crude entered the Houston Ship Channel during the week of 8-15 December, which the 19 December TWIP is based than the previous week of 1-7 Dec. 12 December TWIP.
For example, I ran a spreadsheet on all the shuttle tankers and Aframax tankers that entered the ports of Texas City and Houston to come up with the astonishing numbers.
Maybe one of these will land in the Saudi Oil fields and then they can blame Peak Oil on something other than Peak Oil.
LOL, Like Humanity doesn't have enough problems as it is.
Small Asteroids Pose Big New Threat
http://real-us.news.yahoo.com/s/space/20071219/sc_space/smallasteroidspo...
And this week, inventory report switched from "U.S. crude oil inventories are in the upper half of the average range for this time of year" to "U.S. crude oil inventories are in the lower half of the average range for this time of year."
Aren't we supposed to build inventories at this time of year? Where's that oil OPEC promised? Do they love China more than us?
My thesis is that the industry has gone to a just in time inventory system, because of the SPR (we used to carry up to 30 Days of Supply), and these five year numbers just reflect small variations in a thin margin of supply above MOL. Currently, we appear to have about two days of supply in excess of MOL.
But its not easy to actually get SPR oil to various refineries throughout the country. I think they have trimmed for cost reasons but depending on the SPR probably does not make a lot of sense for most oil producers.
I think it probably has a lot more to do with the fact that imports are increasing and you have a lot of oil effectively in storage as its in transit. If you think about it they have tankers spaced out across the glob about a day or so apart. Thats a hell of a lot of oil and you only need to deal with delays. So why store it in the ground when you can store it in a moving tanker ?
I think your idea is right but tankers to me make more sense than the SPR.
The most important thing to note about excuses is that until very recently nobody bothered to give any. People do not give excuses unless they feel threatened, and thats like whistling past the cemetery. Go look at the international finance markets with all the explanations for liquidity infusions if you want to see the biggest effort on the globe to pump up everyones self confidence. Lots of scams are unraveling.