Does Less Energy Mean More Farmers ?
Posted by nate hagens on December 21, 2007 - 10:41am
This is a guest post on energy and our agricultural system, by Jason Bradford, who has written here previously on "Relocalization: A Strategic Response to Peak Oil and Climate Change". Jason has a Phd in Biology and has written/published on the topics of relocalization and ecological economics. He is the founder of Willits Economic Localization (WELL) and runs a CSA in Willits, CA. (He also has a biweekly radio show "The Reality Report", where next Monday at noon EST he and I will be discussing evolution, addiction and economics. His show can be heard streaming online at www.kzyx.org.)
DOES LESS ENERGY MEAN MORE FARMERS?
Among the cadre of folks who think about food systems and sustainability in the U.S., there’s a concern about the number of farmers and their age. Only about two percent (5,802,000/295,410,000 in 2004) of the U.S. population is part of a farm family, and the average age of principal owners of farms is about 60 years. Since mechanization and the fuels that power machines are what enable such a small agricultural labor force, is it reasonable to assume that a decline in fossil fuels will require more farmers?
Others, such as peak oil educators Richard Heinberg and Sharon Astyk, have suggested this will indeed be the case, even going so far as to put a rough number on the future farmers of America. Their estimates are based on looking at the proportion of farmers in an early to pre-industrial economic system in the United States, when about a third of the population engaged in agriculture. They then adjust for current population size to arrive at the admittedly tentative figure of 50 to 100 million farmers (or members of farming families) needed to feed a population of 300 million.
As these authors point out, not only is the absolute number very large compared to today, but given the age of the current crop of farmers it implies that a rapid education of youth will be required to keep bread on the table. Given the importance of this topic, I feel that more diverse and sophisticated forms of analyses are needed. Just as we use multiple lines of evidence to understand the evolution of life, oil depletion, and climate change, we need to look for confirmation from many angles. Furthermore, better knowledge potentially gets us closer to grasping the scale and rate of change required to cope with the problem in the same way that depletion rates in existing fields and net exports analyses do in the oil situation, or the timing and consequences of melting ice sheets and release of methane from warming permafrost do in the climate system.
Perhaps we can validate or refute this scenario by further use of the comparative method. The comparative method is what Heinberg and Astyx used in their analyses—comparing a future scenario to a potentially analogous historic past. In the analysis presented here, I take as a given that the United States (and other high energy consuming industrial countries) will have less energy available in the future, at least of the type currently used in mechanized agriculture. The comparison I use is not historic, but contemporary. I know that today some nations have much less energy consumption than others and anecdotally I am aware that poorer countries tend to be more agrarian. If nations with less energy consumption have more farmers, it would support the notion that a reduction in energy consumption in the U.S. (and other industrialized countries) will lead to an increase in farmers.
Is there a discernable inverse relationship between energy consumption and agricultural populations among nations?
Let's take a look. First, I had to find total population by nation and agricultural population (which I believe means farmers and their immediate dependents) by nation. These data can be downloaded from the United Nations Food and Agriculture Organization (FAO) (http://faostat.fao.org/site/550/default.aspx).
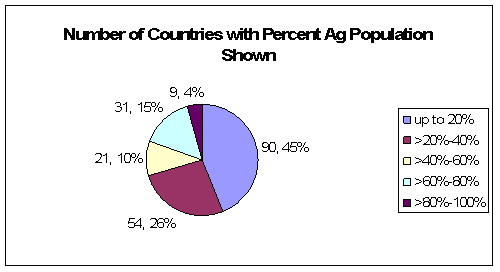
Simply dividing the agricultural population by the total population gives the percentage that live an agricultural life. The range of this figure is huge, from essentially zero for places like Singapore to over 90% for places like Bhutan. I really don’t know how accurate censuses data are from the 205 countries used (not all places are fully independent nations, e.g., Puerto Rico is separated from the U.S. in these data sets), but assume figures are in the ballpark. Certainly citizens of Bhutan and Singapore have vastly different livelihoods. According to 2004 FAO data, overall about 41% of the world’s people still live in families who work in agriculture (2.6 billion out of 6.4 billion).
Most nations (about 70%) have 40% or less of their population in agriculture. This means that the fewer countries with high percentages of agricultural workers have large populations, e.g., China and India are 64% and 52% respectively and equal about a third of the total world population. In all likelihood, large populations correlate with high population density. As a 1997 paper by Conforti and Giampietro showed, economic forces in poorer nations with dense populations tend to retain farmers.
Second, I had to find energy consumption data. It is difficult to locate data on use of wood, animal dung, etc., but for commercial energy such as oil, natural gas, coal, and electricity the Energy Information Administration (EIA) of the U.S. Department of Energy has available spreadsheets for download (see table E.1 at http://www.eia.doe.gov/iea/wecbtu.html). While this doesn’t include all forms of energy, it does cover the forms most readily usable in an industrial agricultural system.
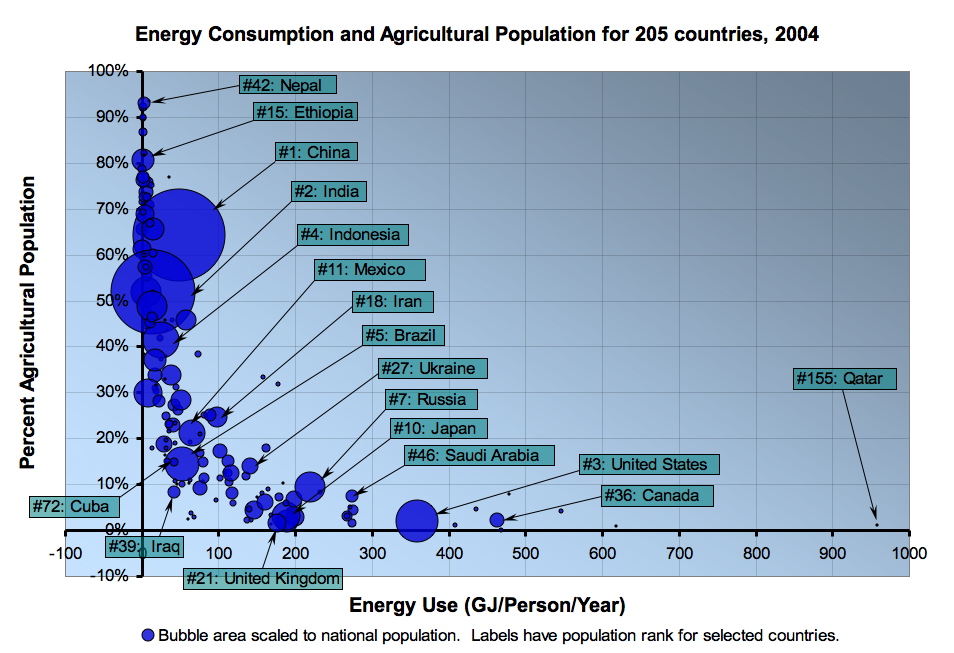
I had to do some work to harmonize the two data sets, which meant using 2004 data and limiting the analysis to 205 nations—which I figure is fairly complete. The figure below shows the results, plotting the percent agricultural population as a potential response to per capita energy consumption. (Note: A big thanks to Stuart Staniford for constructing the bubble plot).
Click to enlarge.
As expected, nations with relatively little commercial energy consumption tend to have lots of farmers. The relationship doesn’t appear linear (perhaps putting energy on a log scale would change that, the X axis ranges from 0-1000 and the Y axis from 0-100), and is not very tight. I see some evidence that tropical nations can get by with less energy than temperate zone nations and still have similar proportions of farmers (e.g., compare Cuba to Ukraine and Mexico to Iran). This result could be explained by heating and cooling demands in temperate countries and/or higher crop productivity due to soils or climate factors.
While these results are supportive of the general hypothesis, I find it difficult to use this method and these data alone to get at the scale and rate of change questions. What might it mean, for example, for the U.S. to be using ¾ less energy by 2050? Many places today are already using that much less energy and have just as small of an agricultural population as the U.S., but surveying the spreadsheet it appears that many could be considered special cases, such as small islands swarming with tourists or tax havens for the wealthy, which can simply afford to purchase most of their food. Other large nations with ¼ of the energy use of the U.S. have between 10-20% of their population in agriculture. Considering that such a range is 5-10 times the current percentage does stagger my mind a bit.
Other questions that arise include: Whether U.S. farming can remain as energy intensive as it is today by taking a larger share of resources from other sectors of the economy? Because no modern economy can survive without them, I would expect extraction and production sectors, such as mining, agriculture and manufacturing to decline at a slower rate than, for example, finance, tourism, and real estate. Are dramatic efficiency gains still to be had in conventional U.S. agriculture, or has the farm sector already been through enough energy and financial dramas to have played out the easy options?
As in any good subject for research, answering one simple question provokes a series of more difficult ones.
Though I may have just done so, I am mistrustful of studying this issue in isolation. Nagging at me is the question of whether the globalized industrial system is inherently unstable in the face of multiple challenges, including energy scarcity but also the converging crises spawned by the surging weight of humanity. Climate change, financial wobbles, violent conflicts and related spin-offs can unpredictably disrupt the vast system of trade that moves fertilizers, seeds and replacement parts that keep industrial agriculture humming. I think we are already seeing hints of this scenario in the U.S., as farmers run short of diesel fuel during harvest season and end up leaving crops in the ground.
Conclusions
While I would appreciate more work towards the questions posed here (and contact me if you have ideas and skills to help), I also caution against analysis paralysis. There are multiple reasons why agriculture needs to undergo a profound shift and spending too much time trying to circumscribe the problem may delay us moving towards appropriate responses. I believe the broad vision of what needs to be done already exists—food that is more local, organic, produced, processed and distributed by renewable energy systems, and using cultivation methods that put the soil health first. Making that argument to those who are reluctant or suspicious, however, could use some better research that connects the dots credibly between energy depletion, climate change, food security, and demographics.
**Acknowledgement: Thanks to Stuart Staniford for both the bubble graphic and checking for accuracy of spreadsheet data manipulations.
References:
i Hollis, P. 10 May 2005. Demographics study reveals facts about farm operators in U.S. . Farm Press. http://southeastfarmpress.com/news/051005-Farm-demographics/; The cited article is based on primary data from the 2002 U.S. Census of Agriculture (http://www.agcensus.usda.gov/Publications/2002/index.asp). The average age of U.S. farmers being about 60, as claimed today, is extrapolated from the 2002 data, with an update due from an ongoing 2007 census.
ii Heinberg, R. 2006. Fifty Million Farmers. Twenty-Sixth Annual E. F. Schumacher Lectures. http://www.smallisbeautiful.org/publications/heinberg_06.html; Astyk, S. 2006. http://casaubonsbook.blogspot.com/2006/12/50-million-100-million-200-baz...
iii Conforti, P and M. Giampietro. 1997. Fossil energy use in agriculture: an international comparison. Agriculture, Ecosystems and Environment 65 (1997) 231-243
iv Reuters. 12 September, 2007. “Not so Corny: Fuel Shortages May Hurt Corn Harvesting.” http://www.foxnews.com/story/0,2933,296551,00.html
Contact
- Content: editors at theoildrum dot com
- Tech support: support at theoildrum dot com
License

This work is licensed under a Creative Commons Attribution-Share Alike 3.0 United States License.
Thanks for this analysis Jason. Stuart is dubbing your graphic "The Bradford Curve"...;)
As I plan to show next week with some graphics from systems ecologist Charlie Hall, a lowering of the aggregate of societal net energy, will reduce discretionary investment because more energy must be allocated towards energy production and basic goods (of which food is the most basic). So I believe your hypothesis is on the right track.
Conversation with high school student a couple of years ago. I described my take on the problems ahead. Student said, what should major in? I replied: something related to agriculture would be a great idea. She looked at me like I had grown two heads.
So, what else is new? I guess all we can do is try to persuade those who will listen.
I nominate Jason Bradford and Alan Drake as TOD Persons of the Year for advocating LOF (Localization Of Food) and EOT (Electrification Of Transportation).
Thank you for posting this article. The bubble plot of energy/population/%ag is really innovative. There are a lot of dashed lines connecting energy to food production and indirectly to the percent of people working as farmers. Including fertilizer production from natural gas and the decrease of this activity in the face of higher natural gas prices, in my opinion, can result in the conclusion that less energy means much more starvation. There is also a connection here with the recent Energy Bill and price supports which were, and were not, supported.
High school students do not seem interested in Agriculture.
The Hispanic students see agriculture as lowly peasant labor - something they want to get away from.
Where are these new Farmers going to come from ??
Unemployed law school graduates and unemployed mortgage brokers, investment bankers, etc. would be a start. In any case, when faced with PPP--Produce; Perish or Pilfer (joint acronym effort)--people will have to make a decision.
From "Casablanca"
Which reminds me of some jokes from 1986 (when oil fell to $10):
A geologist applies for a job at a convenience store. The manager said that he had no openings for geologists, but he would like to hire another petroleum engineer.
What's the difference between a mockingbird and a Texas oilman? A mockingbird can still make a deposit on a Mercedes.
deleted
High school students do not seem interested in Agriculture.
Well, why would you?
Long hours of hard physical labor around things that can hurt you - for low pay.
Now take the income from raw farm output and pay taxes, insurance, and for equipment to run a farm. Lets not forget, when you send a grown product off of your farm, you need to replace that atomic matter - so you are adding compost, rock dust or other materials TO the land.
Then look at how many farms KEEP existing due to outside cash flows beyond the sale of farm output.
A sample story but with a happy ending.
Have many farmer friends and neighbours. This guy is very large and strong. Biceps the size of logs. Went to farm equipment show. Bent over pto shaft of new tractor running new bailer to have a closer look.PTO shaft guard was not on correctly and the pto caught his shirt as it turned and started to wind him up at 540 rpm. He had the presence of mind to brace himself with his immense arms and legs. It took off ALL his clothes except his socks.
SolarHouse
That is a great story - only because of the happy ending of having his clothing ripped.
(and it backs up my "Man is farm work dangerous!" point)
It sure is dangerous. I come from a family that includes many farmers over many generations, and the stories are legion. We lost an uncle two years ago when the tractor he was repairing somehow went into gear and pinned him against the wall of the barn...what a way to go. Still...is it worse than dying of stress releated heart disease? I'm not so sure.
The bones of people from many early agricultural societies show extensive evidence of osteoarthritis and bodies broken by hard labour at a relatively young skeletal and dental age. As one who runs a small farm producing most of life's needs and a small surplus (supplemented by a 3 day a week off farm income), I can relate to this. Even with the aid of a 50 hp tractor for the heaviest of work, defeating the life-force embodied in feral photosynthesis (aka weeds) without recourse to herbicides, mulching, preparing vegetable beds, planting and picking the crop, shearing, fixing fences etc, all this leaves me frequently physically spent and sore at the end of the day. But at least the need for weight loss programs and gym memberships don't rate as problems. I do all this out of a doomerish belief in it's inevitable necessity and a desire to build the skill set to pass on to others when required. The vast majority of our convenience obsessed society have no idea what it will take to stay alive in the age of energy descent. Given the choice few would do what I do, how will they respond when there is no choice? Probably try thieving. As a teenager who helped himself to a farmer's apples on my way home from school, I can remember the sting of a 12 gauge loaded with rock salt. I wonder what society's response to that would be today?
My experience farming at home for 20 years and working at an organic farm has been identical.
Then there's the problem of crop loss when you don't spray. I saw whole crops of onions, broccoli, and beans wiped out by galinsoga where I work.
How many people here have actually seen and contemplated the horror of galinsoga?
My new motto: "Prolific internet postings do not a farming movement make."
Todays farm is not the farm of your grandparents.
But it could be. Frankly good honest work should not result in
infirmities nor illnesses. It is healthy to pursue manual labor. Where was it ever proven otherwise?
There are lots of Amish and Mennonites in this part of my state. I see them constantly and they look pretty healthy to me. I have friends my age who grew up on the farms of yesteryear and they are for the most part doing well..even at 70 yrs of age.
It seems that the ones who lived in town are the ones who perish first of many ailments. Mostly heart related.
Yet todays farm is a dangerous place. Due to a vast array of chemicals that can kill or make you very ill. Very powerful equipment that can do the same. Huge amounts of grain dust and pollen due to massive one crop farming. The chicken houses are cesspools as are the confinement hog feeding houses.
We never engaged in such. The chickens were mostly free ranging. We didn't close pen our animals. We treated our livestock well. We needed them.
We lived more in tune with nature and not destroying it.
Again its not the same now as then....BUT it certainly could be if we forgot this nonsense of globalization. Just raised what we needed in this country and pitched all the junk and toys. Raise our children in healthy surroundings. Not penned up like todays animals in confinement structures. Get rid of the child molestors,pedophiles and criminals by executing swift and sure justice instead of 'studying them'.
I would suspect that most farmers have off-farm children that they can call in--if it ever again becomes profitable to farm, the children will come back. I've one uncle with a small farm. He has one scheme or other to keep the family afloat, but I wouldn't be surprised if the farm itself is a losing proposition. He has 3 kids, all married, all gone, all highly educated. They might come back for $100K - $200K / year.
It'd take a crisis for them to return, but they could pull their weight.
Your high school student is neither the first nor the most famous person to react that way. Bertrand Russell once jibed with astonishment (link, small pdf) that the University of Wisconsin would pay heed to worldly concerns, saying: "When any farmer’s turnips go wrong, they send a professor to investigate the failure scientifically."
Incidentally, the University's Stock Pavilion used to be used as a classical concert venue as well as for livestock shows. A story retold by old-timers among the local musicians has it that years ago, one of the Russian orchestras (don't recall which one) objected strenuously when they arrived on tour and saw where they were to play. The response was that since the local symphony sometimes played there, and since the Russians were Marxists big on equality, the locals really could not quite see their objection.
So I guess that while agriculture brings out a lot of mile-wide, inch-deep cheap sentiment - hence "ethanol" as a form of farm support - many folks nonetheless see any closer connection than that as, well, icky. And yes, I also guess you seemed to have an anomalous number of heads that day...
Wow! I am honored. And coming from the ELP-master himself. Should the TOD Overlords set up some kind of poll?
Regarding the sorry social stigma of agriculture. This is really sad. It is not universal among young folks though. There is a subculture interested. They often gravitate toward permaculture workshops, they may go to the degree program at UC Santa Cruz, or join the WOOFERS, intern on CSA veggie farms...but they are generally landless and have many countervailing pressures drawing them away from these pursuits.
Burlington Vermont (Intervale) and organization in Monterey County CA are doing fine work in professional development for young farmers--giving them access to land and capital, and helping them develop markets. Farmlink connects young to old farmers with the idea of future equity transfer.
I think young people today have a harder time swallowing the idea of being sharecroppers, so they get bummed out not owning the land they work. You think "farmer" is stigmatized, imagine telling your proposed future inlaws that you are a "sharecropping farmer."
If baby boomers want food security in their old age they may want to think about transferring equity to those eager to live a life connected to the land.
I'll second the nomination. Jason's PO messages and showing of End of Suburbia at the Willits Enviro Ctr. a few years ago was my wake-up call.
Rat
Another wrinkle would be to make the graphic 3 dimensional - shade/color the bubbles based on whether the country is a food importer or exporter. Red being importer, blue being exporter and shade of color being magnitude. Stuart? Jason?...;)
p.s. Ive just taken the plunge and ordered a Mac, in an attempt to reach the high bar of free internet community graphics that Stuart, Euan and Khebab have set.
Congratulations on leaving the Dark Side.
Did you not get the memo?
They are all UNIX now.
snark
(Windows NT will be a better UNIX than UNIX and, well Macs are nothing more than FreeBSD with better marketing)
As mentioned below, the bubble chart was created in Microsoft Excel - that very same application is available for both Windows and Mac.
How does the myth that "Mac is better for graphics" persist, going on 20 years after it has stopped being true?
I'm not a fan of MS, but Excel is pretty nice. (And has its wrinkles. For example, Vlookup() does not work!!!)
I haven't used a Windows box regularly since XP, but I seem to recall that it handled transparency much less well than the Mac - even in Excel.
I've just recently had the joy of porting a web browser from linux to OSX and to Windows Vista. The Mac is a great box and windows still sucks rocks even loaded Gnu software. The files systems is still painfully slow etc etc. Vista is still pretty much a facelift for XP and you still have a lot of performance problems along with the box just going out to lunch every now and then. And you can forget about firing off a big compile and browsing the web. I was actually pretty disappointed since I'd heard it was a lot better.
It looks like the U.S. is on a fairly "flat" portion of the curve. That means fairly large changes in energy use will not cause large changes in %ag for the U.S. (assuming we stick to the curve as our energy use declines). At least until we hit about 100 GJ/person/year (eyeballing) and the slope changes. It could take the U.S. a long time to get there.
On the flip side, all those poor countries on the y-axis could see large decreases in %ag with only modest increases in energy use and, of course, large increases with only modest decreases in energy use. So, as access to energy decreases, wealthy countries on the flat part of the curve change little and poor countries near the %agr axis scramble.
Also, it looks like your curve would fit nicely to an inverse power law. Have you done a fit for this? i.e. : y = x^(-z) where z is some positive #
That's my interpretation also. If progress down the curve were to be viewed as reversible (which is probably a rotten assumption, but for the sake of discussion), then the US could dramatically cut energy usage before it had to increase agricultural population.
This is common sense - it's obvious that the US wastes a high fraction of the energy it uses in ways that have relatively small marginal utility (like driving 15mpg vehicles versus 60mpg vehicles), so there's a lot of scope to cut energy use in those ways before more radical things are needed (by which time we hopefully will have ramped up renewable/nuclear energy and have figured out better batteries, and most of us never have to revert to peasantry.
This is a point I hope comes across in the article too--how much more can be reallocated to the productive sectors and how much more efficiency can be gained in general and in agriculture/the food system. I could say much more about this but want to wait for another post.
However, I take a more precautionary stance. Since food is so critical and there are a multitude of reasons why the current food system is unsustainable, it doesn't make sense to me to wait around for government, academia and industry to sort this out. As far as I can tell, they don't understand energy, climate and soil issues well enough to have prevented the mess we are in.
The whole strategy of packing people into denser enclaves and importing food from afar is also possible but I don't believe sustainable in the long run.
This conversation eventually gets down to the level of the first law of thermodynamics--soils are mined by root hairs and associated fungal hyphae and these minerals are incorporated into every cell of the plant. When plants are harvested and their bodies removed the soil is depleted. Replacing the lost nutrients, which can be almost impossible to measure properly, requires a cycling of waste from the consumer species back to the decomposer species. How does this happen when the consumer species lives 2000 miles away from the decomposer ecosystem?
Excellent article, Jason.
Two brief points on this subthread;
1. If one extrapolates the energy use of a developed country far to the right on the graph and assumes that little change will take place with reduced energy, this will ignore many non-linear variables, such as the impact of other declining crucial inputs (i.e., phosphorus, nitrogen, etc), the cost of transition to different forms of agriculture production, the lag time in infrastructure and supply market changes, and so forth. Note that the UK uses less than half the energy input as the US for the same percentage ag population, though imports and exports have not been taken into consideration.
2. "packing people into denser enclaves" is one approach to reducing energy consumption in buildings and transportation, so there are tradeoffs. One ideal arrangement that does not require high produce transportation costs (as ag is close by) is the carfree cities approach, though I acknowledge this would be difficult to start from scratch in a petroleum starved economy.
Yeah, that's the question. However, if it is then it provides info about the vulnerability of a given country to an energy shock. The magnitude of the slope of Jason's curve could be taken as an Energy Shock Vulnerability Index (ESVI). The higher your country's number, the more likely your country sees societal disruption due to a loss in energy access. Or maybe POVI would be more catchy.
I agree with Stuart. We have so much room to cut back on energy usage without much impact on our living standards that I do not see why we will have to give up using farm tractors for example.
I would rather shift to moving around in a 80+ mpg subcompact hybrid diesel than start following an oxen around with a plow.
We also have non-fossil fuels energy sources that can get scaled up. We could run a lot more agriculture off of electricity and we will do so once oil production starts declining. Nukes, wind, and solar will power our tractors.
This is a great start. The bubble curve looks roughly like 1/x to me, i.e. ((GJ/person-year) * (agricultural fraction of population)) is roughly constant.
There are two forms of energy importation that might be useful to add: fertilizer, and food. Actually, it would probably be good to account for export as well. If a country burns lots of fuel to make fertilizer and then exports the fertilizer or the food, that shouldn't count as consumption.
Anyway, you've made an excellent start. Thanks.
Hmm. The curve could also be 1/x^2, for example, or 1/sqrt(x). The author might want to linearize his data and check that. It is rather hard to tell from eyeballing the graph. I guess it depends on whether knowing the exact functional relationship is useful for anything or not.
I suppose having a function would enable those modeling energy to estimate impacts in the agricultural population.
If somebody wants to work with the data and produce a function I'd be happy to share the spreadsheet.
I'd be happy to do the linearization. I'm pretty much bored, kicking around at work, avoiding writing up the research I should be writing up. But I've never contacted anybody here off-list...How does it work here?
I tried quickly inverting the agricultural percentage last night and plotted that scattergraph. In the reciprocal dimension, it looks much more scattered, and a straight line only has an r^2 of 19%. I mean to plot the inverse of that straight line on this graph, but that requires a bit more tricky Excel bashing (to plot a line on a bubble graph, which I might do tonight).
Beyond getting the "best fit" to the graph, I would suggest modeling this relationship as a power law. Take the limiting cases: On the y axis you want a y intercept at 100%. This is because (in the ideal case) you have a totally agrarian economy with everyone making enough food by subsistence farming to...subsist...if you know what I mean. However, there is no logical x intercept if you assume that there is infinite energy available (TOD heresy) :P Well, Qatar provides a good example of what I mean.
A function of the form y = 100e^(-Ax) seems like the best place to start as a mathematical model of what's going on, that matches the naive physical situation. It also suggests an easy differential equation, which in turn could be used to model this dynamically :)
It would be convenient if the author could make his spreadsheet (or some other form of the data) available. I suspect that taking natural log of both variables will probably result in a roughly linear fit. Here's a graph I put together a couple years ago:
Energy per-capita versus income per-capita appears to be linear with an R2 of 0.8 — a darned good fit for these types of question. Economies that require 40-50% of the workforce for agriculture are low-energy (hence low-income) economies.
Unless/until agriculture becomes high(er) income.
But it never has. Agricultural workers may get a bigger piece of the total pie as more workers need to be diverted to ag efforts, but the total size of the pie will be shrinking at an even faster rate. Because one farm family can feed itself and 49 other families today, those 49 other families do things like build the hospital, build the equipment used in the hospital, staff the hospital, etc. At the point where 25 families must work in ag to feed the 50 families, it follows that there will be fewer hospitals, less equipment for hospitals, less staff for hospitals, and on and on. Ag output remains the same -- enough to feed 50 families -- but all the other outputs of the economy shrink dramatically.
Under any sane distribution of income you want to use, the families in the second situation, including the 25 ag families, will be worse off (poorer) than the single ag family is today.
What about Cuba? I don't have data but am told that farmers make more than doctors, lawyers, etc... Is this true?
The thing is, it's not "be a farmer or work in a hospital." There are a whole swag of other jobs - most non-farmers don't work in hospitals. As in all societies, productive workers support a large class of people who produce nothing tangible and are mostly idle. In medieval societies the idle class are called "nobles", nowadays they're called "accountants" and "lawyers" and so on.
The high-energy society supports a large class of idle people on the back of productive work. If the amount of energy available declines, much of that productive work will decline, so that the idle will decline, too. For example, if the oil runs short then a lot of commodities speculators will lose their work, and thus a lot of bankers, and secretaries to bankers, and IT people who write the software they use to keep track of prices and sales and purchases.
In a society where oil is too expensive to use in any form on farms, yes you're going to have a lot more farmers. But that needn't mean less doctors and hospital cleaners - it might just mean less accountants, stockbrokers and so on.
Every accountant I personally know works very hard, especially so around tax season and around the quarter end if they are in a public company.
Same thing with the lawyers I know.
And without both of them this incredibly complex world would have no one to help us regular folks understand and thrive in it. I ask both my accountant and my lawyer for advice and much more often than not it is very, very good.
My accountant friends and lawyers friends would laugh to hear you compare them to nobles! My guess their response would be, "If only..."
Of course they work hard. So did medieval European nobility. They had constant activity, it's just that it produced nothing tangible. They earned their keep while producing nothing tangible, whereas other groups in society had to produce something tangible to live.
If my local baker drops dead then the shop closes, and I have to find a new place to get bread. If my local councillor or accountant drops dead, nothing tangible is subtracted from my life, unless I knew them personally.
Certainly they assist us with the complexity of the world; but they also contribute to it. Our medieval nobles, likewise, protected we their people... from other nobles, who in turn protected their people from our nobles. They thus created "work" for themselves.
It's fair to make a distinction between those who create some physical product, or maintain existing products or people, and those who don't.
That's Adam Smith, an accountant will probably have heard of him.
I imagine that in such a situation a variety of jobs would cease to exist. Socially necessary work like doctors, nursing, teachers, energy workers, sanitation etc would continue. I can see many of the consumption & service based jobs dissappearing. We would still have our hospitals & schools staffed, we may not have the shop assistants or middle level management at the local pizza hut or sunglasses retial store.
If you could plot energy consumption specifically used/related for agriculture, it might be much more meaningful. This also might be useful in showing how efficient energy is used for agriculture.
The 1997 paper cited in this article calculated energy consumption in the ag sector, and food output per unit energy, per unit labor, per unit land. In general, those nations with more labor input and less industrial inputs had a much higher food net energy.
This vision is based on assumptions that we don't know are valid.
I had planned on writing a long article on the fate of local, "organic" farming for this website, but the task has proved so daunting--and I have such little spare time or stamina to pursue the project--that I'm just going to post some general thoughts here. My initial readings have given me a dismal outlook.
It's always assumed that less energy is the fate of the US and that more farmers/decentralized farming is the answer. But how do we know that? I think we merely hope for it to be true. We're cornucopians, in the something like the original meaning of the word.
What if the US military ensures a continuing source of liquid fuels to the agricultural centers of the country? What if, as Professor Craig Bond Hatfield mentioned to me a couple of years ago, recreational gasoline use is "requisitioned for agricultural use"? (This wasn't a part of my interview with him.) In this way, the conventional agriculture paradigm could chug along for who know how long? Decades.
And what if there is indeed an energy "shock" to the system? An unsettling analogy comes from physiology, which I learned in my EMT training: In "hypoperfusion," the body senses that blood (or, in the US's case, oil) is not adequately getting to the tissues to oxygenate them, so the body "compensates" by increasing respiration and heart rate, and by shunting blood flow away from less critical systems, like the extremities. (People in early stages of shock present cold and clammy skin.) If the hypoperfusion persists or worsens, the vital systems of the body--organs--begin to shut down.
In our current agricultural system, "organic," localized farms are decidedly not fulfilling the role of vital organs: they're mere extremities. Large, centralized farms are the vital parts.
Who's to say, if oil supply is curtailed, the US won't "compensate" with a further consolidation of the existing vital systems? Who's to say the "extremities" won't be shut out during the "compensation" stage, leaving the "organics" movement and other non-vital agricultural systems to wither and die?
Things could transpire in ways we haven't even begun to imagine. And if the peak be imminent, and the decline as drastic as some make it out to be, then we're in for a world of trouble.
*****
Add to all this a wrinkle, a dilemma, that people on this site have not even begun to address:
The "organics" movement in its current manifestation is a scandal, sometimes even an outright sham.
1.) The "organics" movement sits cheek-by-jowl with the rankest of superstitions. For every Pimentel carefully plotting energy flows through organic systems, there are ten Steiners telling us to stuff manure into cow's horns as a way of "energizing" the soil.
Therefore, if there is an oil shock, and the hue-and-cry for more "organic" farmers hits the mainstream, the debunkers are going to already be there in force, waiting to decimate the outrageous claims of the current crop of "organics" aficionados.
The high priest and priestess of the current cry for "organics," Heinberg and Astyk, are not immune from this infectious hocus-pocus:
This implies that "organics" foods are somehow better, "more nutritious," and that conventionally grown foods are less so, which is just neo-kosher claptrap.
This is the most specious nonsense. It sinks to the level of what Morris Berman calls "manichaean" thinking: it's not enough that one's particular tribe has the "answer": all the others must be devils. It is the very apotheosis of "biting the hand that feeds you."
2.) In my meager experience here in Maine, the "organics" movement is in nowhere near the condition to step in and fill a void should local shortages develop. My own boss at Rippling Waters Farm is peak oil aware, but he owns a mere 4 acres.
The larger umbrella organization in Maine, MOFGA barely hints that they know what's going all. They seem indifferent to peak oil.
But they know what's going on. In 2004, I wrote an article for MOFGA's newsletter describing peak oil and asking what MOFGA would do if there should be a sudden call for organic farmers in Maine. Wasn't this a vast opportunity? The Director rejected my article thus:
This implies that "organics" foods are somehow better, "more nutritious," and that conventionally grown foods are less so, which is just neo-kosher claptrap.
Tell ya what. Explain why the brix level is higher in organically grown food model VS the Ammonia and pesticide growth model.
Source?
And so what?
Hardly paradigm-shifting.
Source?
So you want me to provide you with an education? I'm all ways up for changing a mind.
And so what?
Oh. So really, you don't care if your claim of neo-kosher claptrap is wrong, your mind is not open to correction.
For the rest who are here for learning a bit about the rest of the world, the idea is this: If you measure the sugar content of the plants you have a cheap, reproducable and objective metric of plant health - the higher the sugar (for that plant) the more healthy the plant. (Because plants use sugars to build their own tissue)
http://www.highbrixgardens.com/highbrix/highbrix.html
Hardly paradigm-shifting.
I agree. Around here, calling bullshit on some post and seeing a response of "so what" is not a paradigm shift.
b3NDZ3La, while I'll admit there is plenty of magical thinking around the organic movement, I'll suggest that the "heirloom seeds" movement is paradigm-shifting. Why?
Even when I was attending a "Land Grant" college back in the '70's it was projected that hybrid plants would lead to obesity in the countries that used them widely. This is because while producing protein is "expensive" for a plant, producing carbohydrates is "cheap" for the plant. So hybrids tended to produce merely bloated fruit or seeds, inflated by huge amounts of carbohydrates without corresponding increases in protein, vitamins, and antioxidants. For example, in potatoes and eggplant most of the vitamins and antioxidants are in the skin or just under them; potatoes and egglants used to be much smaller, with a much higher surface-to-mass ratio. Now they are huge balloons of carbs, with a thin skin stretched over them.
Point is: green revolution plants produce impressive tonnages if you stuff them full of fertilizers and irrigation, but much of that increase in tonnage is carbs to make fat animals and fat people.
Man, in his hubris, figured he new better than God ( or evolution, take your pick : )what plants should produce for people to eat, and could get something for nothing. We are soooooo screwed!
PLAN, PLANt, PLANet
Errol in Miami
This is because while producing protein is "expensive" for a plant, producing carbohydrates is "cheap" for the plant. So hybrids tended to produce merely bloated fruit or seeds, inflated by huge amounts of carbohydrates without corresponding increases in protein, vitamins, and antioxidants.
Thanks for that tid-bit. Had not heard this one before.
It's easy to become bitter when one is knowingly and willingly encouraging the parasites around them with the ridiculously cheap fruits of their labour.
"Organic" is a joke, Wallmart moves more "organic" product than Whole food and to para phrase Michael Pollan ' we are one Legislative move away from an organic happy meal'
I'd suggest a year off, mess around with cover crops. Make some money.
Our food system is a wonderful thing to ponder. GMOs, the loss of crop diversity, pissing away top soil, nitrogen run off, subsidies, slavery, replacement parts, on and on and on. I don't think we're going to make it.
By the way I only ask $16.95 for my seed garlic. Not "certified organic"!
b3NDZ3La - This year we, (or I should say OSU) hosted the FFA (future farmers of America) event.
2700 fresh faced young'uns who are intent on being the food producers of the future.
Some I talked to said much of what you just wrote.
I have quite a bit of PO propaganda around my shop and chatted up several of them to see if their was an awareness.
For the most part it was blank looks but one small group lead by a 6'4" outgoing young man said yeah they understand it but don't buy the whole Die-off/ nuclear booming thing.
I asked how they saw it effecting farming and they said in essence that they thought it would just put more emphasis on highly productive processes and expect tons of money to start flowing their way.
P.S. These kids were for the most part very sharp, personable, dynamic even, and I never saw a fat one in the bunch.
Last year the big meeting of the Vermont chapter of the Northeast Organic Farmers Association (NOFA-VT) put Peak Oil front and center, including a keynote speech by Kunstler.
Congratulations! This is one of the best posts I have read in a very long time. You are so right. My husband and I have just purchased 13 acres of "black dirt" 60 miles from New York City. We have been considering whether or not to get "certified" organic and have decided against it for a number of reasons. Mainly, we do not want some person from the certification board spending six hours at our home pouring over records. We rather spend the time planting some seeds or sitting by our fields watching the sunset and sipping a nice glass of port. Life doesn't get much better than that. So, when our "dear" customers ask about our methods, we will have two responses: we are black dirt farmers or we practice "veganics." How's that for blowing more smoke?
Thanks. Sounds like you're having fun. If that ain't what farming is all about, then I don't know what is.
I can't tell you how gratifying it is to walk into the cellar and see months' worth of food that we have grown here ourselves, without massive and expensive inputs of bought items, like fertilizers and pesticides.
But this doesn't make our food more virtuous than the stuff at the store. It just makes it literally the fruit of our labors. It also makes us secure and free.
The people stumping for an organic conversion of the national agricultural system are in for a pounding that they can't even imagine.
"Organics" is a marketing ploy. It is a scam. I want a new name for honest, local, low-energy farmers...
Lo/Cal farming?
Nah. Too "soft drink."
It is a bummer how good terms get co-opted. I could rant about the word "sustainable" for example.
The farm I help operate is certified by a local group called Mendocino Organics. They charge almost nothing and are made up of other farmers.
I appreciated the few things they asked me to do to become certified, specifically writing up a soil fertility plan.
http://www.mendocinorenegade.com/
Yes, "sustainable," and "green," and "wholesome," and "natural," and "eco-" anything, and "nutritious," and "alternative," and "community," and "bio-" this and "bio-" that...
Hmm, yeah that sounds about right. Any day now we'll be saved by this rising tide of ethanol and other biofuel. It's gonna give those terms a really bad name when hunger is more widespread.
Lo/Cal farming?
How about "sustainable agriculture"? Or is that term already too worn out?
Thanks for the nice rumination, b3NDZ3La. That explains a lot of what you were talking about last week.
And that MOFGA "Whole Life Tent" is a hoot! I always thought that was what marijuana was for :)
But, yeah, your medical shock analogy sounds about right. There will be this period of time when much more energy will be expended, wasted really, by TPTB and everyone who remembers the good old days of 2007 in a vain attempt to "get back to normal". By the time that effort is abandoned, or simply moribund, we will be a whole lot farther down the nonfarmer/farmer ratio on that keypost graph.
I think it's going to be important to find the right sort of place, maybe a little farther off the beaten track. But it's hard to estimate just how far off it needs to be for that sweet spot between small town life and wilderness. How about somewhere around Dover-Foxcroft?
There will be this period of time when much more energy will be expended, wasted really, by TPTB and everyone who remembers the good old days of 2007 in a vain attempt to "get back to normal".
Whoo, boy. Do you ever call it here.
Our pretenses at predicting the future--let alone preparing for it--are sure to be . . . imprecise.
Good luck getting that off the beaten track place!
It will be difficult to distinguish between "recreational" and other use of gasoline. But the concept is clear: when the crunch time comes (after "market forces" have killed off a lot of discretionary demand) all governments will be forced to allocate fuels according to their most important use, and agriculture will be high on the priority list. The rest between what is really needed to keep essential economic functions continuing and available fuel supplies will be rationed to private motorists in a constantly diminishing quota (per month per car). There will be no other choice.
In the Australian context I have calculated that assuming
(1) a 30% drop of oil supplies in line with the estimates of the Energy Watch Group 2007
(2) a continuation of all commercial, truck and regional/rural/agricultural traffic at current levels
(3) petrol/diesel adjustments can be made at refineries
motorists in Capital cities would have available to them by 2020 only 20% of their current fuel usage.
I really like the graph. Can anyone tell me what program was used to make it?
Jason, I attended a presentation 10 years ago about future workforce trends. The speaker pointed out that in 1905, 50% of the North American population were direct farm laborers - like modern Indians according to your graph. By 1948, less than 10% remained on the land, while manufacturing peaked at 40% of the workforce. From this perspective, the great depression was caused by the development of good, cheap farm tractors after WW1 displacing people as farm labor. Manufacturing has been steadily declining Since '48, due mostly to automation improvement, though offshoring gets the credit. The "service" economy is now the biggest employer in North America.
I predict the rise of the energy economy. Renewables, nuclear (a typical nuc. employs a thousand people!) and CO2 sequestration of coal will require 20-30% of us, and small, regional "artesan" manufacturing using CNC tools will provide a resurgence in that sector.
Primary industry will be located near the minerals.
Farming will continue to require almost nobody, as electric tractors will operate just as well as the diesel ones.
Workers will have to come from the ranks of financial services, retail, etc.. and may well be happier building solar panels than CDOs.
It was done in Microsoft Excel. I gave the editors a very plain graph. Somehow Stuart made it look very pretty and I think I learned how.
Are you aware of any major company developing electric tractors?
It takes a long time to retool an industry. I fear we are going to muddle through with much of the infrastructure we currently have and only slowly adopt new equipment. I believe tractors turn over much more slowly than cars, and farmers are very hesitant to buy something without a great track record.
When you need to get the crop on 1000 acres out of the ground within 7 days, and plan on running your combine for 12 hours a day...it better not break down. Same issues on the planting end of the schedule.
The whole notion of complexity in tool sets would be very interesting to explore. Old-fashioned reapers with few moving parts could be used by a couple of people and take care of 10-20 acres a day. Now we have giant machines that can do an order of magnitude above that, but they are not very tolerant of missing pieces.
Tractors and combines use less power than you might guess by looking at them. They need torque, not speed, and are geared down accordingly. I grew up riding an International Harvester 20HP diesel tractor, and even combines can use 150 HP.
You should also consider duty cycle. A tractor spends the great majority of the time in the shed, then goes 24/7 during planting and harvest. This makes reliability very important, but average power consumption is low. One windmill running an electroplater all year could make enough zinc to run a metal-air battery through harvest, with no longer spent for re-fueling than a diesel tank takes. Combine systems are hydraulic, and can as easily run from an electric power pack.
Western civilization need not collapse with the end of fossil fuels, but probably will given the lack of sensible solutions being offered thus far.
A small outfit near me makes pint-sized electric tractors:
http://www.electrictractor.com/
And, as Jason Bradford is aware, Steve Heckeroth in Northern California has been modifying and building solar-electric tractors for quite a few years now. If any investors out there are interested in pursuing the idea, Steve welcomes their participation.
Why the big manufacturers like John Deere haven't gotten into the game is an interesting question...and perhaps not dissimilar to the question of why the Big Three haven't made a more serious pursuit of electric vehicles.
The issue of tractor and implement size has been one of the primary drivers to larger farms. The new models have always been larger, and operate most efficiently with larger pieces of ground.
As you get to having to purchase new machinery, the cost and the size have said "quit" for many. One it's a huge loan, two, you need more ground to work it right. So your place is up on the block, and others that can afford the larger machinery expand. I've seen it played out too much. Thousand acres isn't enough to make it go.
Another issue you brought up is labor-it's hard to get the kids interested. Neither of my boys have any desire. Alot of work. No glamour or status. Little freedom. One's off as a teacher, plenty of free time, the other is studying for engineering. Maybe later they'll want to come back, but I kind of doubt it.
To me, the question of agricultural employment centers upon how one sees the future. On the one hand there are those who foresee re-urbanization coupled with TOD - what I call Business As Usual Lite. On the other hand, there are those like myself who foresee a dispersed population.
In BAUL, it would be expected that a far smaller percentage of people would be involved with agriculture. However, I do not see this as a sustainable paradigm. I've discussed this on other posts so I won't repeat my arguments as to why I belive this to be the case.
Rather I anticipate extended family and afinity groups living together to personally produce the majority of their food needs with the possible exception of grains such as wheat and rice. In this instance, essentailly everyone would be involved with agriculture, perhaps not full time, but at least a significant portion of their work day.
Todd
Re. Education - I am forever sorry that I majored in chemistry rather than ag. Interestingly, I have now spent more of my life growing stuff than my time in the chemical industry. Being a plant manager was boring and not intellectually challenging compared with producing food.
Todd, had you majored in ag instead of chemistry, you'd have spent more time in a chemistry lab than growing stuff. If I had majored in ecology or evolutionary biology instead of finance, I'd be trying to be an investment banker at this stage of my life. We gravitate towards what we're missing and (hopefully)toward what matters.
Nate - I don't know. I went to a spiffy private school in the 50's. For the price of the education I could have gone to a state school and had enough money left over to buy a small farm.
I think a lot of our higher education choices reflect how we grew up. I loved growing stuff as a small kid but my mom was an elementary school principal and my dad a purchasing agent and the old family farms were long, long gone. There was one surviving farmer near us who still plowed down with his horses but he just did it because he liked doing it.
Life is strange.
Todd
And how much of that farmland and equipment was originally obtained w/o capital from family or your old Chemistry existence?
(How will someone who's just turned 18 get a loan to buy ag land and associated ag processing tools as a more broad question)
There are lots of ways to get started in farming without having a huge pile of cash to invest:
1. Find a land owner who is willing to let you farm his or her land. There are lots of older people who own land and would like to see it put to good use but don't have the ability to farm it themselves. I myself have only three acres but am immediately adjacent to 50 acres of ag land owned by a nice older lady. She lets me grow vegetables and pasture a milk cow and bull on her land for nothing.
2. Go to www.growbiointensive.org and learn the biointensive method of sustainable farming. You only need some simple hand tools and your own hard labor and desire.
There's something called "SPIN-farming" that promotes the idea of using small spaces in people's backyards to be a full-time farmer:
http://www.spinfarming.com/
You could also by Coleman's "Four Season Gardening" for $15 off Amazon.
I welcome this topic and believe it to be of extreme importance to this country's future.
As many know I post quite often on my observations regarding the topic of farming as I see it and work within it here in
an important part of the agriculture areas of Kentucky.
However most of what I post seems to only attract the attentions of the very few others here who are into agriculture. Most I think is dismissed as either doomerism or redneck jabberwocky.
However I still post those observations on the local effects of climate change , seasonal farming periods and other aspects of this. Workers,cost of fuel,grain trucking and so on.
Right now I am entering this as I sit in a farmers workshop connected via a DSL modem and all the PC gear I have installed and maintain for his operation. So I am 'hooked' in though I no longer actively farm my land.
I believe that to find true values for the number of farmers some definitions are going to have to be made as regards the very generic term of 'farmer'.
So let me add a few for others consideration.
First you have landowners. And among them you have ones whose land contains very little tillable ground yet they will enlist themselves as 'farmers' with the governments USDA and it partners programs(extension office ,FSA,etc). They do this for tax purposes.
Then your have landowners who have varying amounts of tillable land. Some may be locked up in soil bank programs and not being farmed but are titled as 'farms'.
Then some landowners may be farming their land and some may be cash renting it out(more common) to what is termed by the IRS Schedule F as 'operators'.
Within the number of 'operators' you have those who farm land they rent, farm their own land and some of others and various mixes which can change somewhat as they expand their operations.
Also you have those termed farmers who do not cultivate and produce grain or other crops. These can be dairymen. They can be cattlemen and some may raise sheep or goats and some do confinement feeding. Again they might or might not be considered by those who do the counting as 'farmers'.
So its daunting to mine the relevant data as exactly how many do which of all that is placed under the generic term of 'farmer'.
Also those who do confinement feeding may produce feed crops for their own feeding, sell the output of the confinement process for spreading on their or others fields as fertilizer.
Farming then is a very varied area to understand.
In my friends case he owns a few farms and rents some land both on shares and cash rent. He farms a tad over 3,000 acres and also has a side business of hauling and trucking for other local farmers as well as himself.
Ok..enough of that.
Here is one point I have made in the past. When I lived as a youngster with my grandparents they farmed 100 acres of which only about 50 were 'cleared'. On that farm and others in the past they raised 14 children, one of which was my father. They did it without the 'slave labour' aspects some speak of. It was a very healthy life and I flourished in it. We were going thru the back end of the depression and then thru WWII, yet we had plenty to eat and did very well.
The farm was sharecropped as my grandparents did not and never did own their own farm.
Now today. My friend is divorced and has one son. He has difficulty even providing for his and his son's livelhood and thats running a 3,000 acre operation. He does manage to keep some employees but pays minimum wage doing so.
He does not live but other than a normal lifestyle. Not opulent or ostentatious. The comparison is astounding to me!!!
Currently we are at a slow period due to the season. Its time to repair equipment. I have a bin blower to fix and a chain saw to repair and some radios to replace. Check out some wireless gear and update one of the big tractors radar gun or replace it with a GPS unit to measure acreage input/output from the tractor computer.
My opinion is on TOD we need to more closely hue to what is happening in agriculture and thereby be able to make wise plans for the future and to raise the 'hue and cry' as we can.
As another in a Key Topic said..this is really the Age of Agriculture and not the Info or the Industrial Age.
We need to concentrate very much on the future and present of agriculture. Our very lives depend upon it.
airdale-wondering how many on TOD are real farmers or work in that area
I attempted to grow 40% of my own food this year, though in the end it will be about 15% - but I did give alot away and my freezer is still jam packed. So if I HAD to (as opposed to getting sushi, thai food at restaurants, etc.) I suppose it would be close to 40%. I shot 2 deer (sigh...), had 38 tomato plants (20 too many) 9 varieties of squash, kale, carrots, parsnips, hundreds of pounds of potatoes (but had bad larvae beetles that ate a good deal of them), lots of garlic, beans, cucumbers coming out of my keester (not really), lettuce, spinach and 3 acres of clover/feed for deer. It was a start - MOST importantly, it was a) a foot in both worlds and b) I really enjoyed it - though the harvest was a lot of work.
BTW, I haven't seen it posted but Nate got a mention by Pimentel in the December 17, 2007 issue of Chemical and Engineering News, the weekly news magazine of the American Chemical Society. The article is entitled "The Cost of Biofuels" and is a debate between Bruce E. Dale of the U of Michigan and Pimentel. I'd proved a link but the article is behind a paywall and I only get the printed magazine. Yup, I'm a member of ACS.
The Costs Of Biofuels.
I can't find a 'lets make growing food illegal' claim outright - so I have to use this link instead.
http://www.rawcuisine.co.uk/whats-happening-to-food/codex-alimentarius/
(I hope the codex alimentarius objections are just tin foil hattery VS a real problem)
I am actively looking into acquiring 20-60 acres of farmland/woodland here in western WI with the hope of beginning a modest farming operation while I continue to be employed as a EE. I have read some books and obtained the local county soil survey from the USDA, but I am having trouble understanding the different soil types and their implications.
Could some one here recommend a few books on soil geology, land purchasing and soil improvement, applicable to the loamy sands found in this region. Also, how important is shallow bedrock (sandstone) to farming? Any advice would be greatly appreciated and I will try and put it to good use.
Regards,
Andy B
I live in central wisconsin and the soil is poor. Its called 'oesterele' soil and is left over silt and sand with a water table 3 feet under the surface. i worked hard to get a small plot of 'renewable' soil that won't require amendments all the time. Heres a link to soil maps of wisconsin. If/when fossil fuels become less freely available, soil and water land will be worth much more than adjacent land with poorer soil and water. My girlfriends dad lives near Mississipi River near Minneapolis and has 10 feet of topsoil in his apple orchard!!!! Would take a while to deplete that. Good luck in your search. Shoot me an email on what you find as Im doing similar searches myself...
Also, I would shop for good neighbors right up there with soil and water, etc. (though this is not such a transparent commodity)
IF you can't find it or someone else does not post the link to the 4000+ on-line old ag book collection, I'll dig it up.
Other rabbit holes for you to go down:
Hi brix gardens
The australian soil and health archives (has sir howard's works)
The works of the soil food web group
Aceers USA/Rodale group
Spend some time with fungi perfecti (Stammets)
And lastly - be aware of the arguments of the pro rock dust crowd.
Andy,
Depending on your location, UW River Falls has quite a lot of information on soil/sustainability and is even hosting a conference in January. It's geared toward ag professionals but anyone can attend.
http://www.uwrf.edu/pa/2007/0712/1207072.htm
Thanks Folks,
I have noted the links and will begin to dig through the info this vacation. I'm looking in Eau Claire and Chippewa Counties (WI) and will see what info is available locally. The best thing I've found so far is the Web Soil Survey Tool
http://websoilsurvey.nrcs.usda.gov/app/
This tool lets you select a region of interest (ROI) and overlays soil types on some excellent aerial photos.
Soil choices are quite limited however, within commuting distance to Chippewa Falls.
Cheers,
Andy B
Andy - I'd really suggest that you talk to the extension agents in the areas where you are looking. I grant that most of them are production ag oriented. But I know a number of them in where I live and they are all really good people who want to help...even the homesteader.
One thing I would do is clearify in your own mind what you want to accomplish, i.e., fresh eating vegetables, storage vegetables, animals (and why). In other words, it will help them if you have a "business plan" so your discussion focuses on what you need to know.
Todd
My wife has been by the local USDA extension office and they gave her the Eau Claire county soil survey for free, with beautiful aerial plates and much background info. I will take your suggestion and stop by once I have done a little more research on my own. Most of the farms here are hay and dairy, though that may be because dairy is more lucrative?
My initial plan would be to start fairly small with a large intensive vegetable garden (I have some nice raised beds now in my backyard), chickens, and a couple of goats. Concurrently I would like to begin cover cropping and experimenting with some grains (barley, oats, wheat?), mainly to build the soil. Eventually in a few years time I would like to have a small sustainable farm, maybe even for local market. But foremost a more self-sufficient, productive (elP) lifestyle. I have been gardening for years and now help out on a local organic farm a dozen or so weekends per year - which I enjoy greatly. I don't know if I could handle their workload though, and they are in their 50's.
Regards,
AndyB
A simple answer to your question.
You must have good soil. If not your going to be wasting huge amounts of time and energy. Best to first find a good soil type, search the USA for where its at. Go there and check it out.
All the data is available.
Why Wisconsin? Why chose an area thats not suitable?
You need good access to good water. Good soil. Good growing seasons. Perhaps some wooded areas that are not just trash trees. Good hickory and oak. Good hardwood for heating and cooking. Land that drains well as bottom land can kill you.
Not too rolling either. Gradual is fine. Totally flat is not that good. A high water table can be bad as well.
You will also need some soil samples and check if it has a hardpan layer,called I think a 'fragipan'.
Springs are nice to have around. A good clear flowing creek is nice. A good pond or two is even better. A well that is not polluted.
Airdale,
I am quite disappointed to hear you say that farming in WI is a waste of time and energy. The farm I help out on south of Eau Claire here has totally denuded sandy soil, from years of chemical corn farming. They have a beautiful farm though, but mainly they raise chicken broilers. They have horses and goats (and other paying jobs) and we work hard to spread their manure on the vegetable fields in the spring.
Leaving WI at this point just doesn't make sense for me. I am lucky enough to have a good paying job for the moment and a daughter in high school. I would like to build up the farm infrastructure while I am still earning money and not too old - not waiting until my retirement or inevitable layoff. We are also tired of moving around the country following work and very much like the people we've met here in WI. There is ample freshwater here, low population density and a farming culture in place here already. No place is perfect, but if people here at TOD tell me that I am wasting my time on Billett sandy loam or Plainfield loamy sand then I will probably heed their advice. I was hoping that cover cropping for a few years and maybe adding terra preta (effectiveness on sand?) or rock fines as suggested, would help somewhat. I know it has been very hard to build the soil up at the farm I work on near here, but they have enjoyed some success. Woodlands here are mostly oak, birch, white pine in sandy wash areas and other trees I don't know. Maybe only really suitable for longterm sustainable grazeland farming - low density per Gene Logsdon?
Soil CAN be improved, with work. Neighbors are more important, and cannot be improved, easily.
While I agree that I cannot change my neighbor's behavior, I do think that mutual cooperation will become an essential survival trait among neighbors in a post-peak world. Once you've headed down the "pure defection" path it is hard to reconcile and make amends, but there will be a strong incentive to work together to ensure survival.
With today's market economy and the "false consciousness" it creates separating interested parties, natural cooperation is less important among neighbors, but I hope that will change as more direct and frequent barter interactions occur between individuals. That is my hope anyway.
Andy B
Airdale,
I am quite disappointed to hear you say that farming in WI is a waste of time and energy.
To be dissapointed you would have to value what he's had to say.
Go read EVERYTHING he's had to say. Notice the parts about 'survival off of forest forging' and how hydrinos are real.
He's right - even when one can quote other sources showing Airdale is wrong. For people to be successful somewhere else means he might have made a poor choice (and be extension be wrong)
here at TOD tell me that I am wasting my time on Billett sandy loam or Plainfield loamy sand
While plenty of TODers know alot - having a group of people tell you some land sucks while never having seen it.....why would you believe that?
There is ample freshwater here,
Water you can get to, pump, and is not full of toxins may very well be more important than anything else.
longterm sustainable grazeland farming
Is your goal to make farm-based products to export, or just feed yourself/family? If it is feeding yourself - farm animals concentrate organic matter you compost then add to your garden may be your best plan. Alfalfa will take sub-soil minerals, bring them up 50-75 feet to the topsoil (like trees leaves) so you can feed that to your critters, make green manure, or chop/boil and make a human-grade green tofu like material.
Hey Eric,
Since I'm relatively new here and I'm curious, exactly what is this anti-Hydrino bias you have all about ?
I'm mean, since we don't have a unified physics theory and all.
Your right of course - I should learn to trust my own experience and judgment more. TOD has provide such an incredible wealth of prescient information and analysis that it is easy to get carried away by the aura of omniscience. New Year's resolution - think more independently.
My goals are as you state - mostly to feed myself and family, but hopefully to be able to produce some food for market to help offset taxes, etc. I'll look into alfalfa, but up north here it doesn't grow as well because of the lack of dolomitic limestone found in the southern part of the state. I would probably need soil amendments.
While this is an interesting analysis, it oversimplifies in one important respect: People don't neatly fall into "farmer" and "non-farmer" cubbyholes. In particular, there are two intermediate categories that also must be considered:
1) People primarilly engaged in farming, but that also engage in some non-farming employment. They must do this to make ends meet, otherwise they wouldn't be farming at all.
2) People primarilly engaged in non-farming employment, but that also grow some food on the side (mostly gardening, and maybe some small stock raising). (I'd put myself in this category, quite a few others here on TOD might also place themselves here.)
The lines between these two categories are not hard and fast, though it is actually pretty rare to find someone that is maintaining exactly a 50:50 mix; most people lean to one side or the other.
In the US, at least, I suspect that some people classified as "farmers" actually fall in that first intermediate category above; it is getting pretty hard to make a living doing nothing but farming, and quite a few farmers do need to have something else going on the side, at least for part of the year.
It used to be that a very substantial portion of the US population would have fit into that second intermediate category. I would venture to guess that in a place like Russia, where many city and town dwellers work an allotment in a community garden, it probably represents well more than half the population.
My point is: As things pan out, it is not going to be the case that non-farmers are suddenly going to become farmers. That is a good recipie for starvation. No, what is going to happen is that increasing numbers of people that formerly grew NONE of their own food are going to start growing SOME of it; they are not going to give up non-farm employment, but will need to supplement their earnings with home-grown food to make ends meet. As this trend progresses, some people will become good enough at raising crops or livestock that they can buy small holdings and get into growing food in a more serious way; they'll still need something going on the side, though, to make it work financially. Finally, as some of these people become more successful as farmers, and as the demand for locally-produced food becomes more urgent, some of them will take the plunge and get into farming in a big enough way for it to become a full-time occupation.
This transition will require a couple of decades, maybe, but probably not much more than that.
The United States cannot afford any more farmers. We already pay the 2 million farmers $50 billion in subsidies. If we had 50 million farmers, that would be $1.25 trillion! If you think that the government prints too much money now, just wait until you get more farmers, all of them with their hands out.
The United States cannot afford any more subsidized "farmers"
A better metric for the graph would be "% of productive work time devoted to agriculture" for the country as a whole. But I doubt such data exists...
I am not sure how to respond to the comments about data quality and definition of "farmers." I am aware of the difficulties applying the term and so my initial thought when doing the analysis was that it would possibly be absurd. When the relationship actually stood out I was pleasantly surprised.
But, I may show something else on a future post that brings up some issues regarding the accuracy of census data.
Hey, it's really a no brainer. One farmer with two horses can produce a cash crop of cotton or something else, then enough food to feed his livestock and perhaps one or two other families. One farmer with an eight row tractor and all the mechanized farm equipment to go with it can produce enough food to feed at least one hundred families.
Why is there even a question here? The green revolution is a direct product of all that extra fossil energy. And all that extra energy means a lot more food. And all that food means a population explosion.
Ron Patterson
I suppose the key question is can we feed 300 million plus with declining fossil fuel inputs? I think that is where the Victory Gardens and farmettes come in.
I think it more likely that the US will simply stop sending food abroad and confiscate the energy required to continue industrial farming.
The famines abroad will simply not be televised.
We can, but maybe not at 3500+ Kcal/day, and maybe not with beef being what's for dinner very often. You are right that Victory Gardens (including replacing most lawns with potatoes or something), and smaller scale ag surrounding most cities and towns, will be absolutely essential.
Thanks for great article.
I was many times thinking how to estimate a EROEI for the whole country and society. I came to a feeling that the fraction of the population, which is directly active in the agriculture activities, has to be related to it.
Your graphs are only supporting my thoughts. Prior the industrial revolution there were at least 80% population always active in the agriculture despite of historical time and continent.
This estimation based your graphs is indicating that EROEI is at about 50 in US and most developed countries and barely above one in such countries like Ethiopia. It seems to be in agreement of estimation of EROEI done by other means.
M
Here in Iowa a switch to locally produced biodiesel would not be that difficult. Farm equipment that uses gasoline is limited to antiques. Farmers almost exclusively use diesel even in their pickup trucks.
There are a few changes that would be a big help in keeping the young folks down on the farm.
1) Eliminate property taxes. No more losing land to the taxman. This 11th century relic has no place in the 21st.
2) Universal single payer health care. The self employed simply cannot afford health care costs.
3) Let farmers borrow borrow money at the Fed discount rate. No more having bankers make more profit on a bushel than the farmer. Unlike the paper wealth of Wall St farmers actually create real wealth from the combination of their labor, use of natural resources like sunshine and rainfall, and their ingenuity.
4) Use the surplus biomass farms create as a replacement for some of the coal now used to generate electricity. This would create a new product from farmers at no extra cost to them.
4) Use the surplus biomass farms create as a replacement for some of the coal now used to generate electricity. This would create a new product from farmers at no extra cost to them.
This takes and ships more "soil fertility" off the land, and said biomass would be less energy dense (unless it was plant oils) per cubic volume than 'then usual FF suspects'.
However, I think #s 1 through 3 are splendid ideas. Which means they have no chance whatsoever making it past those who would lose their ill-gotten gains if they were implemented.
PLAN, PLANt, PLANet
Errol in Miami
Would it be possible to return the ashes to provide chemical nutrients? Haven't researched this myself.
There are feedback loops in the agribusiness sector just as there are feedback loops in other sectors of the economy. As the scarcity of fuels - and thus the price - increases then the price of agri products including food will increase. The higher commodity prices for farm goods will drive the market for more farmers. Many high schools have FFA (Future Farmers of America) vocational agriculture programs. Likewise, there are many vocational schools and colleges with ag programs. As the price of farm commodities goes up so does the incentive for more young people to get into agriculture and get the required training. The same held true for the technology sector in the past decades. More young farmers will be tilling smaller acerages and making a decent income doing so. The economics of scale will change - to a smaller scale in this case - as the higher input costs of fuel and fertilizers coupled with the higher price per unit of agriculture output will make small farms practical again. In India, for sure, there are thousands of small farms, many only a few acres, that are highly profitable. Even small farmers in India are able to earn a decent living. They do so with significantly lower energy inputs than in the USA. These feedback loops work best when there is a fairly gradual transition from say low fuel costs to high fuel costs. If a sudden "energy shock" happens, however, that could result in food shortages since new farmers will need a number of years to "ramp up" and become productive.
Daniel Draffen
Source.
This is such a sad situation.
Indian farmers were encouraged to buy new, hybrid and GMO seeds using credit, they were encouraged to buy artificial fertilizers using credit. They were encouraged to deepen their wells, add pumps and irrigate more, using credit. As water tables plummeted they needed more fuel for their pumps...on and on.
Yields improved, prices fell, compound interest did its thing...
And now, in many places these poor farmers are being asked to leave so industrial parks can be built instead.
And now, India is having to import grains.
It absolutely is.
However, it's worth putting it in perspective. The suicide rate in the US is about 11 per 100,000 and the agricultural population in India is about 500M (~50% x ~1B), so a similar rate of suicide among Indian farmers would give us 50,000/yr = ~150/day.
So the rate of suicides among farmers reported in that article is likely to be a fairly low fraction of the total. Indeed, that's exactly what we see in studies such as this one. Moreover, it appears that suicide rates in India have not increased in recent years. A 2006 study estimated the rate at about 92 per 100,000, which is the same as in the period 10 years previously, according to this 1994 study.
So, while desperation and suicide among Indian farmers is certainly tragic and the international community should most certainly assist India in alleviating their suffering, that's been true for decades.
only on theoildrum.....
Do you have any idea how things would be going if they hadn't made changes? Especially to the overall food supply in India. Are you certain there wouldn't be a need to import grain given growning population if farming practices hadn't changed?
Just a question. I'm torn what to think in these debates and think emotions and opinions are easier to find than facts.
Perhaps intensive curtailment of fertility would avert catastrophe, perhaps not. In general, famine might come sooner if ag productivity is not increased.
When ag productivity is increased, famine comes later but by then the population is much larger, hence the total suffering is greater.
The choices of one generation to continue growing, avoiding limits to "rights" and to "suffering" basically make it inevitable that future generations will have fewer rights and greater suffering.
I am trying not to be emotional about this, and not to blame, because it is a catch22 situation, but I am not always successful at that.
As long as people are unable to get along well, be honest, and look at hard choices, I guess we'll be faced with these dilemmas.
Thanks for your response.
Eric in Auburn CA
"The economies of scale will change"
Yes, look at highplainsfarmers argument.
Here's where I find myself, and please everyone poke as many holes in this as you can, my mortgage depends on it.
On 18,000 sq.' my friend and I can grow, harvest, process and deliver 200# of mesclun per day. We deliver and grow for $50 worth of diesel. we sell it for $4.50/ pound which splits the highs and lows of the areas major food distributor. I've told the restaurants if the price of fuel doubles we'll only raise the price $1.
So if the price were to double we would actually make $150 more per day and I could safely say we would be delivering at $2/ pound less the distributor.
I have not actually achieved this but it is part of my 3 year plan.
Do you have any other inputs besides the diesel? They will all get more expensive as energy prices increase. That ranges from fertilizer to your phone bill.
thanks for responding
I'm pretty tight, our local jr. college has a horse manure problem, there's decomposed granite all around, I'm trying to get a comfry patch established, I green manure 2 acres to feed my 3/4 arcre veggie plot.
I've been purchasing the seed and I need to use row cover to keep the flea beetles out of the brassica. I have a 10hp bcs tractor, diesel, that needs money thrown at it occasionally.
my big concern is, is this even humanly possible, seems like a big commitment, alot of opportunity to disappoint high end chefs. I'm sure someone here has tried this, or knows someone who has.
I can't say I've been there and done that, but diversification ("don't put all your eggs in one basket") is time-tested wise advice.
thanks
I've got some other things going, garlic looks good (try to find seed garlic for under $15/ pound. outrageous). I'm just trying figure this out. The marketing side of this project is the challenge.
i just go to the farmers market and buy quality edible garlic and plant it.
Cost about 1/3 the price of seed garlic and there's no shipping charge. Spent $200 this year on garlic and should produce several hundred pounds.
sounds like it regionally adapted as well.
Hi Earl,
Well, we've posted back and forth on this before but my experience might be of interest to others.
We were the first certified organic "farm" in my area in the 80's. Our main crops were tomatoes and strawberries although we sold small amounts of other crops. We had the market to ourselves but eventually shut down. Why?
1. We were only making day wages which is essentially what you are doing. Our choice was to either expand for a lot of money (we needed far more extensive greehouse space to catch the early tomato market). We were setting out plants in full bloom when everyone else had little starts in 4x4 containers.
2. We couldn't get workers at minimum wage to pick berries or at least not pick ones that weren't ripe. I even spent a lot of time and money setting up an organic hydroponic system where the berries were grown in 6' long grow bags suspended from an overhead support system as a test.
3. Small-scale farmers cannot compete because of the ecomonies of scale that large growers have. I want to make a point here: It isn't that you can't make money but rather that you can't make sufficient money to do it full time. Unfortunately, it is full time for practical purposes.
Finally, in your case: Ok, you've established a high end market. Is it going to last long enough to at least cover your capital costs to date? Can you make enough money if that market dies with your existing crops or will you have to switch to more commodity oriented crops that are less profitable?
As you know, we eventually shut down. I designed and built houses for several years (along with being a substitue teacher in the off-season) until my body said enough. I then became the groundskeeper for our school district. I was the first one so I had a free hand. It beat the hell out of being a small-scale certified organic farmer - I could still set my own hours, I got a paycheck I could count on, I got full medical, I got a defined pension program and I was left alone to play with my ag ideas (granted sports turf not food crops but I was still growing stuff for my wife and I and friends).
I don't know what you glean from this. But, there it is.
Todd
What a heartbreaking story. Ever bit of it rings true.
Which is why I sell excess produce to friends under the table.
Todd as usual thanks
"Finally, in your case: Ok, you've established a high end market. Is it going to last long enough to at least cover your capital costs to date? Can you make enough money if that market dies with your existing crops or will you have to switch to more commodity oriented crops that are less profitable?"
This is exactly why I think this is the right strategy. If the market for this dries up, I think we are living in a different world. I'm doing my best to not be delusional about this but the more criticism the better.
Why couldn’t an alternative energy reduced future agricultural scenario be greater industrialization and professionalization (no slam on today’s high-tech farmers), so that fewer corporate units farm greater acreages for gains in efficiency – higher output and lower labor inputs?
That seems to have been the trend for nearly 100 years.
The overall number of farms, farmers, and farm workers, however defined, in U.S. agriculture has been declining. Here’s a snapshot from the USDA: In 1910 there were 6.4 million farms and 13.6 million farm workers. In 2000, there were 2.2 million farms and about 3 million farm workers.
And production has increased over that time. For example, for All Wheat, 45.8 million acres were harvested in 1910, with a yield of 13.7 bushels an acre, for a production of 625.5 million bushels. In 2000, 53.1 million acres were harvested, with a yield of 42 bushels an acre, for a production of 2.22 billion bushels.
Sources: National Agricultural Statistics Service
Is the argument that an energy short agriculture future means a less mechanized, less corporatized agriculture where the price of energy is so high that multi-story combines roaming millions of acres are substituted on a cost basis with massive numbers of individuals in localized agriculture?
What is the price of energy that yields that result?
Hilary Smith
Hello Jason and Nate,
Thxs for this keypost--well done. IMO, Nepal can be an instructive example of what lies ahead postPeak for most countries as Nepal must import all non-organic fertilizers and FFs:
http://en.wikipedia.org/wiki/Economy_of_Nepal
---------------------------
Labor force - by occupation: agriculture 81%, services 16%, industry 3% -- Unemployment rate: 47% (2001 est.)
Imports - commodities: gold, machinery and equipment, petroleum products, fertilizer
------------------------------
It all starts with water, seeds, and NPK: the amount of job specialization is dependent upon food surpluses. Recall the Nepalese posts by Leanan: long lines queued up for fuel, and other dire effects. Since Nepal is a high altitude, landlocked geography: the sheer physics of importing FFs & NPK from sealevel-on-up is working against them. I would suspect that they might have the highest prices globally due to this low ERoEI geo-physical logistic reality of importation.
Thus, IMO, it will be very difficult for Nepal to lower their agricultural employment rate; in fact, as FFs & NPK become even more expensive, I would expect even more people to return to the ancient ways. I am unaware of the degree of sustainable farming in Nepal, but from this searchable database link on fertilizer imports by country:
http://earthtrends.wri.org/searchable_db/index.php?theme=8&variable_ID=2...
---------------------------------
NEPAL 10-year fertilizer imports [Units: Thousand metric tons]
1992 73.6
1993 95.0
1994 96.6
1995 94.0
1996 103.0
1997 108.9
1998 121.5
1999 94.4
2000 76.7
2001 77.5
2002 55.6
---------------
Is Nepal already far postPeak in terms of NPK?
Possibly the best thing to do in Nepal, besides full humanure recycling and localized composting, is to put the massive numbers of their unemployed to work portering NPK uphill with bicycles and wheelbarrows as there is no substitute to these Elements. I would suggest they get going before food surpluses shrink so low that no job specialization is possible.
Bob Shaw in Phx,Az Are Humans Smarter than Yeast?
Something I've wondered about biofuels is whether they could provide fuel for ag - and leave it at that. Would the 400k barrels (or whatever it was) of ethanol produced in 2006 be enough for the country's tractors/combines/farm trucks? Make that biodiesel while we're at it. Yeah, I know it was all fueled by NG/diesel anyway. But anyway - how would that stack up against the biomass requirements of the equivalent amount of livestock? Could farmers produce enough fuel for their own needs?
Or should we just assume there'll always be a few kbpd of oil to kick around - or that farmers will find it cheaper to go electric at some point?
That neat bubble chart sure is fascinating when you look at it from a fuel crop perspective. It's amazing how peak oil may be forcing the big industrialised nations to become more like the small agrarian nations and vice versa. If you were to draw another set of bubbles on this chart in yellow showing, not population, but wealth, you would have a sea of yellow at one end of the inverse curve that fits through this data with the sea of blue at the other end. If the immense focus on high net energy designer fuel crops produces enough breakthroughs, you may see the wealth hungry sea of blue and the fuel hungry sea of yellow not so separated anymore in the post peak world. It brings to mind one possible reason there could be, as the Bible prophecies about our day, a transfer of wealth from the rich nations to the poor nations. The green of agriculture may become the new green of wealth (blue and yellow do make green).
Interesting article and comments-thought I'd respond to a few. RE: organic agriculture-sounds like you are confusing biodynamic ag with organic- Steiner is the originator of biodynamic ag- some organic farmers are also biodynamic followers and practitioners and others are not. Personally, I think it's interesting, I've been to some workshops, and done some reading on it but still have never filled that cow horn with manure and buried it-maybe I'll try it some day-can't hurt. In any event, organic ag is not hocu-pocus, most is founded on solid principles and it is very effective. As for organic farmers being able to feed the country/world- well one only has to look at Cuba's experience to see what organic ag can do. As for small-scale farmers- in actuality a small acreage is much more productive than a large acreage- the only advantage large farms have is needing less labor due to their ability to use large equipment. Small-scale growers have more labor requirements- but in an energy short world- physical labor will be in ample supply I would guess while large fuel powered machinery might be at a disadvantage. So don't discount the ability of small growers and even backyard gardeners to feed humanity.
RE: farm subsidies- only a very few farmers receive subsidies- most are commodities growers and often not even farming themselves but rather wealthy landowners. The majority of farmers receive no subsidies whatsoever.
The question of biofuels is interesting- it does seem to me that while it doesn't appear reasonable or feasible to engage in large-scale biofuel production in order to fuel soccer mom's driving SUV's to the mall- it would make sense to produce them to fuel agricultural equipment-tractors, combines, etc. So how this could play out will be interesting to see. If biofuels were produced in sufficient quantities and devoted to agricultural production, we might continue to see large-scale ag production continue. Of course the question as to transportation of products then arises- do biofuels get used for the big rigs? How about air transport of food? I doubt at this time we'll see much in the way of electric tractors other than small-scale low-powered ones- seems more likely to see biofueled ones.
RE; kids not wanting to farm- well some do want to but mostly we have made farming out to be a job for losers and a low-paying one at that. Even though I know many well-educated and intelligent farmers(I include myself here), for years the stereotype has been of dumb, redneck hicks-who aspires to that?
Re; farmers and working other jobs- yes, that seems to mostly be the case. Among farmers I know they tend to either have one spouse work off-farm or else one or both of a couple work other jobs as well. It's really hard to support a family on farm incomes these days. For those who need to purchase land it's even more difficult due to land prices. I've had to work other jobs along with farming-the "joke" is always about working to support our farming habit.....
This is just a blanket statement with no support. No one would even to be able to define adequately what an "organic" farmer is. Oh, they might provide you with guidelines, but as for the "solid principles," and the so-called beneficial effects--well, try researching it and you'll find a mountain of PDF files that would tell you otherwise.
Accompanied by a hell of a lot of suffering and privation. And this (the US) ain't Cuba.
Frankly, I strangely look forward to seeing the idea of "organic farming sustaining the world" brought into a public debate. It. Won't. Be. Pretty.
I don't get it
The last three links you posted. did you post them because you take them seriously or because you think people can't see thru the propaganda?
Look at it this way: The links show that the skepticism about "organic" emanates from multiple quarters. My point is that the resistance, if the "organics for the whole nation" idea goes mainstream, will be huge. This is a rare instance of science and anti-science views being in accord. That's scary.
I'm a farmer who has not used chemical inputs in 20 years. But I make no claims about the "superiority" of my produce. I refuse to sell at "organic" prices (besides, I can't, not being certified).
As a friend recently wrote to me: "You have to be rich to be a hippy." (Actually, he says his wife told him that.) The most unfortunate thing that could happen to a legitimate agricultural technique is that it should be associated with "hippies."
You don't see many poor or working-class people at "organic" fairs. Why is that?
I wish I could make my grief more palpable.
What do you think of this group organizationhttp://www.naturallygrown.org/
I think I'm with you on every thing except the SUPERIORITY of the produce.
If you harvest lettuce at 6 and get it to market by 10 the customer gets a SUPERIOR product
maybe you haven't shoped in a supermarket in a while ;-)
as far as price goes, well, the system is broken
You're right. The skeptics website I posted in the long post I made above even acknowledges that FRESHNESS is a key to superiority. "Fresh" applies, whether the food is certified "organic" or not.
But if you peruse the "organics" literature, they attribute all these unsupportable claims about taste, and nutrition, even "healing" properties of "organic" produce.
I haven't had a chance to look at your link yet.
A quick look at the naturally grown website: I'm sympathetic to their reaction to the corporatizing of "organics." They are trying to free small farms from excessive red tape.
But look at this quote:
The superstitions of "organics" carry over into this. "Free of chemicals" is nonsense. Plants are warehouses of chemicals.
"Oh, but they mean synthetic chemicals."
I'm not convinced of the harm of synthetic chemicals. It's just irrational fear. This issue with chemicals is DOSAGE. Aspirin is harmless, even helpful--unless you take a whole bottle. Cyanide you would think harmful--unless you eat residual amounts in nuts.
There's this irrational fear of contamination that I just don't buy. The makers of these chemicals eat the same produce as the consumers. If there were anything to fear, I'm sure they would be just as concerned as the rest of us.
Why don't I use chemicals? I would if I HAD to, but I don't because I have rich soil, and I pamper the plants. Besides, I don't like to spend a dime on anything.
As for the "GMO" scare: I have friends who are scientists, who work in labs, and I have no superstitions around genes.
All domestic plants have been "genetically modified" by humans.
sorry
the industrial ag system and its use of chemicals makes no sense to me
thanks for the conversation
Before you cut me off--
The PROBLEM with chemicals has nothing to do with their reputed poisonous effects:
It's that they're expensive, and once you start using them you have to continue using them.
That's enough of a reason not to even start. I don't need no myths of toxicity to keep me away from them.
CHEMICALS ARE AN EXPENSIVE HABIT.
I've come to realize farm economics and can appreciate your good fortune in not having to start using them. by my estimation, a good yard stick in sizing up a grower.
"reputed poisonous effects" wtf that's why they work, THERE POISONOUS. I've just got a problem with whole thing, I don't think we should be waging chemical war on the bugs and weeds. I don't think our children are going to appreciate it.
It's not that I wouldn't use chemical either, I've got a Canada thistle thing going on that I'm thinking about spraying . it's the systemic use that get me going
I think that you are underestimating the impact these chemicals are eventually going to have. In almost every area that I look, practices that may have been seen to be benign eventually become extremely hazardous. For instance, the modest amount of CO2 from an individual internal combustion engine is leading us in part to global warming because there are hundreds of millions of vehicles now. The pharmaceuticals that pass through our digestive tract are becoming detectable in the environment (http://www.enn.com/top_stories/article/380).
Same thing with chemicals in the food supply. I believe that this will come back to bite us. It sounds like you do not believe that.
This is from a presentation by Hunter Lovins:
------------------------------------
Peak Oil, Climate Change and Business
Free, Bi-Weekly Executive Briefing
www.inspiringgreenleadership.com/peak-oil-climate-change-and-business
sorry, here's that link again
http://www.naturallygrown.org/
Just to make myself clear. I think the organic standard is a joke. It's been watered down year after year and know were just a few years away from organic pepsi. please
Naturally grown, veganic, dark dirt or what ever "marketing tool" you would like to apply to it, may not have healing properties but it also is not known to the state of California to cause birth defects like the crap thats sprayed on "conventional" produce. That seems to be a pretty good argument to me
it also is not known to the state of California to cause birth defects like the crap thats sprayed on "conventional" produce.
Check out this claim on some of the skeptics websites. You might find that some of these chemicals "cause birth defects" according to the dose. Residual amounts? I doubt it.
Like: did you know good ole sassafras--yes, the content of traditional soft drinks--has been banned?
I would like to see those studies to see how much they gave the mice.
The point is not whether genuinely organic - that is, fossil fuel free - food is tastier or better for you, but whether organic farming can feed the world. That's an important question because when the fossil fuels run short and eventually run out, all our food will be organic whether we like it or not.
Given skill and a couple of hours' effort a week, people living in a temperate region with at least 400mm of annual rainfall can produce all their fruit and vegetables on about 30m2 (330 sq ft) of space each. Again, this requires skill, and some energy inputs for bottling during times of harvest to make it through the growing times.
Organic food is definitely more expensive and my off-the-cuff thinking on this is:
a) without cheap fertilizer, it's more labor intensive to provide the nutrient input in an organic operation than in a mechanized one (spreading manure, etc.) and without pesticides and herbicides, doubly so
b) possibly higher crop loss due to insect damage
So I would postulate that organic farming is just more labor intensive and right now labor is still expensive compared to capital. That's why we spend hundreds of millions of $'s extra for a factory just to minimize labor costs. Capital intensive, labor scarce production is the norm in today's model. The whole Small is Beautiful movement pointed out that it is exactly the wrong model if the goal is to employ more people. In that case, low capital high labor intensity is the way to go.
Hard to say whether cheaper labor from lots of unemployed people will lower the price of organic food faster than the increase in its demand will increase the price if (when?) harvests start decreasing due to peak oil. Probably have to make a few scenarios and look at the labor sensitivity in the model.
Peak Oil, Climate Change and Business
Free, Bi-Weekly Executive Briefing
www.inspiringgreenleadership.com/peak-oil-climate-change-and-business
So I would postulate that organic farming is just more labor intensive and right now labor is still expensive compared to capital.
This is an understatement. I spent a few weeks last summer spending hours picking kale in the most brutal heat. People have my age would run away, screaming.
The people that do local dirt farming now are really fanatics in their love of growing things.
What do you mean you don't see poor or working-class people at organic fairs? What about all the organic farmers? We're not exactly raking in the dough you know....
In terms of customers, I have found that when given subsidies to purchse food at farmers markets our low-income WIC customers are quite happy to purchase organic food. They want to feed their kids berries without chemicals and just picked produce the same as more affluent folks do. At present there isn't a level playing field- most of the smaller growers need to charge higher prices-we're not mechanized to any degree, labor, if we have any, is expensive (no illegal migrant workers for the most part out here), and our costs are just higher in general.
I'm not sure why you are so bitter about organic. I'm not a fan of certification in particular-I've been an inspector for certification and realize its limits- and I'm worried as well about the co-opting of "organic" from those of us that made it what it is today- we may need other names- but the product and the process is still something that I will stand behind proudly. Growing organic food is viable, produces an excellent product and can feed the world; of this I have no doubts.
I'm not sure why you are so bitter about organic.
Not about the method, but the slew of accompanying superstitions that accompany it.
The expense of "organic" food is due to the marketing lies told about it. People think they're getting a "superior," "more nutritious," "safer" product. They are not.
I wish we had a new term, because there's no way we're going to be able to exorcise the herds of crystal-rubbing "holistic" schweine that populate the field.
Imagine if "organic" carrots were touted as having the properties of a consecrated host...
See what I mean?
There needs to be a renewed focus on
Soil health
Nutrient recycling
Low fossil inputs
AND THAT'S ALL, BECAUSE THAT'S ENOUGH. These plants don't need no magical properties to be worthwhile.
But good luck trying to sell the "organics" brand to the general public--and the skeptical biologists--WTSHTF.
Why not add "tastier" and "more nutritious" to the list of things we want from our food? The tomatoes at my local store are awful -- tasteless and I wouldn't be surprised if they were less nutritious, too.
I'll grant you that some people assign qualities to their product that simply aren't there (easy to see if you have ever compared manufacturers' spec sheets with actual performance of a new piece of equipment) but it seems to me "soil health, nutrient recycling and low fossil inputs" -- though a good start -- aren't as good as "soil health, nutrient recycling, low fossil inputs, tastier, more nutritious and fairer working conditions." My impression is that a lot of these organic farmers are standing for all six items.
Why not have it all? You say stop when we have the first three elements and I say stop when we have all six. I like my vision for our food better than yours.
-Andre'
Peak Oil, Climate Change and Business
Free, Bi-Weekly Executive Briefing
www.inspiringgreenleadership.com/peak-oil-climate-change-and-business
Maybe instead of talking about "organic" agriculture we need to be talking about "sustainable" agriculture. What I mean by sustainable is that outputs equal inputs [edit: in the sense of their balancing out], there is no draw-down of non-renewable resources, and that the long-term productivity of the land is not going to be damaged or depleted.
I take it as a given that eventually we ARE going to be doing agriculture sustainably, if there are any of us left around to be doing any agriculture at all. We can argue about how long that will take and what the pathway will look like, but I'm not particularly interested in getting drawn into that debate. To my way of thinking, it is more productive to be thinking about how sustainable agriculture would actually have to be done, and how we can get started with it sooner rather than later. I also take it as a given that learning how to do it now, while we might still actually have a little margin for error, is preferable to waiting until our backs are against the wall and we absolutely have to get it right the first time.
I don't have a comprehensive answer describing what constitutes sustainable agriculture. I do know that most of the agriculture done in the US today ISN'T sustainable, which means we are going to have to make some big changes. I don't know if "organic" agriculture is THE ANSWER, but I do suspect that there are a lot of techniques that have been pioneered in the organic movement that are going to end up being part of the answer.
I think you're right. To me it's an ENERGY issue and a LOCALISM issue, period.
But I think even the word "sustainable" has been co-opted, and you'll have to peel it out of the cold dead hands of the "organics" crowd.
agree
I invite you to create a vision for our food that is broader than that.
Of course you don't have to. But imagine if your obviously huge commitment to sustainability were to include "tastier, healthier and more nutritious," too?
Imagine what could we could accomplish if we chose to spread that vision...
-Andre'
Peak Oil, Climate Change and Business
Free, Bi-Weekly Executive Briefing
www.inspiringgreenleadership.com/peak-oil-climate-change-and-business
RE: Labor intensive. . .
We must remember that we have it pretty easy here in the US (and this pretty much applies to most other developed nations as well). We've got a lot of leisure time, much of which is put to perfectly uesless waste, like watching TV. There is plenty of unused capacity for the population to apply to small-scale local food production. If everyone would just work an hour a day each weekday on home/local food production, and 5 hours on the weekend, that's 10 hours per week times most of the adult population (and much of the child population as well - it certainly woudn't hurt them to get away from their video games and dig in the dirt for an hour or so). So we're talking about a potential of maybe 2+ BILLION additional man-hours PER WEEK that could be pressed into service for food production. That can translate into some pretty labor-intensive food production, which in turn implies that quite a bit probably can be done with the limited space available within and adjacent to cities and towns.
Yes, the unused capacity of people is astounding, both in their creativity and their labor...
Peak Oil, Climate Change and Business
Free, Bi-Weekly Executive Briefing
www.inspiringgreenleadership.com/peak-oil-climate-change-and-business
Based on the curve and what I know about these countries, I think there is two effects in play here. The curve is quite bent, with the developing countries above the bend and the more developed countries to the right. This is probably no coincident.
When energy input decreses, the labour requirement increase, and the terning point is about where Ukraine is in the figure. In that case, small machines are used instead of the huge ones used in e.g. Canada. Even a harvesting machine pulled by a horse is orders of magnitudes more efficent than doing it by hand. Such machines do not require much more energy input than manual labour, but production of such machines require an industry outside of agriculture. The nations above the bend those where large parts of the population live outside an industrialised economy.
The scale of the industry needed support an agriculture is much smaller than the size of the current one, and is probably small enough to be sustainable with renewable energy sources. This means, that even with less fossile fuel, a nation like Canada is unlikely to end up like Nepal, even with only a fraction of the energy available today.
Another, but related effect in less developed countries is that when there is no industrialised economy, there is no other place people can make an income, so they have to work in agriculture, not because they are required, but because they offer their labour cheaply to get an income. An industial economy require energy, but it also require infrastructure and know-how that the least developed countries don't have developed.
how local can we or should we get? my guess is we will have a barbell. agricultural goods will be more regional(southwest, westcoast, eastcoast) and more local as in your backyard. getting your goods shipped from coast to coast and from latin america.
I hate people saying that we have to get local. nobody knows how local we need to be. that will depend most likely on how high gas prices get and how your food is shipped. if you food is shipped by tractor-trailer a long distance that probably won't happen during peak oil. "Local" will be whatever gas prices and food prices dictate. the market will decide. all discussions about localization have take into account food prices and gas prices.
John, you've hit on the hideous truth:
One wishes it weren't so.
it's less than most doomers think.
That still needs to be worked out. I have trouble seeing any real rationale for the arbitary limits like 100 miles that are presently all the rage. Florida is farther than 100 miles away from me, but in the winter citrus from Florida is my best bet for fresh fruit. I do agree that it doesn't make much sense for people in my area to be buying citrus from Texas or California when it is available from a closer source. I certainly agree that it is stupid to be flying citrus in from South America in the summertime, especially when we DO have so much local fruit in season then.
In my own mind, there is a hierarchical criteria:
1) Grow what I can myself;
2) If I can't grow it myself, buy it from a local grower;
3) If not available from a local grower, buy it from a regional grower;
4) If not available from a regional grower, reconsider - is this purchase really necessary, or is there a local substitute or alternative available?
5) If this purchase is still necessary, buy it from the nearest producer available.
" have trouble seeing any real rationale for the arbitary limits like 100 miles that are presently all the rage."
I totally agree. I've seen 100 miles. the local organic market tries to source it's food from about 250 miles. we can't forget price. in the end people need to eat. someone who is all organic and makes a lot of money might not worry about higher prices. those on a budget might. it's all about oil prices and food prices.
http://politics.reddit.com/info/63na7/comments/
thanks for your support...
Haven't read many posts so I could be repeating what others have said..huge inroads to the problem could be made by urban rezoning and replacing much animal protein with plant based.
Suburbs tend to be in good soil and rainfall areas. The landscape has also been 'tamed' so take away half the McMansions and the soil could be worked by low powered battery tractors. Cut our intake of meat and dairy to say 100 grams per day and stretch that with nuts and beans. Configure the layout between housing, small farms and transport corridors so as to minimise energy and recycle grey water. The farms will have the size and know-how to easily outperform backyard growing while still being 'local'.
Big shots could drive their plugin hybrids to the city centre while others ride bicycles to their low paid jobs in the fields. Nobody starves though. Problems are who gets to be a big shot and if governments will accept less property taxes.
Paul Craig Roberts and others discuss the demise of the American dollar.
http://www.informationclearinghouse.info/article18934.htm
What a wonderful analysis, and thank you for putting together the fascinating graphs.
Would it be unbearably churlish of me to observe that my name is "Astyk" not "Astyx?" I find I rather prefer your spelling, actually, but it is probably too late to change all the documents bearing my name ;-).
A couple of observations. The first is that in my own case, my own claims are based only partly on historical norms - the other part is upon (a much less detailed) analysis of present day lower energy trends in lower energy nations, rather like yours. But I tend to think that both models have their problems - globalization over the past decades has radically reshaped world agriculture in ways that are unlikely to remain the same when the costs of shipping things around the world rise further. So while the percentage of farmers is sometimes telling, sometimes it reveals things like World Bank pressure into commercial agriculture, or government policies about food importation and dumping more than it reveals anything about how many farmers are *needed.*
It is interesting to note that the former Soviet Interim leader recently argued that the Soviet collapse was at least partly caused by a combination of rising importation prices and too few farmers on the land. One line of inquiry I've been pursuing personally is the Russian model - here you have a fairly highly industrialized model, and a policy of moving people away from agricultural careers - it would be worth asking exactly how many people went back to agriculture and horticulture in the post Soviet period.
Which of course, brings me to exactly what is a farmer. As I understand it, Heinberg and I use the term, and get our numbers, slightly differently. That is, I'm using farmer as an umbrella term for political and aesthetic reasons, whereas Heinberg is calling for 50 million commercial farmers on small farms. My own personal presumption is that a majority (what majority I don't know - I haven't tried to figure it out, honestly, and don't really have a preference between, say, New Jersey getting its food from 3 million additional home gardeners with 200 square feet of garden or from an additional X number of larger farms of X number of larger acres) of those new agrarians will be people subsistence farming/gardening/horticulturing - call it what you want - on existing, subdivided housing lots, in community gardens, or in walkable existing spaces near their homes. That is, most of the new farmers won't be farmers by the present definition at all. We'd call them gardeners. I call them farmers because that's what they are called in poor nations, generally speaking - someone who does agriculture part time, subsistence farms, or produces supplement income on very small acreage are called farmers in most of the Global South, and in fact, were called farmers in large chunks of the developed world until recently.
So at least to be relevant to my own analysis, your numbers would probably have to include people not identified as professional farmers - and some analysis of how the classifications were made. It is easy to overlook these people, and lord knows, running the numbers is hard enough, but it is worth noting that food produced in gardens, by non-full time professionals can be an enormous part of the available food - the obvious number is the 40% of all produce produced in home gardens in the US and Britain during WWII, but there are nations with higher numbers still. The UN FAO notes that 2 *billion* people (as of the late 1990s) were feeding themselves based on small scale, low input "backyard" and marginal land agriculture worldwide. These include many people whose nations don't count them as farmers, and it is extremely hard (I've tried) to figure out exactly how the proportions shake out.
As for the scale of the transition - enormous, of course, but consider the transition to computer work. At 35, I'm old enough to remember my step-Mom training to repair computers, and listening to her wonder whether desktop computers would really ever spread far enough to keep her in business in the long term, and to the laments of people who said they'd never use one at work because they had other people to type for them. And yet, a generation or so later... It is difficult to imagine such a transition - unless, of course, there was money in it - unless yahoo started running stories on the hot new agricultural careers. And there will be money in it, I suspect - no matter how the transition goes, we'll need to train a new workforce fairly soon (that is, the farmers really are that old), we'll need to make use of some of the land that we paved over and put tract houses on (that is, Pimental and Gampietro's analysis really does put us at .6 acres per person and 1.2 for a veg diet), industrial agriculture's yields really have started to fall overall, and Pretty, Rosset, the FAO and the World Bank's Ag arm really have more or less come to the consensus that for total calories and nutrition on a piece of land, small scale, low input polyculture really is substantively more productive than industrial agriculture. How many farmers vs. gardeners this will get us, I don't know, but the choice more or less becomes clear - find a magic bullet to fix the land degradation, toxicity and declining returns of the industrial system, pick a new system, or starve.
This is a very good and useful analysis - I'm delighted you are doing it. Thanks.
Sharon
Oops, sorry about the name thing. I'll ask the TOD High Priests to correct.
You and I are obviously looking asking the same questions and you are probably further along than I am since you have been both growing food and writing a book about it longer. So thanks for your input and I'd like to get your thoughts about future studies I am pursuing (given the 3 months or so I have time for this).
She means, "yields are falling in terms of yield per acre and per tonne water, fertiliser, herbicide and pesticide."
It's still not true.
We know yields have been rising strongly per acre and overall; what about the levels of inputs?
Pesticides: stable or falling
Fertilizer: stable or falling
Water: stable or falling
It took about 90 seconds to find that information on Google; what on earth didn't you check before you started spreading disinformation?
In the first place, your links refer only to the US, not to the world; both Sharon and myself speak of the world, not just the US.
Secondly, it helps to actually read the pages you link people to.
Your first page says,
In other words, they're applying more stuff for less good results; that is, yield of crop per tonne applied pesticide is decreasing. It's also noteworthy that GMO crops which contain pesticides aren't classed as "pesticide use" but in fact they are. You can't really say, "oh look we're not using pesticides!" when your crop has the pesticides in its very genes. With the spread of GMO crops, we'd expect applied pesticides to drop.
Your fertiliser link does indeed show that fertiliser use is stable or falling in several categories. But at the same time, yields per area planted have stayed steady or dropped. If you look at the FAO estimates for 2007, you find that while the estimated cereal crop in North America for 2007 has risen 5.4% on 2006, US area planted was increasing 3.5-4%, and Canadian area planted was rising 5-10%. In the EU they're increasing planting area by 6%, but expect yield increases of only 1.9%. In Russia they're planting 5% more land, and in Ukraine 10% more, yet overall CIS forecasted crops will be down 3.4%.
Overall, in regions with high fertiliser and pesticide use - US and Canada, EU and CIS - they're using the same or more fertiliser and pesticide, yet getting lower yields per hectare than they used to. The world's producing more grains than ever before, but this is coming from planting more area, not from fertilisers and pesticides.
Your third link about water again speaks only of the US, and gives data up to 2000. Seven years have passed since then, and seven years can have a lot of change - after all, we had WWII in less than seven years. Around the word, aquifers are depleting.
When you send more than 90 seconds researching something, you then realise the issue is more complex than you at first thought.
I am not numerically illiterate, nor am I deliberately obtuse.
Again, we're speaking of the world, not merely the US. The world does not have "weather fluctuations" over the course of a year or several years, the world has "climate." And the climate is changing, affecting crop yields, for example the recent drought in Australia taking a big chunk out of our grain.
When looking at things worldwide, countries are planting X more hectares and getting X/2 more grain from them. That's a dropping yield per hectare. The causes of this are decreased return from fertiliser, pesticide, herbicide, aquifer depletion and climate change. Thy're having to put more embodied energy in to get the same amount of grain out.
This does not mean, of course, that we are all headed for global famine. Famine which takes millions of lives takes a deliberate effort in the form of civil conflicts combined with murderous dictatorship.
I was mostly adding evidence to bolster SS's graph; however, if you have evidence that world yields are behaving substantially differently than US yields, please provide it.
Not according to their graphs it's not. Indeed, it's instructive to look at the quote you provided:
"As a result of this increasing resistance, combining pesticides, increasing applications, or substituting more expensive, toxic, or ecologically hazardous pesticides occurs more frequently."
They're not saying more pesticides are being used - indeed, they can't say that, since the numbers say the opposite - but rather they're saying that it is more often the case now than previously that anti-resistance measures have to be taken. So higher applications to combat resistance are more common than before, but overall applications are still down.
If you actually look at those estimates, here's what you find:
"Favourable outlook for 2008 wheat crops
With the winter wheat sowing in the northern hemisphere virtually complete, the latest indications point to a significant increase in the world wheat area for 2008. In the United States, early tentative estimates put the winter wheat area up by about 3.5 to 4 percent from the previous year, in response to high prices. The spring wheat area may also increase if the price incentives for this crop at planting time next year remain relatively better than for competing spring-sown crops. In Canada the wheat is predominantly spring sown but early indications suggest plantings may increase by some 10 percent after a reduced area this year."
You've misunderstood area increases for 2008 harvest as applying to the 2007 harvest. Canada, for example, had lower area devoted to wheat for 2007.
Not to mention, of course, that we're talking about long-term trends here, as yields will fluctuate year to year.
True, but long-term trends tend not to change rapidly, and we've seen zero evidence that this particular one has changed at all.
And when you spend an extra 30 seconds reading, you realize that perhaps the simple, narrow point I made is correct after all.
The long-term trend has been that per-acre yields have been rising while pesticide and fertilizer applications have been stable or falling. We've seen data showing that's true about the US, and having previously argued this point I know it's true about the world in general as well (modulo short-term disruptions like droughts). While the USDA's database is down at the moment, here is one of their tables reproduced, showing world wheat yields (per hectare) growing (modulo short-term disruptions) continuously for the last four decades.
When their database is back up, I encourage you to check out the USDA's data on area planted, yields, and overall production; "coarse grains" would probably be the best stat to look at (it's an aggregate).
My error - I phrased myself badly, actually - that's what I get for trying to get this reply in before shutting down for the Sabbath on Friday. What I should have said is that overall yields are falling in relationship to energy input - that is, we're putting more energy in to get decreasing returns, as Pimentel and Gampietro describe in their (now slightly dated) "Food, Land, Population and the US Economy" (I have a hard copy of this paper, so I don't have a link). More recent analyses on that score include Dale Pfeiffer's _Eating Fossil Fuels_ which argues that this discrepency has only increased, and Rick Welsh's 1999 paper on organic grain production which seems (from googling) to be available only in PDF, which I cannot for the life of me link to, because Adobe Acrobat makes my computer go mad. Can you guess that I won't be making any cool graphs, since I haven't the faintest idea how to do so ;-)?
Total return on investment in Green Revolution technologies seems to be falling - that is, we're having to run ever faster to keep increasing along with population. But my apologies for expressing myself badly.
My own take on this is that we are in an agricultural stage rather like the stage Saudi Arabia was in re:oil until quite recently - we are using more and more water, high technology and energy to extract marginally higher total returns. But doing so only increases the rate of the ultimate decline. In fact, Lester Brown argues that that's precisely why China's grain yields have fallen so precipitously - their draw down of soil and water, and goes as far to propose, in _Plan B 2.0_ that the same will happen to states in the US like Texas, Nebraska, and Oklahoma that depend on the Oglalla aquifer for a majority of their irrigated agriculture. I don't insist on this interpretation, however - it would be enough to note via Pimentel and Gampietro that the amount of arable land we'll have per person by 2050 in the US is insufficient to feed us without many, many more small farmers and gardners on land converted to suburbia,office parks and the like. If anyone out there has a biofueled combine that can harvest potatoes from 4 simultaneous suburban yards, avoiding the septic tanks, the underwear on the clothesline and the small children playing there, I'll believe that we aren't going to have a ton more people doing this work, but I haven't seen it yet ;-). The truth is there is no industrial agriculture - organic or conventional, that can feed us on that little land without a lot more farmers.
Sharon
Can't speak for Sharon but she may have been referring to grain production per capita:
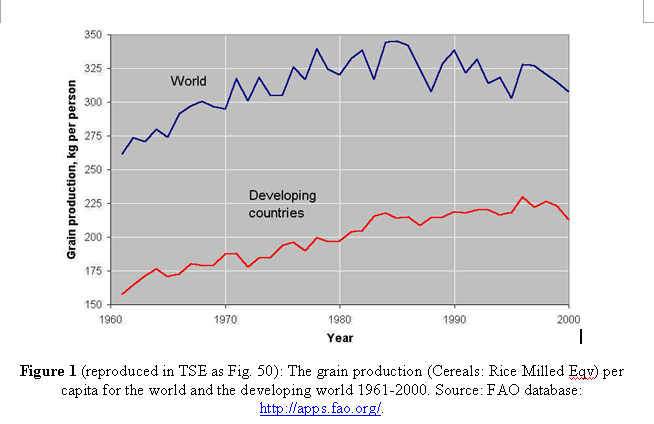
I also believe the second derivative of yield is declining -the rate of increase has continued to slow - but I don't have that source handy.
One things for sure and thats your graph is bigger than mine...;)
ROTFLMAO
Farming doesn't consume all the energy we use, let's say 25% (farm to home) for argument's sake. If so, then it would be possible to handle a large loss of energy imports, without ever needing to touch the energy needed for farming. However, I don't think we will slide nicely (linearly) along "Bradford's Curve" to account for any arbitrary decrease in energy imports.
Peak oil is the GREATEST THING EVER to happen to the farm!!!!
Since I became PO aware a few years ago, I became EXTREMELY concerned about ag aquiring fuel to farm with.
Now I realize now that that is nothing to fear. Its very simple. As a farmer growing wheat, corn, and soybeans in SD, I can outbid ANYONE ELSE in the ENTIRE USA for whatever fuel is available. Here's how;
I burn EXACTLY 4.23 gallons diesel/acre. 100% no-till. $150,000 tractors and $300,000 combines don't need SQUAT DIDDLY for fuel on a per acre basis.
1 gallon of diesel fuel = 130,000 BTU
1 bushel of corn = 395,000 BTU
I turn 4.23 gallon fuel/acre (This includes planting, spraying, harvest, trucking grain, etc) into 115 bushel/acre of corn.
I produce so many more BTU's than I burn its not even funny.
I seriously run through maybe 15,000 gallons on 3,000 acres of land and easliy produce 100,000 bushels of grain per year.
Herbicides are even more of a no-brainer. It really doesn't matter how much herbicides cost, they save INSANE amounts of tillage and nonsense with lost yields.
The only way the farmer can't bid to the moon for fuel is if grains are priced below crude oil on a BTU basis. (As they are today sadly, and which is why more corn stoves will get sold.)
If grains are priced equal to or greater than crude, (which they were throughout the 20th century) then we will be able to EASILY outbid everyone else in the country for fuel.
Example, If corn were to equal crude on a BTU basis, we'd get $6.50/bu. You show me a farmer who gets $6.50/bu for corn and I'll show you a guy who COULD pay over $10/gal for diesel and LAUGH all the way to the bank.
ORGANIC IS A JOKE in a PO world. Acres will be too valuable to screw around with low yielding organic.
Food will get scarce because as long as we continue to produce a cheaper BTU with corn than the oil industry does with crude, then corn burning stoves will get made and sold.
Google "corn burning stoves" if you don't believe me. Burning corn saves folks big $$.
WE ON THE FARM DON'T NEED SUBSIDIES AT ALL. All we need us UNSUBSIDIZED corn stoves and EXPENSIVE FUEL. Presto, unlimited wealth.
The problem with this whole thing is NOT a lack of crude, its going to be a lack of nat gas. People will starve from a lack of fertilizer.
But don't think for a moment the tractor will lack fuel.
The first barrels pumped out of the ground will go to herbicides, and the next will go to farm equipment.
The fuel will go to the guy who can add the most value to that fuel.
Noone can add more value to 4.23 gallons of diesel fuel than a no-till farmer using herbicide instead of tillage to kill weeds and thus creating 115 bushel of corn.
Another BIG misconception out there is that because herbicides are often, (but not always) made from petro, this means somehow a fuel shortage will lead to less herbicides. This is PURE rubbish. There is no way to add more value to petro than to make herbicides.
Example, I plant Roundup Ready corn. I no-till everything, which means I spray weeds instead of raping the soil and murdering earthworms with tillage equipment.
The use rate of Roundup is one quart per acre. If I went totally nuts, I still couldn't spray an entire acre with just one gallon. The use of Roundup adds at LEAST 50 bu per acre.
Lets do the math; one gallon of petro for herbicide = 130,000 BTU
50 bushel of corn = over 15 MILLION btu.
no contest.
The person who gets the barrels of oil, (and there will always be SOME oil produced) is the guy who can ADD THE MOST VALUE to those barrels.
Herbicides add the MOST value.
Farm equipment addds the second most value.
The reason for the mass starvation will be a LACK of acres and a LACK of fertilizer.
Let me clarify lack of fertilizer; I mean a lack of fertilizer at a low price relative to grain price.
While corn burning stoves will not allow corn to lag crude too far for too long, its differant with fertilizer.
As N fert gets more and more expensive, its use rate per acre will fall.
The reason is because the first 10 lbs of N applied brings the most yield per unit of N. After that each subsequent lb of N adds less and less yield. Law of diminishing returns.
Grains will need to rise in price until food rationing occurs. We have a VERY long way to go.
Wheat is basically FREE. Wheat is a nonexpense, why do I say that?
60 loaves of bread come from one bushel of wheat. If wheat were to go to $100/bushel, the cost of the wheat in one loaf of bread would only be 60 cents.
Food costs are not due to higher grains YET. Higher food costs are due to transporting.
Food has a long, long way to go before rationing occurs due to high priced grains. Will we eventually get there? Yes IMO.
WHOOPS!!
One bushel of wheat yields 73 loaves of bread.
In the last year, wheat went from $5/bushel to $10/bushel.
OH THE STARVATION!! I hear.
Bullshit. Adding $5 to a bushel of wheat only adds 7 cents to a loaf of bread.
The grocery bill pain is due to transportation costs.
At $5 corn, IT IS A FACT that the cost of the corn in a box of cornflakes cost less than the box itself.
HPF Perhaps you could comment on this.
I see a serious problem with bio-diesel. Currently an average to excellent soybean yield is about 50 bushels/acre. At $12.00 a bushel that is a $600 annual/acre crop, however at best it will yield about 75 gallons of oil and 60 gallons of bio-diesel. That means with zero capitol and processing expense, the bio-diesel has a crop cost alone of $10.00 per gallon.
I understand that Minnesota has enacted a 2% bio-diesel law that requires nearly all diesel fuel to be blended with 2% bio-diesel, now Minn is attempting to raise it to 20%. Now I don’t know how much nearly is, but here is a web-site to explain it further.
http://www.mda.state.mn.us/searchtemplates/search.aspx?terms=bio-diesel+...
Here is a web-site of oil yield for oil-bearing crops.
http://journeytoforever.org/biodiesel_yield.html#ascend
Do you think the soy meal will make up for the loss plus pay the capitol costs of the oil extraction, bio-diesel conversion processes, blending and transportation costs?
man i love these posts
They are p.o. ag. in a nut shell
Yup. "Compensated shock," I call it above.
Welcome to the new zero-sum world.
I think that's exactly right. Peak oil is a recipe for farmers to do better, and the urban poor to do worse (especially in developing countries).
Back in the 1970's during the first energy crisus the US government had a hierarchy on fuel use. As I recall it was something like this: agriculture was first, along with some industrial users that were associated with ag and defense, RR's had priority in transportation, and utilities had priority amoung industrial users. Others were left to fight for the scraps.
I recall how the leisure industries like boat and RV manufacturers, along with small private plane makers nearly went bancrupt and some went to Congress to ask for allocations for their segment of the economy. In the post PO future I think this will be renewed and some leisure/travel industries will cease to exist.
As far as urban poor being the least likely to circumvent high FF prices, that depends entirely on government leadership. If the US is going to build a larger electric railroad transportation system, then the working poor of many cities will have opportunity for better paying jobs that will allow for higher food prices.
I live in a city neighborhood of mostly working poor people and in the summer I grow on 150 sqr ft. enough vegetables for myself and one other person. I trade with a neighbor for those vegies that I don't grow. In the summer my only produce purchases are for fruit, which others grow but I don't trade with them. I use 0 (zero) fossil fuels in my garden, no pesticides or herbicides or fertilizer, just mulch from my table scraps and other plant wastes. Interspersing plants (no monoculture), along with encouraging birds and toads to populate the garden helps keep pests down.
I don't think things will be so bleak for the city folks. Many years ago people in the cities had gardens and access to farmer's markets that brought in fresh produce from 20 to 40 miles away. At these markets one could also buy fresh chickens, eggs, pork, and even fish. During the winter people ate canned food; remember Kerr jars?
Even during the 1940's and 1950's a lot of the fresh produce in the midwest & east came from south Texas and the Southwest in refrigerated railroad cars that could move eight times as much food per gallon of fuel as a truck. We could go back to this type of food transportation with building more refrigerated railroad cars and rebuilding some trackage in growing areas and food distribution areas (mainly just short tracks into loading facilities and warehouses). But the government will have to give some economic incentive to the RR's to get back in this business.
Post peak I don't believe the food picture in the US will be at all bleak. For those on the discretionary side of the economy (finance, leisure travel, personal services, retailing knicknacks and some entertainment) it may be a rough transition from being middle class to knowing what "working poor" means.
You are glossing over a very important issue - that of energy quality. A BTU of diesel fuel (IN CURRENT SOCIETY) is WAY more than 3 times the energy quality than the BTUs in corn. You have to use other BTUS, from nat gas or elsewhere to turn those corn BTUs into any energy usefullness, and if you are growing your own fuel, you'd be much much better off with canola which you can cold press and requires much less nat gas in terms of fertilizer and pesticides and herbicides. And you are assuming that the market always functions as it currently does - what if you can't get a particular part for your tractor thats made in China, etc?
Jason,
Thanks for putting together that research, great keypost.
The graph looks like an inverse relationship -- I wonder how linear it would be if one of the axes were inverse scale? Like 1/energy vs. farming percent.
Duh.
www.lawnstogardens.com
RE: Organic farming having poor yields- not sure where you could possibly have gotten that idea from. Yields of organic ag are quite good for the most part- and there is no question that the quality is better. I can't put my hands on the data- perhaps one of you can- but I have seen lots of reports that examine the difference in content of vitamins, etc between organic and non-organic produce- and organic wins by far. In terms of residues of chemicals such as herbicides and pesticides- why would anyone in their right mind want to consume them? They are poisons. Makes little sense to me to claim thatthere is no difference in quality.
re: big ag. I think that the crux of some of it is that while some, such as Sharon Astyk are cheering for a resurgence of small farmers and local ag and gardens behind every home- big corporate ag is not giving up so easy. So I'd guess that if/when petro fuels become scarce not only will large-scale ag receive preference for fuel, but biodiesel will also play a big role. I don't doubt the ability to continue to farm- I just know that costs of fertilizers, herbicides and the like will climb, trucking costs to deliver these will climb, and food prices will skyrocket. Transportation of food is another big if- how this will play out I don't know. So I'd guess that food will still be produced on large-scale industial ag farms-but many will be unable to afford it. So that's where the local ag small-farmers/household gardens will come in.
The big crops that require most of the acres; corn, wheat, soybeans, and cotton, need herbicides for proper yields.
The crops above, which DWARF all others, hemmorage major yield if you take away herbicides.
The average organic wheat field yields 1/3 of the average wheat field.
Organic will go away on major crops as peak oil hits. The demand for food will be too high.
But does all that still hold true in drought conditions with inadequate irrigation? I am wondering if crops grown in soil with lots of organic matter and mulching would fare considerably better than your "conventional" grown crops.
"Organic farming can compete effectively in growing corn, soybeans, wheat, barley and other grains"
Please read this.
The Skeptics Dictionary
There is little to no scientific basis for the claims in the quote above.
There are good reasons to practice "organic" farming, but the "superior quality" of the food ain't one of them.
You consume poison residues every single day of your life, just living. You eat cyanide in nuts.
Be cheap. Localize. Feed the soil. Recycle plant waste. Reduce fossil fuel consumption. Reduce the costs of chemical inputs.
What the hell else does one need? Carrots with magical nutritional qualities?
Did you notice who they referenced for this statement?
Yes, the EPA. How many examples do we have now of the government endorsing what industry wants it to endorse and it later turns out that there was data suppressed or the study was purposefully designed to produce a certain result? Thousands? Tens of thousands?
I'm sorry, government studies by government institutions that have a track record of supporting big business don't qualify as valid references for me and I suggest that they shouldn't for you, either. Information coming from governments is simply too self-serving. This is unfortunately true the world over and we are watching it play out with NASA censoring James Hansen when he wants to write plainly about climate change (http://www.nytimes.com/2006/01/31/science/31climate.html).
It is increasingly becoming clear to me and many others that the system we have created to produce our food and manufacture our products is unsustainable, whether it's due to chlorofluorocarbons, CO2, the infinite economic growth model, fossil fuel dependence -- or chemicals in our food supply.
You are welcome to argue for the current system all you want. Personally, I'll keep having conversations with people who can see the madness of the system and commit themselves to creating something new.
------------------------------------
Peak Oil, Climate Change and Business
Free, Bi-Weekly Executive Briefing
www.inspiringgreenleadership.com/peak-oil-climate-change-and-business
Might I remind you of the obvious fact that the children of those who commissioned and carried out these studies eat the same goddamned food? Do you think they'd put their children's lives at state just to "support big business"?
I repudiate the paranoid thinking of the skanky wing of the "organics" movement.
I'm wondering just how many parents in the USA give a damn about their children any more. I am seeing increasing signs that increasing numbers of them really don't.
Hi, b3NDZ3La.
I stand by my assertion that the government often colludes with big business so that big business can maximize short term profit.
This has been demonstrated so many times that I'm not going to spend too much time backing that up. There are many reasons this happens, in my view, from pure greed, to denial, to just plain thinking "oh, a little bit can't possibly hurt" only to find out that a little bit x 6.7 billion people has quite an impact.
Do not the kids of the current administration live in the same world as you do? Shouldn't their parents want to protect them from the worst of climate change?
And yet this report was just released:
Political Interference With Climate Change Science Under The Bush Administration
http://www.earthjustice.org/library/reports/house-of-representative-2007...
And this Administration has consistently weakened environmental rules that it has taken decades to put in place.
Here are just a few of the environmental protections this Administration has weakened or removed entirely:
The Bush Record on the Environment: Weaken Environmental Protections for Our Families, Give Special Treatment to Industries that Pollute
http://democrats.senate.gov/dpc/dpc-new.cfm?doc_name=tp-108-2-129
If only you were correct that these people could see the long term impacts of their actions to their children, or their children's children. They cannot, which is why an informed population must pay attention and raise the alarm where necessary and appropriate.
Andre'
------------------------------------
Peak Oil, Climate Change and Business
Free, Bi-Weekly Executive Briefing
www.inspiringgreenleadership.com/peak-oil-climate-change-and-business
"Organic farming produces the same yields of corn and soybeans as does conventional farming, but uses 30 percent less energy, less water and no pesticides, a review of a 22-year farming trial study concludes."
Thanks. This proves: soil is everything.
But there's a rub, or course:
and
And why are "organics" food prices higher? That is, why are people willing to pay more for an item that is simply produced by another method but has no significant difference from the same produce grown via a conventional method?
Because they think they're getting a "superior" "more nutritrious" product.
What happens if it turns out this isn't true?
That's why the findings above are so important: they focus on the things that matter, not on hocus-pocus.
Speaking for myself, the main reason I buy organic when I can is food security. I know that producers using organic methods are taking better care of their soil and minimizing their impact on their ecosystem. I want to encourage people that are doing that, because I suspect that this will slightly improve the odds that they will still be around to supply me with food.
As far as I am concerned, the higher price I am paying for organics is the "full price". Non-organic, non-sustainable farming has huge externalities that are not factored into the price, but that we WILL eventual have to pay for.
I'm surprised no one has mentioned the Rodale Research Institute. They do real researach not hippy-dippy annectodtal stories. Their emphasis is upon sustainable ag. They have many excellent articles. http://www.newfarm.org
I'm also surprised that no one has mentioned the Sustainable Ag Research and Education project. They have lots of good information much of which is downloadable. http://www.sare.org
In California try: http://www.sarep.ucdavis.edu
I haven't visited the above link for a while so I might have it wrong.
Todd
So my neighbor passes away and wills his 175 acre ranch/farm to the local high school on the condition that it only be used for "agricultural educational programs"
http://www.newsreview.com/chico/Content?oid=9147
It has turned into a community debate equal to this discussion
The U.S. government actually has a miniature ag branch promoting sustainable practices:
http://www.attra.org/
Great site. Solid research and compilation.
Thanks for that - I second. Good resources for the beginner too.
First off, we have more productive farmers than 100 years ago because we have a lot more knowledge and better seeds. So we won't revert back to year 1900 ways of doing things just because oil production will fall.
Plus, we can use non-fossil fuels energy sources to power agriculture. Electrify the farm and run farms off of wind, nuclear, and solar photovoltaics. Shift from diesel water pumps to electric water pumps for example.
Plus, we can develop more biotechnologies (e.g. introduce nitrogen fixing genes into more crops) to reduce energy usage.
your second paragraph make sense
the rest is non sense
He's simply pointing out that the huge increase in human knowledge in the last 100 years has not completely bypassed agriculture.
More knowledge and more technologies (e.g., types of seed) are available to farmers now than 100 years ago, strongly suggesting that current farmers have an innate and substantial advantage over farmers 100 years ago in terms of the yields they should be able to attain.
He may or may not be right, of course, but it's a pretty simple set of statements.
Organic Farming Can Feed The World, Study Suggests
http://www.sciencedaily.com/releases/2007/07/070711134523.htm
"Can" means "could," not "is" or "will." It reminds me of the "productive capacity" fiasco that we hear about in oil production.
I can have sex with Sean Penn (to put a personal spin of WT's version of "capacity"). That, sadly, doesn't mean I will, or that he would even agree to it.
There is an existing agricultural apparatus in place, infrastructure and all. It is going to be around a long, long time.
"Organics" is NOT coming as the wave of the future "to feed the world." That's claptrap. It's for those of us who choose to use it locally, for our own purposes.
"Organics" farm practices--I'm tempted to dump the label and call them traditonal practices--are worthy in their own right and don't have to be romanticized as the savior of civilization.
Absent fossil fuels, people will have no choice but to farm organically. It won't be a matter of what they can do, or would like to do - they'll have no choice.
It's like we're saying, "the car's going to break down."
"Oh well we can walk home."
""Can" means "could", not "is" or "will"! Do you think people really want to walk home?!"
"Um, if the car's broken down, what choice do we have?"
"But I won't!"
"Okay, sit here and die, then."
People won't have a choice. It'll be "farm without fossil fuels, or don't farm at all." Since not farming at all means mass famine, people will farm without fossil fuels. Whether their particular method of farming will match your particular definition of "organic" farming I've no idea. But when the fossil fuels run short or at last when they run out, people will farm without them. Or they'll all die.
If for some bizarre reason your life depended on having sex with Sean Penn, I'm sure you'd find a way ;)
People won't have a choice. It'll be "farm without fossil fuels, or don't farm at all."
K, I just don't agree that it's going to be like this. See my comments on "compensated shock" above.
Existing farming infrastructures are going to be preserved, at all costs. If memory serves, agriculture accounts for about 17% of current FF usage. In the case of shortages, fuel supplies can be shunted away from non-vital sources ("the extremities") to vital ones ("organs").
I'm not saying there won't be a renaissance in "organic" (ick. let's call it "traditonal") farming, ala Westexas' Victory Garden appeals.
Not that I'm giving up my compost heap! Oh, no, you'll have to pry my digging fork from my cold dead etcetera.
If for some bizarre reason your life depended on having sex with Sean Penn, I'm sure you'd find a way ;)
Luckily, it doesn't...Or should that be "sadly"??
17% of "finite and will run short some day" is still "finite and will run short some day."
At some point, the price or scarcity of fossil fuels and derivatives put into agriculture will make them just plain unaffordable and/or not worth it.
At that point, people will stop using them, and farming will, whether we like it or not, be organic.
Whether that point is 10 years or 100 years hence is not relevant to the discussion at hand: "will less energy mean more farmers?"
I reply "not less energy, but less fossil fuels will mean organic farming dominates, and organic farming uses more labour, so will mean more farmers."