| European Energy Conference, Aberdeen 22nd February 2008 | The Oil Drum: Europe | Oilwatch Monthly - February 2008 |
Peak Oil and "The Limits to Growth": two parallel stories
Posted by Ugo Bardi on February 16, 2008 - 11:00am in The Oil Drum: Europe
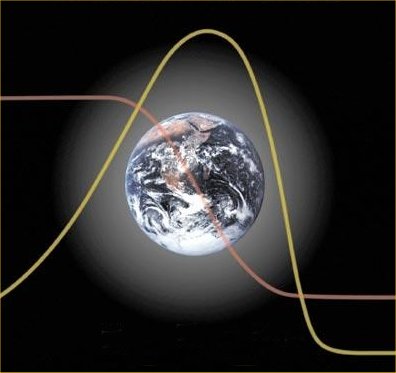
The figure above is taken from the 2004 edition of "The Limits to Growth". It shows the typical curves that the models of the study produce. These curves are similar to those of oil depletion studies based on the "Hubbert model". The similarity is not casual, the theory and the method behind the two approaches have a lot in common.
It is safe to say that, in the 1950s, Marion King Hubbert and Jay Wright Forrester didn't know of each other's existence. Yet, working independently, they were setting the basis for a new science. They were not the first to study the limits of the world's resources. But they were the first to do that using mathematical models that could be extrapolated into the future.
Marion King Hubbert, a geologist working at Shell Oil in Houston, was using an empirical approach for studying crude oil production. In 1956, he published his, now famous forecast that oil production in the US 48 lower states would peak around 1970 and then decline. It did. In the same paper, Hubbert applied his method to the whole world, arriving to the conclusion that oil production worldwide would peak around the year 2000. This long term forecast might turn out to have been approximately correct as the world peak ("peak oil") is still expected for the first decade of the 21st century.
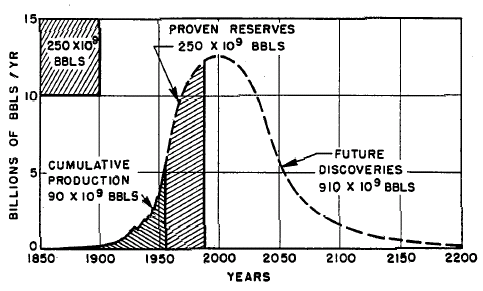
Fig. 1 Hubbert's forecast for the world's oil production, from his 1956 paper
Jay Wright Forrester, professor at the Massachusetts Institute of Technology, had a background in engineering and his goals were more ambitious than those of Hubbert. In the 1950s Forrester had developed a new approach to modeling that he had called "system dynamics". The idea was to use the digital computers, newly developed at the time, to solve a set of differential equations that described the system under study.
Forrester started using his method with physical systems. Then he moved to simple economic and social systems. From there, an obvious step was to model the whole world, something that had to take into account, among other factors, the limits to Earth's resources. Forrester developed his first world models in the late 1960s and published his results in 1971 in a book titled "World Dynamics". But the real impact of Forrester's ideas arrived as a study performed by a group of young scientists at the MIT who used Forrester's approach to develop more detailed models of the world's economy.
Dennis Meadows, Donella Meadows, Jorgen Randers, and William Behrens III published their work in 1972 with the title of "The Limits to Growth." The book developed a series of scenarios according to various hypothesis on the availability of resources and on world policies that could be developed and implemented in the future. All the scenarios, except for some special cases, generated the collapse of the world's industrial and agricultural systems at some date within the 21st century. Forrester had arrived to similar results in his 1971 book.
A typical result of the 1972 LTG study is shown in the following figure for what the authors had called the "base case" model. In this model, the resources in input correspond to the best available data and it is assumed that the current policies and economic trends remain unchanged over the period considered.
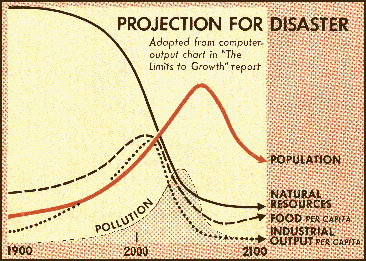
Fig. 2 Base case model of the 1972 edition of "The Limits to growth". This image was published by the Time Magazine in 1972. From http://www.holmestead.ca/reserved/popexplo/popexplo.html
The work of the LTG team had a huge impact, with millions of copies of the book sold. Hubbert's work also had a considerable impact, although mostly within the world of specialists in crude oil. However, as years passed, both studies were strongly criticized. The period of apparent abundance of the 1990s seemed to cause the total obsolescence of all ideas and theories that predicted bad times ahead. "The Limits to Growth", went through a phase of active demonization that pictured it as having been "wrong" in its predictions. Even though the collapse envisioned in the scenarios was to take place only in 21st century, still today for most people the LTG study is an example of flawed predictions. Hubbert's work, ion the other hand, was simply forgotten.
But the models and the ideas that were behind these studies were not abandoned. "The Limits to Growth" study was updated and the latest version was published in 2004. It is, at present, again generating considerable interest. Hubbert's ideas and methods were revived in the late 1990s by Colin Campbell and Jean Laherrere who started what we call today the "peak oil movement."
The results of the models that we are discussing have not changed much if we compare the early work with the recent updates. Here are some results of the 2004 version of "The Limits to Growth". This is, again, the base case model. As you can see, the collapse of the world's industrial and agricultural system is still generated for this case for approximately the same date as in the 1972 version.
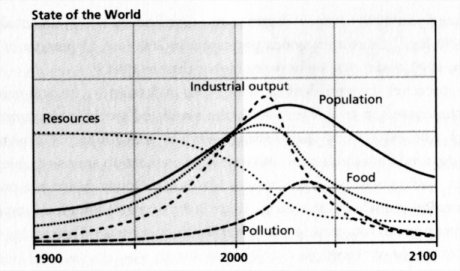
Fig. 3 Base case model of the 2004 edition of "The Limits to growth".
Here is, instead, an example of recent results obtained by Jean Laherrere who uses a Hubbert-like approach for describing the production of the main categories of fossil fuels. The date for peak oil is shifted by some years forward with respect to the early predictions by Hubbert, but the bell shaped curve remains about the same.
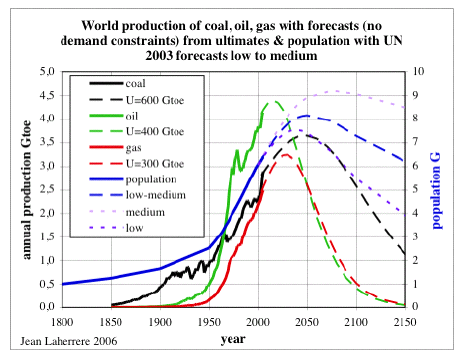
Fig. 4 From Jean Laherrere, 2006. http://www.oilcrisis.com/laherrere/groningen.pdf
These results indicate that, in the coming decades (or even years), we may see the reversal of some of the growth trends that we came to see as the natural order of things. Peaking and decline is expected not just for fossil fuels, as shown before by Laherrere, but also for most mineral commodities (see a recent study by Bardi and Pagani ). These are just subsystems of a vaster system that may collapse in the coming years according to the LTG models.
So, "Hubbert modeling" and "world modeling" have a lot in common but, of course, they are also very different. Let's now examine more in detail how the two methods are related and what are the specific differences.
The Hubbert model is purely empirical. It postulates that the production of crude oil and of other mineral resources will follow a "bell shaped" curve, often taken as the derivative of a logistic function. Modeling production means to fit two parameters to the bell shaped curve: past production and the available reserves. Good data obtained from geological estimates are, therefore, a crucial element of the model, which is considered to be a tool for forecasting future production. The model is robust, in the sense that it depends on just a few parameters, and it has turned out to produce reasonably reliable predictions. Of course, it is rare that the model generates the amazing precision of Hubbert's 1956 forecast for the US oil production. But, on the whole, the model is able to detect an impending production peak, as it has happened for cases such as the North Sea oil production, that peaked around the turn of the century. The Hubbert model, in itself, says nothing about what could be the consequences of the global peaking of oil production, even though "peak oilers" tend to see it as an important turning point for mankind.
World modeling studies based on system dynamics start with a detailed description of the main features of the system under study. Obviously, that implies drastic simplifications in describing the world's economy. Nevertheless, world models are much more complex and detailed than the simple Hubbert one. In addition to quantitative data on the available resources, these models include such factors as market, technology, government policies, regulations and others. Because of the large number of parameters and the inherent uncertainty in the data, the results of the models may vary considerably depending on the parameters in input. For this reason, these models are not considered as predictive tools, as Hubbert-style models are, but, rather, as descriptive tools. The idea is that, if the model can describe the system under study, it can be used for understanding how one can control it. In the case of world modeling, the authors of the LTG studies always emphasized that their models were not "predictions" but rather scenarios and that their purpose was understanding what policies should be implemented for avoiding collapse.
Let's go a little more in depth on how system dynamics is used in order to simulate the whole world. In the LTG studies, it is done by aggregating the elements of the system into a relatively small number of variables: 1) natural resources, 2) agriculture, 3) population, 4) capital, 5) pollution. Here are the main elements of the model in graphical form according to Magne Myrtveit.
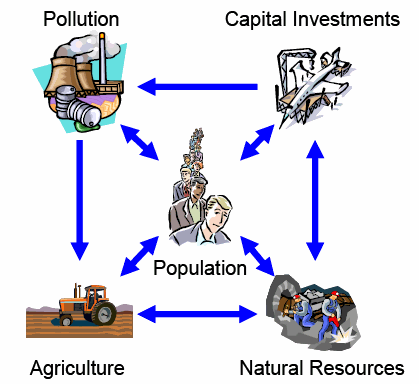
Fig. 5 - the main elements of the world model, according to Magne Myrtveit (https://bora.uib.no/bitstream/1956/1974/1/WPSD1.05WorldControversy.pdf)
As you see, the model takes into account mineral resources, but just as one element of a more complex system. However, it is perfectly possible to use system dynamics for modeling specific sectors of the economy, for instance for the extraction of a mineral resource. One of the first models of this kind was made in 1974 by Roger Naill who worked in close contact with the LTG team and used the same software to model natural gas production in the United States.
You can find a detailed description of Naill's model at http://www.albany.edu/cpr/sds//DL-IntroSysDyn/ch6_f.htm. The model is complex, involving such parameters as prices, technology, market responses and others. Nevertheless, the fundamental concepts of the model are simple: the resource is supposed to be finite; extraction is assumed to be driven by market factors and ultimately slowed down by the rising costs caused by depletion. The final result is a bell shaped curve similar to the typical Hubbert curve. Here is what we can call the "base case" model of this study, taken from "Towards Global Equilibrium" (1974)

Fig. 6 - Natural gas production in the 48 US lower states as modeled by Roger Naill in "Towards Global Equilibrium" 1974. "Usage rate" is what is normally called "production". The peak of the usage rate curve occurs for about 1975 in this scenario.
We can now compare Naill's results with those that Hubbert had proposed in 1956 for natural gas production in the United States
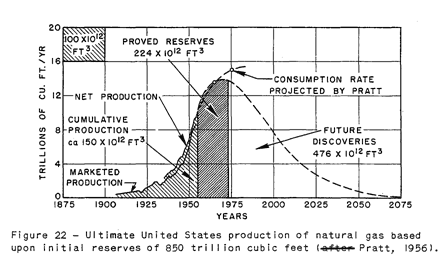
Fig. 7 - Natural gas production in the US as modeled by Marion King Hubbert in 1956
One difference that is immediately apparent in these models is that Hubbert's curve is normally symmetric or slightly skewed backwards, as in this case. Naill's curve, instead, is skewed forward; as it seems to be the case for most system dynamics studies of this kind. The reason for the forward slanting curve lies in the built-in tendency of the market of compensating for depletion by increasing the effort of extraction. This strategy succeeds in retarding the production peak. However, since the extractable amount is finite anyway, postponing the peak must be paid with a more rapid decline. Apart from this point, the two models produce similar curves and, in this case, indicate approximately the same date for peaking.
Several decades after that these models were proposed, we can say that neither one provided an exact description of reality. Natural gas production in the US did peak in the early 1970s, as Hubbert had predicted and as Naill's models tended to indicate. But, after about 10 years of decline, production stopped following a bell shaped curve. It picked up again and peaked a second time approximately in 2000, without having reached again the level the first peak. This behavior may be explained in various ways (see a recent reassessment by Luis de Souza), but that is not the point here; models are always approximate anyway. The point is that when modeling the production of a single mineral resource, the Hubbert approach and system dynamics generate very similar curves.
That doesn't mean, of course, that world modeling is the same thing as Hubbert modeling. World models take into account many more elements than resource depletion models. In particular, as early as in the first LTG study, one of the elements of the model was called "pollution;" something that, today, we see as mainly related to global warming. Depending on the input parameters chosen, the collapse that the LTG world models generate may be caused mainly by resource depletion or by a runaway climate change.
If global warming hits us first, our worries about resource depletion are of little importance and the reverse is also true. At present, we can't say which problem is the more immediate one. What we can say is that fossil fuels (and crude oil in particular) are the crucial resource of the world's economy. In the hypothesis that resource depletion is a more pressing concern than global warming, the vision of impending "peak oil" and "peak fossils" is equivalent to that of the "base case" model of the LTG studies. In both cases, we see the collapse of the industrial society due to resource depletion.
So, it may be that peak oil and "peak civilization" will coincide as an event taking place in the first decades of 21st century. Of course, we are not there yet, but the world's economic system is letting out ominous creaking noises. Are these signs of impending collapse? We won't have to wait for many years to know.
There would be much more to say on the subject of peak oil and world modeling. One is how the results of the first LTG study have been so effectively demonized and marginalized; a fate that peak oil studies have avoided - although they received a fair share of political criticism as well. That will be the subject of another post.
I wish to thank Dennis Meadows, Jorgen Randers, Magne Myrtveit and several others who introduced me to the fascinating world of system dynamics
References
Matthew Simmons was one of the first of those involved in peak oil studies to re-examine the story of the Limits to Growth. His 2000 essay on this subject can be found at http://www.simmonsco-intl.com/files/172.pdf
A detailed reappraisal of the world model controversy can be found in Magne Myrtveit's 2005 paper at https://bora.uib.no/bitstream/1956/1974/1/WPSD1.05WorldControversy.pdf
Jean Laherrere has also re-examined the LTG study in this paper, pubshed in the ASPO-Ireland site
http://www.aspo-ireland.org/index.cfm?page=speakerArticles&rbId=9
Another recent positive reassessment of the LTG study by "Big Gav" can be found at http://anz.theoildrum.com/node/3572
A description of how Roger Naill generated the Hubbert model from system dynamics assumptions can be found at http://www.albany.edu/cpr/sds//DL-IntroSysDyn/energy.htm. His model was published for the first time in "Toward Global Equilibrium, Collected Papers". D.L. Meadows and D.H. Meadows (eds), Cambridge, MA, 1974, pp 213-256.
The original 1956 article by Marion King Hubbert can be found at
http://www.energybulletin.net/13630.html
Personnel
Editors
Contributors
Peak Oil Primers
Archives
- November 2010 (3)
- October 2010 (6)
- September 2010 (4)
- August 2010 (7)
- July 2010 (6)
- June 2010 (7)
- May 2010 (2)
- April 2010 (8)
- March 2010 (4)
- February 2010 (6)
- January 2010 (3)
- December 2009 (5)
- November 2009 (8)
- October 2009 (12)
- September 2009 (6)
- August 2009 (5)
- July 2009 (11)
- June 2009 (8)
- May 2009 (16)
- April 2009 (10)
- March 2009 (7)
- February 2009 (10)
- January 2009 (15)
- December 2008 (9)
- November 2008 (9)
- October 2008 (9)
- September 2008 (13)
- August 2008 (10)
- July 2008 (14)
- June 2008 (23)
- May 2008 (16)
- April 2008 (12)
- March 2008 (16)
- February 2008 (9)
- January 2008 (13)
- December 2007 (13)
- November 2007 (16)
- October 2007 (22)
- September 2007 (8)
- August 2007 (9)
- July 2007 (16)
- June 2007 (8)
- May 2007 (7)
- April 2007 (7)
- March 2007 (10)
- February 2007 (10)
- January 2007 (12)
- December 2006 (9)
- November 2006 (15)
- October 2006 (4)
- September 2006 (5)
- August 2006 (5)
- July 2006 (9)
- June 2006 (5)
- May 2006 (10)
- April 2006 (9)
- March 2006 (13)
Vital Trivia
License

This work is licensed under a Creative Commons Attribution-Share Alike 3.0 United States License.
Good comparison. We have used the Limits of Growth report as well in our stories about the ecological bottlenecks that await us. The best overview & comparison of the two methods I've seen so far.
Applause from the hall.
Thanks!
Black Friday
March 7 2008 11:30 am ( NY time )
BOOM
A very interesting exercise is to plot the 1st derivative(slope)versus time, of the non-renewable resources curve from the "business-as-usual" or baseline scenario of "Limits of Growth" for any of the three books. If you then invert the resulting curve it forms a nice Hubbert type "peaking" trend. Of course, this is to be expected as the resources curve has a nice inflection point. Shown this way non-renewable resources, for this baseline scenario, reaches a peak in about 2015. It is not surprising then that the world is experiencing the current questions about resource sustainability exactly midpoint between Hubbert's 2000 peak oil and "limits to Growth" 2015 peak non-renewable resources.
Any chance of seeing a chart? If you can't post charts then email it to me - png is best but jpg or tiff will do - and I'll post it.
Euan
Thanks to jmac for his plot. And a comment attached:
Very nice. Thanks Jmac!
The basic building blocks of system dynamic models are reservoirs (stocks) and flows, and mechanisms that regulate the flows into and out of the reservoirs. That means that you have to close off the world that you model, otherwise things that enter or leave your system can give unpredictable consequences. And so the real "art" of system dynamics is to divide real –open– systems into closed systems of stocks and flows. Yet in open systems – open, for instance, to flows of information, and/or open to flows of solar energy – new forms of self-organisation can be created, that cannot be captured in a system dynamics model. However, the valuable point of the stock/flow models is of course that it helped to unmask the inconvenient truth of resource depletion. The System Dynamics Society now celebrates its 50th anniversary, without getting much honour for that. Work continues though. Members recently received the first announcement of The First European Energy Workshop, organised by EIfER and LISTO and kindly hosted by EIfER. "This Workshop aims at gathering all SD-practitioners in the energy domain together in a pleasant atmosphere. The workshop shall take place on Thursday and Friday April 17-18 at EIfER in Karlsruhe (Germany)." Contact: Tobias Jaeger (www.eifer.uni-karlsruhe.de), and Luc Van Den Durpel (www.listo.be).
Filed under "Peak Oil", "Peak Everything Else".
-Andre'
------------------------------------
Best Of The Oil Drum Index
http://www.inspiringgreenleadership.com/blog/aangel/oil-drum-best-index
System dynamics sounds great. Working upwards and outwards or staying in a small system, being modular, all depending on what you intend to model, the world or a limited system. If we at TOD want to get away from just resource modeling with Hubbert Linearization and talk about the big picture wtih various planning scenarios this is the set of tools we will have to use. For a layman or anyone with a good science or engineering background and an inteest it seems this would be what we need to learn in our spare tim to figur out how to see what is possible and what not. I would presume however that such a model, depending on what one has inmind needs a computer programme, custom made and lots of data gathered over many months so that it would be impractical for our off th cuff threads made over a weekend. Is this right or can one just work up something quick and dirty with standard tools on the web or elsewhere?
I've found that learning system dynamics is a little like learning to play chess. You first learn how to move pieces, then you can play the game. But becoming a master takes years of practice. I am still a novice in system dynamics; I am learning. I can make models using Vensim and found that it is a good way for focusing one's mind on the way the system you are studying works. On the other hand, coming from Hubbert style modeling, I found surprising that Vensim (and not even Stella, as far as I know) has no routines for data fitting. It is a different world, a different philosophy. S.D. models, it seems, are not supposed to be predictive tools. Nevertheless, I am trying to do exactly that; use S.D. models to fit oil production curves. For that, I had to enlist the help of a coworker who is a better programmer than I am and who built specific routines using Simulink. We are getting interesting results that we plan to publish, but we are doing that in our spare time, as usual. It is a law of academia that the most interesting research project is the one that doesn't get financial support. So, it moves on, but sloooowly......
Systems dynamics has its uses (IIRC that's what the World Energy Modeling Project are using). However it tends to break down in two main areas:
So when you are talking about resources or areas where humans just react blindly it can deliver some insight. However when things start going wrong it can badly fail to represent strategic or tactical action from C&C type economies.
As a simple for instance. It would be perfectly possible to imagine someone letting off a nuke in the heart of the Saudi oil region. The instantaneous effect on oil supply would be obvious, as would the environmental impacts. However it would also bring other worldview models to the front. The world after such an event wouldn't run on the same rules as the world before. There is no way system dynamics can model such changes since the very makeup of the model depends on your understanding of how the world works now.
If you want to play, there are SD tools around. However I'd tend to focus on complex adaptive systems approaches if I were you.
I googled complex adaptive systems and got a university link with some Mac software:
http://cognitrn.psych.indiana.edu/rgoldsto/complex/
and a quote:
http://www.innovation.cc/volumes-issues/rogers-adaptivesystem7final.pdf
and from WIKI of course:
http://en.wikipedia.org/wiki/Complex_adaptive_system
Sorry, I did tend to throw away the end comment.
The benefit from my perspective is that you can create individual agents which behave as actors in your simulation, complete with known behaviours, possible behaviours, and memory. You then combine these and look at what comes out of the complex whole, together with a degree of Monte Carlo simulation of parameters, random events. From the population of results you gain understanding of how the simulation will tend to react across a likely range of circumstances (eg where are the attractors) and if your simulation is anything like reality, a deeper understanding of how real systems will react. Agents don't need to be people/nations, they can be identified groupings, resources, anything.
I think you can see from the links you pulled out why I think they are a better match for modelling the characteristics we are interested in.
intuitive appreciation !
Studied all this stuff (and much more) through those, you know, "Quantum Chromodynamics & The Charmed Quark for Dummies" style books.(populist commentries may be the precise term ?)
These matters you good folks speak of are definitely valid as methodologies and I basically make all my decisions in life based upon an intuitive mathematical engine that compiles many varieties of maths, science and pseudo-science into a functional world view. I'm doing very well thanks. A little bird tells me, WE are not doing so well at all.
Prediction - things are going to "blow up in our face" within weeks.
(The Finance system is an odds on favourite, so it probably won't be that LOL)
Smile, it's a good feeling.
Not quite... What he actually said *in the same paper* was:
"On the basis of the present estimates of the ultimate reserves of petroleum and natural gas, it appears that the culmination of world production of these products should occur within about half a century..."
That would make his estimate for peak the year 2006. In my opinion a far more astounding feat of prediction than the oft misquoted "around the year 2000".
Well, Hubbert was no fool, of course. The figure shown in the 1956 paper has the peak in 2000, but of course he knew that a prediction for 50 years in the future could only be approximate and he said so. It was an astoundingly good prediction, indeed!
The problem with the limits to growth is it's using an old and crappy simulation.
I knocked one up myself on an excel spreadsheet and depending on the inputs you can run it at a steady state. The problem is, the numbers don't always make sense if you fiddle around with the constants.
Due to the nature of feedback you can end up with chaotic systems and I suspect this is the problem with the limits to growth theory.
I made one with the following assumptions:
Pollution increases along with gdp growth (no assumption that pollution would be mitigated at a certain level of GDO).
Increased pollution causes increased death rates.
Increased population above a limit causes depletion of agriculture.
Below a certain limit per person of agriculture, the death rate increased.
What it predicted was this:
GDP continues to climb till 2030 or thereabouts, the population drops about a billion, bumps up slightly then shoots down in a pendulum like manner to BELOW zero and bounces up again with a widenining variance between low and high.
So the moral of the story is this: you can do anything with an excel spreadsheet and the limits of growth was done way before excel.
PS anyone who wants a copy of my spreadsheet to tinker with is welcome.
I got a telling off here as it is some 30 years since I read 'Limits' and I was dependent on my memory for the statements I made, amongst the replies being that it did not predict anything but painted scenarios.
I still remember though the feeling of horror with which I looked at their 'scenarios', as it was immediately obvious that the outcome was totally dependent on the initial assumptions.
I also remember that in spite of their backing off from the word 'prediction', as it could not possibly be substantiated, in the ensuing political debate the document was indeed treated as a prediction, with many claiming that it showed this or that.
A similar process can be observed at work today, where the 'scenarios' painted by the IPCC take on a life of their own and somehow become probabalistic estimates.
As soon as it became possible modelling was inevitable, but the results need handling with some care.
It is interesting however to tinker with it.
I also understand the feelings of dread the original modelers must have felt when they tried various assumptions and they all produced a crash.
I got exactly the same results until I started to put in limits such as population limits before depletion of agriculture sets in and also increased breeding in low density (things that actually happen in the real world).
What I found was that in the unmodified original scenario there is a hubber like boom then a bust. With a slight modification (population stabilizes but pollution does not) I get a population boom then a leveling off then a crash.
The crazy thing, however was when I started putting in all sorts of limits the system became chaotic (in the scientific sense of the word) and that the population crashed then started to bounce around wildly with massive swings.
Though that sort of thing can happen with turbulence in, say a saucepan of water being heated on a stove, it just doesn't happen with species populations.
Species populations do the following:
They can do the algae bloom thing where they grow mindlessly and then crash down to starvation levels.
They can go up and then stabilize (the famous "S curve")
OR
They can fluctuate between two or more levels (the famous "prey-predator" curve).
My guess is that only some of our populations will do the algae bloom thing (e.g. massive cities of several million who are powered purely by hydrocarbons).
Others will do the S-Curve and stabilize (the fewest I would guess).
The most I expect will fluctuate downwards in a prey-predator collapse and then go up again as the world economy reconfigures around renewable energy and renewable agriculture. (In some cases the predator will be war or disease).
If we as a species crash completely then we are as stupid as algae and we deserve to die.
I doubt that is the case.
Or, with some glichiness due to peak oil, the population could rise to about 9.5bn, then start a gentle downward path ending up at perhaps 4 billion in 2200.
There is, after all, as our friends who are fans of solar power will tell us, plenty of energy, and as all peak oilers will tell us, that is a critical resource.
The arguments for peaks in other supplies, with the exception of some rare minerals, seem to me much weaker - if you have enough energy.
That is really the dangerous thing about modelling, it is entirely dependent on assumptions, and just as is the case for models of global warming, we are then told, 'our models show that' when other outcomes have been ruled out by the assumptions chosen.
For instance, the GW projections assume the fossil fuels are there and accessible to cause the warming, which like all long term trends is a lot bigger at the end of the projected period, ie from the end of the 21st century on.
That is why these models are a dangerous thing - they are deeply deceptive in their usual application.
It's a little odd to me to hear that it is "dangerous" that models are dependent on assumptions. To me that's like saying it's really "dangerous" that the distance I throw a baseball is based on the initial force I give it. It's the assumptions (i.e. variables, both initial and ongoing) that make a model an extraordinarily powerful tool.
The way I see it, one really valuable thing a model does is point out that if we don't change a specific variable over time (say, pollution production per person), there is a predictable, almost certain outcome.
In the case of the Real Earth Model(tm) that we're all participating in, there are so many variables now that need to be changed that perhaps the endgame is now a foregone conclusion. Off the top of my head, some of the variables that need dramatic change seem to be:
And of course the one variable to rule them all, the reproductive rate per person.
I happen to be one of those people who thinks if it isn't fossil fuel depletion that gets us (leading to a crash of industrial civilization), the next variable waiting in line is...well, take your pick from the list above.
When I first heard James Lovelock say that there is a good chance, in his view, that humanity will be reduced to a few breeding pairs at the poles because that will be where we'll find arable land in the future, my reaction was immediate denial: "That's silly."
After some digging into the topic, now I've completely reversed my view on this matter. In fact, whether it's a few of us at the poles or pockets of humans scattered around a significantly denuded planet, I think either of those outcome are more likely than 9.6 billion people living happily on a planet built for one billion or so.
-Andre'
It is the way the models are usually used that is dangerous, not the models themselves.
They are inevitable, but need handling with care.
Hi, DaveMart.
Understood. I was going off of the sentence "That is really the dangerous thing about modelling, it is entirely dependent on assumptions, and just as is the case for models of global warming, we are then told, 'our models show that' when other outcomes have been ruled out by the assumptions chosen."
Perhaps a more accurate way of saying the above would be: "The really dangerous thing about communicating the results of modeling is that other outcomes are ruled out by the assumptions chosen and that's not always made clear by the modelers."
Something like that. I apologize for belaboring this; I think your point is a very good one so that's why I'm spending time on getting the wording right. Can you tell I'm an educator?
DaveMatt - your scathing criticism of modelling by the IPCC [Inter-Governmental Panel on Climate Change] for using in their models the resource assumptions provided by the founding Governments, seems pretty facile.
Quote - "For instance, the GW projections assume the fossil fuels are there and accessible to cause the warming, which like all long term trends is a lot bigger at the end of the projected period, ie from the end of the 21st century on.
That is why these models are a dangerous thing - they are deeply deceptive in their usual application."
The assumptions underlying your critique have no such formal justification as does the IPCC -
You assume apparently that GHG output will fall with declining conventional fossil fuel supplies, when in fact, here in the UK (and predictably elsewhere) elevated gas prices have already increased coal burning for power, thus raising TCO2eq/MWH.
Furthermore, recent reports from Asia should have informed your assumptions that both Japan and India have embarked on the exploitation of seabed Methyl Hydrates (formerly known as Clathrates). Their scale as a fuel resource utterly dwarfs that of the vast Permafrost Peat fuel-stocks, which in turn dwarfs the very large Boreal, Temperate & Tropical Forest Wood fuel-stocks.
It seems that you fail to comprehend the core of the GW problem, namely that our emissions are nearing the point at which a diverse range of positive feedbacks will, quite predictably, cause sufficient warming to offset the entire intake of the planet's rather fragile GHG Sinks (varying around 30% of Anthro-output). At that point we'd no longer have any serious prospect of managing events, as the planetary heating would be independent of our GHG outputs.
Thus it matters not a damn whether "coal supplies won't last till 2100" - what matters is sufficiently cutting the rate of global GHG output, and increasing the recovery of excess airborne carbon, In The Coming Decade.
And every tonne of dirtier replacement fuels burned as a result of depletion effects makes it more likely that we will face an American-lead global genocide by droughts and famine, advanced and exacerbated by subsidized food-crop combustion.
The problem is that urgent, and I suggest that the unwarranted turf-wars between campaigners on PO & GW are an indulgence that neither campaign can afford. In fact I'm of the view that it's high time the two issues were fully integrated to a single focus of concern.
So before trying to undermine the modelling by the IPCC, maybe you'd do well to reconsider whether they are actually doing their best under severe administrative constraints ?
Regards,
Backstop
Bryn Davidson of Dynamic Cities does a really nice job of explaining why these issues should be tackled together.
http://dynamiccities.squarespace.com/home/
Your point about positive feedbacks is well stated. We have lit a fuse. We have a very short time to smother the spark.
gTrout – thanks for your response and the link – I’d heard of the Dynamic Cities Project [DCP] but not opened it before.
Sadly I can’t find the article you recommend – any directions welcome.
The DCP organization is rather intriguing – they have the site well structured but often hollow, being titles in front of “ under construction” notes, with a notable exception being the marketing of city gardening document-guides.
They also post some amusing graphs of a rather arbitrary set of shares of global emissions budget for the next 42 years – with nations set in four categories being :
Dirtier Developed, Cleaner Developed, Wealthier Developing, Poorer Developing.
This they juxtapose with a 2050 scenario of Contraction & Convergence-to-per-Capita-Parity of emissions entitlements, but it’s hard to be sure just why, or how the massive injustices of so arbitrary a set of entitlement classes is addressed (if at all), without an explanatory text being shown.
What seems quite plain is that the proposed program of global emissions cuts on which their USA + Canada cuts are premised are not remotely commensurate with the dynamics of the energy-pollution problem.
For example, they refer to an “evolving consensus” around limiting warming to less than 2 degrees Centigrade;
and further propose that this can be done merely by cutting global GHG output by 50% by 2050.
This ignores diverse well publicized contra-indicators :
eg.: Hansen, the renowned US climate scientist, points out that to avoid accelerating the feedbacks out of control, we need to reduce airborne carbon to between 300 and 350 ppmv from its present 384 ppmv, as opposed to allowing it to rise to 450 ppmv as would reportedly give “an even chance of staying under the 2 degrees ceiling”.
eg.: In the early ‘90s the IPCC advised the UN.FCCC that to halt any further increase of airborne GHGs’ concentration, we’ll need to cut global emissions by over 60%. This advice has since been refined to: 60% to 80% .
Which means that the DCP’s “50% cut by 2050” is merely a proposal to reduce the global rate at which we are adding to the problem of excess airborne GHGs, and to take 42 years doing so. It would radically exceed the 2 degrees ceiling requirement.
By contrast, Blair & FOE’s 60% and the Pres. candidates’ 80% would get as far as halting additions to the problem in 42 years time, but only if the feedbacks magically switch off tonight.
In the real world, India, which recently joined Africa and the EU Parliament in declaring for Contraction and Convergence, has now set a blunt public challenge for the West – that it will keep its own per capita GHG emissions below the average of industrialized nations. Given that its people emit around one tenth of western peoples’ per-capita volumes, and its energy usage is rising fast, this makes the West’s dalliance with the far-too-little far-too-late 2050 targets both scientifically and diplomatically bankrupt.
The real prospect is that the West, to win Developing nations’ co-operation in getting a reliable treaty, is going to commit to buying GHG emissions entitlements from those nations with surpluses due to their large populations with low per capita emissions.
The revenues so earned need to be ring-fenced to accredited mitigation-projects if the system-outcomes are to be optimized
(the provision of assistance with adaption-projects is evidently a justice issue in its own right)
and while the provision of traded entitlement will usefully allow industrialized nations to progress out of fossil fuel dependence far faster than would otherwise be the case, that ring-fencing of vendor-nations’ revenues will, critically, help them to avoid any further increase in FF dependence.
However, those purchased entitlements will need to be paid for, and the sole logical and reliable source of sufficient funds is from the value of the GHG pollution permits traded within nations under (what should be called) “Cap, Allocate & Trade” schemes. This unavoidable dynamic has yet to be discussed on any US media that I’ve seen, and is surely of central future relevance for North American cities.
Hoping that there may be more to the DCP setup than I’ve found so far
(not least as regards the member-cities’ interaction with the countryside on which they depend fundamentally),
regards,
Backstop
Hi Backstop,
There is a global warming vs peak oil slide show and talk on this page:
http://dynamiccities.squarespace.com/dcp-slideshows-publications/
I agree, the targets have fallen behind current science, but those targets have been shrinking quite a bit. (we are in deeper trouble that we imagined just a few years back). But I think his main points are that the two camps need to work together. Solving peak oil by coal to liquids is a disaster. And trying to solve global warming by switching from coal generated power to NG (soon to run out in North America) is a dead end and we don't have time for more dead ends. Bio fuels have a similar problem.
I have to admit I don't know much about GHG mitigation plans that currently exist. Do you know of a technically feasible plan to reach 80% reduction by 2050?
Thanks for the commentary regarding the evolving nature of climate targets. The intent of the analysis isn't to argue for any one global target, but rather to lay out a methodology for arriving at (and communicating) appropriate local targets relative to whatever the consensus is for global reductions.
In this case the general algorithm is:
1. Assume a global target for emissions reductions
(a political consensus target in contrast, perhaps, to what the evolving science might actually be calling for - as noted by Backstop)
2. Assume a relative share for the wealthier+higher emitting nations vs. poorer and lower emitting
(again the 4 tiers are arbitrary, and are used as an analytical tool vs. being a proposal for policy)
3. Assume a relative share for leading cities vs. other parts of a nation that are likely to lag
(again arbitrary, but with an assumption that cities have the infrastructure, capital, knowledge etc. to be leaders when compared to rural and suburban areas)
The result? If you want to get to a global-average target of 50% by 2050, then leading cities like Vancouver should probably be targeting 80-90% reductions for the same time period. Independent of where the science is, we believe that these targets are close to what will be politically enacted over the next decade - and will manifest as fiscal policy (just as the the BC Carbon Tax was announced today).
Again, if the global target is more aggressive, then the local target should update as well.
The point? To create an emissions reduction path that can be compared/contrasted with oil depletion scenarios to see which might end up being the greater driver for change.
As a general strategy, Dynamic Cities aims to use scenarios, which bundle multiple sets of assumptions together, vs. arguing at length about any one assumption (TOD is much better at that!). We've found this approach to be very helpful when engaging a broader range of stakeholders as it allows for a dialogue that can bypass some of the technical and ideological barriers which often get in the way of discussing the most important aspects of 'energy transition'.
Thanks
Bryn Davidson
www.dynamiccities.org
ps
We're currently an all volunteer group of architects, planners etc. whose day jobs sometimes interfere with our peak oil / climate hobbies (!) We're working towards getting the funding to flesh out the framework and content, but the effort has been challenging over the last several years due to a general lack of depletion literacy on the part of funding bodies. To those ends, anyone interested in contributing, or providing leads to funding sources please contact us. bd
The question about the possibility that fossil fuels do not exist on the scale suggested by the IPCC is in fact not mine, but was suggested in an article in this forum.
I remain of the opinion that the likeliest outcome is in fact similar to those suggested by the IPCC, but find the degrees of certainty expressed rather absurd.
On a bell-curve of probability significant possibilities remain for a different outcome to the central 'scenarios' - and let us remember that they are in fact presented as such by the IPCC, contrary to the way they are used by many people as forecasts - these include alternatives on both the downside and the upside.
It is odd that many of those who are most convinced of global warming should be happy to consider other possibilities of greater global warming through trigger points being exceeded, but wish to dismiss out of hand possibilities of the effects being less, due to negative feedback mechanisms or other factors such as periodic lower activity from the sun counteracting the still- valid greenhouse effects.
Where you are coming from is best illustrated in your own words:
This is language appropriate to political discussion, not scientific debate.
Is is wholly appropriate in looking at scientific matters to subject them to the greatest degree of scepticism to determine how robust they are, and wholly inappropriate to regard that as 'undermining', or too bring in sentimental considerations such as how they are coping with their administrative constraints.
The way you are looking at it puts you in the position of a political activist or advocate, rather than one who retains a dispassionate enough stance to properly evaluate the data.
I repeat that I feel that the most likely outcome is similar to that in the IPCC central scenarios - remember again that they are NOT forecasts- but feel that there are significant possibilities of outcomes either under or over that projected, and I certainly intend to bring every level of criticism that occurs to bear on their and any other attempts to see what will happen.
I suggest that you re-think the passionate way in which you seek to elevate the central SCENARIO to something not to be questioned.
The future path of carbon dioxide emissions depends on:
1) When we hit Peak Oil and Peak Natural Gas.
2) How much coal really is extractable.
3) Whether clathrates and other less conventional fossil fuels will really amount to much.
4) Potential technological breakthroughs on solar photovoltaics and other non-fossil fuels energy sources.
I think we have a far clearer idea about the oil and natural gas than about the other factors. The future has some big unknowns in it.
And even "totally dependent on the initial assumptions" is itself misleading...are the models any less dependent on variables that change as the model progresses, like birth rates changing due to prosperity and other feedback mechanisms?
Isn't it more fair to say the model outcomes are totally dependent on, well, how the model is constructed?
correct! :-)
Huh?
I'm wondering which constants and which relationships. And how do you justify claiming that a spreadsheet that you created in a short time adequately captures relationships? If you want to make a claim about the value of modeling, you might want to consider a good one rather than a quickly made one.
The World3 model created by the Meadows et. al. team had 225 variables, and they carefully scrutinized the relationships between each relevant variable. Whenever possible, they used real world data to define relationships. Their model was designed through extensive examination of how things relate to represent characteristics of the real world. The cartoon of their model shown in the article here on TOD is just that - a cartoon. The actual model was carefully made, checked and rechecked, and calibrated against known historical progressions. I think they ran it in reverse back to 1900 and found that it pretty much matched the data. So how do you call it crappy?
Furthermore, the point of the book was not that the designers of the model had managed to pick constants and relationships that gave some particular behavior. The point was that certain relationships - such at that between capitalization and the use of nonrenewable resources, or that between population and population growth - fundamentally lead to exponential behavior (in the absence of limits). Meadows et. al. found that the progress of modern industrialization is exponential.
We can see this ourselves in graphs of world oil production before 1970, world population, and other relevant measures.
The point made repeatedly by Meadows et. al. is that the structure of our world system inherently leads to overshoot and collapse. While you don't really need a complex computer model to get this message, the World3 model showed just how robust this behavior is. They tried lots of tweaks in attempts to get the model to show something other than a population collapse and it took some pretty unrealistic and optimistic changes to their model just to get the population to stabilize. These were things like total recycling, total birth control, and twice as many resources as the current best estimates for the world. And the model was run starting from 1970 back when it might have been possible to make changes that would make a difference.
In their latest book "Limits to Growth - the 30 year update" the authors regrettably find that their original 1970 model had accurately projected the developments up to this date.
So while modeling certainly has limits, it shows us some very important things - notably that the basic relationships between things in modern civilization yield pathological results in the long run. I'm not optimistic that any adaptive system can substantially change the fundamental relationships that lead to runaway growth, particularly at this late date. And particularly since most of the systems have not really started trying to adapt yet.
By the way, you can get a limited version of the World3 model on CD. It runs on the Stella systems modeling software.
Unless of course the basic assumptions were daft.
With the exceptions of fossil fuel reserves which are a specific case probably produced under rare circumstances and of some rare minerals, the whole idea of absolute limits to resources is not really sensible.
As long as you have adequate energy resources you can go to lower grade ores, and solar and nuclear energy are so abundant that any shortage can hardly be more than a glich caused by poor management and very cheap fossil fuel resources making it not worth while to invest in other supplies.
The idea of 225 variables in a computer programme reminds me of the concept of expert systems that were popular for a while. I saw a TV programme or read an article on the topic and the example was made of a man who did some very complicated and experienced mechanical work but who, as he was retiring an there was no replacement had to be replaced by an expert system. They put a technical guy on it who observed every movement and questioned him about why he did what he did. Most of what the worker did was instinctual, subconscious, as he had been doing it so many years and to describe or consciously say why he did it would be quite difficult even to himself. Ok so after some months they figure it out and get this thing running. A similar experience to what I have just described was described in the following:
http://www.truetao.org/living/200701.htm
Now generally speaking simple, linear and logical models made by men, scientists, etc. are dismissive of intuition. “Female” or left handed intuition is simply a subconscious understanding of a massive number of real world variables which the conscious logical mind cannot hold in its grasp at one point in time. Therefore the LTG model is an attempt to approximate the “hippie” intuition of ca. 1970 that the world was going to hell in a handbasket using complicated models and computers which could approximate human intuition or left handed/female type of thinking.
Yeah, that is why it did not ring too many bells for those of us of a right-handed, male-thinking disposition! :-)
When I first picked up a copy of LTG (2004 update), I didn't know much about what was between the covers. I had heard much talk about it, of course, and I guess I was expecting something quite different from what it turned out to be. Not to say that there is anything wrong with what it is - I guess I wasn't expecting the whole book to be a discussion of the results of computer modeling.
Before the "Limits to Growth" was published, Jay Forrester's book on Systems Dynamics was required reading of all engineering students in the first "engineering course" we were required to take before going into our respective majors. The point was that we, as engineers, would be dealing with exponential functions and sometimes things hook up in rather interesting and sometimes counter-intuitive ways.
In 1972, when the "Limits to Growth" was published, it immediately became required reading for the same course as well as for the various environmental courses of the day. You need to remember that the major pollution control acts had just been passed (National Environmental Policy Act of 1969 which gave us Environmental Impact Statements, 1970 Clean Air Act, Federal Water Pollution Control Act of 1972 which eventually became known as the the Clean Water Act) and policy and legal precedence to deal with newly minted environmental laws was still being developed.
Then, of course, we had the first OPEC oil embargo which was the first oil shock for most Americans. Some of my ChE professors were "Hubbert aware" and by the time I graduated, it had become clear the US lower 48 had peaked, right on schedule. We missed a huge opportunity to "change course" but I also expect that growth (as the religion it had become) would overtake all steps to mitigate environmental and resource depletion.
As pointed out by Matt Simmons, the orignal book never referred specifically to oil, but the basis for resource depletion is based upon the principles of finite resources. It was the first time I really got issue of exponential growth and what a serious problem it would present. The timing of the US peak and the OPEC Oil Embargo made it all the more poignant.
So here we are, on the path put forward by the original book. Should we be surprised. No. As Dr. Al Bartlett says, we don't have to do anything because the limits will show up regardless of what we wish. The difference is that we may not have any sense of choice or control over the outcome or the path to the outcome.
It might interest some of you to know that Jay Forrester has (I believe he is still alive) a very wide range of interests.
For example, I believe he developed magnetic core memory - the original memory of computers in the 50's and 60's.
In system dynamics, he modelled the dynamics of the growth of suburbia. He showed how US cities grew at the periphery and fell apart in the centre. His book was called "Urban Dynamics". He got into a lot of trouble over that one. His profile in Wikipedia is very short on his achievements.
I know all this stuff because he was one of my heroes in the 1970's. I read most of his books.
Jay Forrester is still alive, I hope. The last time I contacted him, last year, he answered me via email. He seemed to be still in perfect shape. He was really a great man for his many contributions in science. Too bad we all get old!
Marion King Hubbert did not believe that peak oil was peak energy. He quite correctly believed that breeder reactors could supply human society with a very large amount of energy for a very loargw time. In 1975 Alvin Weinberg and H.E. Goalier demonstrated that a high level of material civilization could be maintained through the use of nuclear power and materials substitution:
http://www.osti.gov/energycitations/purl.cover.jsp?purl=/5045860-HVRCd7/
For all practical purposes the materials needed to maintain a high level of material civilization are infinite. My own review suggests that with avaliable mining technology deposits with uranium concentrations as low as 10 - 20 ppm can be mined with an energy output gain of 16 - 32 times energy input.
http://nucleargreen.blogspot.com/2008/02/will-uranium-run-out.html
According to Deffeyes & MacGregor's (http://nuclearinfo.net/Nuclearpower/UraniuamDistribution) data, that would be over 80 billion tons of uranium.
Breeder reactor technology would allow for reactor use of uranium at 100 times the efficiency to light water reactors. In addition thorium, which can also be used in breeder reactors with equal efficiency, is 4 times as plentiful as uranium. Thus the worlds supply of uranium and thorium are virtually unlimited.
Since reactor produced energy can be used in the extraction of mineral resources from the earth, the whole Club of Rome business is absurd, and people who take it seriously are foolish.
so, next your going to show us those commercially operating breeder reactors?
The reason the French reactor was not commercial and they stopped further development was because uranium was so cheap!
Similarly for nuclear power as a whole, since FF did not have to pay for there carbon emissions, and reactors had crazy planning regulations which were always changing and poor licensing procedures, they were relatively expensive - anything would be if built the same way.
Nuclear is now coming close to competitive pricing, even without full carbon costing:
http://www.telegraph.co.uk/money/main.jhtml?xml=/money/2008/02/13/bcnene...
The fact that the shares have risen indicates that in the judgement of the financial markets nuclear will compete.
ok - so, give me a ring back when you've got that breeder up and running.
On other points, I'm not counting on a companies stock price to tell me about the future of a technology (consider Netscape).
I could have given you a ring back many years ago when the French got theirs up and running.
Markets are often wrong in their guesses on price - it is just that most other ways of forecasting have been wrong more often.
If you are confident that you can do better than the market, you can easily place your bet.
That is what Warren Buffet has done for many years, but it is tough to do.
Breeder technology(plutonium) is just not practical yet; the only operating breeder in the world is an old Soviet era breeder. Superphenix(France) and Monju(Japan) are still closed.
The usual ratio given is that breeders can extend 'enriched' U-238 60 times over lightwater reactors. The usual number of years quoted for extending nuclear powered electricity at current rates is 700 years. Certainly not 'unlimited'. The 'unlimited' folks
are talking about extracting uranium from seawater, which is about as believable as extracting gold from seawater or grinding up granite for ounces of uranium.
The only other technology is heavywater reactors for thorium and the cost of heavy water is extremely high and bound to become impossibly high at high electricity prices. The Indians like to talk about thorium because India has a lot of thorium, not because they have thorium reactors.
But in the end economics will kill all nukes when uranium prices skyrocket. The mad scramble to build more plants will kill nuclear power.
majorian - Uranium is 99.3% U238, and 0.7% U235. About 0.3% of the U238 gets transmutated into plutonium in LWRs and gets burned. The 0ther 99% of the U238 can be transmutated into PU239 in breeder reactors. That makes the energy efficiency of breeders 100x of that of LWRs. The price of heavy water in not nearly as expensive as you have indicate. The current cost of heavy water @ $300 per kilogram is far cheaper than Uranium enrichment. Thus heavy water use is cost effective in reactorsa, because it produces far superior burn rates for reactor fuel. In fact so called spent nuclear fuel, can be very inespensively burned in heavy water reactors.
The Canadians prefer heavy water CANDU power reactors and sell them all over the world. http://en.wikipedia.org/wiki/CANDU
Atomic Insights (Vol 2,#3) reports:
The heavy water in a CANDU requires a capital investment equal to approximately 20 percent of the cost of the plant. Overall, the initial capital cost of a CANDU is ten to twenty percent higher than a comparable light water reactor depending on local labor costs.
On a lifecycle basis, however, lower fuel costs tend to make the two systems roughly comparable on price, so decisions between the two are often made on the desire for independence, the availability of local labor, the availability of capital investment, the existing infrastructure of the customer, and the availability of vendor incentives.
http://www.atomicinsights.com/jun96/pressure_tube.html
However your account of breeder technology made serious omissions. Argonne National lab successfully operated the Experimental Breeder Reactor II (EBR-II) for 30 years. The primary reason why breeding technology is not in vogue is that Uranium is still so plentiful, and manufacturers and utilities still think it is cheaper to stick ever more new uranium and plutonium into reactors, rather than breed more. Civilian power reactors are currently burning up cold war era nuclear bombs and warheads. Getting rid of the nuks keeps fuel costs low. There are other breeder technologies which you failed to mention including the molten salt reactor, which breeds thorium. Thorium is 4 times as common as uranium in the earths crust.
Yuri Sokolov, head of the IAEA Department of Nuclear Energy, says the nuclear experts are confident of 4.7 million metric tons of "identified resources," which can be mined for less than $130 per kilo. "We know they exist because we can see them in mines that are already dug, or in rock samples that have been analyzed for the next mine, or they can be inferred from the surrounding geology," he said.
World uranium resources in total are considered to be much higher. Based on geological evidence and knowledge of uranium in phosphates, the study considers that more than 35 million metric tons are available for exploitation.
http://www.ens-newswire.com/ens/jun2006/2006-06-06-03.asp
But Sokolov, failed to consider other, less conventional sources of uranium and thorium, including:
* Coal fly ash - World uranium reserve several hundred thousand tons
* Phosphate and other mine mining tailings - an enormous reserve
You scoff at the notion of extracting Uranium for sea water, yet the Japanese have already developed the technology to do it.
http://nextbigfuture.com/2007/11/two-proposals-for-mining-ocean-for-720.htm
A Japanese report to the ANS can be found here:
http://www.ans.org/pubs/journals/nt/va-144-2-274-278
More information can be found here:
http://peakoildebunked.blogspot.com/2006/01/207-uranium-from-seawater-pa...
And here:
http://peakoildebunked.blogspot.com/2006/01/208-uranium-from-seawater-pa...
I stated in my previous post I noted that with energy input to recovery ratios possible with existing extraction technology, more that 80 Billion tons of uranium are recoverable. We can expect on this basis to obtain another 320 billion tons of thorium, enough to last the human race for a very long time.
I saw those articles about burning 'U-238'(Pu-239) in CANDUs. It's an interesting idea, but nobody is doing it.
Thorium breeding to U-233 is also interesting but nobody is doing it.
Breeders mean energy intensive reprocessing and then there's the waste (which Reagan thought could fit under his desk).
Breeder reactors are far more dangerous than LWRs as they operate at very high flux rates; a reactor rupture would release truly gigantic levels of radiation.
Nuclear energy is too valuable to be squandered on DVDs, TV sets and plugin cars.
Read all those articles on phosphates and Japanese uranium sea traps; let me know when they extract a couple thousand tons of yellow cake.
Meanwhile, until we get something REALLY GREAT technologically from nuclear science we should avoid
raising false hopes.
(At least you had the sense not to bring up nuclear fusion.)
No, because uranium is still so cheap.
Its not energy intensive, its capital intensive.
Its not a good idea to start throwing around techspeak when you dont know what you're talking about. Fast neutron breeders are more dangerous than light water reactors, but it has nothing to do with 'flux rates' but rather the delayed neutron component of reactivity, which just makes the reactor harder to control in the event of reactivity swings. A 'reactor rupture' wouldn't release any more radioisotopes than a similar accident at a LWR, and possibly could release much less depending on the fissile load and the core density. There are reactor design parameters that can be introduced to combat the reduced delayed neutron component of fast reactors (doppler broadening, highly negative temperature coefficients of fluid fuel fast reactors) as well as simply using thermal breeder reactors which are no more dangerous (and often safer) than light water reactors. Some breeders are thermal and some are fast, depending on what sort of fuel mix you need to burn.
I cant speak about uranium from the sea, but I know uranium was sold to industry as a byproduct of the phosphate industry for decades.
The link
http://nextbigfuture.com/2007/11/two-proposals-for-mining-ocean-for-720.htm
Doesn't resolve. Do you have links to the original articles upon which the blog post was based?
I haven't seen any update to the 2003 Japanese experiment.
Thanks!
In any case, I've reached much the same conclusions as you have about the availability of Uranium.
There are more details here:
http://npc.sarov.ru/english/digest/132004/appendix8.html
I will continue to look for more recent accounts.
The Japanese appear to be continuing to research the concept, but have no motive to go into commercial production. The price of uranium is too low to justify going into production. The Japanese would love to mine the sea given favorable prices because the sea is Japan's primary resource.
I recently received this omment on my blog:
jmuckerheide said...
The consistent 3.3 ppb U in seawater is in chemical equilibrium. If it were being depleted, we would expect that additional U would be leached and put in solution from ocean bottoms, hydrothermal vents and cold seeps, and terrestrial sources (primarily through tidal pumping on the continental shelves, with some from rivers and other discharges). If we extracted a billion tons over hundreds of years, it is more likely that the oceans will contain nearly 4.5 billion tons than be reduced to 3.5+ billion tons.
Is this a "renewable" energy source?
There is an l missing in that link here is a good link
http://nextbigfuture.com/2007/11/two-proposals-for-mining-ocean-for-720....
There is clearly a contradiction between these two statements. A breeder cannot be 100x more efficient and be more expensive at the same time. There must be a huge cost left out of your calculations. Current LWR nuclear plants are low EROI in the 5 to 10 range per a whole slew of studies done in the 80's (more on that topic to follow). So breeder reactors must be even lower EROI or they would have been built instead. My guess, and it is a guess, is that highly radioactive fuel has a huge hidden reprocessing cost compared to uranium that can be handled with relative ease.
Why are there no thorium reactors? If thorium is more plentiful, then why are they not in use? I don't have an answer, but I have never seen an answer posted here. Is it because they are less profitable than current reactors?
On the uranium from sea water: Are there any peer reviewed scientific journal articles that reported the extraction of uranium from sea water, or is "peak oil debunked" the most credible source you can provide?
Those calculations are almost certainly wrong. Modern calculations of CO2 emissions from Nuclear Power published in peer reviewed Life Cycle analysis journals give CO2 emissions that imply far higher EORI.
See Weisser "A guide to life-cycle greenhouse gas (GHG) emissions from electric supply technologies", Energy, Vol 32 (9) pp 1543-1559 (2007)
or
Donnes et al. International Journal of Life Cycle Assessments, 10, P 10-23 (2005)
thanks! I will check them out.
[edit]
An initial read brings up the major issue: GHG calculations are totally dependent on the power sources used to build the plants and drive the uranium refining. Some plants assume all hydro power for refining and construction and have very low emissions. That does not mean they don't use power, it is just low GHG power. That means needing to dig into the actual accounting.
Sigh. So much for simple! Ok, more reading to do.
GHG calculations are totally dependent on the power sources used to build the plants and drive the uranium refining. - gTrout
The big issue is the technology used to enrich uranium. Centrifuges use 50 times less power than gasses diffusion.
Yes. From reading the reports it seems clear from a GHG perspective that we should only be using Centrifuge enrichment. We should shut down the diffusers and the power plants driving them and save the emissions. If we powered that enrichment from hydro, than you could even see nuclear power as a hydro-extender of sorts.
Energy used for enrichment is diverted from the grid, so that one needs to caclulate emissions based on the grid mix. The same would be true for your suggestion to use hydro power as that could be used elsewhere. It would be best to concentrate on sources that don't use fuel so that associated emissions can be brought to zero as the grid is transformed.
Chris
There is clearly a contradiction between these two statements. A breeder cannot be 100x more efficient and be more expensive at the same time. There must be a huge cost left out of your calculations. - gTrout
More expensive to build. Fuel costs are actually only a very small part of the const of nuclear power. Thus the savings from a more efficient fuel cycle may not compensate for the added cost of the reactor. The economic motive for breeder reactors kicks in as fuel cost rise.
Current LWR nuclear plants are low EROI in the 5 to 10 range per a whole slew of studies done in the 80's (more on that topic to follow). - gTrout
This is an absurd green lie. Recent peer reviewed studies of nuclear EROI show that it falls in a range that is similar to solar generation.
So breeder reactors must be even lower EROI or they would have been built instead. - gTrout
Garbage in garbage out! If you start with a false assumption, you will reach a false conclusion!
My guess, and it is a guess, is that highly radioactive fuel has a huge hidden reprocessing cost compared to uranium that can be handled with relative ease. - gTrout
I have already argued that the low cost of nuclear fuel, gives power producer little incentive to wish to economize nuclear fuel use. Some approaches to the breeder fuel cycle are far more expensive than others.
The molten salt reactor system includes inexpensive methods of fuel reprocessing while the reactor is online.
http://www.energyfromthorium.com/forum/viewforum.php?f=4&sid=0106903bf99...
Molten salt reactor can breed either U238, or Th232 and are also very safe.
Great. Can you cite them? My goal is not political. It is to get to the truth on these issues. I would be glad to read those sources.
My source is
"Energy & Resource Quality", Charles Hall, Cutler Cleveland, Robert Kaufmann, 1986 reprinted 1992 Colorado University Press. pg 276 & 277 which summarize multiple studies. Decommissioning costs were not included in the EROI studies.
I am interested in driving out bad information with good, as much as that is possible. You can quote anything i write in comment.
This paper (Energy Analysis of Power Systems) summerizes numerous studies and should be useful:
http://www.uic.com.au/nip57.htm
It should be noted that the EROEIs are not all that comparable in this link. Wind, hydro and PV produced electricity while nuclear, coal and gas produce heat. I've tried to rework a version of that table 2 to make the comparison a little easier here.
Chris
It should be noted that they're both meaningless except to indicate that they produce more energy than they consume, and then it comes down to economics at the end of the day, which is far more divorced from energy payback ratios.
Wind, hydro and PV produced electricity while nuclear, coal and gas produce heat. - Chris
Chrism Wind and hydro provide mechanical forces for the turning of generators, the sunlight in solar facilitates chemical reactions. Your arguments is absurd.
In theory you're right, but in the accounting for E-ROI people tend to count the electrical output from renewables (rather than the wind or solar forces which are converted to mechanical work turning the generators), while they count the thermal output from thermal electrical generation plants (which is comparable to the wind/solar power before conversion to mechanical work).
So Chris is quite right. Most E-ROI figures for renewables need to be multiplied by a factor of 3 to account for the difference.
Indeed they should. Puts everything on a nice level playing field. Where Chris is wrong, however, is in claiming that the UIC link does not account for this. He lazily assumes they don't. He provides zero evidence for this assertion.
Well, I was being generous - what I described would be better than the usual practice, which simply takes the thermal value of the electricity output for all forms of generation, thus under-estimating the E-ROI across the board.
I think Chris was safe, if he did assume it.
Actually, I did do some checking of references where I could track them down. Charles' link appears to be the original for the WNA page and I found another link as well that seemed intermediate. So far as I can tell, what I am asserting is true. If you look at the bottom of table 1 in the WNA page you'll see that the value they give for their nuclear power calculation is explicitly stated as thermal. Going through their calculations reveals some imprecision but confirms that they are discussing thermal output only. In deference to Mcrab, I have propsed a second term for those who do not want to call the corrections to the WNA table 2 EROEI. Charles is incorrect in saying that solar PV produces chemical changes. It produces electronic transitions. I think also that stopping at mechanical work for wind is a bit pointless unless one is considering a wind driven water pump. The main thing is that the energy delivered for coal, gas and nuclear is substantially less that the energy used to produce a deliverable and to make a useful comparision with wind, solar and hydro one needs to account for this. It should be pretty obvious that energy sources that don't require fuel should take less effort overall. The nuclear industry attempts to hide this in the information they present. This is largely in passing because their main purpose is to hide associated carbon dioxide emissions by saying that enrichment is done using nuclear power rather than the energy mix on the connected grid. This dishonest approach greatly reduces their credibility.
Chris
Chris, are you arguing that nuclear power should be made more efficient, which is my view, or are you arguing, that renewables have some sort of superiority? Solar EROEI means nothing when the wind does not blow. Wind EROEI mean nothing when when the air is still. Who cares about about EROEI if there is no power when people want it?
Renewables require less energy in to get the energy we want, namely electricity. On improving nuclear's thermal efficiency, there are serious difficulties because the fuel is quite delicate and needs to be protected by various complex mechanisms from melting. Coal could be taken up to 60% efficeincy similar to gas, but nuclear is pretty much stuck at a low efficiency. I think you misunderstand EROEI. The returned energy is calculated over the lifetime of the wind turbine, not moment-to-moment.
Chris
This is hardly balanced Chris, as you seek to entirely ignore arguments which might run counter to your thesis.
Here is one plan to increase the efficiency of nuclear burn by a factor of 50:
http://advancednano.blogspot.com/search/label/thorium
advanced nanotechnology: thorium
There are others.
It appears to me that you are not making an attempt at any balance in your judgements, but are seeking to argue in a purely polemical and political manner.
" Solar EROEI means nothing when the wind does not blow. Wind EROEI mean nothing when when the air is still. Who cares about about EROEI if there is no power when people want it?"
Intermittency is greatly exaggerated as a problem for renewables. That said, I have to say I find this argument silly, and intellectually dishonest on both sides.
Nuclear advocates point to non-problems (like intermittency) with renewables which they pick up uncritically from obsessive critics like Lovelock (who apparently loves the unblemished view of the English landscape more than he does his own reputation for, well, being in his right mind), and renewable advocates point to non-problems like plant emissions of radioactivity, and mining/enrichment emissions of CO2. Both point to out-dated E-ROI analyses. I should hope by now that we could put that whole argument to bed - wind/solar and nuclear all have E-ROI that's convincingly higher than any reasonable threshold for concern, unlike biofuels.
I'm not the biggest fan of nuclear, because of what I consider it's one, irreducible problem: a link with nuclear weapons. I suspect that most nuclear critics, at bottom, agree. After all, the European green movement evolved from the peace movement. I'd still prefer a greater emphasis on renewables than on nuclear. Who can disagree that we'd be better off if we had a convincingly superior solar alternative to offer the Iranians, to pre-empt a nuclear program? Who can view the sudden eruption of proposals for nuclear programs in most of the countries of the mideast without being very, very nervous?
Nevetheless, I've reluctancy concluded that the nuclear genie is out of the bottle in the 3rd world, and that we need all low-CO2 sources to deal with climate change. I hope we can all agree on this.
We should stop this silly food fight, and concentrate on more important things.
Nick,
Nuclear weapons poliferation is not the only reason people oppose nuclear power. Certainly greens look first at the problem of nuclear waste rather than proliferation. As the green movement has grown, activists from other movements have brought their concerns, but the greens pretty much always start from a ecological analysis. Peace issues are drawn in like justice issues owing to the need to have the ability to control the human/ecology interaction. You can't expect rain forests to provide sequestration if people are kept so poor that they have to cut the forest to live for example. Nuclear waste can't be unmade without putting more energy in than you get out which defeats the whole point of nuclear power. So, to greens, nuclear power if first and foremost foolish rather than a threat to peace. Physicians oppose nuclear power because they look with horror on the prospect of treating the victims of an accident. They know the score on this. People who love freedom oppose nuclear power because they can see that nuclear power implies a long term commitement to a large security apparatus, the existence of which imperils freedom from within. Quite a few nuclear physicists oppose nuclear power because they see that it is a low quality energy source.
The nuclear proliferation issue is a result of liberal policy: "Atoms for Peace." Any nation is suppose to have the right to develop nuclear power. At this point, the only solution to this problem is denuclearization with nuclear weapons states actually disarming completely and also shutting down their civilian power programs. Control of the fuel cycle is not going to happen. Leadership on this would allow the worldwide banning of nuclear power and shut down the proliferation threat. But, as you can see, the proliferation threat is only one of many reasons to oppose nuclear power and for many it is not the chief reason.
Chris
Well, I could be wrong, but I read the history of European greens very differently.
After WWII Germany in particular went through a pretty thorough self-examination, and came out of it pretty anti-war. All of Europe suffered much worse than the US, not to mention that many still remembered the horrors of WWI. Then, of course, Europe was ground zero for the cold war (Neutron bombs, etc). The peace movement became much stronger because of the overwhelming results of a nuclear exchange (nuclear winter, Schell, etc). AFAIK the Green movement largely grew from the peace movement.
Helen Caldicott is a good example of this. She was a very strong anti-war activist for a long time, and now she's anti-nuclear. The evolution is clear.
Nuclear waste is certainly a real problem, but it seems much, much smaller to me than climate change. It can be stored for decades, and we can deal with it later. The risks of accidental radiation releases are much smaller than the radiation released by coal, let alone the damage that climate change would cause. The same thing applies to nuclear accidents. The security apparatus required by nuclear exists primarily because of proliferation risks. I don't know about physicists believing that nuclear is "low quality": I've seen my share of physicists saying silly things outside their area of expertise. That seems related to the questions about E-ROI: your argument in the past seems to have been that dirty power used for enrichment greatly lowers E-ROI. I can't see it: if you use 1 dirty KWH to get back 10 clean KWH's, isn't the net effect 9 clean KWH's? You may have borrowed a dirty KWH for a couple of years, but that's much less harm than consuming it, perhaps only 10% of the harm (CO2 interest?).
I can't imagine any justification for shutting down existing nuclear plants (as proposed in Germany and elsewhere by Greens) given the threat of climate change. Surely there's no environmental justification, given the coal production that would inevitably replace it. The only justification I can imagine is based on the much larger danger one might see from proliferation. If that's not the true motive, then these greens really are goofy (and I don't think they are).
I wouldn't mind seeing all new nuclear construction cease, and all those resources going to wind/solar, but we probably have to demonstrate to 3rd world nations that wind/solar can really do the job before we do so.
I think we just have to continue doing both wind/solar and nuclear.
Hi Nick,
Peace work and ecological work are certainly intertwined. And perhaps I should say that greens tend to look at statements of principle (e.g. The Ten Key Values) holistically.
I should let you know that you have been deceived concerning radioactive emissions from coal. Coal comes from fossil biomass and so it has the same uranium concentration as the area where the biomass grew except dilutes by carbon from the atmosphere. When coal is burned, the uranium remains in the ash and thus is not "emitted" in the sense that carbon dioxide, mercury and sulphur are. The ash has pretty much the uranium concentation of the mineral soil of the region where the biomass grew (that soil was mixed with the coal). Because the uranium is so dilute, in undergoes natural decay which is quite different from induced fission in a reactor. All life on the surface of the Earth is adapted to the background level of radioactivity from uranium, thorium their natural decay products and the cosmic ray induced natural radioactivity such as carbon-14. Life is not adapted to induced fission products which arise in the neutron rich environment of a reactor. This is why estimates for excess cancer deaths from Chernobyl range up to 60,000. The radioactive elements that were released are incorporated into the body easily because their naturally occuring counterparts are beneficial nutrients. The web site at ORNL on this subject is quite an embarrassment I think.
I have said that nuclear proponents provide very shoddy work on EROEI. Some even try to deliberately hide energy inputs. This is a separate issue to some extent from trying to hide fossil energy inputs. It should be a completely separate issue, but faking EROEI estimates makes it mixed. You have misunderstood me if you think that I am arguing that failing to account for the mix of generation on the grid affects EROEI. A wind turbine's associated emissions are calculated based on what the grid produces where it is manufactured and the same should be the case for enrichment of uranium. When you see charts from the nuclear power industry on this you should be aware that they are counting more emissions for wind than for thenselves because they attempt to say that enrichment is done using nucelar power. Wind has just as much right to say that turbines are fabricated using nuclear power as they do. Either would be dishonest. It is the mix of generation on the connected grid that is important.
I am very surpised that you think that coal generation would replace nuclear generation if we got smart and stopped generating nuclear waste. Greens are finding success in halting the construction of new coal plants. They are working to get existing plant shut down as well. Both coal and nuclear are poor choices for power generation.
Chris
Sigh. I guess I was dreaming to think I'd move anything closer to a consensus.
Well, that's interesting about radioactivity, but isn't CO2 (not to mention sulfur, mercury, etc) really the important thing about coal? On E-ROI, I don't understand why the mix of input electricity matters. You get a large multiple of that input on the output side, so the net result is a large increase in very low CO2 electricity. Surely the net is what matters. On the tradeoff between coal and nuclear: efficiency, conservation, wind and solar can't replace both coal and nuclear anytime soon, right?
I don't have time for more right now, but I'll try to add more later.
Hi Nick,
Mercury, sulfur, particulates and carbon dioxide are the main problems though there are problems related to the ash that don't have to do with radioactivity and the mining is very destructive as well both environmentally and in terms of human life.
I'll try to explain again what the problem is in terms of carbon dioxide emissions for nuclear power. Wind, solar, hydro and nuclear don't have emissions when they are producing power. They do have associated emissions to do with construction, manufacture, or, in the case of nuclear, fuel processing. Generally nuclear proponents want to cut themselves a special deal saying that their fuel processing is done with nuclear power. Some go farther to make false claims about EROEI to cut emissions estimates even more. In the latter case, it is two falsehoods not just one. That is where EROEI gets mixed in. In the former case, because electricity is fungible within the connected grid, anyone can make the claim that they use only nuclear power for whatever they are doing and be just as dishonest as the nuclear proponents. LCA studies of wind and solar don't do this, they take the mix of generation on the grid to calculate their associated emissions. Nuclear proponents then take those numbers and compare them with dishonest numbers for nuclear power and claim false superiority.
I would expect, based on the growth of solar in China, that they will have no difficulty meeting their 25% renewables by 2025 goal. If growth keeps up, they should do it with solar alone by 2020 and still have huge exports. I would expect that they'll be replacing coal substantially by 2025. Their reactors are mostly newer so I'm not sure how soon they'll replace those. I notice that the NRC has suspended consideration of licenses for South Texas 3 and 4. These were already under pressure I think from transmission being extended south for wind power, something Berkshire-Hathaway is getting into. I would think that 1 and 2 would be feeling pressure as well before too long. TUX is not building coal plants I think. Coal and nuclear can't be replaced soon enough, but soon and now do seem to be coming together to some extent.
Chris
Chris said:
And how come you don't include 'and range down to?'
Like the assessments of the World Health Organisation?
It is a real shame that you choose to use your undoubted intelligence to misrepresent the case of alternative arguments and actively mislead - of course Greenpeace, like yourself, will choose a high estimate, which incidentally is based upon the assumption that mortality rates increase from any low dose of radiation in a linear fashion which is a thesis which has now been conclusively rejected, and is now not used to assess risks in, for instance, radiological medical treatment.
Your partisan comments are becoming far too much - I refer you to your complete failure to provide substantiation for your allegations of corruption in issuing licenses for commercial reactors:
Chris said:
You have absolutely no grounds for this allegation of corruption - if you have, specify them.
How does this compare with the vast subsidies that the wind and solar industries get in Europe, and is this corrupt using the same standards, or are they the holy ones, who just happen to get massive amounts of money from the taxpayer?
You also major on recycling - may I ask you what your estimate is of the potential to recycle rare minerals such as indium and gallium from some thin-film solar panels?
Does the distributed nature of materials used in solar PV help or hinder recycling of those rare minerals, or would it be easier in compact sites, such as nuclear reactors, rather than in massively widespread solar panels subject to weathering and erosion?
Do you oppose rare earth solar panels, on the grounds that they do not take account of the need to recycle?
Dave,
I find that over time, work sponsered by Greenpeace tends to turn out to be correct. As far as I can tell, an aspect of the disagreement over estimates is that after the collapse of the Soviet Union, the health care system broke down and so people were dying of other things first. If we take the lack of confidence that Chernobyl instilled as a contributing cause for the collapse, then a portion of the difference is also attributable to Chernobyl. The UK has liability limitations for nuclear accidents. Lacking funds to recover from an accident, how would the UK's health care system fare in a similar situation?
You need to read my posts more thoroughly. I already said that public funding of elections in the US would end nuclear plant relicensing.
Europewide at least, the production subsidies offered to nuclear power through limitation of liability are much much greater than any startup encouragements for renewables.
Indium and gallium are not widely used yet but CdTe from First Solar has recovery as part of the sales contract. For these technologies, the strain put on transportation to make recycling possible is much less than the strain put on transportation by spent nuclear fuel on an energy produced basis. Recall that nuclear power is similarly dispersed and reprocessing centers are few. As solar develops, the distance from a panel to a recycling center is likely to be much less than the distance between a power plant and a fuel reprocessing center on average. Reprocessing is unlikely to be allowed in non-nuclear weapons states if current plans are implemented. This means rather a lot of transportation of very dangerous nuclear waste if nuclear is to play much of a role in energy generation in future.
For simplicity, let's consider silicon. A 250 W panel has a mass of about 24 kg. At five hours a day of peak equivilent operation for 30 years is produces about 14 MWh. So that is about 0.6 MWh/kg. For 3.5% enriched uranium you get about about 365 MWh/kg. This works out to be about the same energy density transported per unit distance since the natural uranium needs to get from the mine to the enrichment facility and the distance between mines and facilities is often larger than the distance between solar manufactuing plants and rooftops. That is to get the energy source initially deployed. Now reprocessing gives back about 10% or less of the energy initially provided by the enriched uranium and to transport it to the reprocessing center it needs substantial shielding, lets take fifty times more mass than the spent fuel though my experience working with radioactive materials in the lab tells me that this is probably a low value. So we get about 0.7 MWh/kg traveling on a round trip between say Brazil and France for fuel reprocessing compared to 0.6 MWh/kg for the solar panel traveling between say Baltimore, Maryland and Wahington, DC. So, in terms of kg-km/MWh solar does much better in its recycling behavior. People tend to feel "E=mc^2! Oooh Shiny!" thinking uranium has a high energy density, but it is so clumsy to work with that silicon does better.
I don't understand your comment about erosion.
Chris
Chris said:
Are you attempting to say that this is unique to the nuclear industry?
If terrorists decided to blow up a LNG tanker as it came into Milford Haven, which is a far, far easier target than a nuclear plant, do you imagine that the subsequent evaporation oft eh town is fully insured?
Are you proposing that all chemical plants should be fully covered against every eventuality?
This is most certainly not the case at present, not is it conceivable in any part of the real world.
As for your comment on risk estimates form Chernobyl, it was your original presentation of excess deaths being 'up to 60,00' which I found overly political, since you gave no indication that other estimates were much lower, as I would try to do even for positions I disagreed with.
Chris said:
You can not be serious, as the great man said - you might have 25 nuclear sites for a fully nuclear economy transport fuel to one reprocessing centre in Britain periodically, as against thousands of wind turbines.
The transport needs are miniscule, and we have hundreds of operating years experience doing so in the case of France, as opposed to the entirely theoretical experience in an all-renewables scenario.
Your comment on transport costs seems in any case irrelevant as it will use a miniscule proportion of total costs.
And your example of Brazil seems to me in any case dubious, as in latitudes nearer the equator I have no difficulty believing that solar power will provide most of the energy - it is the attempt to extend that to regions where the sun don't shine that is daft.
In any case any nation which does want nuclear will likely do their own reprocessing, and attempts to force them not to will fail.
My comment about erosion referred to the attempts by firms such as Nanosolar to use rare earths in thin-film solar panels.
In Arizona high winds and abrasion mean that solar panels have a lot lower life expectancy than usual.
Abrasion aside, it hardly seems sensible or ecologically sound to put most of your rare minerals into the effort to generate solar power.
Amorphous silicon or other technologies should in any case be able to do the job without, but it seems to me that dual standards are often applied between the 'bad' nuclear industry and it's ability to re-cycle as against the goody-goody' renewables industry, which often gets a free pass on issues of recyclability.
The shipment from Nanosolar is going to a factory which will place their product in panels. Thus, the PV material will be encased. Erosion of the type you are considering would not seem to be a problem so far.
Do you have any data showing a problem with solar panels in Arizona?
Do you have any data showing that solar would put most of the rare minerals into use? There is certainly data showing that nuclear power will use up uranium within about 80 years at the present rate of consumption.
I think that there is a very simple way to force reprocessing to end and to thereby end the proliferation threat: renounce nuclear weapons and nuclear power. This would, for example, end profligate tritium emissions and reveal any cheating that is going on. It just requires leadership on the part of the nuclear weapons states.
Transport needs for silicon are less than for nucelar materials. Security needs are much much less. This is an issue you raised, so I wonder why you now think it unimportant? To me, the difficulties China is having transporting coal suggest a rather elegant solution. Replacing coal with solar reduces strain on the transportation infrastructure by a factor of 200 or so. Rail in China has been a huge political issue from it's inception. Why not just rise above the problem?
Chris
My information on solar panels needing quicker replacement in Arizona due to the battering they take from strong dusty winds came from someone in the solar industry in California.
My thought that use of rare materials would use a large portion of total supplies came form a discussion on the use of rare earths.
I had not realised either proposition was in any way contentious, and since you only reply to the bits of arguments you fancy I can't be bothered to track down more exact information.
As for your claims about 'forcing reprocessing to end' this just further demonstrates the fantasy world you have allowed yourself to occupy.
How are you going to 'force' China not to reprocess?
"If terrorists decided to blow up a LNG tanker as it came into Milford Haven, which is a far, far easier target than a nuclear plant, do you imagine that the subsequent evaporation oft eh town is fully insured?"
Perhaps I'm not clear on the concept here.
My understanding is that if an LNG tanker blew up, it's owner would be liable for any damages not covered by insurance. If damages exceeded corporate equity the owner would go bankrupt.
Utilities/investors want liability caps because they prefer to avoid the risk of bankruptcy.
Does that make sense?
Perfect sense Nick, and I am not clear whether in all jurisdictions, or in which jurisdictions, companies are liable up to their full net worth, or in what circumstances.
It seems to me that negligence might have to be proved, and I doubt that failure to provide against the sort of attack I am describing would be classed as that.
In practise for trans-national corporations it might be difficult to seize the assets of the whole company anyway - look at Bhopal.
It is also difficult to determine to what extent the efforts of the nuclear industry to get around this liability arise from a scientific assessment of the greater risk from a nuclear plant compared to say a chemical plant, and how much is due to the average investor being part of our society at large, and being leery of things nuclear as so much ill is spoken of it and hence more risk-averse.
I accept your basic point though that there is some loading here in nuclear's favour, but in respect of it's principle competitors of coal, gas and oil it is perhaps not excessive as they get a free ride on a lot of emissions, let alone Carbon.
Your argument will however tilt the balance to some degree towards renewables, which I have always strongly supported, but not at any price.
In general, dealing with the maze of subsidies and exemptions in the energy industry to arrive at fair costings is a nightmare, particularly as there are so many jurisdictions, and renewables in particular very in their cost from region to region depending on the resources available.
I can however deal with the narrower point about insurance. The thing is that chemical companies and so on would have to pay for vast liability insurance if there were not exclusions in the policies, and war, terrorism and acts of God are excluded, amongst other things.
Premiums would be vast if they were included, and anyway ineffective as war losses and so on can exceed the worth of the insurer.
So in respect of insurance at least Nuclear power and other major industries have a level playing field, and substantial and comparable risks exist in other industries which are not fully costed, nuclear has been somewhat more successful that the fossil fuel industry in obtaining exemptions but a lot less in emission exemptions.
Yes, I would exclude terrorism from the range of questions about insurance liability.
I think we're in agreement that nuclear could not be built without Price-Anderson, that Price-Anderson therefore is a significant subsidy, but that it's difficult to calculate just how large it is.
I think I'm willing to accept the cost of that implied subsidy for the value of the low-CO2 power that nuclear provides, but it makes it difficult to argue that 1) renewables are clearly more expensive, or 2) nuclear would do better than renewables in a purely free market.
As I understand it, it's not your average investor that calculates the risks of nuclear, it's the insurance industry, which presumably has extensive experience in making clear-eyed and hard-headed assessments of risk of even the oddest things. Heck, Lloyd's of London insures a lot of very odd things.
Finally, there is a public policy risk in reliance on nuclear: even a single large accident would make expansion and possibly continuing operation of a large number of plants difficult. That strongly suggests that diversity of energy supply is a very good thing.
The trouble is Nick is that a lot of renewables are so darn expensive - I costed off-shore wind at somewhere around 2-4 times as expensive as nuclear, and I don't think at that price they are affordable.
So no, I don't think we should assume that we should go for renewables, as it is just not practical.
We are really in the same situation as they were with coal for many years, that they could not charge for the emissions.
There is also the point that part of the reluctance to build without limited liability is due to the fact that none have been built for donkeys years, so effectively they are pricing by looking at a new technology.
I don't think if we are going to do anything about GW and fossil fuel exhaustion we have a real option other than to get on with a massive nuclear build - it might not be perfect but it is the only way we know of providing the power we need.
The question of limiting liability is anyway not new, but is as old as modern capitalism, with the introduction of the Limited Company, prior to that people had been liable up to the total of their assets, and it was really the introduction of limits that lead to the take-off of capitalism, so I don't think we should be too purist about it, just mentally put in something of a bias to renewables, perhaps 5 percent or so, or else encourage the formation of a specific financial instrument to take on the liability, rather as Lloyds of London was set up.
In any case with greater experience such a risk premium should go down, as short of war it is really rather difficult to imagine a major breach of a modern reactor.
The risk then is for the investor really a sort of nuclear panic premium.
For instance in Japan some reactors are built near earthquake fault lined.
That seems silly to some but they really are some of the toughest structures man has ever built, and a breach of the main reactor is difficult to imagine.
However, a minor breach outside of the main reactor building is quite possible.
San you imagine the headlines? 'Radioactive Cloud escapes!'
In fact of course it all depends on how radioactive it is, and just as in the last many years of operating experience in the west it is very unlikely that anyone at all would die, and any releases form a medical point of view would be completely trivial, rather like the releases which happen all the time form chemical plants.
In the American legislative climate environment however it is quite possible to imagine demands for compensation for millions of people, even though no harm had happened to them in the American climate not many would fancy being on the other end of the lawsuits, regardless of the fact that no-one was harmed.
So the extra risk premium is largely a panic premium, and a protection against grossly excessive claims.
It is a messy and imperfect world we live in, and we have to use messy and imperfect solutions.
"I costed off-shore wind at somewhere around 2-4 times as expensive as nuclear, and I don't think at that price they are affordable."
Well, you estimated nuclear at about $4/watt (average), and offshore wind at about $8/watt. With operation & maintenance of $.02/kwh for nuclear, and $.01 for offshore wind, and a life of 60 years for nuclear and 25 for wind (that's a bit generous to nuclear, given that some work will be needed to extend life that long, and most of the wind turbine investment will last much longer) that gives a cost of about $.06/kwh for nuclear and $.10 for wind (you have to include the cost of money - I assumed about 8% interest).
That's not an overwhelming difference. I would note that the British are apparently willing to pay quite a premium for intangibles, given their willingness to forgo onshore wind (a cost difference no smaller than this - onshore wind costs about $.06/kwh in the US, which makes it cheaper than NG electrical generation), so it seems plausible to me that they'd be willing to pay that premium. Add in the fact that wind can be built much more quickly...
Your points on liability caps are good, but I can't see the implied subsidy as only 5%: I think it's quite clear that nuclear wouldn't proceed without it, and that seems like more than a 5% premium.
All sound points Nick - it is good to have a proper discussion. If I was a bit generous to nuclear on the maintenance issue, perhaps you will forgive me as I was certainly not generous in my build cost estimates- I went for the present build cost of the present one-off Finnish reactor, then bumped on generous extra allowances for completion, so I gave nothing for a series build.
Of course, this could still be an underestimate, but so could the build costs of the off-shore wind fleet, and perhaps there is some reason to fear that they might be even more prone to cost inflation.
They would use a heck of a lot more material than an equivalent nuclear build, rather than the more skilled labour intensive nature of that.
The real inflation at the moment is in commodity prices, and government estimates form which I take my figures are likely to be based on the idea that commodities will fall back to their 'natural' level - an idea many of us on this forum would tend to dispute, at least for several years due to the interaction of material costs with high energy costs.
It also does not take into account possible advances in the production of nuclear energy, whilst the projected cost figures for the wind build certainly take into account bigger turbines and so on.
For instance, the use of annular fuel might well substantially improve the economics of nuclear power, and that for existing reactors as well as purpose built reactors:
http://mit.edu/canes/publications/abstracts/nfc/nfc-095.html
Abstract: Feasibility & Economics of Existing PWR Transition to a Higher Power Core Using Annular Fuel
So I have, I feel, been by no means over-generous to nuclear overall in my comparisons of likely costs.
The real core of my preference for nuclear as against over-emphasis on renewables though is that I feel that renewables masquerade as a solution, but are unlikely to actually get us out of the woods, whereas nuclear would, and certainly putting the primary emphasis on it would lead to greater cost reductions and faster improvement in nuclear reactors than would otherwise be the case.
As an example of what I mean, suppose we build the full 33GW of off-shore wind here - what then?
That is only going to give a power flow of around 10-11 GW per hour, and we use around 75GW at peak, and that is just for electricity.
Heating by gas probably uses a similar amount of energy, and then there is transport....
Where are you going to put that number of turbines?
Of course, purely theoretically you have more power available in the North sea, but that is in deep water, and the costs are huge compared to the comparatively modest costs in present proposals for close in-shore wind.
They built oil platforms at those kind of depths, but the revenue flow from each platform is many times that from an individual wind platform, so you can afford more robust structures.
I don't rule out the prospect of breakthrough technology changing things, and indeed am a firm advocate of research into high-altitude wind, but we simply do not have the engineering at the moment, and may never have.
As for on-shore wind, Britain is a small island, and in England many of the best sites are already taken.
Most of the resource is in Wales, Scotland and Ireland, which are fairly autonomous if not independent, and they simply are not going to cover their landscape fully with turbines for the benefit of the English - and in any case the resource is too small for the magnitude of the problem.
You will forgive me if I do not rehearse fully the difficulties with solar power, where the trouble is essentially that in the winter when it is most needed you get very little power, and the cost is much higher than wind, so again huge breakthroughs are needed for it to be of much help in Britain.
There is a fuller discussion of this problem on my blog:
http://energy-futures.blogspot.com/2008/02/solar-energy-for-uk-and-north...
Geothermal power, whilst interesting, is in it's infancy and we don't know how to get the needed power from it at any reasonable cost.
I passed on some information about a TV program on this in the thread on 21st Feb on this forum.
Let's contrast this with the prospects of using nuclear reactors to power our society.
At around 1.5 GW (rough figures, for convenience of back of the envelope stuff) for each modern reactor, then for your 75GW you would need 50 reactors, say 25 sites with 2 reactors.
Hang on though, that would mean that we were vastly over producing for the slack periods!
Thinking it through though, we will certainly have to power our cars by this means, so they can simply be charged in slack periods, so your 50 reactors actually take care of a good deal of your transport needs too.
You then need to budget for displacing gas, so lets allow the same again, another 50 reactors, which would also have slack for more transport needs.
So there you have it, around 100 reactors to run society in a low-carbon way.
Can we do any better than that? You bet - at the moment British homes are largely gas heated, with a all electric society most in this climate could also use air-heat pumps, with the latest CO2 ones multiplying your electricity into heat equivalent by a factor of around 4.
Better insulation, better public transport with more pedestrian friendly streets and so on could all help to reduce energy needs.
Lets throw in the idea for annular fuel - please note, that there are plenty of other possibilities, so I am just using one of them to be fair.
We won't take all of the advantages we have worked out here, as doubtless other uses for energy will crop up, and that is also a point in favour of nuclear, we don't really have to restrict ourselves too much in our use of energy,and you might be talking about 40-100 reactors in total.
Contrast that with the rather Heath Robinson idea of covering most of the North sea with windmills, and I know which seems the sounder idea to me.
Nothing I have said here should be taken as knocking renewables in general, indeed my own feeling is that solar power will end up providing most of the energy in suitable latitudes, but at the moment they are just providing an expensive distraction to countries like Britain in providing for a low carbon future.
Just one final though on the off-chance that you are still with me after this very long post! ;-)
Portugal is pressing ahead as fast as anyone with renewable energy, and has much better cheap hydroelectric resources, and yet we are told:
http://news.bbc.co.uk/1/hi/programmes/working_lunch/7256687.stm
IM(not very)HO renewables just aren't going to cut the mustard for reaching our carbon targets and ensuring security of energy supply in Britain and countries like it, and we simply have to get on with a nuclear build.
Sounds fairly reasonable. I agree that both renewables and nuclear are extremely likely to become more cost-effective with volume, though of course both wind and nuclear are swimming against the tide of Chinese driven commodity inflation.
A few thoughts:
I'm not as familiar with European renewable resources as the US, and I don't have the time for further analysis of their costs and resource potentials at the moment - in the US there's clearly enough (on-shore) wind and solar resource to easily provide all the generation needed, in a reasonably cost-effective fashion, and largely within a shorter timeframe than nuclear. Wind power is already often cheaper than NG generation, and solar will be competitive with peak retail rates very soon.
I agree that countries like Germany are paying a substantial premium for wind & solar - I would hesitate to assume that they're being irrational in their priorities, though I think they would be going a bit overboard to shut down any more nuclear plants (and I suspect they won't).
One of the purposes of the current renewable buildout in Germany is to incentivize cost-reductions in renewables. This has been largely successful, though more progress is needed (and clearly in the works). This was an expensive gift from the Germans to the rest of the world, and they deserve our gratitude.
The Iraq war is likely to cost over $1 trillion. The primary public justification for that war was WMD (and surely at least 50% of that justification could be allocated to nuclear weapons). Proliferation has a real, and very large, cost. It's my primary discomfort with nuclear, and I'm willing to over ride it only because CO2 appears to be an emergency, and because 3rd world nuclear appears to be impossible to rein in, at this point. Nevertheless, I think we should make one of our very highest priorities further cost reductions in renewables, so that countries like Iran (with pretty good solar resource!) will have no plausible reason to pursue nuclear programs.
BTW, you may be surprised by how little expansion of electrical generation is needed to power EV's: in the US it would only take about 15% more KWHs. EV's are surprisingly efficient compared to ICE's. You might find the same thing for heat-pump HVAC, compared to the resistance heating currently common in the UK.
Deep water wind is likely (though not proven) to be much more cost effective with either floating or tension-leg platforms. That's the other interesting wind option, besides high-altitude wind.
Nick, I would have agreed with you about renewables potential in the US yesterday, which is as you suspect a lot greater than in Europe, but Gail the Actuary, who as you know is nobodies fool, posted this link today:
http://www.countryguardian.net/halkema-windenergyfactfiction.pdf
halkema-windenergyfactfiction.pdf
It is plain as a pikestaff looking through this that windpower is basically a diversion, IMHO, and cannot provide enough power to make any substantial difference.
OK, it might be alright sometimes in some specific locations, but with materials costs as high as they are at the moment I doubt there is anywhere in the Western world that they are remotely economic.
But the main thing is that they just don't scale.
I think it depends on what you mean by solar will be competitive with conventional soon - I don't see any evidence of it at the moment - I don't know if you know but Nanosolar looks like a funding announcement, with the technology still uncertain rather than a ready to go product - I can provide links if you like - and the new Stirling thermal dishes, which to date is more economical than PV, still sounds like a costly proposition - and I am talking really costly.
So don't bet the farm on solar - I have great hopes, but they are just that, hopes, and should not stand in the way of effective action now.
As for proliferation, I am afraid you are trying to shut the door after the horse has bolted.
Most nations now, and any nation soon, will be able to make nuclear weapons regardless of the West's attitude, and regardless of whether we in the West have a civil nuclear program.
I find it somewhat surprising that people still seem to think we can - just look at how unsuccessful proliferation avoidance was in the twentieth century, with nation after nation getting nukes, when the technology was a lot less widely understood.
Yeah, I was aware of the efficiency figures on EV's - the figures for nuclear were just so good that I was embarrassed to show how few we would need to build given more reasonable assumptions! :-)
I agree about deep water wind, but even after it is developed it takes many, many years to deploy a new technology in enough numbers to make a real difference - form now, with no clear engineering solution, if you said 40 years you would be pushing it.
Charles is too modest to give you a link to his site, a real resource for all things nuclear, but here it is:
http://nucleargreen.blogspot.com/
Nuclear Green
Here is another great resource on nuclear energy:
http://www.nuclearcoal.com/energy_facts.htm
Energy Facts
Thanks again for the reasoned debate Nick - that can be kind of rare.
ummm...Dave, you do realize that Country Guardian is a flakey UK group that will publish anything that appears to make wind look bad, in their quest to guard the English countryside from the "peril" of "industrial" wind?
sigh. I'll take a look at the article, though I likely don't have the time tonight.
As for Nanosolar, yes I've seen anonymous speculations that the announcement was a funding milestone, rather than a real rollout - I'd be curious to see the links.
Yeah, Alan alerted me to that - I must say I did not care for the tone myself, and in fact I discounted a different link on another occasion , when I first saw the figure of £66bn for off-shore wind here in the UK as I thought the columnist might have a bee in his bonnet, and even went to the trouble of doing some costings of my own, against Government figures, and came up with the marginally more bearable figure of just over £40bn, but it seems that the Telegraph was right after all.
I referred to it because I have the highest respect for Gail, and she gave the link and seemed to think there was some substance in what he was saying.
I also found some of the power calculations interesting, but I think I will stop referencing it, so consider the referral withdrawn - I usually post better quality links than that, apologies.
" I think I will stop referencing it, so consider the referral withdrawn - I usually post better quality links than that, apologies."
Thanks, that's very conscientious of you.
I've had a number of discussions with Gail. I think her heart is in the right place, and she works very hard at it, but her instincts are very pessimistic, and she's not nearly as skeptical as she should be with regard to information with pessimistic implications.
For instance, she assumed that the Tahil lithium monograph was correct, when we now know (as Stuart has also recently concluded in a TOD post) that he was pretty far off-base. More importantly, any discussion of electrification as a substitute for oil will end with her concluding that society won't be able to sustain the grid due to transportation problems. That, of course, is conceivable, but I find it very, very unlikely, as it would take governmental incompetence on a monumental and sustained level to prevent high-value items (like generator parts, or utility employees) from being transported wherever they needed to go.
All of this would be unimportant if she wasn't presenting herself as an expert on energy, and preparing educational materials.
Nick, the GE ESBWR has an estimate core melt down risk of once in every 29 million years of operation. Furthermore, the containment measure for the ESBWR are such that even in the event of core melt down only noble gases would be likely to escape. Noble gases were the only fission product to escape at Three Mile Island in any large amount. Three Mile Island produced no casualties or property damage outside the reactor. Hence no liabilities. Thus even in the even of the once every 29 million year core melt down happened there is a very considerable chance that there would be no liabilities. Hence risks entailed with the use of ESBWR should be insurable, and should be insurable at trivial costs. The risk of earth being struck by a meteor sufficiently large as to destroy human civilization are probably considerably greater than a truly catastrophic accident with a ESBRW. Reactors that are far safer than ESBWR are possible.
Nice to see you back, Charles! - I was fascinated when I worked out the implications of a wind-turbine build, and hope other will find it of interest.
BTW, Charles and Nick, I costed the 33GW nameplate build for off-shore wind at $80bn, based on Government figures, and was told that I must have made a mistake, it was way too high!- there is a item on Drumbeat on the 22nd Feb that has a cost from Centrica, who will actually pay for it - $136bn!
There may be some additional inflation on the nuclear costs I estimated, too, but even so....
Dave, 136 Billion is quite a value. The estimated cost of Long Island Power's offshore wind project was up to $800 Million for 140 MW or rated power last year when they pulled the plug. The capacity factor was 38%. Costs for wind facilities are rising very rapidly, and because they use more steel, concrete and copper per installed KW than nuks do, the inflation in materials hits the renewables harder than it hits nuclear. furthermore new technology have the potential to lower both materials requirements and construction costs for the nuclear industry, while solving the nuclear waste problem, and other problems.
Charles, that seems plausible to me.
One question is, do the utility and insurance industries agree? So far, in the public debate, there has been no hint of repealing Price-Anderson.
2nd, neither TMI nor Chernobyl were foreseen. In fact, some of the safety measures that were thought to increase safety at TMI contributed to the accident (too many alarms going off, reducing rather than increasing response to real problems), and Chernobyl had just received an award for safety, which contributed to over-confidence on their part which led to their disastrous carelessness.
3rd, there is a positive feedback to a single accident: rational or not, it would undoubtedly make further expansion, as well as possibly continued operation of some existing plants, very difficult.
It seems very hazardous to me to rely on one source of power. That's one reason I reluctantly support expansion of nuclear.
Nick,
I think, although of course Charles will speak for himself, that this is where the condition of the legal environment in which the industry is run comes in - in the States, I can easily see a small, harmless release, perhaps from the puncturing of ancillary cooling equipment, which has negligble radioactive content, attracting screaming headlines about a radioactive cloud, and a lawsuit for countless millions.
The trouble is, we are trying to arrive at a rational risk assessment and looking to the insurance industry to help us, but they in turn are dependent on the legal framework which I would suggest in the States is unlikely to aid us in arriving at a true and rational cost of expected risk.
In other words, there is a substantial but unknown 'hysteria premium'
On your second point, human beings will always run reactors and so there are, in theory at least, no absolute guarantees.
However, it should be noted that the containment vessel at TMI did it's job - no one died.
The reactor at Chernobyl did not even HAVE a containment vessel!
If you look at the French experience, they have thousands of operating years of running reactors, without major incidents!
The nuclear industry in the West is one of the safest industries in the world, unsurprisingly since it was designed from the ground up with safety in mind.
Respiratory deaths alone from the coal mining industry are estimated to cause over 20,000 deaths in America alone a year - proven deaths from Chernobyl according to the World Health Organisation come to around 100, and no-one in the west has been proven to have died from the nuclear industry! (note, that is not true of the research or weapons plarts - but deaths , or rather shortened life expectancy has been rare there too, and mainly in one plant in Russia.)
If you compare it to the wind power industry, mining the extra materials alone is going to cause far more deaths, not to mention maintaining structures 100 meters tall sometimes in very adverse conditions.
If you want details of accident data for the nuclear industry compared to others, Charles or I can send you a link - the more you know I believe the more your mind will be set at rest.
Similar considerations apply to your third point, which is really where most people's worries lie, and that is the risk of a catastrophic accident.
Again, no-one has ever died from one in the West, and the new reactor designs are even safer.
And again, the more you know I am sure the more reassured you will feel.
Here is a brief link to the reactor types being considered for the UK - but if you like again Charles or I can provide extensive details, and I think you will come away as I did with the feeling that the engineers have done a wonderful job, and know exactly what they are doing:
http://www.timesonline.co.uk/tol/news/environment/article3168541.ece
New generation of nuclear reactors promises ‘greener and safer’ energy - Times Online
As for some minor accident bringing everything to a grinding halt in the nuclear field, the thing was in the 70's there was a lot of cheap fossil fuel about, and so no incentive to push on.
I feel it was mainly budgetary reasons that killed the nuclear industry, as at the time interest rates meant projects with high upfront costs were difficult to finance.
However, they had in fact built a harbour so that you could assemble reactors in a production line fashion in the states, and that would have greatly reduced costs.
Ironically, although they should not be solely blamed, greenhouse gas emissions now would be far lower if they original plans for nuclear expansion ad gone ahead.
Although it is wrong to blame them for the past, for the kind of reasons I outlined in my previous extensive post I don't think we should allow them to delay us too much now - we need low carbon energy too much.
"I can easily see a small, harmless release...attracting screaming headlines about a radioactive cloud, and a lawsuit for countless millions."
But that wouldn't make the lawsuit successful.
Liability plantiffs (manufacturers, doctors, etc) have succeeded in demonizing civil lawsuits, but careful analysis shows that they are off base. There's no reason to believe that damage awards are excessive, or that the insurance industry is incompetent.
The rest of what you say makes sense. Nevertheless, I think we should note that there are significant external costs to nuclear, including Price-Anderson and proliferation (don't forget that Iraq trillion dollar expenditure). Also, I think you're understimating the effect of TMI - some of the cost overruns that created budget problems were due to redesign induced by TMI.
I think it's a mistake to "fall in love" with something which we identify as a solution, and it's also a mistake to go too far emphasizing the positive about it in a debate (as I did at the beginning of this one). Only when we present a balanced picture will we have credibility, and only when society has balanced information will it plan properly.
To be honest Nick, although I am not doomer, I do think that we have very badly messed up and are in a situation where we really can't afford to be too picky.
I found this in the Times - it is and old article, but shows some of the situation we have gotten ourselves into:
http://www.timesonline.co.uk/tol/news/uk/science/article2631117.ece
I don't know what they are banging on about coal gassification, we don't do that much if at all now, and can't really expect the time to develop the tech and deploy it any quicker than we can deploy nuclear, which we do know how to do.
I suppose we always run the risk of coming over as an acolyte of whatever our own choice of solution is, but I have run the numbers to the best of my ability, and keep coming back to nuclear.
Everything else either emits too much carbon (coal, perhaps methane hydrates), is not ready at a cost anyone can afford for the big time (PV) or is just too small to make the a great difference (biogas).
You've got a couple of other technologies where the cost is not quite as high as PV and we can make work, wind and solar thermal, but costs are rocketing and that is largely due to rising prices of energy and materials.
In short, we are in a fix, and it is going to be difficult to get out of it as more things go wrong with the system - basically we needed to get alternatives ready whilst costs were low and we had plenty of FF, and didn't.
Perhaps unlike Gail, I think we could run a technological society without the use of FF, and with the projected population.
Policy decisions make it increasingly unlikely that we will get there without very major disruption, and perhaps worse, in my view.
It looks like we will shortly have starving people in the third world again, just as when I was young in the 60's, and this makes me desperate to get on and build what we can, and to take some action - IMHO, a lot of people will shortly start dying, and urgency is required - that is what I find so strange and frustrating in debates here, and even more in the paralysis in the outside world, at the complete lack of urgency.
I suppose people who could see the War in Europe coming also had the same sensation, of being in a nightmare and wanting to scream.
I honestly feel it is gong to get dark and cold and hungry in many places soon, as though they were at a standstill in tank production before the war as they could not decide the colour to paint them.
On a personal level I must say what a very great pleasure it is to have this reasoned debate with you, Nick, but if at some time soon the debating here and elsewhere does not become vigorous action, we are in serious trouble.
I tried, but there was no way as far as I was concerned that I could make renewables keep the lights on, and believe me I did try.
Well, I read the Times article.
I'll try to comment tomorrow.
Nick, in Tennessee they say there is more than one way to skin a cat. If insurance companies refuse to engage in rational insurance practices, then the government should become the insurance carrier of last resort, but reactor operators should be charge a premiums for catastropic coverage based on the real risk.
Actually both TMI nor Chernobyl were foreseen. I am doing a study in my blog of controversies over nuclear safety within the nuclear industry during the 1960's and 70's. The AEC actually purged Alvin Weinberg after he warned about safety issues. Weinberg pretty much foresaw TMI. Nuclear safety experts in the West knew that the Chernobyl reactors were unsafe. The Chernobyl reactor would hot have been licensed under either the AEC or the NRC, because of known safety issues.
" If insurance companies refuse to engage in rational insurance practices, then the government should become the insurance carrier of last resort"
Please see my reply to Dave.
"reactor operators should be charge a premiums for catastropic coverage based on the real risk"
That seems very reasonable.
"The AEC actually purged Alvin Weinberg after he warned about safety issues. Weinberg pretty much foresaw TMI. "
hmh. That the primary nuclear regulatory body suppressed principled dissent about safety issues isn't a reassuring precedent, is it?
Chris said:
So your idea of substantiation for your original accusations of corruption in the licensing of the nuclear industry is to drag in another precarious and unverifiable assumption?
This is absurd.
What really gets me is that you know far, far better than that - you well know that this is not evidential at all.
You have made specific allegations of corruption, and it is plain that you have done so without any objective evidence at all.
Chris said:
This actually explains your position well.
It is ideologically driven.
Unfortunately that is not a good stance to enable the objective evaluation of facts, as the preconceptions are rooted by the nature of the ideology.
You have chosen the coloured lenses you wear, but it is difficult for the rest of us to see how you can objectively evaluate data or fairly comment in these matters since you have made such firm pre-judgements, and those of us who do not share your system of metaphysics can perhaps take each argument on it's merits rather than relying on an over-arching system, which effectively precludes balanced judgements by yourself on the individual concerns we are considering, since overall nuclear power has been decided to be a 'bad thing' in your value system.
Which is a long way of saying most of us are unlikely to trust your judgement in these matters, or put much faith in your arguments, since they are rooted in a prejudicial assessment of the issue to hand.
It is rather like having a juror who goes along with the statement that 'all men are rapists' - in a trial it is difficult to see how the accused would be declared innocent.
You have already made your mind up, and any facts or discussion will be bent to your thesis.
It would be nice though if you would occasionally try to fairly present the other side of the argument, as the polemics are misleading to those who are perhaps not well informed on the subject to hand, and somewhat tiresome to the better informed.
Dave,
In principled dialog, making one's biases clear is generally accepted as helpful rather than a hinderance. As it turns out, the green ideology leads to workable solutions to environmental problems. This is not magic. The greens have accepted that human beings are a part of nature, a part of the ecosystem, and thus they have the intellectual tools needed to both recognize problems and craft suitable solutions. Those who do not recognize this truth may arrive a suitable solutions by accident, but this is fairly unlikely. The core aspects of green thought happen to be just what is needed to address current problems which are, in fact, emergencies. Surely, you'll admit that your posts are quite ideologically driven. I have pointed out to you on several occasions where your talking points have come from. The question is, which ideology is more likely to provide a useful framework for finding actual solutions to the problems we face, which are fundementally ecological in nature. Ideologies which ignore ecology are very poorly suited to that purpose.
Ideologies can create dogma, a set of unquestioned assumptions, which can make them less helpful. Your pro-nuclear dogma leads you to state that the energy density of uranium makes it superior for example. It turns out that silicon has a higher energy density. This should help you to question the dogma you espouse and grow intellectually. It may also be useful for you to bring specific objections forward concerning the ten key values, for example, to see if they have similar unquestioned assumptions. The green ideology, being more recent, probably has less dogma but could contain less thorough thinking. I'd be happy to discuss the ten key values with you if you like.
Chris
In what way do I have a pro-nuclear dogma?
I merely advocate using different technologies where appropriate, and should costs in future in the north mean that another technology was more appropriate, would alter my viewpoint.
That is the essential difference Chris. I maintain a falsifiable position, and hence am within the bounds of reasonable discussion.
You OTOH have so firmly entrenched your prejudices by elevating them to an ideology that it is inconceivable that you are going to find anything good to say about nuclear power.
Your premises are in the end as far removed from rationality as the Book of Mormon, and whatever it is that the Jehova's witnesses believe in, and discussion leads to entirely fake argumentation with factoids trotted out to support the previous religious conviction in creationism, or in your case for some mystical renewable holistic whatever.
It should also be noted that if you really want to screw up, first get yourself an ideology- it makes it so much easier to rationalise truly daft actions, like the Great leap forward, or throwing away a genuine opportunity to reduce Global warming in the pursuit of entirely unrealistic renewable solutions in places where they are wholly inappropriate, cost vast and the technology untested.
Obviously you feel that yours is right, whereas all the others were wrong, but it leads you into the most strange and biased interpretations.
You caution against accepting data from those you term 'climate change deniers', well Chris, in much of your argument you are certainly not trying to present a picture which is in any way balanced, and are instead heavily slanting the data, for instance in not even mentioning the now wide the variety of estimates of mortality from Chernobyl was, so perhaps the term 'nuclear denier' would fit you rather well.
It is certainly the only realistic way we know in the north to rapidly and cost-effectively deal with producing energy in a low-carbon way.
It is a shame that fantasies about what is possible through the use of solar or wind power in the near future are getting in the way. of doing so.
Dave,
Ideologies are rationaly based for the most part. Communism owes much to the work of Hegel for example. That is why the word "idea" is related to the word "ideology." But they do tend to accumulate dogma. That you seem to take offense at any criticism of nuclear power suggests that you are dogma driven on this subject.
Holism is intellectually more challenging than reductionism. It therefore requires even more rationalism since it needs to synthesis reductionist results in a more sophisticated manner than, say, Hegelian dialectic. For some problems it provides the only rational path to solutions and thus is worth the effort, especially when the probems are existential.
You seem to feel that "cheaper" is the only criterion for decision making. This is clearly an ideological stance related to the work of Adam Shith. Much progress can be made from this stance if one is willing to consider all (merely social) costs, and staying within reductionism can even get you part way there. For example, the large production subsidies for nuclear power skew energy markets and thus do not allow "cheaper" to be arrived at through market forces. If the nuclear power industry were to insure itself against liability for accidents as is the case for wind, there would be no contest on price. Not acknowledging this is a case of pro-nuclear dogma getting in the way of useful application of your ideology.
Chris
Your accusation that I have a bias for nuclear is unfounded, since over my life I have altered my position several times.
After both Three Mile Island and Chernobyl I felt it was appropriate to pause any build, until what had happened could be fully evaluated.
I am a strong supporter of renewables where they are appropriate, but both their uses and limitations are now much clearer,at least with the present state of engineering.
My alleged use of 'cheaper' as the only criteria is false, as I take other factors into account, but certainly I keep my feet on the ground and realise that things have to be paid for, and we can't just use fairy dust.
OTOH you have explicitly stated your a priori judgements, which could anyway have been guessed at by your insistence on renewables everywhere, all the time.
You also argue by innuendo, such as your allegation of corruption in licensing, which on being challenged you merely made a further absurd claim that public funding would result in no more licensing, as though that had something to do with it.
On the contrary when I found I had made a mistaken claim about modelling in the IPCC projections, I immediately withdrew it, which was easy for me as my positions are not ideologically driven, but are based on rational considerations.
Dialogue with you is unfortunately not productive, since you are apparently an ideologue and fanatically committed to your preconceptions - reasonable assessments are not to be looked for from your self, as the glasses you are viewing things through are too tinted.
I bet you have not changed your mind on renewables no matter how the data changes.
However, I withold the right to counter your more outrageous baseless slurs.
To borrow your style of argument, since you have not taken the opportunity to counter the "slur" that nuclear is more expensive than wind, you obviously concur and have now shifted your position again and no longer support nuclear power.
I recall that John McCain ran on the idea that the system was corrupt in 2000. He has since tried to do something about it. His efforts have not been adequate, but what he did accomplish shows that there is general agreement that there is a problem with corruption here. That the NRC is cosy with the industry is also well known. Relicencing plants without refurbishing them up to the original safety factor is an obvious engineering compromise. That they are accepting generic analysis rather than actual measurement on the durability of safety critical parts shows that engineering priciples have been dispensed with and the motive to "not burden the licencee," pushed from above, has taken firm root in the NRC. None of this in inuendo, it is just a problem we have here. Where you are, plants are not relicensed for such long periods. Perhaps you pay closer attention to engineering principles in the UK.
I would urge you to accept that you are very ideologically driven. This will help you to calrify your thinking.
Chris
That the NRC is cosy with the industry is also well known.
The things you say! Ha!
mdsoplar said:
This is simply polemic.
Which physicians oppose nuclear power? All of them or some of them?
How do you know that of the ones who do oppose nuclear power they do so on the basis you propose?
In 2005 China installed over 26GW of new coal fired generation and 1.3GW of new wind generation. Since the capacity factor of wind is at most one half that of coal, the effective installation was at closer to 0.65GW. What is your explanation for this choice of generation mix?
Are you asking why the Chinese didn't choose wind over coal, if I think wind is so great?
ummmm...who suggested that wind could compete with the cost of a coal plant with no scrubbing or sequestration?
I think it's perfectly obvious that switching from coal to wind/solar will require internalizing the cost of pollution (CO2, sulfur, mercury, radium, etc, etc).
OTOH, the difference isn't as great as one might imagine. New coal plants in the US, with scrubbing but no CO2 sequestration, are much, much more expensive than older coal plants to build. Wind may well be competitive with such plants, even with no CO2 costs allocated to the coal.
Why would the Chinese want to do this when they are striving to catch up to us economically and we are not even content with our current level of wealth, but are constantly striving to get richer? However, I do not believe that the choice of coal over wind is based soley on short term costs. Without storage wind cannot provide peaking power and, at best, can provide only a fraction of its capacity factor as base load power.
In a report by prepared by the Tyndall Center for Climate Change Research concerning the energy security of decarbonized energy systems they modeled the effects of wind penetration into the U.K. electricity mix up to 37% of total electric energy (that's kWh not kW) supplies. At this level of penetration they claim that only 9.4% of conventional capacity can be retired. Furthermore, they make these comments about the effects of having to use conventional generation to back up the variability of wind generation:
Sigh. I guess I was dreaming to think I'd move anything closer to a consensus.
Ummm...I never suggested that the Chinese would indeed switch from coal to wind. I think they some incentive to do so, because many urban Chinese are having a hard time breathing, but I don't see an enormous shift as likely anytime soon.
On intermittency, that's a long discussion. One thought: there's no question that there will be a cost to reducing the utilization of coal plants, but isn't that a good problem to have? Another: I wouldn't suggest that a 100% wind grid would be economically optimal. Solar is much better for peaking, and if you read what I wrote carefully, you'll see that I didn't rule out nuclear. No, we need a diverse set of energy sources. See my other recent post for more info on handling intermittency.
Roger K,
Regarding UK wind resources the latest report from the Government gives a much more favourable picture:
http://www.eci.ox.ac.uk/publications/downloads/sinden05-dtiwindreport.pdf
sinden05-dtiwindreport.pdf
Admittedly it did not attempt to look at penetration rates as high as 37%, but it is favourable basically because the wind resource has excellent load-following characteristics in the UK, being two and a half times stronger in the depths of winter than in June, and even stronger daytimes that at night.
The fly in the ointment for the UK is that much of it would have to be off-shore, and again according to Government figures that would cost around £40bn pounds for the 33GW nameplate, 10-11GW actual hourly average output of the build that they project.
My own figures based on experience in the reactor in Finland under construction and allowing for still further delays and higher costs than originally intended put the cost of the Areva 1.6GW reactor at around £3bn, so around 7 of them and £21bn would do provide the same energy as the off-shore at half the cost.
Now China has an excellent wind resource, but only in some places and I haven't got a clue about it's load following characteristics.
A lot of it is on land so that makes it cheaper than the UK example and anyway construction costs are lower in China, but so are they for alternatives, so paying the extra to build transmission lines thousands of miles long seem to me fanciful.
What it boils down to is that wind, just like most renewables, is very location specific, and that plans to run a large part of the grid with it in most places are at best premature, and we simply don't have the technology at the moment at any reasonable cost.
Proponents of renewables who are trying to arrive at a different result will try to argue that advances in technology will overcome this, but they are arguing a purely hypothetical case, and costs can drop due to technology in other fields such as nuclear.
We actually know now and can implement one technology cost-effectively that is low-carbon almost everywhere, and that is nuclear energy, with it's thousands of years of operating experience.
Whilst renewables are useful and important, particularly in some regions, it is misleading to put them forward as a complete solution now with present technology.
"it is misleading to put them forward as a complete solution now with present technology."
Well, I disagree - it looks to me like it's not a matter of technology, but of engineering and implementation.
But, does it really matter at this point? We can grow both at maximum speed for 10 years, and see where we are at that point.
Wouldn't you agree that CO2 reduction is really an emergency, and that we need all the sources of low-CO2 power we can get?
If you can come up with costed solutions for renewables, I would be very interested in looking at them.
The ones I have seen ave been fantastically expensive, save in specific limited geographical locations.
So no, in fact we don't agree, as I don't think we have the money to throw at any solution but must look for the most cost effective one.
In the specific case of the UK proposals to build 33GW of off-shore wind, the cost is so huge that you are likely to slow the introduction of ways of reducing greenhouse gasses, not speed them.
For instance, with a nuclear build you could pay for an equal amount of money spent on conservation, whereas by buying the off-shore alternative you would have no funds left over.
"If you can come up with costed solutions for renewables, I would be very interested in looking at them."
Take a look at my other recent comment - onshore wind in the UK is likely to be no more expensive than nuclear. They may choose offshore wind over either of these choices - there's no accounting for taste.
Baseload is a huge problem for wind & solar. You need to constantly feed the correct number of electrons into the grid to meet demand, or else most power is wasted. In Denmark, 20% of electric generation is from Wind, but most isn't used or is exported. You cant just have someone git stuck in an elevator everytime the wind dies down or changes direction! According to the word leader in wind, E. ON Netz, Wind cannot replace traditional power generation "to any significant extent."
http://www.windaction.org/documents/461
"Intermittency is greatly exaggerated as a problem for renewables. That said, I have to say I find this argument silly, and intellectually dishonest on both sides."
"Nuclear advocates point to non-problems (like intermittency) . . ." - Nick
In my book claiming that intermittency is a non-problem is where the intellectual dishonesty lies. Intermittency is a non-problem, only for supplemental power. Intermediacy becomes a problem once renewables offered as base or even peak power. There are three methods of coping with the problem of intermittency, back up generation with fossil fuels, energy storage, or massive renewable generation redundancies. Each method requires the building and maintenance of duplicate facilities, in order to cope with the intermittency. If fossil fuel back up is required, shouldn't the backup EROEI be charged to the renewable system? The same is true for energy storage. There are energy penalties involved in operating. If a storage system is used, then why is the EROEI of the storage system not a part of of the EROEI of a renewables system? Finally we have the problem of redundancy. In order to supply anything like base power, renewable systems must discount rated power by factors of anywhere from 3 to 10. The EROEI costs of massive renewable redundancies needed to be included in any calculation of the EROEI of a renewables power system.
The EROEI of the nuclear industry is impossible to calculate with precision. For example, to what account do you charge the energy that went into the production of the U235 and Pu239 that went into nuclear weapons? Surely this was energy input into national defense. It would be a case of double billing to then charge the same energy input to reactors? I think so. When reactors burn unused bomb materials, they are in effect disposing of toxic waste. The "energy in" account should only include the cost of converting bomb material to reactor fuel, and transporting it abd loading it into the reactor, together with tho cost related to post reactor handling. Likewise, fissionable fuel (Pu239, U233) produced inside a reactor is part of the reactor's output. Thus if fissionable materials produced in a reactor are also burned in a reactor, the energy they produce is part of reactor output. This means, in the case of breeder reactors, that their EROEI potentially is far more favorable than any renewable form of power.
The argument that EROEI should exclude utalized thermal output is nonsense. Reactors are always rated by their heat output, whether or not they produce power. There efficiency in converting output heat to is another matter. both reactors and renewables suffer from conversion inefficiencies. But to say something is inefficient is not an automatic argument for its elimination. It may well be an argument for its improvement. I believe that reactors can be made far more efficient. Given alternative generating approaches, thermal efficiencies of 50% and perhaps as much as 60% are possible. Bottoming cycles can use residual heat for space heating or water desalinization. In addition, breeding can multiply reactor EROEI 100 times.
"In my book claiming that intermittency is a non-problem is where the intellectual dishonesty lies. "
Well, that was disrespectful, and I take it back. I was trying to deal with the fact that we all have such a hard time communicating, we have the same arguments repetitively, and especially that I see a pattern of similar arguments coming from people with similar constellations of views (i.e., advocates for LTG, for renewables, and for nuclear power, to name 3 prominent ones). When I saw what seemed like an example of two of these idee fixes talking past each other, I got very frustrated, and tried to address it. Badly, as it turns out.
All right, let's address a few things in limited time.
Intermittency is, obviously, a significant challenge for renewables. It's just not nearly as hard to address as is sometimes thought.
"There are three methods of coping with the problem of intermittency, back up generation with fossil fuels, energy storage, or massive renewable generation redundancies. "
There are more, and better, methods of coping than that. First is connecting grids at the edges in order to reduce the variance (aka intermittency) of various generation sources. If you make your grid effectively large enough, variance becomes manageable. This is relatively low cost, as you don't need the kind of earth-girdling cables envisioned by another TOD post recently, you just need to connect grids at the edge.
2nd is demand management: if you make meters dynamic and time-of-day sensitive, and have a large % of demand which is flexible and schedulable, generating variance becomes much easier to deal with. For instance, if you have 100M EV's (as we will in the US, in one form or another), you have a very large demand which can be shifted at essentially no cost.
3rd is location and source tuning: using both the predictable patterns of certain negatively correlated wind locations, and the negative correlation of wind and solar to reduce system variance. This costs nothing but the time spent in planning and regulating installations, something system operators should be doing now.
Now, should the cost of under-utilized fossil fuel plants be charged to renewables? No, they're a sunk cost. The fact is that recognizing the need to deal with climate change instantly causes huge costs of obsolescence for FF plants. That cost is real, and large, and I suppose it needs to be charged to someone, but it's not part of the marginal cost of renewables (or nuclear, for that matter).
The fact is, we have almost all the generation we need right now (most new plant is for peak capacity, and that's much more cost effectively handled with demand management than with additional plant). We need to build renewable and nuclear in order to replace FF plants, but we don't need to build more FF plants, so there's no additional, future cost for FF plants. Using existing ones as backup to renewables suggests that we'll be paying capacity fees to the FF plants (and somewhat less to the renewables, with lower capacity contributions), but that's not an enormous cost.
As far as E-ROI: I think that E-ROI is just fine for both renewables and nuclear. They're both very, very comfortably above 10, and that's all you need - the difference between an E-ROI of 30 and 50 is like the difference between 100MPG and 200MPG (nothing as a practical matter, just .005 gallons per mile). Heck, new US oil is below 10, and we accept it gratefully.
Does that help?
Nick, I am pleased that you are willing to dialogue about this. Let me address you your preferred methods of coping with intermediacy. I will take them out of order. You suggest demand management as a coping method. Demand variation is something of a problem for nuclear power, so I have looked at the issue from that viewpoint. There are flexible demands, that is demands that can be shifted to other times, and methods of altering consumer behavior, however some demands will remain inflexible, For example the demand for power for air conditioning in the summer. Texas is as you are probably aware quite hot in the summer, and the heat is actually a health hazard. There is no why you can get people at home to turn off their air conditioners on hot summer nights in Texas.
You suggest connection to the grid as a means of providing electricity, but how is the power going to be generated. The sun is down so solar sources are out of the picture. Texas summer wind potential drops too. I believe that the capacity factor for Texas wind generators is below 17%. But worse, the wind is highly variable, and wind output may drop to zero all over the state. Thus wind generation would provide Texas with the worst of all possible worlds, high generator redundancy plus unreliability. If your wind system is built to compensate for a capacity factor of 17%, you will build so many windmills that it would be far cheaper to just build all nuks. Thus the grid seems to provide no solution to the problems of renewables.
Finally you suggest location and source tuning. I assume that in my thought experiments on renewables. I assume that wind generators will be located in the best locations, and that solar generation will be located in the Southwest. But putting solar in the Southwest will not stop the sun from going down. And building windmills in the Texas Panhandle is not going to give you the power you need to keep Texas Air Conditioners running all night long on Texas Summer nights.
Try the thought experiment yourself.
My argument for charging the energy input of backup fossil fuel plants to renewables is this. A renewable power system, as I believe I have just successfully demonstrated, is not capable of always meeting electrical demand. Ergo, it requires alternative sources of electricity, lets call them the green crutch, as backups. Now if you went with an all nuclear system, the crutch would not be needed. We can throw the crutch away, by recognizing the limits of renewables, and not expecting more than they can deliver.
The limits are these. Wind will never be reliable enough to serve as base or peak power. Therefore wind of of very limited utility outside reducing CO2 emissions. Wind can only serve as a supplement to fossil fuel power, If fossil fuel power needs to go away, there is no rational for wind.
Solar is good at providing daytime power. But solar power imposed penalties and expenses related to materials demand, land use and security. At present the capitol costs of solar exceed that of nuclear, and the cost of materials for building solar facilities are rising. Therefore solar is a candidate for daytime peak power, but may never fulfill its expectations. Furthermore, if solar power is marginal in the Southwest, its performance will be far worse in other parts of the country.
My conclusion then is that at present, only nuclear power can fully substitute for fossil fuel power sources. Furthermore, without some significant breakthroughs in the generation and storage of solar power, the substitution of nuclear for fossil fuels is inevitable.
uhhmmm...ok.
1st, are we clear that I'm suggesting the use of both renewables and nuclear? I think the overwhelming problems we face is climate change...
more later...
Nick, I understand that, but why? Wind is only useful for lowering the CO2 output of fossil fuels. If you get rid of fossil fuels completely wind is no longer useful. Why would yuo want to use wind to supplement nuclear? ST could serve as a peak power sources in the Southwest. We will see if it can be cost effective elsewhere. Solar is not going to deliver electricity to me AC at 10:00 PM on summer nights, and wind cannot be counted on. That leaves nuclear to pick up the slack. Summer evening peak power in Texas is not that lower than daytime peak on some nights. That means Daytime peak solar van only fill in the difference between night time peak demand, and day time peak demand power.
I am not saying that this should happen. I am saying that baring some majoy breakthrough like st using molten salt technology really delivering over night power at the prices its advocates claim this is what will happen. It will happen even if the politicians are predisposed to renewables. It will happen because only nuclear is going to reliably deliver electricity to my air conditioner at 10:00 PM on Texas Summer nights.
The main problem is that nuclear can't grow that fast. The first wave of plants in the US won't be built for at least 8 years, and there will probably be only 6 of them - a 2nd generation probably won't be ordered until construction is largely complete on the first. Wind is already 30% of new capacity in 2007 at about 5GW, and new installations doubled in 2007 over 2006. Wind could easily provide all new anual installations of generating capacity in 5-7 years, before any new nuclear plants arrive.
Wind costs are falling, and solar costs are plummeting. Solar could easily be a standard requirement on all new US construction in 10 years, and it's very likely to be very, very cost-effective.
Finally, the low capacity credit for renewables is moot, because we have all of the peak capacity we'll need for quite a while (and peak is all that matters).
I wish I had more time. I'll try to add more later.
Nick, we are discussing changing out power generating systems. The peak capacity you discuss is part of the system we should be replacing. There are two questions about wind:
1. How useful is it in decreasing CO2 emissions right now?
2. What role can it play in a post carbon electrical generating system.
The answer to question one appears to be less than expected, and the total impact is not clear. Is the current subsidy on wind cost effective in reducing CO2 use? This is a clear unknown. Would, for example diverting the wind generating subsidy to more efficient electrical use yield a greater CO2 emission savings? Suppose the government took the money it now pays for wind subsidies, bought florescent light bulbs with it, and gave the light bulbs to anyone who wanted them. Would giving away florescent light bulbs create more CO2 savings.
How about the government giving homeowners solar water heating systems? What sort of CO2 savings would come from such a program?
Finally some studies of the actual CO2 savings from wind conclude that they are modest at best. Dieter Helm, Energy Economist and Fellow in Economics, New College, Oxford, observes:
“What we know, is the wind blows sufficient for these windmills to be producing about 35%, perhaps 40% of the time. So the paradox of building windmills is that you have to build a lot of ordinary power stations to back them up and those are going to be almost certainly gas in the short to medium term and that’s what’s required."
Wind in the present is tied to the use of CO2 generating fossil fuels.
Despite advocates claims about CO2 savings, we need much better data. The whole matter needs careful and impartial research.
This then is the case in the present. What about the future?
There are several problems with wind in a post carbon future. We have focused some attention to on what role wind can play in a future electrical generating system. I am looking right now at graphs of wind generation data from Amarillo, Texas (http://www.stanford.edu/group/efmh/winds/power_monthly/ama_powerm.html). I picked out Amarillo because it is regarded as having very good wind resources. Wind generators in Amarillo have excellent capacity factors, The graph for August clearly shows wind capacity factors dropping to almost zero in mid morning and not rebounding until late afternoon. Thus Texas wind resources cannot be counted on during the hottest hours of summer days. A few years ago the staff of the Electric Reliability Council of Texas (ERCOT) argued that exactly 2% of rated wind resources of Texas should be included in the accounting of as summer peak. There is a good case that are right. Summer peak power producers should be producing electricity at 1:00 PM on summer days. But almost everywhere wind capacity factors drop to unacceptable levels in the middle of hot summer days.
Are there enough good wind spots in the country to provide reliable electricity? A glance at the Stanford data suggests that we cannot expect consistent, steady generation from wind anywhere, and that national wind output varies significantly by time of day and season of the year. But summer winds seem light almost everywhere. Given what we know about wind, there appears little doubt that it cannot deliver power at the very moment when power is in demand. This is simply unacceptable, and raises serious doubts about the role of wind in a post carbon electrical generating system.
"we are discussing changing out power generating systems. The peak capacity you discuss is part of the system we should be replacing. "
Well, replacement isn't very important if they aren't used very much. If we were to fire up a natural gas (or even coal) generator for 8 hours per day, for one week out of the year, or for a stretch of 1 week out of the year, that woudn't be an important source of CO2.
"about wind: 1. How useful is it in decreasing CO2 emissions right now?...The answer to question one appears to be less than expected"
I haven't seen any analysis that supports that. I've seen it said by people who, in my best estimate, were not maintaining an open mind to positive info about wind, but I've seen no evidence. The most plausible argument I've heard is that lower utilization rates for coal/NG plants reduces their efficiency, but there's no reason to believe it would do so sufficiently to greatly reduce the benefits of reducing coal/NG production - if you reduce production, you decrease fuel consumption, and it's going to be pretty proportional. I've seen nothing quantitative, and no original reports of any kind. Do you have some studies or detailed info? Something from the industry, perhaps?
" Would, for example diverting the wind generating subsidy to more efficient electrical use yield a greater CO2 emission savings?"
Of course. The same would be true of nuclear subsidies, or even just about any form of generation without subsidies. The fact is, efficiency is very, very cost-effective.
The question is, of course, whether enormously increased efficiency is achievable in a short time frame in the face of widely distributed, long lived micro-demands, and whether it would be enough to quickly and substantially eliminate coal generation and replace depleting NG supplies. That seems very unlikely to me, especially in light of new demand from EV/PHEV's. It seems to me that we need every low-CO2 source we can find, including renewables and nuclear.
" some studies of the actual CO2 savings from wind conclude that they are modest at best. "
Could you give me a link to some of these studies?
"the paradox of building windmills is that you have to build a lot of ordinary power stations to back them up "
Not really. We don't need more peak capacity, so we don't need to build more regardless of how much wind we build. The two aren't related. This is an idee fixe of wind opponents, and it doesn't make sense. And again, it's not a problem to retain FF peak capacity, if we greatly reduce it's utilization.
Now, as to wind's intermittency. Yes, there are places where wind is stronger at night, and in winter. AFAICT (As Far As I Can Tell), there is a mild negative correlation world-wide between sunlight and wind.
You might sense where I'm going with this - solar. And you'd be right. There is a very nice synergy between the two. When clouds block sun, it's almost always windy. When anticyclone kinds of things becalm a certain area, it's almost always very sunny.
The fact is, 100% of generation from any single source of generation would never make sense. Criticizing wind's difficulty in providing 100% of our needs amounts to a straw man, because no sensible person would suggest it. Instead, no one source is likely to be cost-effective above about 30% of KWH market share, including nuclear (France is badly overbuilt from a cost-effectiveness point of view, and makes it work only by being part of a much larger grid to which it sells power at night and from which it buys power during peak periods.....kind've like wind should be....).
Finally, Texas is a special problem because ERCOT is so poorly connected to other grids. Much of wind variance can be reduced by increasing the geographical area over which it's averaged. Take a look at your source for further info: http://www.stanford.edu/group/efmh/winds/aj07_jamc.pdf
Also, ERCOT's pretty conservative - other places, like NYSERDA and Minnesota give much higher capacity credits to wind.
Nick, Let us begin with the Stanford study, for which I lack the background to do a serious analysis. A few things do jump out:
"Thus, the firm power produced for 79% of the year by a 19-site
array was almost half of the actual power produced in the year or 21% of the maximum possible power produced."
So basically "firm power" is close to one fifth rated power. I understand that the going price for set up windmills now runs about $2000 per KW. Thus the capitol cost of will run $9524 per KW of "firm power." TVA recently announced that it was proceeding with the construction of two new AP-1000 reactors. The anticipate price will be between $2.5 to $3 Billion. The rated power of AP-1000s appears to be settling at 1.25 GWs. That would give a price of $2000 to $2400 per KW.
http://timesfreepress.com/news/2008/jan/23/nrc-begins-review-new-tva-rea...
Now it is likely that the price of the TVA reactors will increase with inflation, but then will the cost of setup windmills will as well. Significantly the windmills require more of the stuff most likely to inflate, copper, steel, and concrete. As it is, the AP-1000 appears cost comparable to windmills, on the basis of rated power.
Now the AP-1000 can reasonably be expected to deliver 100% of its rated power 90% to 92% of the time. In contrast, the windmills are promised to deliver 21% of rated power 79% of the time. Attempts to deliver firm power more time delivers a significant drop in promised power. Thus for an 87.5% reliability, the promised power drops to 15% of rated power. At that rate firm power costs come for the astonishing cost of $13,333 per "firm" KW.
What the Stanford study does not do, is explore the amount of "firm power" that can be had during the middle of the day in July and August. Maybe they did not think it would be a problem.
Thus wind power turns out to be at least 4 times as expensive as nuclear power. You offer as a compensation for the problems of wind, to add a another layer of redundancy, "You might sense where I'm going with this - solar." Well lets see, for another $2000 per KW we got power 21% of the time. At least it can be counted on at noon on sumer days. So or new and more summer reliable system is going to cost $11,500 to deliver at least 21% sent of the power a reactor can produce for the same amount of time. Our price is now almost 6 times the maximum cost of the reactor, but no bother, the power is green. What a deal!
You make the astonishing claim that Texas is a special problem because ERCOT is so poorly connected to other grids. This is however, not a problem at all for Texans.
You also state, "ERCOT's pretty conservative - other places, like NYSERDA and Minnesota give much higher capacity credits to wind." ERCOT does a good job of delivering power on 108 degree sumer days without rolling blackout. Nor has it had a massive system wide blackout as the North East did in 2003. I would say they know what they are doing, and quite obviously the lack of interconnection is not a problem for Texas.
"Thus the capitol cost of will run $9524 per KW of "firm power." "
That's not the right way to treat generation costs: there's KWH costs, and capacity costs (as well as frequency regulation and spinning reserves). KWH costs are more important. Also, nuclear capital costs aren't just subject to inflation, but to overruns, which are much more deadly - see the recent experience in Finland, which suggests costs closer to $4/watt.
"You offer as a compensation for the problems of wind, to add a another layer of redundancy"
This is another misconception commonly found in anti-wind misinformation. It's not redundant, it's complementary, or synergistic. The solar power isn't backup, it's simply dominant at different times.
More tomorrow...
That's not the right way to treat generation costs - Nick
Well of course that is not the way to look at it from your viewpoint. But we are talking about the cost of reliability, not the cost of any old time the wind blows power. Your claim is thet by lumping the output of wind generators together wind can be reliable enough to serve as base power. I just examined how much it would cost to deliver a given amount of base power to the grid 79% of the time from wind generators. If we are comparing the efficiency of base power investments in solar and wind, we want to compare costs per a given unit of base power. Thus if our goal is to build a base power source that will deliver ten million watts of base power 90% of the time, we could get that with from a 10 MW reactor, or from a wind array spread out over 17 locations. The question is how many wind mills would we need to build base power. Since we can only relie on 21 percent of the name plate power generating capacity of the winmill, you would need to build 48 1 MW windmills to be assured 10 MW of generating capacity 79% of the time. That is what the formula says.
Now why would you want to do that? You can predict what base demand would be in the future. Once you predict it, you want to know how much is it going to cost to give me the generating capacity to produce the base load power I need. With wind that cost is $9524 per KW of required base load power. That is what reliability is about. How much is it going to cost to get power you can count on to the consumer when the consumer wants it?
I noted that inflation would most likely to effect capitol costs for both reactor and renewable projects. Cost overruns are caused by custom reactor designs, design changes after construction begins, and lack of attention to construction scheduling during the design phase. The French demonstrated that large numbers of reactors could be built inexpensively be standardizing design, making out good construction schedules, and sticking to their plans. The Fins bought a French reactor, but it was a new design, so parts were more expensive. The Fins appear to have been totally in the dark about construction scheduling, and seemingly did not pay enough attention controlling the quality of construction materials. The result was a big cost overrun. In Texas the formula for keeping cost under control is to farm the project out to the Japanese who have a history of completing reactors on time and on budget.
Even if reactors cost $4.00 a watt, they are still going to be cheaper base power sources than windmills.
Encouraging info on cost overruns. AFAIK, however, after the history of overruns in the US a lot of investors still need to be reassured about such construction in the US, and therefore the first wave of plants in the US will be somewhat limited, probably to the 6 that would get production tax credits.
Again, we'll need all the sources of low-CO2 power we can get in the next few years.
Sure, wind would be a relatively expensive way to get peak capacity credits, but that's not how it works. The primary revenue source, and basis for cost justification, for any form of generation is the KWH's generated. Capacity credit revenue is important, but secondary in most cases. Sometimes, of course, that can be the primary objective, such as for many peaking NG plants, which will be used almost not at all during the year, but which don't cost much to build, either.
Again, we don't need more peak capacity in the US (despite the claims of utilities to the contrary - the common utility ROI model forces them to push for new construction). We have about 1,000GW of capacity, and average demand of about 450GW. What we need are low-CO2 KWH's, which wind/solar can certainly provide. What the Stanford paper tells us is that they can also provide some capacity credits, which one could regard as a bit of a bonus.
Nick asked for links to substantiate that wind does not do a great deal to reduce carbon emissions:
http://business.timesonline.co.uk/tol/business/industry_sectors/natural_...
If you can't get hydro, at the moment the only way we can cost-effectively engineer greatly reduced carbon emissions is nuclear.
Conservation should help, but suffers from Jeavon's paradox that at any given level of prices demand acts like a fat woman in a corset and pops out somewhere else.
If you can't get hydro, at the moment the only way we can cost-effectively engineer greatly reduced carbon emissions is nuclear. - DaveMart
Dave, you are cookin with gas!
Energy efficiency does tend to compliment nuclear by evening out day to night and summer to winter variations in power demands.
Dave, that's a popular journalism article, and Moore is talking about broad correlations that really don't tell us anything - for instance, Denmark has high CO2 emissions not because one of their energy sources is wind, but because their other major source is coal. Denmark's plans were developed to meet goals of energy supply diversity and security, not on CO2 reduction.
I'm interested in a technical, quantitative study of the assertion that reduced FF plant utilization significantly decreases thermal efficiency (the one argument against wind that seems to have some possible merit).
In my view there are work-arounds to much of the decreased thermal efficiency.
I can't remember the details, but one technical-type guy here indicated that for the first half hour or so you were operating at an efficiency reduced by about 30%, if I remember correctly.
You could reduce this by the use of pumped storage, so I do not see it as a major problem.
I don't think you are right to dismiss the figures I gave so readily though.
To take the Danish case, for the same money that they have spent to have part of their grid running on wind, they could have built five nuclear reactors and reduced their CO2 burn towards French or Swedish levels.
The same thing applies to Germany - although they have been leaders in conservation and renewables, they have been ineffective in reducing CO2 emissions.
Wind is fine in my view in some specific locations, such as perhaps the great plains in America, where there is an excellent wind resource.
At any cost which people are going to pay you are not going to significantly reduce emissions in most places with it though.
In most places it is simply not windy enough to make it worthwhile considering, and proposals to build power lines to take it all over the place are fantastically expensive - and that is according to their advocates.
If we don't keep costs affordable, people will give up on combating GW - huge sums of money are being spent and deluding people into believing that this is going to combat warming, when in fact they are ineffective.
duplicate
duplicate
duplicate
duplicate
duplicate
Nick, I find much of your argument sound and balanced, but do have a couple of caveats.
I am a strong supporter of renewables, but used where they are the cost effective option, and not deployed in unsuitable conditions at huge expense to pretend to the public that they can solve low carbon energy problems when in fact they will lock-in the use of coal and gas to cover when they are not available.
Basically I would agree with you that intermittency problems for wind are often soluble, but they are often still a real problem in my view for solar especially.
To illustrate what I mean, consider the German wind program: the basic difficulty is that Germany does not have a very good wind resource, and the huge sums spent have reduced carbon emissions very little, whilst similar sums spent on nuclear reactors would have greatly reduced emissions, perhaps to around the 6 tons per person per year of France, as against their present 10-11 tons.
They have also been forced to go for around 6GW of coal plants in a new build as renewables can't meet their needs.
In reality, at that location and latitude the only technology which we know how to do which would greatly reduce their emissions is nuclear, and failure to face that has lead to increased emissions compared to what would be the case given a realistic policy.
Britain has a better wind resource, although the realistic option is now mostly off-shore, and that is expensive to build and maintain.
It also has excellent load-following characteristics, according to a recent study:
http://www.eci.ox.ac.uk/publications/downloads/sinden05-dtiwindreport.pdf
sinden05-dtiwindreport.pdf
Here are the UK Governments cost figures for off-shore wind:
http://www.renewables-advisory-board.org.uk/vBulletin/attachment.php?s=0...
attachment.php
As can be seen, the likely cost of the 33GW name plate, perhaps 10-11GW of actual average hourly output, is around £40bn.
For the same money you could buy, based on the figures for the Finnish reactor being built, which has so far cost around $4bn with over-runs and will likely finish up at $6bn, £3bn for 1.6GW nameplate, about 1.4GW actual, about 14 reactors, even without allowing anything for cost reductions in a series production.
This would give you about 20GW or so of output, all of the UK's baseload requirements.
It should also be noted that the connections costs would be minimal, as it is proposed to build reactors on existing sites.
The life-span of a nuclear plant is about 60 years, as against 25 years projected for off-shore wind turbines, so it could be argued that instead of spending the money twice as well, over the lifetime you would get four times the output for the same money, as you would have to spend roughly another £40bn on the new wind turbines, whilst your original nuclear fleet would still be going strong, so for the same money you could build about another 14 nuclear plants and have about 40GW of installed capacity - this is very roughly, as the connections would already have been built for the turbines, and the platforms might be OK to use, but OTOH I have not allowed anything for cost reductions in a series of reactors or technical progress such as the use of annular fuel, so these figures should be in the ball-park to give us some idea of relative costs.
Off-peak power could then be used to charge up future car batteries cheaply, so it would not go to waste.
Fuel costs for nuclear are a minor part of total cost.
This strikes me as a far more effective investment than off-shore wind in the UK.
Nothing I have said should be taken as a critique on the suitability of wind power in other regions, for instance the far cheaper on-shore wind resource on the American plains - I am just arguing to use resources where they are appropriate.
Solar PV at any high latitude is the resource which really suffers from intermittency, as it is over the annual cycle rather than the manageable 24hour variation.
A large 5kw installation in Germany will get you roughly 150watts/hour over 24hours in winter in Germany - my thanks to MDSolar for straightening my figure put on that.
When you really need it you have to put in batteries to start with, which adds to the expense, and secondly fire up fossil fuel power to make up for the shortfall - not very good if you are trying to reduce emissions.
Here is a fuller discussion by me on the issue:
http://energy-futures.blogspot.com/2008/02/solar-energy-for-uk-and-north...
Again, this is not intended as a critique of solar - solar thermal panels are useful at most latitudes, and I am very hopeful that solar energy both as PV and thermal utility scale generation can play a big part in coming years in suitable locations, such as the south of the US.
It does mean we should not rely on hoped for breakthroughs to reduce the costs so greatly as to make it practical in the north, but should get on and build the only thing which we can which will greatly reduce carbon emissions - nuclear, and not be delayed by imaginary solutions which we have no present means of implementing.
For completeness it should be noted that many advocates of renewables all the time and everywhere go for giant grids to make them work.
After Stuart's article proposing this, costings by K.Levin which Stuart did not dispute came out to around $1,000 trn, as against $43 trn for nuclear - and Stuart's figures where based on very favourable assumptions for cost reductions in solar power.
This is not the real world.
Another proposal in 'Scientific American' centred on a US wide grid using compressed air for storage, and using natural gas to reheat this.
The seed-capital subsidy was $420bn, and the use of natural gas was several times present US consumption.
A dead-end there, I think.
Anyway, sorry for the long post, but I hope you found some of it interesting Nick.
In my judgement we urgently need conservation and a nuclear build to really do something about GW at a price that doesn't bankrupt us, and within present engineering.
Ah, to have more time,
Briefly, solar will fall in price much more quickly than that estimation, and Germans hate the link of nuclear power with weapons.
- I'll write more later.
"Briefly, solar will fall in price much more quickly than that estimation, . . ." - Nick
Nick, PV prices most certainly are not dropping. According to Solarbuzz (http://www.solarbuzz.com/moduleprices.htm ), "the PV industry has been in a period of steady retail pricing." In fact, Solarbuzz reports a price increase for uninstalled solar modules, In June 2004 retail solar modules sold for $4.32 per watt. This month retail PV modules sell in the United States for $4.81 per watt. I have no doubt that installation costs have risen since June 2004. Solar buzz quotes the price of industrial PV electrical generation to have had an averaged cost of 21.50 cents per KWh. in July 2000, the price in February 2007 was 21.32 cents per KWh.
The following note is most illuminating:
"The Index is based upon a climate with 5.5 hours of sunshine average over the year. This is typical of locations like US Sunbelt States, much of Latin America, most of Africa, the Middle East, India and Australia. Mediterranean Countries, followed by Japan and then Northern Europe have progressively lower average hours. Saharan and southern Africa, and the areas centered on Saudi Arabia, central Australia, Peru and Bolivia are higher."
Solar thermal prices have recently taken a turn for the worse. Between 1997 and 2003 price of ST collectors slowly drifted down from $3.60 per square foot to $3.40. There was a significant price fall in 2004 to $2.40 per square foot, but in 2005 the price kicked back up, and in 2006 the price sky rocked to nearly $6.00 per square foot. Meanwhile the cost of materials need to build PV and ST installations has gone through dramatic inflation. The solar industry has not announced any dramatic efficiency increase in their use of labor to build solar installations, thus labor costs cannot be assumed to be falling. Nor can the long term cost of capitol be assumed to be lower than it is now. Thus none of the economic fundamentals suggest a dramatic drop in the price of ST power. The same factors effecting installation costs for ST also effect installation costs for PV. Thus the contention that solar prices can reasonably expected to fall conflicts with significantly evidence supporting the contrary.
Charles, I didn't say prices have been falling, I said they would in the future.
Actually, I suppose I should have made a prediction for costs, instead of prices. PV costs have been falling, but prices have stayed high due to overwhelming demand (in part due to fixed pricing per KWH for PV generation in certain places, esp Germany).
In the meantime, costs continue to fall, and fairly quickly. As a result, profits for PV sellers have shot up.
Now, PV demand/installations can continue to double every 2 years for a while, but eventually demand will begin to flatten out, and prices will fall, probably in the form of a crash.
PV purified silicon has stayed fairly expensive, but that too will follow the pattern I described above, as capacity is expanding quickly.
Now, PV demand/installations can continue to double every 2 years for a while, but eventually demand will begin to flatten out, and prices will fall, probably in the form of a crash. - Nick
Ya when people realize that the only produce power five and a half hours a day, they will come to realize what pathetic useless toys PV installations really are.
Nick, I have just come across a blog post on the PV facility at La Hoya de Vicentes, Jumilla in Spain:
http://depletedcranium.com/?p=429#more-429
The officially quoted price for the facility was 130,000,000 Euros, for a 20 MW facility. The real price was probably double that. While advocates of solar power talk about how great it is that we can get power for five and a half hours a day from the sun, and how manufacturing costs have fallen of a cliff, in the real world solar seems to suck. We need more honesty and less hype from renewables advocates. You guys may have something to offer, but when people figure out how overblown and distorted your claims are, you are going to get blown away by public mistrust.
Nick said:
I would tend to agree with you, but I am not going to bet the farm on it.
I disagree with Stuart that costs of PV are likely to continue their historic precipitous plummet in prices, as when costs are lower manufacturing costs are a less important part of the picture, and installation and maintenance are more significant.
However, let's argue that as I think prices will fall sufficiently to allow for peak-time cover in the southern states of the US and similar regions - incidentally that would fit in very well with a nuclear build, which are more economical providing base load.
Things get a lot more tricky when you are trying to cover for night time use and for the winter even in the south though, as even in the Mohave winter incidence is only around 25% of mid-summer incidence with shorter days and so on.
Things aren't quite as bad as that would make it seem though, as peak use in these areas are in the summer, but winter nights can be chilly so you might be talking about an overbuild of 50%.
Then you have to provide storage for overnight.
That is expensive..
Alternatively you could go for solar thermal, which makes storage easier, but since you have to build mirror systems, trackers, and still provide storage it is not looking so cheap anymore, is it?
As for locations further north where peak demand is in the winter and amd winter solar incidence much lower, don't even go there cost wise.
It is reasonable to think we might be able to take care of peaking loads in the summer in the south, which is in itself a big contribution, and perhaps when we get plug-in hybrids freely available we might be able to do more by making use of their storage potential, but we can't sensibly project doing much more than that in a safe way and engineer it cost-effectively.
As for the idea of making up for the intermittencies of solar with wind and vice versa, you are looking at a few locations in the south where you have good resources of both, perhaps Arizona, although I am informed by someone in the industry that solar panels, I am not clear whether that is of the PV or thermal type, have around half the life-span of elsewhere due to sand being blown on them.
The alternative of course is massive grids, the cost of those are vast, according to their proponents, not their enemies.
In short, in most places most of the time renewables are bit players, and it does the cause of arresting GW no good to pretend otherwise, although I certainly would not accuse you of that Nick.
OTOH nuclear can be used almost everywhere there is water, and if that is short designs which can deal with this are possible.
Within a few years we can much more confidently project that we will be able to build reactors like the Fuji molten salt reactor:
http://advancednano.blogspot.com/search/label/thorium
advanced nanotechnology: thorium
which burns up 50% of fuel against the present 1% and has few, easily dealt with wastes, and we can do this on a mass production basis.
We can have good confidence of this because there are no fundamental breakthroughs required, some materials engineering and mostly licensing issues is all - the US built a molten salt reactor in the 60's
I will seize with both hands any renewables that become available at reasonable cost, but to imagine that they can substantially power our society misstates the case.
A few thoughts, that I'll try to add to later.
"I disagree with Stuart that costs of PV are likely to continue their historic precipitous plummet in prices, as when costs are lower manufacturing costs are a less important part of the picture, and installation and maintenance are more significant."
PV maintenance is insignificant. Installation is excessively high right now because 1) most roof-top installations are one-off retrofits, which is an expensive way of doing things, 2) the panel costs overshadow installation costs, 3) high demand lets installers get away with it, (these 3 will change) and 4) most installs by unit volume are residential roof-tops, even though most installs by KW volume are commercial - this obscures the economics, as large installs are much more cost-effective.
500,000 new home installs, at 5KW each, would be 2.5GW per year. 3M new roof installs (i.e., PV installation when the roof is replaced), at 5KW each, would be 15GW per year, and that's just residential.
I think you've been misled in your analysis of the cost of dealing with renewable intermittency because you've been looking at single energy sources, and single mitigation solutions, one at a time, instead of all of them together. The combination of geographical dispersion, demand management, wind/solar synergy, and storage will provide a much more cost-effective solution.
Again, every KWH produced by any low-CO2 source is a contribution. Wind is a little more than 1% of KWH's in the US now, doubling every two years, about 30% of new capacity in 2007, and could easily provide all new capacity in 5-7 years. This is far more than a bit player. Solar is about 8 years behind wind, but growing even faster.
The thing to realize is that it will take at least 10 years, unfortunately, to get to the 20% of KWH market penetration that everyone agrees is feasible with little marginal costs for dealing with intermittency. By that time, we'll have a substantial base of EV/PHEV's, and the grid will be able to absorb another increment of renewables. Dynamic time-of-use metering will be on it's way to being installed, V2G will start becoming feasible, PV will become so cheap that it will become ubiquitous and over-built on the consumer side. A new round of nuclear will have been installed, and around that time we can re-evaluate what's possible.
In the long-term, all low-CO2 sources, including nuclear, will improve greatly. Any or all of them could provide the energy we need, though any single source would be sub-optimal as the source of 100% of our energy. Unfortunately, in the short and medium term none of them are adequate alone, and we're going to need to maximise all of them.
There are cheaper and better ways to do things. but patience is in short supply in some quarters. Dreams are everywhere and illusions are at hand. In the end we will prevail, but not without a struggle with ourselves. Good luck to you.
"There are cheaper and better ways to do things."
I applaud your faith in technology. I invite you to widen your appreciation to other forms of technology.
"patience is in short supply in some quarters"
Indeed.
"Good luck to you."
Thank you. To you, as well.
If you come up with costed solutions for specific areas, I will look at them with interest.
I think the strength in what you are saying is that you are not ruling out nuclear energy - the truly fantastic costs a lot of proposals like Stuart's have come up with is due to their attempt to use renewables in all locations everywhere all the time.
I have absolutely nothing against the use of renewables whenever some sort of cost-effective case can be made for them - what drives me nuts is what I call the 'corn ethanol syndrome' - under the banner of 'renewables good' it has done fantastic damage at huge cost for a solution which is never going to work.
In the same way the wind energy spend in Germany and Denmark has been totally ineffective, basically because it is not very windy most places there, and provides an excuse not to build nuclear, which would do the job - it is in fact a way of not facing reality.
I also think that solar will have a large role to play, I just don't base my hopes on over-sanguine projections, and again there is a lot of money being wasted by installations in places where the sun don't shine - in Germany for instance in the winter months a 5kw installation will only get you an energy flow of around 150watts/hour - it is a bit better most places in the north in the states as it is less cloudy.
If you are off-grid you are going to have further expense buying batteries and so on, but in practise most in Germany sell it back to the grid, so the grid is stuck with subsidising taking electricity when it least needs it, in the summer, and still having to provide power in the depths of winter.
In practise that means FF burn, and it is much more expensive to build nuclear as you are taking part of it's baseload in the summer whilst not helping it out at all in the winter.
You want solar energy where it can contribute to peak in the summer where there is a lot of air conditioning.
If you keep a practical head on the engineering solutions aren't too difficult, you just use different resources as and when they are available, and don't have to get to far into the game of projecting cost falls for solar and so on, you just make use of it as and when it becomes available at reasonable cost.
Baseload power should be shifted to nuclear though.
Don't get me wrong, as and when better solutions become available I would be all over them - for instance I think that it should not be too difficult to use high-altitude wind, which is a steady resource available almost everywhere there is not huge amounts of solar power, and it would cost a fraction of other means of generating electricity.
To sum up: keen on solar in the places it is easiest to make work, and after we get that going we will see where we go from there, not very keen on wind turbines, but in specific locations they might make sense, especially in places like China where they need all the power they can get, and keen on conservation.
You might be interested in looking at the proposals in a couple of European countries which already have reduced FF burn considerably and have good prospects of going on to virtually eliminating them:
http://www.theoildrum.com/node/3610#more
The Oil Drum | We Won't Stop Global Warming
http://news.bbc.co.uk/1/hi/programmes/working_lunch/7252571.stm
BBC NEWS | Programmes | Working Lunch | Green energy wins over Portugal
As you can see, they are both pretty location specific, Sweden with it's hydroelectricity and nuclear, and Portugal with it's windy, sunny location with wave and sea resources - the wave energy build in Portugal is especially interesting, but the sea is a tough environment to keep things working.
To elaborate on my earlier comment:
Yes, I think Germans could lower their costs with nuclear. OTOH, they really, really don't like nuclear. They understand that they're paying a premium to emphasize wind/nuclear. I have some sympathy for that, but I agree that we need all low-CO2 sources to deal with climate change (and, secondarily, with peak oil/NG) with sufficient speed. I suspect they'll re-think closing down existing nuclear plants - Merkel is hinting at this.
Solar cost is falling quickly, even if prices aren't - see my other post today on that. The German subsidy program has helped accelerate that, and in the long run it may even turn out to be cost effective as a result, though the rest of the world will get most of the benefit - we should thank the Germans for that.
I think Stuart's world-girdling grid proposal was very, very far from the most cost-effective means of dealing with renewable's intermittency. I think his goal was to demonstrate that in a worst-case cost scenario we could still afford (barely) to eliminate FF's. similarly, the SCiAm proposal over emphasizes a single solution to intermittency, making it far, very far, from optimal cost effectiveness.
The reality is that we need a diverse set of low-CO2 energy sources (wind, solar, nuclear, geothermal, tidal, wave, biomass, etc), and a diverse set of solutions for intermittency (geographical dispersion (Stuart's plan), demand management (especially residential dynamic metering, and EV charge management management), storage (including much cheaper forms than SciAm's NG assisted CAES, such as pumped storage, adiabatic CAES and V2G), over building (such as France has done), and as a last resort, biomass/FF backup.
What's wrong is your assumption that the cost of uranium is at all significant to the cost of fission power.
Here is how I see it:
The EROI of a LWR is going to be roughly like this
Inputs:
Construction cost
Operation cost (people, maint.)
Fuel cost (mining + enrichment)
Outputs:
Electrical power
That forms the base case. For a breeder reactor we have this:
Inputs:
Construction cost
Extra construction cost from breeder complexity (see Dezakin above).
Operation cost
Fuel cost
Outputs:
Electrical power
Generated fuel
Now, in theory, a breeder should be generating more value in fuel that it cost in extra construction complexity. But it does not. It still ends up cheaper to run the uranium mining and enrichment process rather than build breeder reactors. Which is a strong hint that the EROI of breeders below that of a standard LWR reactor.
If the breeder had a much higher EROI then the generated fuel would more than pay for the extra complexity. But it does not.
"Which is a strong hint that the EROI of breeders below that of a standard LWR reactor."
If natural uranium is a few percent of operating costs, how does increasing operating costs and up-front investment by more than a few percent make any kind of financial sense? What does this have to do with EROI?
"If the breeder had a much higher EROI then the generated fuel would more than pay for the extra complexity."
This statement seems to take for granted some kind of 1:1 correspondence between energy and money. Paying out wages to more engineers for instance is hardly energy intensive but it is capital intensive.
Ah, that's where our mental models differ. Ok. There is a strong relationship between energy and money. Costanza analyzed energy vs dollar value in 87 economic sectors and found they all had the same dollar to energy relationship once embodied energy was counted. Many EROI analysis make use of this idea. Capital is basically embodied energy.
Here is a reference
R Costanza and R A Herendeen. 1984 "Embodied energy and economic value in the U.S. economy.: 1963, 1967, and 1972", Resources and Energy, 6:129.
Capital is embodied energy, resources, and the ability to apply both through infrastructure and technology. For example, it enables the petrol, the auto, and the taxi driver.
Capital................
1.The wealth, whether in money or property, owned or employed in business by an individual, firm, corporation, etc.
2.An accumulated stock of such wealth.
3.Any form of wealth employed or capable of being employed in the production of more wealth.
And you say "Capital is embodied energy". Did you make that up all by yourself?
A two room beach Shack worth $2 million has the "same embodied energy" as a $2 million dollar mansion inland"? What about a Leonard painting?
Take yourself back to nomad days, a group gathering food can go left into the desert or right into the hills. They choose the route most likely to sustain them with the energy they need to be able to continue to hunt and gather. If they expend more energy in their hunting and gathering lifestyle, they die.
Now think through the ages of man and see if you can see a time, any time where we sustained an energy input which was greater than its output.
Energy is energy is energy, whether you pay a billion dollars for a barrel of oil or not......if more energy is expended extracting the oil you are on a downward run to oblivion.
Now if you want to bring money into it, then the billion dollars that the person who sold the oil received has to put it toward extracting more oil, if it costs him more than a billion dollars to purchase the energy to extract another barrel of oil..............I bet the Easter Islanders wished they had more gold and silver. The joker with the best hut probably would have traded it for a banana in the end.
So forget money, equate energy with life. How do you think we got to nearly seven and a half billion people? Because of capital? Or because we had more energy to produce the food, machinery, health care, shelter and technology required to make more energy.
When energy again, due to scarcity is recognized as the the life sustaining entity it is, then your lousy capital won't buy you a leg of lamb or bag of rice.
Your trade will be giving up some sort of energy in return and you had better hope that what you trade is less or equal in energy terms to what you traded for.
No, he didn't make that up by himself. Think of the emergy concept and thermodynamics. Think of a forest of virgin timber. What is that but low entropy embodied energy. But it is not capital, unless one wants to use the bastardized "natural capital" concepts inserted into neoclassical economics. Typically, that forest is not much valued UNTIL it is harvested. A painting has huge amounts of embodied energies - it's the surplus energy that supports civilization.
The beach shack vs the mansion is a little different. There is land. The $2M pricetag includes land. In the older economic thinking, it was land + capital + labor. Lumping land and capital together fudges the distinctions. I'd not argue the two embody the same energy. Nor is it only the land; it's not clear to me that two different objects at an identical price embody equal amounts of energy. $2M of hardwood chips - from trees only good for chips - is not the same as $2M of chips made from planed virgin timber. The embodied energy of the latter is much more than the former. [Both types of chips, however, are being reduced to thermodynamic gray goo.]
cfm in Gray, ME
Sincere thanks, Dryki.
Could someone please explain what Dryki wrote, or explain to me how "capital is embodied energy".
Maybe just explain how the $35m embodied energy got into a Leonardo painting, or a Ming Vase or a vacant block of suburban land.
Every theory of value is going to have special cases that break it. A lunatic rich person might start valuing chewed bubble gum at $1 mil per stick. There is no accounting for taste.
But the goal is to understand the general relationship between energy and money. And there is a relationship. A very strong one. In "Energy & Resource Quality" Hall, Cleveland & Kaufmann 1986, reported that they could predict the inflation rate (CPI) by dividing the money supply (M2) by the net fuel use. The regression between prediction and actual was 99%
To understand that capital is embodied energy, just imagine each piece of machinery starting as ore someplace. Add up all the energy needed at each step to turn it into that piece of machinery. It forms a kind of pyramid of substeps. Each substep needs some energy and possibly other machinery. Each substeps is itself a pyramid of steps. When you total up the energy along the way, you get the value of the item. You can see that it is not just imagined, but it turns out to actually be true. (graph in post below).
This doesnt translate into determining energy payback ratios, and energy isnt the only scarce thing that makes the economy go around (labor) nor is this a purely causal relationship. Investment costs are determined by interest rates as well, which complicates the energy theory of monies thesis that breeder reactors are less energy efficient over their lifetime. It is a seductive theory because of its simplicity and strong corrolation, but it doesnt tell the whole story.
Ultimately it doesn't matter at the end of the day because we're concerned about money rather than energy of course.
I just ran across this which bears directly on the question above, about the Ming vase and painting [I've only started to read it]:
Authors site - Jing Chen - links to some other interesting papers of Chen's. More at his SSRN page.
He suggests it is not only denial, but energy efficient to be overconfident. Hmm.... Evolution favors those who make the right call based on the least information.
cfm in Gray, ME
For lowtech goods where energy is the main input. In general it's trivially shown to be false.
Consider a fancy $50 haircut that takes the embodied energy of a small sandwich (A sunk cost, as this energy would have been spent by both parties just breathing in and out regardless of the haircut. It also prevents two people from doing more energy intensive activities for an hour or however long the haircut takes) and a $200 set of tires that costs about 30 gallons of oil to make.
To argue that these two activities are even on the same order of magnitude of oil expenditure/$ revenue you'd have to postulate that the velocity of money is increased proportionaly to the frugality of the activity on which it's spent. I.e. the tire manufacturing company just takes your money and stuffs it under their proverbial matress while the hairdresser can't wait five minutes to piss the money away on the first thing that comes to mind.
Here is a graph from the paper that will make it a bit clearer. The dots are 87 economic sectors in the US. Everything from forestry to mining to government services. As you can see, they almost all end up on a line relating energy to dollar value.
There will always be special cases that break a theory of value. Prices can deflect with supply and demand. (Costs less so.) But averaged over a whole economic sector, the relationship is very good.
Actually, you would expect this behavior in a perfect market economy. All profits would be squeezed to paper thin margins, so the price of everything would be right at the exact cost it took to make that thing (or cost to raise and educate a doctor, engineer, worker). And when you get to the very bottom of the economic pyramid, energy is the lowest most input. The common denominator of the whole economy. So we would expect to see this relationship.
It is pretty cool really. Check out the paper. Most Universities I have been in will allow public use of the computer terminals for finding and reading journals.
So I guess there was a lot of energy in the paper money in Germany in the 1920's, they burned it for fuel.
http://en.wikipedia.org/wiki/Hyperinflation
Is the embedded energy just the energy that is in the world or country now, or does it include all the energy consumed which went towards establishing the economy and capital?
Is the embodied energy the same for a communist country as a capitalist economy?
I wonder about goods and services, tourism and Benny Hinn and Anthony Robbins seminars, or the $30M a year a corporate executive earns. Or just think about the trillions of dollars of debt, is that, was it, or will it be capital and energy? We should be able to convert that debt to energy, the banks think debt is capital.
Venezuela may be a wake up, I have read in another post here that Chavez wants to trade oil for food, energy for energy.
He probably understands how important the energy in food is.
Really I can see and I guess I understand the relationship between energy and capital which has been established by banks and business.
I think the relationship is becoming a little more tenuous. Food, shelter,clothing and work implements, the basics, that is real capital.
What was the relationship between energy and capital for the American Indians or Inuit or Kalahari Bushmen before they were "modernised".
Energy is the true reserve currency. You get hyperinflation by printing money faster than you add energy to the economy.
In "Energy & Resource Quality" Hall, Cleveland & Kaufmann 1986, reported that they could predict the inflation rate (CPI) by dividing the money supply (M2) by the net fuel use. The regression between prediction and actual was 99%
I will try to scan in the graph. It is quite amazing.
So we can expect inflation here as fuel stops entering the economy and if the printing of money is not reduced at the same rate. What is also interesting is that a "gold standard" would not really protect against inflation, because the real reserve currency is energy.
I think our huge problem with those trillions in debt is that the off the book currency was allowed to expand to a huge value. Way more than we could ever add energy (and thus real value) to match it. Now they either need to erase that money, and take the pain, or allow it into the economy and take the massive inflation. Either way, we are in trouble.
I have not seen a study for barter economies. But I guess I would expect the same would hold true. A pottery maker would need to charge enough in barter to get back the effort it took to gather the firewood and form the pots. So would a hunter or a fisherman. As firewood or game gets scarce, it would take more effort to get the same amount and the "price" would have to rise. Just my opinion.
At the risk of leaving way more questions unanswered than answered, I want to suggest that there may not be much emergy in money. Burn it if you can - the digital kind won't even warm you up. The emergy is in the products it purchases. Where right now we have gazillions of trillions of dollars we still have only 1 planet earth. Double the money doesn't change the embedded energy in the redwood log. Capital is conflated with money. One of the definitions is money. But in the political economic sense capital means assets available for use in the production of further assets. [Sorry, I'm on unsure ground here - look it up in dictionary for more clarity.]
Hall, Daley, Odum, Georgescu-Roegen. I found Alf Hornborg's "Machine" most helpful at understanding this.
I did a bit on this as part of an energy round-robin at a local middle school where I asked students to consider the emergy in a can of soda. One young woman went off right away on the marketing department of the manufacturer. Wow!
Nothing is wasted. Before they were modernized, aboriginal people had their commonwealth just as we do. They didn't consume as much of the resources as we do - in some senses they had more wealth than we do. Codfish so thick one could walk across the sea on their backs. Virgin forests that became the King's Pines - there's a sweet example. They didn't know of fossil energy, they didn't have reserves and they didn't have CERA. [No doubt they had their Yergin equivalents.]
They didn't capitalize the resources. Were they wealthy? I don't think the question is right. In the modern sense, we have to grind up the resources to convert it into cash wealth. The embedded energy - what remains - is not in the cash, but in the cat food or wood chips that cash can purchase.
cfm in Gray, ME
"The dots are 87 economic sectors in the US. Everything from forestry to mining to government services. As you can see, they almost all end up on a line relating energy to dollar value."
Presuming the natural logarithm(ln); if you understand the logarithmic function a quick eyeballing of the graph will reveal that the spread spans about e^3 to e^4 in the left graph and e^2 to e^3 in the right graph. That's around an order of magnitude in the right graph and nearly two orders of magnitude in the left.
In my opinion that graph shows that your rule of thumb is nearly worthless outside of staple goods and that some of the chosen goods and services have been migrating towards the staple category.
Is there a relationship between debt and energy? Is debt capital?
How can I believe the graphs when I don't know the data inputs?
I guess now gold is not the standard, banks and governments need a tangible commodity to explain debt and cash flow.
Is that commodity energy and the connection tenuous and a veil which conceals the true value of energy?
Is capital spent energy or potential energy or both?
If capital and debt is embedded energy, where is all the energy which all the capital and debt in the USA or world can buy?
Maybe debt and interest represents potential energy, if that is the case we had better not get into further debt.
Here is another chart. It shows the relationship between energy use and GDP for several major economies over time. The lines are the predicted E/GDP value, and the dots or circles are the measured values. The relationship is very close for most years across most economies. There are some small correcting factors which you can read about in the paper itself.
"Aggregation and the role of energy in the economy", Cleveland, Kaufmann, Stern, 2000. (google scholar will find it).
Another good paper
Kaufmann, R.K., 1992. A biophysical analysis of the energy/real GDP ratio: implications
for substitution and technical change. Ecol. Econ., 6: 35-56.
Really, "Breeders" are 100 times as efficient, but cost 26% more to build. That cost alone makes them not competitive financially with LWRs. You have to understand how energy dense this stuff is. It is a million times as energy dense. If our cars got 20 million miles to the gallon, there wouldn't be much incentive to improve fuel economy, which is an unfortunate economic reality. The biggest cost of ownership, by far, would just be buying the car. So even if a car came along that got a billion to the gallon, people wouldn't buy it if it cost a few thousand more.
"Breeders" are 100 times as efficient, but cost 26% more to build. That cost alone makes them not competitive financially with LWRs. You have to understand how energy dense this stuff is. - deuterium
The cost of breeder reactors is determined by the technology that the reactor manufacture chooses to work with, Molten Salt Reactors only bread at a 1 to 1 ration, but are far cheaper to build than either Liquid Metal Fast Breeder reactors, or Light Water Reactors. The development of Molten Salt Reactors was stopened for political reasons in the late 1960's. The reason why there is no market for breeders right now, is that the government has bought the U235 and Pu238 from old soviet and American bombs and war heads. This toxic waste disposal program has created an artificially low reactor fuel price. This in turn has delayed interest in breeders.
Not really. The fissioning of a U-235 atom unleashes 50 million times as much energy as a carbon atom. And in 2001, the stuff was $7 a pound. By May 2007 it was $138 a pound, and yet the cost of generating electricity from nuclear wasn't significantly impacted. The fuel is so energy dense, the biggest cost is just building the power plants. For safety reasons, sodium fast reactors use a second sodium loop, wich makes the reactor about 26% more expensive to build. That additional cost has thus far made sodium fast reactors economically uncompetitive with light water reactors using enriched U-235. Also, keep in mind that down-blended plutonium and uranium from weapons has been used as well, which is essentially free fuel until weapons material is eventually exhausted.
Charles said:
My understanding was that this extra cost was the case for existing reactors, and that new designs have optimised the use of heavy water so as to greatly reduce this, using the heavy water as a moderator but doing the cooling with ordinary water.
I wonder if you could estimate how much difference this will make to the costs?
No I can't. The ARC-1000 uses such a design, but I haven't seen any figures on the how much less heavy water the ARC-1000 requires. The two fluid approach adds to system complexity, so there may be a cost penalty associated with a 2 fluid system, that partially outweighs the cost saving from reducing heavy water requirements.
Did anyone notice the article in yesterday's WSJ about China and coal consumption? Tucked away in the article is a chart that apparently nobody saw or noticed.
The article is here (I subscribe, but it may be behind a paywall):
http://online.wsj.com/article_print/SB120275985736359763.html
The chart, titled "Taking Lumps," has a graphic titled "World reserves-to-consumption ratio. Part of that graph shows "OIL --> 42.3 years."
And the chart notes that this assumes present rates of demand.
Hey, if present rates of demand show 42.3 years oil left, haven't we gone past peak already? End of oil in 2050.3?
I haven't even seen any letters to the editor about this.
bb -
It's a good article. The slant is 'how to make money on this', but I guess that's what the WSJ is about.
About that chart, it aligns with what WestTexas has been telling us - we have roughly 36 years (I go by memory, probably including some increased rate of consumption) of oil left. What the non-reality based crowd will say is that we'll simply increase the reserves (Look at the giant discoveries lately!) as demand increases price.
That chart would be a GREAT starting point for awareness-raising. And where's that increase in supply based on doubling++ of price? And which alt. liquid is going to save us? And on and on...
If I get around to it, maybe I'll write them a letter this evening while enjoying some dilute grape ethanol. Oh, and I liked the part about how great it is that Chinese coal demand is providing GOOD WORK here in the US of A.
I'm guessing this chart is yet another example of most people being completely unable to process "peak oil" concepts. This IMHO goes way beyond information overload or superficial reading, readers see this and simply can't read or understand what they're seeing, since the consequences are fundamentally catastrophic.
Very good. There really is a convergence of issues, peak everything.
I often get into discussions with friends, and they refer to history, cycles, things get better, etc. I admit to them that I am arguing things are different now, that this is a unique period in history. And what I do is take a napkin and draw a population graph for the 20th century, and explain the long slow run up from the left and that the exponential run up on the right cannot possibly continue very much longer in historical terms. And I explain that the per capita consumption of energy and other resources, especially in the industrialized countries, has gone up far, far more rapidly than the population.
That ALONE is enough to see that the 21st century is in all likelihood going to be radically different from the 20th. Knowing that the earth and its resources is finite, the only thing missing is: how finite?
Geology might have bequeathed us enough resources to do maybe another couple of doublings. Did it? There might be large reserves of arable land. Is there? Water? Is there? And so on.
So it's a matter of fact to determine whether we are in trouble now, 30 years from now or 80 years from now. But that's all. There is no question that on any kind of historical scale we are in trouble right now.
One can go further with back-of-napkin arguments: why are they drilling wells 2 miles down in the GOM if there's plenty of oil? (Exxon ads.) Why is wheat zoomimg up? And so forth.
Models are good. But sometimes I wonder how much is gained in having a very sophisticated model vs a very simple one. For example, one involving just four or five variables: population, energy, arable land, water (fresh), metals (minerals). And a few very simple formulas connecting them.
We know (very roughly) where we are. We know (very roughly) the resource base. We know that we are already living very far (how far we don't know) above our means. We know it can't go on much longer. The exact path of decline is hostage to all kinds of unknowables. So I favor simple, wide band models, which constrain the descent.
From nuclear fuel resources we can estimate that we run into a thermal wall of heat disapation on the same order as the solar flux. If you burn 160 trillion tons of fissionables avaliable in the earths crust at the same rate as we're getting energy from the sun, they'll be exhausted in some 16 million years. We cant burn any faster than that on the planet, which for some reason is where all these models are constrained.
We dont know that at all. We cant even define what that statement means.
We most certainly do know how above our means we are living:
www.footprintnetwork.org
No we dont. We can postulate a world where we are on the brink of collapse with our freshwater aquifers, topsoil and the like and biodiversity is seriously important to maintaining our civilization (for some poorly understood interactions) or we can postulate that all our problems are nearly trivial exercises in engineering from desalination, aquiducts, greenhouses and biodiversity is only important for aesthetic purposes. The world could sustainably hold a human population of trillions or only millions depending on what our definitions are, how technology advances, and what the unknown limits actually are.
We dont know this. If history is any guide, projections of imminent collapse is premature.
It's already stopped.
World population stopped exponential growth decades ago. The growth rate has been dropping for about the last 40 years, from 2.04% in 1967 to 1.16% in 2007. Not only is the growth no longer exponential, it's actually been less than linear recently - raw numbers added have dropped from 88M in 1989 to 77M in 2007.
So a graph showing exponential increase actually gives a misleading picture of current world population growth. Detailed estimates for world population give a graph that slowly rises, peaks in the next 100 years, and then slowly declines, giving a very different picture of the future than a truncated exponential.
Very true. Arguably, though, the data suggests that one big difference will be that world population growth will slow and eventually reverse, rather like it's already doing in the rich countries. That - population and consumption decline by choice, rather than forced by external factors - appears to be largely unprecedented in human history, but has already started. Should be interesting.
There's no question only if you make the assumption that population is still and will continue to grow exponentially. That assumption appears to be false, though, meaning the question is very much more open than you appear to be suggesting.
Both of those are beliefs, not knowledge. They may be correct beliefs, but the information is simply not available to present them as known facts.
As I understand your argument, you've made the following assumptions that I consider unreasonable:
Evaluating the situation without making those assumptions may lead you to different conclusions.
This statement is meaningless without a context. If we develop the technology to stack people like cordwood, shove a feeding tube in their mouths, and feed them from space-based hydroponic gardens, we could probably sustain a very much higher population than we have now.
However, if you are talking about the world as it is today, there is considerable evidence that the current population is not sustainable. Resource depletion and pollution are both at unsustainable rates. The fact that we have not collapsed and had a die-off yet is not evidence of sustainability. Given a fuel gauge, MPG, and distance to travel, I don't have to actually run out of gas to know I'm not going to make it to my destination.
Optimists have to assume some significant future advances in technology and efficiency to make the current population (even if we had ZPG) sustainable. I think the burden of proof is on the optimists. It is very clear that BAU is not sustainable. So, failing to make the assumption that "Current population is beyond sustainable levels" is failing to come to grips with reality.
Your argument is that this slowing is entirely voluntary. Data please?
If you review population crashes amongst any mammalian species you will see a slowing of growth in the immediate generations prior to the crash. What causes this? Reduced fertility, tighter competition for remaining resources, and a host of other reasons that have nothing to do with voluntary choice. You are aware that there are extensive reports of reduced fertility globally? How much of the population reduction is due to us simply poisoning ourselves out of existence versus choice, as it occurs in the wealthiest nations on the planet? I am not discounting choice here either, Pitt, but I suggest that the situation is not so simplistic and so positive as you glibly imply.
"you will see a slowing of growth in the immediate generations prior to the crash. What causes this? Reduced fertility, "
Yes, but the causal link here is malnutrition, which reduces fertility and increases death rates, especially infant death rates. Given that obesity is a larger health risk than malnutrition in not only the OECD but most of the developing world, and that death rates (but adult and infant) are generally falling (with a few exceptions, such as parts of Africa, where great poverty still exists), this doesn't follow.
For instance, average calories consumed have risen in Japan, even while fertility has been plummeting. In fact, increased affluence has given Japanese women choices beyond child-bearing, and by golly they're exercising that freedom.
I think this is pretty well established generally - the demographic transition is clearly not a function of scarcity, but precisely the reverse.
Correct, Dave. There are many kinds of models and it is not obvious that back-of-napkin ones are worse than elaborated computer models. Many times, looking at the complex models that are used for some economic studies; I tend to shake my head and say "hey, that makes no sense" (only to myself). Too much detail, too many parameters; they can be easily bent to get the prediction of continuous growth that the sponsors wanted. In my opinion, the LTG models are a good example of relatively simple models that catch the essence of a complex system. Even so, I think they may be too complex. I am trying now to redo Naill's work using a much simpler dynamic model and see what can be done with that. But, in any case, we spend our life doing models in our heads. We are built as modeling machines.
Yeah - what gets me is that more complex models usually fool people into thinking that they are automatically more accurate, when it is the assumptions which pretty much drive most models.
In that respect I particularly liked your recent article on the availability of minerals, as you made your assumption of twin peaks in resource availability very explicit.
It would certainly be worth drilling some test holes to find out, in my view.
We most certainly are modelling machines - but unfortunately the underlying assumptions are rarely laid out explicitly.
The secretiveness of the IPCC on their modelling is in my view inappropriate for a publicly funded body, and although I agree that man-induced GW is likely some of their methodologies are hard to swallow - of course, that applies in spades to many who argue against it.
Dave,
You seem to have been mislead on the IPCC process. They use peer reviewed work. As such, all that work must be reported in a way that allows independent verification. This means that all assumptions must be given explicitly. This is one of the main functions of peer review. There is nothing secretive about the models. You can find results here: http://www-pcmdi.llnl.gov/ipcc/about_ipcc.php where
access has been provided in such a way that you don't need to go to each paper if you want to use the data.
The accusation of secretiveness is usually put out by paid deniers who know they are lying. You want to be careful about where your information comes from.
Chris
Withdrawn - the source I was relying on though was not a climate denier as you put it, but I think I over-interpreted his comments and he was referring to projections out to beyond 2100, when most of the warming is supposed to happen - they are not apparently modelled in the IPCC forecsts, at any rate to the degree he needed for his work.
Very good. There really is a convergence of issues, peak everything. - davebygolly
Hardly peak everything. Certainly not peak Uranium, not peak thorium, not peak iron, or aluminum. Not peak silicon. Not peak many other minerals, Not peak energy generation. Not peak population of food production. Peak bullshit? Ya!
I came to peak oil from limits to growth. I read LTG, and wondered where I would start seeing the effects that were modeled. As part of my research, I became aware of oil depletion.
I noticed in the link above that I gave from Wikipedia for complex adaptive systems
http://en.wikipedia.org/wiki/Complex_adaptive_system
that at the end of the article they had a whole list of various systems scientists such as Odum
http://en.wikipedia.org/wiki/Howard_T._Odum
and Forrester
http://en.wikipedia.org/wiki/Jay_Wright_Forrester
among others. All very interesting to me to read, basically a whole new world.
The only other name familiar to me from the list was Ilya Prigogine
http://en.wikipedia.org/wiki/Ilya_Prigogine
Whose theory I was introduced to in relation to my interest in the effects of meditation on the brain through the use of binaural sound waves with headphones. Prigogine discussed how open systems, living organisms, etc. increase their level of order(reduce entropy). The explanation is that
The following describes the theory developed in relation to binauaral beats (in each headphone you have a slightly different sound wave, the sum of the difference being the level of the brainwave created in the hearer) to Prigogine's theory by a certain organization which sells meditation CDs and cassettes.
http://metanoiamind.com/adultdevelopment.aspx
Here is web discussion of same by users of the CDs.
http://www.transparentcorp.com/community/forum/index.php?showtopic=859&m...
When you listen to such binaural tapes/CDs your brain becomes gradually used to a lower and lower brain wave pattern over time, much the effect of the Tibetan monks with thousands of hours of deep meditation. This is not all without pain however. Essentially the term "overwhelm" describes the point at which an individual doing intense meditation with the binaural CDs experiences high mental stress before the brain reorganizes at a higher level of order (as in Prigogine's theory), meaning that it becomes much more flexible and robust in its reactions.
(disclaimer: I make my own meditation CDs based on the mentioned company's concept using a CD burner and the freeware program "brainwave generator" due to the exorbitant cost from said company and the extremely irritating advertising)
http://www.bwgen.com/
What does this have to do with PO? Seeing as how we are discussing the earth as a relatively closed system, reaching point of collapse (overwhelm) due to high stresses I could not help but relate to my previous readings and my ongoing use of said binaural meditation technique. The question being whether or not we are capable of readjusting at a higher level of order on the other side of the current chaos, or breakdown and will we go under?
This also ties in nicely to the thread by Nate Hagens a while back:
http://www.theoildrum.com/node/3386#more
I am Human, I'm American, and I'm an Addict...
Nate's thread had a lot to say about psychology and the brain and evolution with regards ot our prospect for "making it" in the future without fossil fuels without much hope due to the discouraging problem of the rut of habituation, anchored by brain chemicals.
I think tying psychology / religion and ecology / energy / evolution together into systems theory is sort of useful theoretically. For example to evolve (or for a civilization to develop or a person to become more "self realized / enlightened") an open system goes through various stages creating order out of entropy(using energy to its advantage). At some points they "hit a wall"/"overwhelm" or experience a "discontinuity" as we see nowadays in terms of housing bubble/PO and maybe in terms of human evolutionary failure.
On a further note, if somebody asks me how is my garden doing or how many solar cells have I built up, etc. I would probably say that to prepare for PO chaos I have built up the robustness of my brain/nervous system through binaural meditation and yoga so that I can take whatever comes at me and react flexibly, appropriately and without panic.
The concept of the Wisdom of the Crowd could also be fit into this discussion. Essentially thought forms are passed betweeen people, as on this web site, creating a specific mental pattern,or brain wave. Groupthink or consensus result. In the physical crowd this can be more visceral as people have contact and this carries emotions much quicker, much like TV or radio are better means of communication than text. Just discussing endorphins and other body chemicals to get at psychology is too limited. Brain waves, thought patterns, energy from the environment and from other people in terms of thought patterns and emotions all have to be considered.
Certain solutions in and of themselves might be correct, but in the larger picture may be just a subset of a larger solution, like Newton's Mechanical universe theory as a subset of Einstein's universe. This is the problem we have when we look at solutions in isolation, without a broad systems approach. We may get a correct solution, but it only applies under very limited circumstances. Similarly as our mental patterns or bainwaves, through training, like meditation, become broader we can see larger patterns and adapt more flexibly, avoiding a soietal crash, personal failure, or extinction.
I have been involved with the system dynamics community for about 20 years now, have had many conversations with Jay Forrester, and spent quite a bit of time with the late Donella Meadows (lead author of LTG) and worked with and for the late Barry Richmond (creator of the modeling software STELLA). Each of them would be the first to caution about using models as exact prediction tools.
But the truth about models is that we are ALWAYS working with models, most of them private mental models. No body has a true sense of where we are with peak oil or what will happen in the future. What we all carry in our heads are mental models - simplifications - of reality. We simulate these mental models, in private, and have conversations/debates/arguments about the various "runs" of our mental models with only partial success in making our assumptions transparent to others.
What computer models add to the conversation is to make our assumptions transparent and open to challenge and change by others. Once we can get to agreements on basics assumptions, and only then, can we creatively discuss possible scenarios.
Barry Richmond once told me that he thought Edwards Demming (father of Total Quality Management) said it best when he said "all models are wrong; some models are useful."
Hear hear.
This is exactly why many of us find it so hard to convince others around us that Peak Oil is a here and present danger. The mental models that "they" have running in their heads about how the world works do not allow for the possibility of non-infinite prosperity and an end to perpetual "progress"
I've been thinking about denial, intentional ignorance, and models quite a bit lately.
I graduated from high school in 1976 in the little town of Newton, Iowa. Plenty of religious folks whose models of the cosmos were dominated by a three-level model of reality: Heaven, Earth, and Hell.
History was seen as linear, ending with some combination of Apocalypse, Second Advent of Christ, and the Triumph of Good over Evil. Each person's life would end in death, or else if still living through "The Last Days," folks would go directly to The Great Judgement. (Kind of like Monopoly, except: "Go Straight to The Throne of Judgement, Do not Pass Death, Do Not Collect $200.00.)
Of course many people had a model of life that involved going to work, drinking, some type of sports entertainment, and television.
I went to two US Christian Evangelical colleges where ecological issues were simply seen to be entirely irrelevant: we use the planet as we see fit, and then we get a new one at the end which is directly connected to Heaven and all the Unrepentant Evildoers ("Sinners") will be in Hell. Only recently has this American Fundamentalism and Evangelicalism begun to develop any awareness that reality may not conform to the very egocentric theological models as described above.
I've noticed that we all do have models of the way things are, and that our minds are not made to deal with reality so much as they are made to come up with a comforting story to tell ourselves when we confront death and suffering. Our stories also morph into justification for our pleasures and into rationalizations regarding any suffering that we may cause to other people or creatures.
I've been aware of the LTG studies for some time, and find that few people even had any interest in them, and furthermore that many people treated them with scorn even without understanding them at all. This is still the case.
I know that Big Gav alluded to this in his TOD post, but this seems to me to be the biggest difficulty with Hubbert's Peak and LTG and Peak oil. They are all stories that show us as people who randomly appeared during a time of easy access to huge amounts of energy, and who will now see very painful times as we enter a time of the consequences of severe population and consumption overshoot. This is a terrible story with a very bad ending.
The story we have to tell will very likely end up with the Eramazoic Age -- what E. O. Wilson calls "the Age of Loneliness" as the wave of extinction that our species has generated sweeps over the planet during this century. This is not a story that the human mind really likes, and so people will simply not have any of it.
Most people will try to fit the story of Peak Oil and LTG into whatever model of reality they carry -- technocornucopian, theological, or whatever. For everyone, this is really about their religion: primitive hopes and fears, longings and limitations.
I think that this is why we have such a hard time facing reality. Our brains have mostly not evolved to the point of integrating science and religion.
We have no story to tell ourselves other than that we are all going to die, and so our lives have no intrinsic meaning at all. We may invent meanings, but they are completely disconnected from science and from anything outside of our selves or our own tight little circle of mortals within our species, which is a kind of blip in the universe.
LTG's 30-year-update includes a section on "Tools for the Transition to Sustainability."
The authors speak of "Visioning, Networking, Truth-telling, Learning, and Loving" as the most important tools we have. The authors suppose that people will be motivated toward sustainability as they understand the process of environmental destruction we have initiated. This seems to me to be a religious belief rooted in the desire to have children and to see them launched into a good life before we die.
Ultimately, do we have a story to tell? Is the story that all species -- given the chance -- become nest-wreckers, and destroy their own habitat, then maybe life springs up in some different way, or maybe not? Maybe we just dig and drill and put all that carbon into the air and then go the way of the dinosaurs, and that's it?
What's the story?
Meaning in life comes from enjoying life, through good mental health, good work, and good connections to others.
We, as a culture, don't have very good mental health, and this is transmitted from generation to generation. There is hope, and I see improvement. Religion, which developed in part as a mental health tool (largely through prayer as meditation, though this has been mostly lost lately), is being replaced by better tools. You might want to take a look at focusing.org, for one good self-help tool.
Hey, Nick -- are you a "pro" at the psychology or psychiatry thing?
No negatives associated with it for me -- just curious.
I find it interesting that psychology does in some ways replace religion, but has not done so for the vast majority of folks on our planet.
Is there a psychological relationship between us and other species and the planet?
Scientists like E.O. Wilson (a passionate biologist) say that we have a strong emotional connection to the planet itself, and that this is one reason we need to care for the planet. Is that necessarily a part of enjoying life or doing good work?
What if one person's pollution or oppression is another person's good work?
Then we move to sociology, politics, and military studies pretty quickly.
Is there a valid source of universal ethics,and how might that relate to the study of Peak Oil?
Ultimately, does it matter if people care about the planet, other creatures, or whether another generation of our own species survives, enjoys life, or suffers, or goes extinct? Why or why not?
Thanks for you above reply -- it does make a lot of sense to me. I'm trying to figure out if I can make a story to tell myself to feel better about my awareness of the implications to the limits to growth, peak oil, global climate change, resource war, and all that sort of thing.
Yikes. :-)
:) :) :)
"are you a "pro" at the psychology or psychiatry thing?"
No, though my wife is. I've just been a dedicated amateur.
"I find it interesting that psychology does in some ways replace religion, but has not done so for the vast majority of folks on our planet."
Progress takes time - we need to be a little more patient.
"Is there a psychological relationship between us and other species and the planet?"
Sure. I think we can expand "connections" to include the planet, and all of it's species. I think we're hard wired to put much greater priority on some kind of circle (family, tribe, religion, country, etc) with which we identify, but I don't think it's that hard to expand our sense of identity. That expansion is part of our progress as a species.
"What if one person's pollution or oppression is another person's good work?"
Everyone defines their work as "the right thing". It takes a long time, and alternative ways to make a living and support one's family, to change that.
"Is there a valid source of universal ethics,and how might that relate to the study of Peak Oil?"
I think we're hardwired with ethics, though it takes some education and work to fully express. Children instinctively respond to other's distress.
"Thanks for you above reply -- it does make a lot of sense to me. I'm trying to figure out if I can make a story to tell myself to feel better about my awareness of the implications to the limits to growth, peak oil, global climate change, resource war, and all that sort of thing."
We grow, we make mistakes, sometimes tragically large ones. We can learn, do better, and partially correct our old mistakes. Eventually we'll remediate most of the damage we're doing to the earth, though clearly some things will be lost forever.
"Yikes. :-)"
Yeah. There is hope, and meaning, but that doesn't magically eliminate the large suffering in the world.
Nick (and 710),
I guess this brings me back to the story or stories we are trying to tell ourselves with this talk of limits to growth and peak oil.
For some folks, life is what it is, and enjoyment without any consideration of impacts upon planet or other people seems to be the current definition of "liberty" which seems to be the highest value in our culture. This is like the Devil which has arisen as a mirror image of the strict, punitive God of our culture.
Other people seem to act as though relationships, nurture of the young, and genuine care for the earth is a part of our story. In our current culture this is seen as restrictive, boring, and painful. "It's all about me" and "I am my own only child" seems to be dominant outside of traditional religion.
I am interested in developing some kind of compelling stories related to my own sense of absolute vulnerability in the face of the Great Bottleneck. This all seems to me to cry out for images and stories as well as science.
Indeed, the fusion of science and art and spirituality seems important as a part of any effort to connect with others about a desire to develop a culture that is sustainable into the future.
I'm working on coalescing an idea.
Consider that humans have both intellectual and emotional capacities that need development and attention.
Suppose that much of modern religion and "spirituality" (crystals, tarot, and astrology) is an effective control mechanism by addressing how one feels, in absence of reason. I think this distillation of emotional cues is what most people call "faith".
Further suppose that much of our science, legal system, and corporatocracy are distillations of the other end, rational thought emptied of empathy. I think this could be called "secularism".
I see a problem in that both distillations have largely grown up over centuries and millennia by denying or ignoring the existence of the other. I think they could be integrated, but I see no easy path toward integration. And in a world with so many isolated individuals, it may be that a solution must begin with the next generation, as most people are already lost in this generation.
While breaking out of old ways of thinking is possible, cf. Daniel Quinn's Ishmael series, it is a difficult journey for some, and an impossible journey for others.
What A Way To Go and Zeitgeist both also have interesting approaches to the issue. Though What A Way To Go addresses climate, petroleum, extinctions, and overshoot, it is more of an emotional appeal. And Zeitgeist devolves into conspiracy theories of a New World Order and does not address ecological or resource depletion issues, pretty good up until then.
We are caught in a surreal paradox of having to undo What We Are, in order to save What We Are Not.
Interesting thought about the bifurcation between religion and secularism. And yet some religious people can be quite devoid of empathy and are quite rational within the premises of their models of reality.
Meanwhile, some folks who are quite secular can also be empathetic.
We do need creative disequilibrium (a kind of dismantling of models which are destructive) along with building new models which work toward peace and restoration of the planet.
People respond to stories -- mostly the narrative that runs through advertising which is "Always Seek More." But "News" -- I coined the term "Disinfotainment" to replace the word "News" -- and stories told in the arts and religion are also primary sources of the premises which determine belief, attitudes, and behaviour.
Many large churches around me are led by well-paid professionals who are paid precisely because they provide comfort to the comfortable while ignoring the fact that the status quo is afflicting the already-afflicted poor people and ecosystem.
The media of course does the same thing. Even Al Gore's good efforts are cautious and I think calculated not to trigger the automatic "stick my head back into the sand" response. This is a difficult knife's edge to walk -- dismantling illusions while trying to lead people toward better models of reality.
Even though many people are reluctant to leave illusions behind, I notice people are changing and are expressing more anxiety about the inadequacy of old models.
One day a few years ago I was carrying my tools on my cargo trike (I just went to an electric truck) and I spoke with a woman loading her kids into a van. I talked a bit about the need for peace and ecological transportation -- this was just after the USA invaded Iraq. The woman responded thusly:
"I just trust God and my President."
I was dumbfounded.
I've exchanged greetings with her over the years, as I've worked for her neighbors. When I got my electric truck she was enthusiastic, and commented about how good it was to see and how much more of this kind of thing we need to do. What a change!
So some of the old models are changing. People are much less certain about -- and anxious about -- the validity of their assumptions, I think.
Great points. Especially about stories. Quinn expands on this issue.
I didn't mean that there was always a stark dichotomy between faith and reason, though it seems to be frequently cast in that light. It's just one issue out of many that I haven't yet figured out.
Without the Internet, though, I fear I'd still be an isolated, empty drone, pretending to believe in a cornucopia, but with an always irritating itch beneath the surface that I couldn't scratch.
There probably is not a bifurcation between secularist models and religious models running in people's heads. They run in parallel.
Think about the neighbor you quote. Trusting in God is a religious script that executes in her head. Trusting in Mr. President is a secular/ government script that executes in her head. These subroutines execute in parallel without conflict. In fact they probably reinforce each other as subclasses of an authority-obeying super script.
How do we learn what it means to be human, and how to live human lives, in a world that seems to have lost that knowledge? Good questions.
We attempt to manage our human world from the top-down, which is almost entirely incompatible with how all of the living world is built -- from the bottom-up.
We would need to start somewhere in the vicinity of understanding that much of the manner in which we address the world is flat-out wrong and inherently unsustainable.
While poking around for stuff on topsoil erosion, I ran across an interesting example of a population handling a severely degraded environment:
However:
Collapse is not as inevitable as some would suggest, it seems.
Anyway, simply an example I thought was interesting and illuminating, especially considering how one-sided the examples in this sort of discussion often are.
We need to celebrate our successes!
Helping people see that soil, like everything we have, is an investment rather than something to be exploited into desertification, is critical. Good link. There are a lot of great ideas in that article. And warnings to governments not to setup incentives that end up causing forest clearing or other damage.
Collapse is always inevitable, just like individual death, and they follow from the same fundamental reasons. The problems lie in the distinction between the prediction of "when collapse occurs" vs. the understanding "that collapse occurs".
The short explanations are: no man is an island entire unto itself, you don't know what you've got until it's gone, and nothing lasts forever.
The long explanation follows.
The ideas of growth and decline are inaccurate representations of the physical processes that drive biological life. There is no "growth" in the sense that matter and energy are never created. They are only changed and exchanged. The concentration of matter and energy which make up a living thing are harnessed from the environment. They are gathered, concentrated, and extracted from the the finite, limited matter (mass, particles, atoms, molecules) and energy (photons, heat, chemical energy) available in the biological surroundings.
This concentration temporarily depletes the surrounding environment of that matter (nutrients from the soil, fruit from a tree, oil from a well) during which time it is wrapped up in an apple tree or a web developer and no longer readily available to other species. This is the conservation of mass in biological systems, or ecological stoichiometry.
The more members of any single species that there are, such as with humans, the more the surrounding environment is being depleted of matter and energy available for other living things.
But while nearly all living things have an immediate competition or combat with other living things, they have intermediate- and long-term symbiotic and cooperative relationships with other living things in their environments.
We compete with worms and other humans, and sometimes what's the difference, for the apple. But when the apple has been consumed, some of the matter ends up in our bodies, and some of it ends up on the ground in a nice little pile of fertilizer with seeds that may produce another apple tree. When we die, all those nutrients (matter) return to the environment for bacteria, insects, and plants to feast on.
So what happens when a species continues to "grow" in numbers, when biomass is continuously concentrated from the environment faster than it is given up? It must necessarily usurp more matter and energy from the environment than its competitors, temporarily decreasing the availability of matter and energy to other forms of life.
Before the dawn of civilization 12,000 years ago there were between 1 and 10 million people on the planet, let's say five million, and let's say they had an average body weight of 60 kg. That's 300 million kg of human body mass.
Today, let's say that the average body weight is 70 kg. With 6.6 billion people, that's 462 billion kg of human body mass. The additional 461 billion kg of human biomass was not created, it was drawn from the surrounding environment and concentrated in the human species, reducing the amount available for competitors.
Mass extinctions, anyone? This is one partial reason for the Holocene extinction event, without even going into our industrial pollution, totalitarian agriculture, or the destructive transformation of landscapes which destroys natural habitats.
There are more of us, therefore there must be fewer other living things, and/or fewer environmental resources available to other living things.
Humans have become incredibly successful at the short-term competitive game by mortgaging the foundations upon which human life is built, by unintentionally borrowing from the future. Sound familiar?
The foundation that we mortgage is the cooperative intermediate- and long-term relationships we have to all other life on the planet, which we do because of our misunderstanding and ignorance of the unmanageably complex interweaving of the biosphere as a whole, and how it supports the human species.
The collapse of our population is inevitable, because we won't have the fundamental biological foundation or the massive amounts of exogenous energy to sustain said population.
As to why it would happen soon and fast as opposed to long and drawn out will be the subject of another post. I expect to receive some suitable attempts at hole-poking and nit-picking, which will in turn allow me to explain these concepts in a more accessible manner in the second iteration.
I will point out beforehand that a population collapse is highly likely to lead to a civilizational collapse, but not necessarily. And a current civilizational collapse is not likely to mean that human civilization cannot arise again. But a population collapse will mean that civilization breaks down during a period of unprecedented death and misery, because we don't understand what's coming. And due to a lack of understanding, we have no preparations for it.
A very good lead in to introduce the work of the good folks at the Center for the Advancement of a Steady State Economy:
"The Fundamental Conflict Between Economic Growth and Wildlife Conservation, Including Considerations of Technological Progress"
http://www.steadystate.org/CASSESlideshows.html
or
If Rome Is Burning, Why Are We Fiddling?
http://www.steadystate.org/If-Rome-Is-Burning.pdf
-Andre'
------------------------------------
Best Of The Oil Drum Index
http://www.inspiringgreenleadership.com/blog/aangel/oil-drum-best-index
Most of the food we eat is devoted to energy rather than body mass. The apple in you example has a fairly large pathway into the atmosphere in addition to the ground.
Chris
Collapse is not inevitable but it certainly appears highly probable based on any comprehensive review of human history to date. The number of civilizations that exceeded their ecological carrying capacity and subsequently collapsed appears to be rather large. I am not suggesting that overshoot was the sole factor either, just one additional factor that weakened civilizations allowing them to collapse or be destroyed by other civilizations.
What you found is the much rarer occurrence. It's doable, which I've always said. But the question is not can we but will we?
... many farmers were able to diversify their income by finding non-farm jobs, applying the additional income to land conservation.
While collapse may not be inevitable, even in this case study without access to external resources would collapse have been averted? Without non-farm income the process of degradation would have continued unchecked, the results of which would seem to have been collapse. Where did these non-farm incomes come from? How were they funded? Where did the profits for those providing the jobs go? Did the non-farm income increase the percentage of non-local resource consumption? Did the reliance on a money economy cause a shift to that money economy as the dominant economic paradigm? There are a few to many unanswered questions in this snippet of "success" to convince me that it was indeed the success being trumpeted.
All complex systems pass a tipping point, after which the complexity feeds on itself and the system collapses.
Collapse, however, doesn't necessarily mean extinction.
Avoiding collapse is like avoiding death (which is, again, complexity passing a tipping point). We can push it off, we can postpone it, but not indefinitely.
What we can do that is of any significance is plan for it, prepare for it, brace for it, and teach a new generation what to do next after we are gone.
But the longer we postpone it, the harder the crash becomes.
Collapse is inevitable, but it's not the end of the world. Just the end of the world as we know it.
"The question is not can we but will we?"
Can we prevent the complex multiple catastrophes which:
* result from billions of individual decisions and unintended consequences,
* amidst a framework of media manipulation, poor education, government tyranny, religious oppression, corporatocracy, and disinformation
* while supporting 6.6 billion dysfunctionally isolated people,
* all of whom are in severe overshoot,
* as the resource and energy stores, ecology, and global climate are cracking under the strain of our increasing demands and increasing wastes,
* as our global debt-based monetary system implodes,
* as decades-long antibiotic-hardened diseases and disease vectors wait in the wings,
* while all the preceding are products of the same entrenched, unmanageable complexity?
I hate to sound like such a doomer, but no.
I'm certainly not one for religious metaphors, nor do I believe in the metaphysical concept of punishment in the afterlife, but we have unintentionally led ourselves inside the back door of hell. The door is now sealed behind us. The only way out of hell is to go through it. And the only way to prevent this happening again is through honest answers to the question, "how the hell did we end up in hell?"
One short honest answer is, "we haven't yet learned, or have forgotten, how to be human."
Can we instead survive the collapse and rebuild, and perhaps learn from our mistakes? It is certainly possible, if we prepare for the journey through darkness that awaits.
It is interesting, as one poster mentions above, that "The Limits of Growth" did not mention oil specifically. One wonders, why not? The developed nations of the world were more dependent on oil for GDP growth in the 1970's then they are now.
The limits of "growth" when applied to oil create some fascinating, even vexing, problems. Despite the fact that we are told over and over again that we live in a finite world with finite energy, we are seldom reminded that oil is only one type of energy.
So we accept readily (at least I do) that oil, coal, natural gas (discounting methane, which is virtually a nat gas equal), and metals are in fact finite. But one then comes to the subject of "energy" as opposed to "fossil fuels".
Is energy finite? In the grand "entropic" scheme of things, it may be, but for human purposes it seems not to be.
The energy in nuclear fissionable materials seems large, very large, but as we have seen in the string of posts above, no one seems to know how large or how efficiently/economically it can be extracted.
Just today, I read the article linked below:
http://www.ecogeek.org/content/view/1353/
Note the claim of 50,000 times the energy in low tempeture ground water that exists in all the remaining gas and coal resources in the world (!!)
Likewise, solar energy falling upon the surface of the Earth, and solar powered wind:
http://en.wikipedia.org/wiki/Image:Available_Energy-2.jpg
We see that while projecting Peak Oil would be a relatively easy exercise (because Peak Oil is an absolute which will happen, we just don't know when or how the effects will play out), predicting "Peak Energy" is a good deal more difficult, because there is so obviously a great deal of energy around us. What we would be trying to project would be the technology, economics and will to convert this energy. The variables in constructing such a model would have to take in variables that are almost impossible to project. We have seen this in history: Who could have projected the Great Depression accurately in 1924, only 5 years before it was to occur? People were still radically mis-projecting the Depression when it was already well underway.
Some posters hav said that the 21st century will be very different than the 20th. That is a certainty, just as the 20th was different beyond comprehension than the 19th. The problem is, we don't know how different, or in how many ways it will be different. "The Limits Of Growth" authors were wise to leave conjecture about oil and the even more difficult variable of "energy" pretty much alone.
If the book made any error, it was projecting so many other factors which are so enrgy reliant with such seeming certainty, when without the energy projections, are anything but certain.
All this gives us one indicator of what will be needed to cope with the future: The interrelated factors that affect us all require an increasingly educated consumer, voter, investment class and corporate leadership. The issues are very complex. Education and access to information is at a premium.
However, we see on all sides of the energy debate the deep desire for simple answers, back of the envelope drawings, perfectly symmetrical "bell curves", or comforting assurances by corporate think tanks that "price will balance it out." To any camp, be they doomer or cornucopian, those who point up the complexity of the issues, and the simpleness, and thus incompleteness of the models is viewed as an annoyance.
Albert Camus once said that any theory (which is in fact only an intellectual model) is correct only insofar as it is complete. Since no model can be absolutely complete (for that would be the definition of God) they are all incorrect. The argument is not about who will be wrong. We all will be wrong. The question perhaps should be, what can I do to be prepared if I am right, or wrong? The true meaning of "hedging" both as individuals and as cultures should now be at the heart of any discussion of the future.
Roger Conner Jr.
RC
Camus had a false dichotomy, or a fallacy of the excluded middle. Correct vs. incorrect. All models may be incorrect enough that there are somewhat incomplete, but correct enough that they are useful.
For some things, no bet hedging is necessary. We are all certain to die. The question is what do we, as humans with foresight and some measure of empathy, do in the meantime.
"We are all certain to die. "
Well, no, that's not certain at all. For a useful perspective on this, see www.longevitymeme.org .
Religions of all sorts have denied mortality as long as there have been religions.
Sure, but typically not in the form of sticking around on this earth. That's what I'm talking about.
If we do not individually die, that's called immortality, not longer life.
Yes, it is certain that each and every one of us eventually shuffle off this mortal coil, and anyone who tells you different is a charlatan and selling something.
"If we do not individually die, that's called immortality, not longer life."
Sure.
"Yes, it is certain that each and every one of us eventually shuffle off this mortal coil, and anyone who tells you different is a charlatan and selling something."
Not really. In order to make progress on this debate, we'll have to expand the discussion a bit beyond Yes, No, Yes, No.
First, let me note that I'm not worrying about the heat death of the universe. That will likely take place, but not for a sufficiently long time to worry me. Also, I'm not worrying about accidental death, to which I imagine we'll always be vulnerable, though a greatly diminishing extent as we get less foolhardy. I didn't suggest guaranteed immortality, I just took issue with the inevitability of death - I'm willing to take my chances.
Have you taken a look at the website I offered?
Yes, I did.
When I said that we are all certain to die, I didn't mean necessarily at all the same time. I meant that each individual life ends, and there is no chance of avoiding that indefinitely.
There is no debate about this issue, which is why it doesn't "progress".
You are going to die. And so am I. And so is everyone reading this, eventually. What will we do in the meantime? Waste life fighting the inevitable, or will we actually live the finite existence we have?
"I meant that each individual life ends, and there is no chance of avoiding that indefinitely. There is no debate about this issue, which is why it doesn't "progress"."
Well, yes there is. I'm here disagreeing with you, and by golly, that's a debate.
I see no reason for there to be a fixed lifespan. Our bodies are just machines, and there's no reason they can't be maintained indefinitely. Now, our sun is likely to go nova in 2-3 billion years, and that might be a limit. If that's the kind of thing you mean I won't disagree with you, but I don't think that's what most people mean by it.
Tangential in a way, but think about this:
LTG = Limits To Growth -- are there limits to growth?
LTL = Limits To Longevity -- are there limits to longevity?
How much energy is "embodied" in living for a long time?
Does it take more total energy inputs to live longer?
If I have genetic material tending toward longevity, will my life be made even longer through benefits brought to me by the energy inputs of fossil fuels and nuclear power, for example, as compared to life without such energy inputs?
How about if we move the discussion away from the possibility of extending life for a very long time, and move it toward the possibilities given our current life context?
For example, I do not expect to have social Security or Medicaid or Medicare or any retirement. I will need to work until I die. I do not expect that I -- or most of the people my age (I am 49) or younger will have access to modern medicine such as has become considered normal in industrialized countries.
I expect energy and food available per person will decline, as will other resources available. I expect the world to grow more violent as more people fight for fewer resources. I expect the ecosystem to become a more hostile place for our species as the effects of habitat destruction amplify over the next two decades or so.
So I suspect that we could manage to live a very long time -- given the right resources and knowledge about how to use them. I also suspect that life expectancy will decline for much of this century.
This gets us back to the topic of "Limits To Growth." If we are in serious overshoot -- and I believe that we are -- then we will see life expectancy fall over the next few decades.
This is not entirely discouraging. We each still get to choose what we do between now and whenever we might die. And we can choose to try to live forever, if we want to. Many people still long for immortality. I am rather agnostic -- even indifferent --about it at this point.
I do still have an instinct to make the best possible habitat for the members of my species that follow me. That seems to connect with conserving habitat for the widest range of species on the planet. This seems old-fashioned and iconoclastic in today's culture of striving for more stuff.
I do want to keep my fun meter registering pretty high into the "having fun" range as well. Even if we put our own collective lights out, I want to have had a bit of fun along the way. "More stuff" does not seem to keep my fun meter going, though. A longer life is fun to contemplate under the right circumstances, but not under all circumstances, by any means.
For those still not convinced as to the viability of the fast-neutron reactor, hear is some further info. It really is a shame, the lack of knowledge people have about this energy source. Advanced fast reactors are even more efficient, produce low grade plutonium not suitable for bombs, and reprocess fuel through a proliferations resistant lifecycle. And yet, we still stopped research in 1994 during final development, which was later restarted by Bush.
http://www.nationalcenter.org/NPA378.html
Nice read.
"Nuclear power based on fission is potentially larger than the fossil fuels, but it also represents the most hazardous industrial operation in terms of potential catastrophic effects that has ever been undertaken in human history."
- M King Hubbert. Ouch! Wonder if later advanced reactor designs swayed his opinions.
From Testimony to Hearing on the National Energy Conservation Policy Act of 1974.
Hubbert championed solar power:
"For a source of energy of even larger magnitude and without the hazardous characteristics of nuclear power, we are left with solar radiation. In magnitude, the solar radiation reaching the earth's surface amounts to about 120,000 × 1012 watts, which is equivalent, thermally, to the energy inputs to 40 million 1000-megawatt power plants. Suffice it to say that only now has serious technological attention begun to be directed to this potential source of industrial power. However, utilizing principally technology already in existence there is promise that eventually solar energy alone could easily supply all of the power requirements for the world's human population."
represents the most hazardous industrial operation in terms of potential catastrophic effects
Add to this things like bombing reactors or shooting down Pu heated/powered space-probes.
Actually, space-probe plutonium is the isotope 238, which is fundamentally different in its chemical properties than the fissile 239 isotope.
Recycling: Too obvious to say and perhaps it is not enough to affect peak in some areas.
But, do your models incorporate recycling in some resource areas?
As resources dwindle, we try to prop them up in various ways--substitution, as you say, being one. In the case of salmon, we try to mimic nature (we are not very good at it with salmon, for course). Mimicry is a second. Recycling is a third prop.
These kinds of activities may have the effect of pushing the consequences of depletion slightly further into the future.
Interesting work, with very relevant links to go deeper, thank you Ugo.
For those who read French, I did perform some similar research a few weeks ago on my blog : http://aerobarfilms.over-blog.com/article-15926003.html
I was aiming at highlighting differences between some mediatic models: LTG, Peakniks, IPCC, etc.
My main conclusion was that LTG, despite its age, remains one of the best models in terms of span. It is however far for being perfect since the 'world economic engine' is not accurately modelled - which is a mammoth task, even for Nobels.
Besides, peakniks' models are generaly too narrow, and they are generally used beyond their own limits : how can Laherrere dare to publish production outputs that go from now until 2150 ???
Defining the error margin of a model is probably the trickiest part of a modeling exercise - and quite nobody takes time to do it today.
Thank you, Aerobar. I didn't know your site. Very interesting comparison you made of the IEA and LTG models. I do agree with you that the LTG models are far from being perfect, but still the best! Obviously superior to Hubbert-style models (or "peaknik models", as you say), but each kind has different applications. And, again an obvious observation, very few people think of placing error bars in the results of their models. Models, models, models.....
Politics will trump geology. Most geological models are based on what is possible. Using US, Lower 48, oil as a foundation makes geological sense. But consequences of US Peak Oil were buffered by world oil production. With World Peak Oil we are facing a true civilization killer. Fortunately we have faced and defeated such killers before. Unfortunately, they have also driven us into dark ages.
We are lucky that energy inefficiency of power generation is 69% and transportation is 80%. We cannot increase oil, but we can increase efficiency, effectively increase energy by 3-4 times.
Examples, Morgantown's PRT in transportation and Feed-in Tariffs in power generation.
On the hardside, if we fail to adapt at a 2X rate per year (doubling our effectiveness each year) we will crash as the problem undercuts our economies at a rate of 2X per year.
Example, oil doubled in price in 2007. Foreclosures are increasing in number and rate as more and more people fail to pay for the rising cost of both their home and commute. Foreclosures exposed the Sub-Prime risks. Weaker economies are under pressure. Even, strong economies, such as South Africa, is in an energy crisis that is closing mines and jobs.
The greatest risk is that our sophisticated economies leverage natural resources so our populations are in overshoot. This is not a problem so long as the technology and social tools that support that economy remain viable. This graphic illustrates this economic model:
Churn, the process by which we scramble to find a niche allows us to adapt. The regulatory monopolies in power generation and transportation in most countries has locked this process into practices invented at the turn of the last century (Edison and Ford).
Fortunately, Scheer, and the Germans, have given us a new model for power generation. Cabinetaxi and Morgantown gave us a path to more efficient transportation. Why do we need to move a ton to move a person in congested traffic?
Distributed power generation and modernizing Personal Rapid Transit can increase efficiencies from 20-30% to 70%-80%. We do not have an energy problem. We have a policy problem.
We are on a short time line and a 2X rate or face hoarding which will collapse resources far faster than geology restricts oil access. Politics trumps geology, fear will collapse the technical and social structures and populations will collapse with too many mouths to feed relative to the ability to deliver food. To have a really big famine you need government policy (10 worst famines of the 20th Century).
It will take 50 years to churn, to change the lifeblood of our economy from oil to ingenuity. We can change the rules and re-tool. We did it with the communications infrastructure. We must and can re-tool faster in power generation and transportation efficiency increases.
I believe we have already hit Peak Growth. Economic growth requires steadilyy increases in energy or efficiency. The plateau of crude since May 2005 ended steady increases.
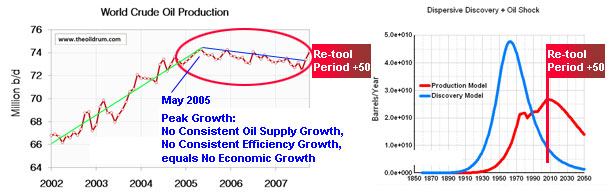
Pitt the Elder; Two Great Posts, Thanks.
As for soil erosion: Somehow lost among the hubbub is the fact that something like 76% of our corn is now grown using "no-till, low till" farming methods. This number has been increasing by about 1.5%/yr. As a result, some areas of the corn belt have actually been increasing their topsoil. After a couple of cups of coffee I'll try to find the links.
A book that explains the middle ground between the Economic fundamentalist model of how the world works on one pole vs. the LTG impending scarcity model on the other is:
Saving Energy Growing Jobs: How Environmental Protection Promotes Economic Growth, Profitability, Innovation, and Competition. David B. Goldstein bio, Bay Tree Publishing, 2007. (UC Berkeley PhD in Physics, 2002 MacArthur "genius" Fellowship)
An interesting read that I highly recommend to anyone involved in these contentious social, political and economic issues, the author addresses the problems of myths held by one pole about the other pole, the impediments leading to the erratic adoption of improved technology and why U.S. public policy develops as it often does (poorly). In fact, the book title is misleading as it is more about these issues than directly about saving energy and growing jobs.
One blog post with a good synopsis of the book: The Case for a Business-Environmental Alliance, Hint: It’s Very “Efficient”
=====
Feb 20 Corrected Book URL: Oops, my apologies to the author, the publisher and the readers for pasting in the wrong URL.
The American way is to borrow against the wealth of the country until everyone has a Hummer, a 12,000 square foot mansion on 50 acres with 8 kids, ATV's for everyone, a speedboat, Harley's, giant trucks with super loud after market mufflers, consuming 10's of thousands of dollars worth of products including fuel each month, knowing that we have been reassured that deficits don't matter.
So what the World needs to do is borrow against the wealth of the World to achieve the American dream for every human on Earth.
Now, you may say "hold on there big fella", because many people know the dovetailing of global warming/climate change with peak oil is a recipe for disaster, yet as a specie we've ignored pretty much all the danger signs up to now, so we might as well go out in style. Let's rev up this planet until you can't hear for the sound of huge internal combustion engines gurgling out massive thundering sounds. Let's plunder the Earth at an ever faster pace right to that point of the dovetail connection and then tip our hats as we exit a decimated landscape. What do you say folks?
Do that on your own planet.
Black Friday
March 7 2008 11:30 am ( NY time )
BOOM
Right now, peak oil isn't being determined by economics or geology, but politics. The rising price of oil has made the nationalization of oil fields a viable idea, and national oil companies are notoriously innefficent and generally limit production, which raises the cost of oil, and the cycle repeats on itself. We could easly go over 100 MBPD if all the oil in the world were available for competitive bidding. Violence in Nigeria and Iraq as well as the politics regarding Iran and Venezuela have vastly restricted production in those countries.
Daxtatter,
Maybe you need to contact Sadad Al-Husseini, former head of exploration and production at Saudi Aramco, who said on Oct 29, 2007, that
http://www.davidstrahan.com/blog/?p=67
From the Oct 2007 Oil and Money Show
http://www.energyintel.com/om/
this is Al-Husseini's latest forecast - a peak plateau