Update on the Simmons-Tierney Bet
Posted by Stuart Staniford on March 17, 2008 - 10:00am
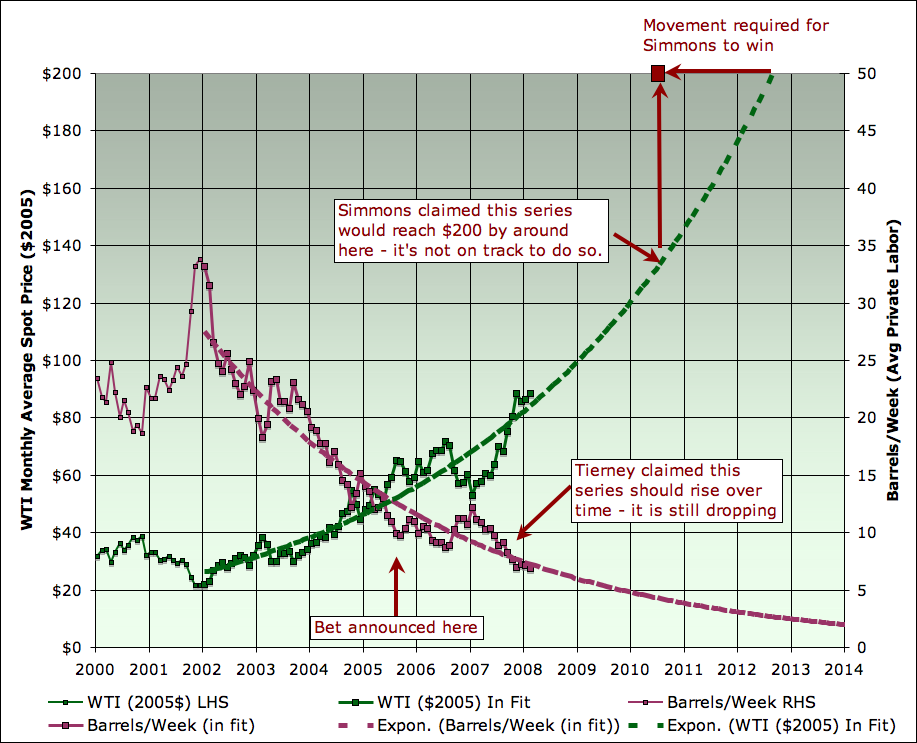
Greeen (left scale) monthly spot price of West Texas Intermediate crude oil, expressed in $2005 (CPI deflated) per barrel. Plum (right scale), number of barrels of WTI crude purchasable by forty average hours of private industry wages, pre-tax. Source: EIA for crude prices, BLS for CPI index, and BLS via Alfred for average hourly wages. Dashed lines are extrapolations of exponential fit from Jan 2002 on for illustration of trends only. These are not predictions, and the basis for assuming future trends will be similar to past ones is weak.
I don't share Matthew Simmons's angst, but I admire his style. He is that rare doomsayer who puts his money where his doom is.After reprising the history of the famous bet between Paul Ehrlich and Julian Simon, the actual terms of this new Simmons-Tierney bet were detailed further down the column:After reading his prediction, quoted Sunday in the cover story of The New York Times Magazine, that oil prices will soar into the triple digits, I called to ask if he'd back his prophecy with cash. Without a second's hesitation, he agreed to bet me $5,000.
His only concern seemed to be that he was fleecing me. Mr. Simmons, the head of a Houston investment bank specializing in the energy industry, patiently explained to me why Saudi Arabia's oil production would falter much sooner than expected. That's the thesis of his new book, "Twilight in the Desert: The Coming Saudi Oil Shock and the World Economy."
I didn't try to argue with him about Saudi Arabia, because I know next to nothing about oil production there or anywhere else. I'm just following the advice of a mentor and friend, the economist Julian Simon: if you find anyone willing to bet that natural resource prices are going up, take him for all you can.
I proposed to him a bet using what Julian considered the best measure of a resource's value: how it compares with the average worker's wage. I offered to bet that the price of oil would not rise faster than the average wage, meaning that future workers would be able to afford oil more easily than they could today.We are now close to the half way point on this bet, so how is it looking?Mr. Simmons said he favored a simpler wager, based on his expectation that the price of oil, now about $65 per barrel, would more than triple during the next five years. He said he'd bet that the price in 2010, when adjusted for inflation so it's stated in 2005 dollars, would be at least $200 per barrel.
Remembering a tip from Julian, I suggested that we use the average price for the whole year of 2010 instead of the price on any particular date - that way, neither of us would be vulnerable to a sudden short-term swing as the market reacted to some unexpected news. Mr. Simmons agreed, and we sealed the deal by e-mail.
To assess this, I constructed two measures - one is the measure on which the bet will actually be decided - oil prices in 2005 dollars. Tierney's column doesn't define exactly which oil price, or how to deflate it, but simple choices are to use West Texas Intermediate (WTI) oil prices (from the EIA) and correct for inflation with the BLS's CPI-U index.
In addition to this, I also looked at a metric to measure what Tierney was originally trying to propose - how much oil can be bought with a given unit of wages, which he said should increase over time (people should become worth more and more, relative to oil). My implementation of that was to take average hourly wages in private industry, multiply by forty, and then see how many barrels of oil that would buy (ie how many barrels of oil does a week's worth of gross pay buy).
Furthermore, I noted in June 2006 that the run up in oil prices since the beginning of 2002 was exponential in form, and this is still roughly true. So I fit an exponential to both metrics and projected it out for a few years. The average doubling time in price is a shade over three years at present for nominal prices, and about 3 1/2 years for real prices. Obviously, an exponential increase in oil prices cannot continue forever (too many doublings and people would be spending all their income on oil), and I have no real idea when it will stop. Thus these extrapolations are just to be taken as what happens if current trends continue, not an unconditional assertion that they will continue.
With those caveats out of the way, here's the data:
Greeen (left scale) monthly spot price of West Texas Intermediate crude oil, expressed in $2005 (CPI deflated) per barrel. Plum (right scale), number of barrels of WTI crude purchasable by forty average hours of private industry wages, pre-tax. Source: EIA for crude prices, BLS for CPI index, and BLS via Alfred for average hourly wages. Dashed lines are extrapolations of exponential fit from Jan 2002 on for illustration of trends only. These are not predictions, and the basis for assuming future trends will be similar to past ones is weak.
However, it seems to me important to look a little deeper. In a sense both men look wrong in light of the data of the last few years. Simmons looks too pessimistic - at least so far, oil prices are not increasing as fast as he presumably expected them to. On the other hand, if we look not at the final terms of the bet, but rather at what Tierney initially proposed, then Tierney looks much too optimistic. The oil value of a week's work has not gone up, but instead has continued to fall rather sharply (real wages having been roughly flat, while oil is increasing rapidly). And while Simmons is quantitatively wrong, Tierney's original proposal would seem to be qualitatively wrong - things are moving in the opposite direction from what he predicted.
Of course, there are still two years, nine months, and a couple of weeks to go before the end of 2010 when the bet will be settled for sure. Who knows what will happen in the intervening time. But the trends right now point to Simmons losing the bet by being right on the big picture, but overstating his case somewhat.
Added in Press
After I had written the piece to this point, on Saturday, I sent it to Matt Simmons and John Tierney to see if they had any comment. Only Simmons responded:
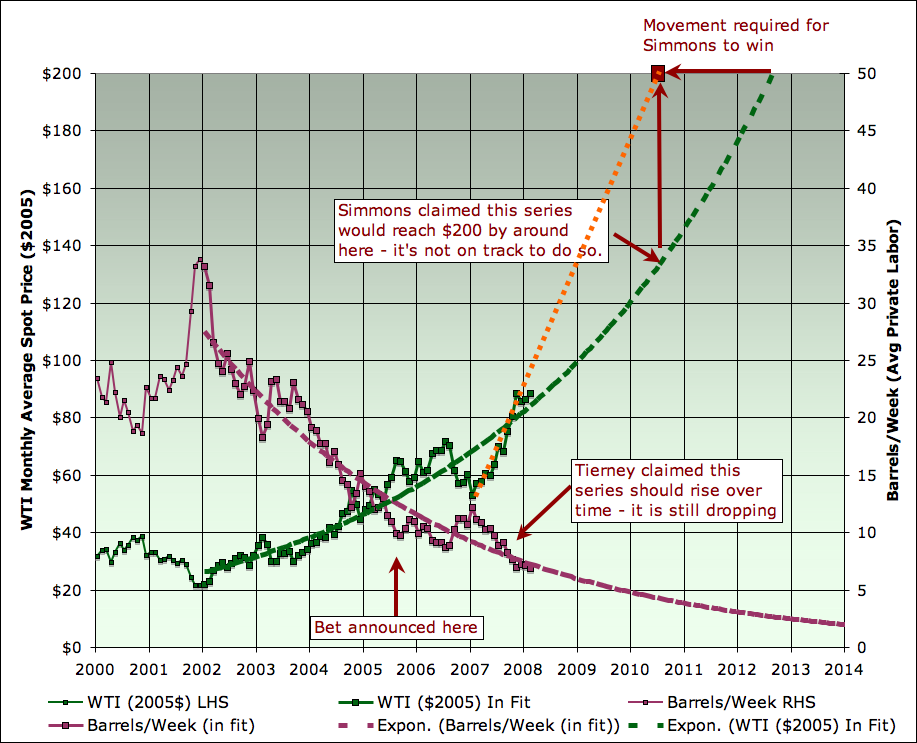
Good piece. This is also first time I re-read John's column in a long time. Here are a few observations I would add. At the time when Tierney called, I obviously had no certain idea where crude prices would be in 2010, but thought the likelihood they would rise a great deal was very high. To make the story simple, I picked $200.Simmons in essence is arguing that there's still hope for him to win along the kind of trajectory I've marked in orange here:If you take your same chart and ignore the slow rise until mid 2005, and then take the times it shot up, or start trend line in 2007, the trajectory gets you there in fine shape.
We obviously talking about far more than a fun $5,000 bet. If oil has peaked, and the world stays in denial, there could be such social chaos that it might be hard to even define what the price of crude even is.
More important is the question "Is $110 oil now priced right?" Answer is also easy. No since this is still only $.17 a cup!
Greeen (left scale) monthly spot price of West Texas Intermediate crude oil, expressed in $2005 (CPI deflated) per barrel. Plum (right scale), number of barrels of WTI crude purchasable by forty average hours of private industry wages, pre-tax. Source: EIA for crude prices, BLS for CPI index, and BLS via Alfred for average hourly wages. Dashed lines are extrapolations of exponential fit from Jan 2002 on for illustration of trends only. These are not predictions, and the basis for assuming future trends will be similar to past ones is weak.
Now, however, we are in a somewhat different world. It looks like there is at least a small bump in supply at the end of 2007, and the prospect of more in 2008 - maybe as much as a couple of million barrels/day, though it's hard to be sure, still less precise. Given similar to recent trend GDP growth, this wouldn't require as large a growth in oil price. And given a global recession, it might be expected to lead to much lower price growth, maybe even price falls.
However, what is happening instead is, as the credit bubble deflates rapidly, we have sharp falls in the dollar and negative real interest rates, sparking a rush to commodities. How long this trend will continue is probably anyone's guess. The best hope for Simmons was perhaps raised by Paul Kasriel in a very important analysis last week, concerning the possibility of the failure of the currency pegs of the Saudi riyal and Chinese yuan
But, in our opinion, what could turn a walk on the dollar into a sprint would be a decision by the Chinese and/or Saudi central banks to eliminate the pegs of their currencies to the greenback. Now, what would motivate these central banks to sever the peg? The desire to rein in their domestic inflation. In an environment in which the dollar is under downward pressure, the by-product of pegging one’s currency is higher inflation in the economy whose central bank is pegging.The inflation mechanics are as follows. The pegging central bank has to buy U.S. dollars in the foreign exchange market in order to prevent the dollar from falling against its currency. The dollar-buying central bank purchases dollar with its own currency. The dollar-buying central bank gets its own currency the same way all central banks get their own currency – it figuratively “prints” it. The dollar-purchasing central bank therefore floods its economy with its own base money, resulting in inflation – inflation in the prices of goods/services and inflation in the prices of assets.
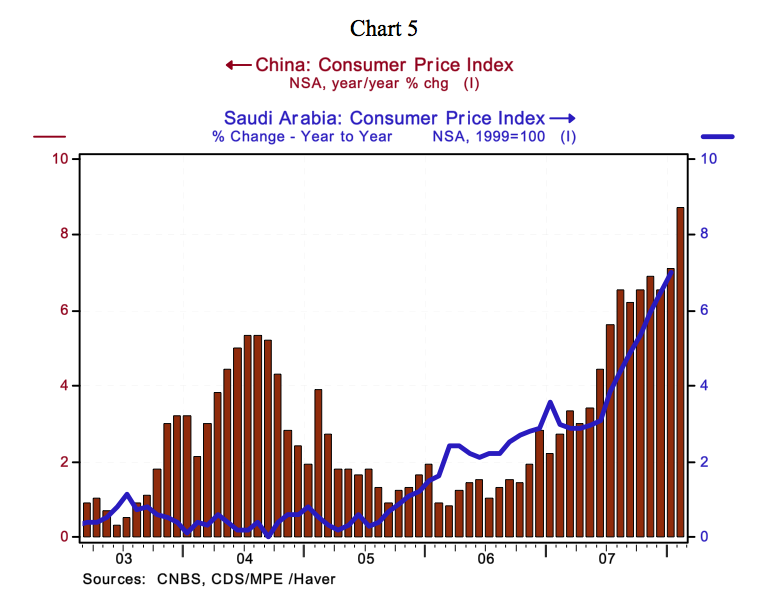
Recent trends in Saudi Arabian and Chinese consumer inflation. Source: Northern Trust
And if the Saudi and Chinese pegs come undone, then maybe oil could get expensive enough in dollars for Simmons to win his bet after all.
Contact
- Content: editors at theoildrum dot com
- Tech support: support at theoildrum dot com
License

This work is licensed under a Creative Commons Attribution-Share Alike 3.0 United States License.
You think smooth curves. Some of us think in terms of curves with discontinuities. If there is an upcoming discontinuity, the nice smooth curve doesn't really tell us anything. Simmons may be thinking in terms of discontinuities also.
With enough stresses, there are likely to be fractures in the system.
Discontinuities was the thing that I was thinking too - essentially, the system is running flat out, and America seems to be wobbling from its position at the top. E.g. - the price in dollars may continue to rise beyond any reasonable expectation, as the dollar loses its value to those selling oil to America.
Well Simmons is a smart guy... who's to say (except him?) that he didn't peg this bet to the dollar value as opposed to Euros or a currency basket because of his assessment of the likely future value of the dollar?
If I were a betting man, I'd have taken that into account.
(Although he might then have put the bet itself in Euros or a currency basket if he believed that ... although it would perhaps have been more clever not to do that so as not to alert his betting partner to the reason he took his position in dollars...)
Well, as I said:
I agree that there could be geopolitical discontinuities, though with the release of the Iraq NIE (and consequent drop in Bush-Administration Sabre Rattling Index (BASRI), the world looks a little safer. We are also in the middle of financial market discontinuities, though at the moment, they are not as discontinuous as all that. They would have looked a lot more discontinuous this morning if the Fed hadn't operated so swiftly over the weekend.
Even the great depression took four years, peak to trough!
I beg to differ. With the recent stepping down (firing) of Adm. Fallon, and the continuous ramping up of anti-Iran rhetoric, the chances for more American military action in the Middle East looks to have increased, not decreased. All-out war in that region would certainly make a very strong case for discontinuities, perhaps for extended periods of time.
Indeed
http://www.jpost.com/servlet/Satellite?cid=1205420704459&pagename=JPost%...
Peak Oil is now a reality that we must adapt to or ????
Simmons has upped his Cup-o-Crude to 17 cents. Corn is still at about 5 cents per cup. The dollar is breaking down big time. How long before foreign holders of dollars decide to spend some more on American agriculture commodities? When they do ethanol will get the blame if the recent past is any indication.
Why wasn't Bear shopped to China?
What can China use it's $$$'s for?
The US has actual cash of $400 Billion with 15% in the vaults.
That will have to spread over 300 million Americans.
What will millions of Americans use for cash?
I can't confirm this, but I believe Bear Sterns was shopping around China for investors, and they got turned down flat.
Chinese have been burned by Blackstone, etc. and they are not about to do so again.
China brokerage rethinking Bear Stearns stake (March 16, 2008)
I think it was more of a "Hell no!".
So far, it looks like Tierny will win his bet the same way that Robert Rapier won his no $100 oil before 2008 bet - by the skin of his nose!
But, fundamentally, so far, it looks like Simmons was "right". A little more time will tell (as always)...
Simmons is obviously betting on the oil situation to accelerate. We are seeing this now with high prices. Ace's project show a demand gap as you will beginning to widen now. We have three factors at play that make Simmons bet reasonable and BAU or business as usual a bad bet.
1.) Bidding wars develop between wealthier nations.
2.) Export Land.
3.) Production begins to drop at some unknown but probably accelerating rate.
On the geopolitical side tensions will increase dramatically under these conditions.
The financial gyrations around peak oil are just that by most measures a good bit of the wealth supposedly created over the last ten years is rapidly evaporating. Outside of China and India our economies have probably been stagnant since 2000 in terms of real wealth. This has been hidden buy extreme financial policies that are now blowing up.
A good argument for this is simply that wages have been stagnant or even dropping despite inflation thus any growth since 2000 has been based primarily on debt not spending wages earned.
So Simmons will probably win.
This is the dumbest structure for a bet I've ever seen. It is essentially two bets. One bet is the price of oil and the other is how many barrels a week's pay will buy. Come Jan 1, 2011 both parties could claim victory. The price of oil fails to reach $200 and Tierney claims victory while the amount that a week's paycheck can buy drops and Simmons claims victory.
;}
Absolutely right.
The actual bet was on the price of oil. Tierney just revealed something about what he would have been prepared to bet on, and I chose to illustrate that. Had Matt taken him up on those terms, that (hypothetical) bet would have been looking pretty bad to date.
Your idea of the amount of price rise for percent of increase in demand given flat production is wrong by a huge amount.
Part of the reason you're wrong is you're considering 2006 to be a normal year.
2006 was heavily skewed by a short-term successful manipulation of the price of gasoline and oil through the GSCI reweighting. Since this price fix then caused changes in production plans, we have been paying heavily for that manipulation since September 2007, and we're not even close to being finished with the adjustment.
You might want to check out this 2006 U of C study of price elasticity of gasoline demand: http://repositories.cdlib.org/cgi/viewcontent.cgi?article=1062&context=u...
It looks to me as if price will be rising 25% per 1% increase in demand, given constant production, up from a norm of 10-15% per 1% of increased demand given flat production.
It's also incorrect to assume that flat production is really flat production. It is taking more rigs and more energy to produce the same amount of production. So flat production is really falling production.
Having said all that, I don't know whether Simmons will win his bet. In my opinion as a professional gambler for more than 20 years, it was stupid of Simmons to base his price target on inflation-adjusted dollars. A rise in the real oil price inevitably triggers price inflation. That doesn't mean the rise in the price of oil isn't "real." The inflation we're seeing right now is primarily due to the rise in the price of oil, not from any Fed money-printing spree. M1 and M2 are basically flat, and the Fed has been systematically neutralizing recent liquidity injections. What Bernanke gives via TAF, for example, he takes away from SOMA.
So, Simmons, though right on the direction of oil prices and the reason for that direction, may lose because he didn't think through how rising oil prices would raise other prices.
Let me say in closing that the people around here are terrible in general at constructing bets, even though you're very smart about peak oil. You should all stay away from gambling.
Moe Simmons bet was a political statement I'm pretty sure he was not worried about losing money.
The fact that he believes he is certain to win despite it being a poor bet should be cause for concern.
You're exactly right and eloquent is the way you said it.
8D
And I'd enjoy playing Blackjack all evening long with you.
> A rise in the real oil price inevitably triggers price inflation.
Plus the shift away from petro-dollars pulls the rug out from under the dollar, as predicted.
Your wage data is horribly skewed. You simply cannot use a wage mean to describe household purchasing power in the United States. I'd recommend that you drop the top and bottom 20% of households (or 10% of each if you want to be picky), then run your numbers. Over 60% of households in the US have been below the mean household income level for many years (roughly 35). If you need that data, feel free to email me.
Either way you do it, to say that neither Simmons nor Tierney are right is another exercise in skewed logic. It's like saying: "Person A bets that the world will end when the sun burns out in 9 billion years. Person B bets we will be rescued by sky fairies in 8 billion years." Well, since neither one has happened, they are both wrong....
Whoever stated that quantitatively, both are wrong, but qualitatively Tierney is wrong and Simmons right--is more correct than Stuart.
If one preferred median to mean, it would change the picture a whole bunch - either way, the point is that it's going entirely in the wrong direction.
It's not a matter of means or medians, it's a matter of inequality. I criticized your wage operationalization because it is the standard "pick a statistic" approach that goes unquestioned today--it fails to adequately consider the underlying structure of wage distribution in the US. It is similar to the assumption that phenomenon are linear. By choosing an easy to use tool, you lose most of the meaningful information, and actually reduce the usefulness of your "results".
Feel free to graph your preferred metric of average wages. I claim no reasonable choice of metric is going to change the picture a whole lot.
Oh also, when you say, "Whoever stated that quantitatively, both are wrong, but qualitatively Tierney is wrong and Simmons right--is more correct than Stuart", it was actually me that said that:
Ha! I guess that's pretty funny then--nice job.
The inflation adjustment of the dollar price seems odd, as oil price is one of the main inflation drivers in the CPI (currently more then 25% of the US CPI) and other price increases are also corelated with price of oil. Therefore the more oil price rises the higher inflation and therefore the lower "real price" of oil after the CPI adjustment. I.e. an extreme would be, if the oil was the only comodity in the inflation basket ==> the "real=CPI adjusted" price of oil would then be always stable, because in the "oil only world" 1 barrel of oil has always the value of 1 barrel of oil.
In other words, you have to use some oil independent inflation basket otherwise you are double counting and decreasing the effect of rising oil prices.
Probably the suggested "average purchasing power", i.e. average wage divided by price per barrel is the best indicator of some real price changes, compared to some simplistic CPI or GDP adjusments.
I was under the impression that BLS had removed energy and food prices from their CPI calculations (and it was done in 2003?).
The "Bureau of Labor Statistics" definitely includes price of oil (or gas etc) in their published CPI index, e.g. see the following link (transportation and energy has highest contribution to CPI): http://www.bls.gov/news.release/cpi.nr0.htm
BLS probably started to publish some "core inflation" index, i.e. without the impact of energy price changes, but I cannot find it right now (I remember reading about it in the past...). Anyway, the published CPI adjusted prices of oil are definitely using the standard US CPI with oil price increases included, e.g. see/click the chart at EIA: http://www.eia.doe.gov/cabs/AOMC/Overview.html
You are correct--it was the creation of a "core inflation" CPI measure that I was thinking of. To find BLS' core inflation figure, take a look at the first link you posted; at the bottom of their first CPI-U figures, they pull out energy and food ("special indexes")--subtract that from the "all items" CPI-U figures and you arrive at "core inflation," which is the figure they advertise.
You're technically correct - ideally I should deflate with cpi ex-oil. I'm not sure that series exists, however (though cpi-ex energy exists). However, this was easy to do and gives us a good enough idea given that the uncertainties here are dominated by what will happen in the remaining period of the bet. Even nominal prices are not on track for $200 by 2010 - so a discontinuity will be required for Simmons to win.
I find the bet interesting and distressing because it indicates how strong a hold Simonesque (aka cornucopian) thinking has on the mainstream punditry. The stronger and more pervasive this type of thinking is, the worse things will get (let's see Stuart plot that statement out graphically :)
An attack to Iran before November, as leap2020dotcom now suggests at 70% likely, and Simmons would win easily.
It would be the last heroic action of GWB (the 10 trillion debt man)!
Stuart Staniford wrote:
People on this site may interested to know that Stuart Staniford has recently argued in the comments on an economics blog (before Bear fell) that nationalization is on the way.
See on Feb 29 here and on March 11 here .
Turns out they didn't have months (or even weeks!).
But good call. Since nationalization has indeed begun to happen. Judging by US stock market's reaction by the end of today, it will have a stabilizing effect. Of course, the American public is now on the hook for part of the risk associated with Bear Stearns's more questionable assets. Stability has its costs. In this case, bearing those costs is very worthwhile.
I was pleased to see Krugman say this very clearly this morning also:
It's either the Dollar or the Fed.
Pick one.
Now that's a bet!
And the BLS has as much credibility as S&P/Moody's/ and Fitch right now.
Early Friday, the CPI came out flat and defied any sense of logic for 95 percent of the population.
I can only assume Krugman is being sarcastic. Current situation: taxpayer money funnelled to Wall Street insiders so the entire Ponzi scheme can be held together. No interest from ANY government representatives, elected or otherwise, in enforcing current laws in this area. The one public figure raising a stink thrown to the wolves-probably half the sheeple feel that who Spitzer is banging is far more important than the outright theft of their money. Yes, of course, taxpayers' money will be directed toward the people who caused the problem- it is the (Latin) American way.
On a somewhat related topic as far as oil price and speculation goes it bounced pretty hard of 104 and was close to 112 so about 7% speculation in the price.
Considering peak oil is not yet obvious I don't consider this a large speculative position. Assuming peak was back in 2005 then by 2010 it should be obvious and at that point a 25% speculative addition seems reasonable. I'd not call it speculative by a reasonable pricing in of the real value of oil during a transition away from oil.
So
140*.25 = 35 == 175 dollar including just peak oil based repricing of oil.
Add in and additional 10% for geopolitics gets you to 189.
Next to continue a bit more assume that a bidding war between wealthy nations to avoid shortages leads to and additional 50% premium gets you to about 260 a barrel.
Add in Export land and your pushing 300 by 2010 this would imply with a bit of backtracking that we should end 2008 at around 140 adjusted somewhat for inflation gives about 160.
So if we end the year around 150-160 then it makes sense to assume that Simmons is probably right if its closer to 200 then we are probably heading toward 300 by 2010 and Simmons was conservative.
However if we end the year around 90 which implies that economic slowdown had a big effect and that new oil sources where found then we are probably going to be going into 2011-2012 before we see serious problems.
Simmons point was not to win or lose the bet. As he said this is a bit of a fun $5000. Five large would be petty cash to Simmons so I doubt he is particularly worried if he wins or loses the money. Waht is more important is that this bet can be used to raise awareness of Peak Oil and what it means in the broader economic sense. Simmons really only needs to be in the general vicinity of his prediction to win the argument if not the cash. The graphs both show that Simmons is more right than wrong while Tierney (using Simons theory) is more wrong than right.
Leadership is about having the vision to see what the future holds and preparing yourself for the challenges that lie in between. Matthew Simmons has shown great leadership and courage firstly to ask the questions, seek the answers and demonstrate in the most public of ways the dangers that lie in wait for us. Tierney on the other hand appears to be a leech who has seen a chance to make an easy $5K, betting on a subject he admits to knowing nothing about.
Whom shall we follow inot battle? The seasoned sober general who understands the full strategic plan or the isolated private who looks and around and sees no enemys in the immediate vicinity and so declares the war over?
A smooth curve for future oil (or nat gas) pricing disagrees with how Deffeyes sees it. It's difficult to project a bidding war for something that has become "priceless", meaning that they can't make up more batches of it just because people want more. That's always been the case with oil and its swing producers, but not anymore. A charting solution for the final bid at a rare painting auction is useless and a little like trying to peg a future oil price.
Deffeyes noted this effect in Beyond Oil in a discussion of deregulation of nat gas utilities. His comment was "My only advice is to be careful. Much of the chaotic pricing is due to demand approaching capacity." He elaborates elsewhere on resource pricing departing from smooth curves as demand comes to equal capacity, and that's certainly where we are now with oil.
All this doesn't even count the dollar chaos and what will probably be increasingly chaotic bidding for hard assets with the world's massive wad of investment money, built by decades of fancy financial shenanigans that no longer has much appetite for the shenanigans.
When this bet was first made I thought that Matt Simmons was a sure loser, even though I felt the price of oil would proceed towards $200, and not behave as the cornucopians expect. And as I would want Matt Simmmons to win the bet, I was dismayed that he had picked $200 as the 2010 price since any cornucopian would have bet on a lower number. I would guess his opponent, being someone who quotes Julian Simon, didn't expect even a $100 average yearly price by 2010.
$200 looked high with the fact that many in the peak oil community were not predicting a production peak until then or even later. However, now that May 2005 may have been the peak of world crude oil production, things are looking better (bet-wise that is) for Simmons. When you think about how oil has gone up with rising and flat production, imagine what could happen to the price if we start to see a significant decline in production. And the job export from the US to India and China continues full steam ahead so their demand alone could push it up to $200. However, I don't know that anyone can accurately factor in the negative impact rising oil prices will have on economies and how that, coupled with the price increase itself, affects the supply/demand "equation".
As far as negative impact of high oil prices. Its a bit of a catch 22 if high oil prices slowed the economy enough to cause demand side collapse then the new low oil prices would spur the economy. So even the concept that a slowing economy would result in and sort of real lowering of oil prices does not make a lot of sense. At best the rate of increases in prices would decrease but we are not seeing that.
Next what we consider a terrible slow down which is negative growth of say a few percent means that the whole world would need to have overall negative economic growth to have a big impact on consumption. Its just about physically impossible for China and India to go from 10% growth to negative in a short amount of time. Give the large account surplus in China even if the economy starts slowing because of fundamentals they have a lot of room to spur it on using monetary policy. So even if yhe US went negative by a few percent we still probably have significantly positive world economic growth.
Finally a big part of the GDP of the US is not production of goods or what we consider real work that uses oil. A big part is what are probably best described as foo foo jobs.
So we can see a real slow down in GDP and not see a equivalent drop in oil usage until the hard economy is more effected.
For example take the collapse of Bear Stearns I'd argue that the amount of oil saved what minute from this event if any. So you can see how the US can easily slow quite a bit in terms of GDP before "real" economy slow downs cause demand to drop.
In terms of affecting the price, much more important than production is exports. A Saudi Arabia producing 4Mbbl/day, consuming 0.1Mbbl/day, and exporting 3.9Mbbl/day, that gives us lower world oil prices than a Saudi Arabia producing 10Mbbl/day, consuming 8Mbbl/day and export 2Mbbl/day.
According to this person, we see,
As consumption rises in places like Saudi Arabia and Iran, we can expect to see that net oil exports will decline. Are they willing to do without so they can sell the stuff overseas? The Saudis can probably afford to, they're pretty wasteful with the stuff already. But Iran with a large rural and impoverished population, they probably want to increase their energy use. Perhaps that explains their nuclear push - they want to be able to increase energy use without dropping their oil exports and foreign cash.
Anyway, exports has a bigger effect on price than does total production.
if you please (Google makes it a bit difficult to link to their photos):
Cheers, Dom
2005, 2006 and estimated 2007 Saudi net oil exports (Total Liquids, EIA for 2005 & 2006):
2005: 9.1 mbpd
2006: 8.7
2007: 7.9
IEA warns of supply crunch beyond 2010. At the same time, the IEA was begging OPEC to open the taps right now. Seems to me like the supply crunch started last year. If the Feds can keep the global economy on pace then Matt Simmons will win this bet figuratively and literally.
IMO Crude prices (monthly Avg) are set by oil importers, and their ability to obtain cargoes. The speculators only effect the price on a day to day basis. We shall see in a week or two if this is correct.
Could the recent rise in oil prices reflect insider knowledge of military action against Iran?
I don't think so but it could herald the invasion of the Martians! But here is another silly and pointless question to ask the TOD community - at what point does the price of oil need to be to encourage extraplanetary oil and gas exploration?
Well, at current rates into low Earth orbit of $1,000-$2,000/lb... about half a million bucks a barrel just for transport costs.
didn't realise there were any planets to explore in low earth orbit or is it in space:-)
Maybe all that missing matter in the universe could be oil, now all we've got to do is figure out how to get it with a good EROEI.
Sure there are no planets there, but that's most of the energy cost, getting into LEO. If you're not in a great hurry, then the rest of the journey takes comparatively less energy.
But anyway, LEO represents a minimum energy and financial cost to get into space.
Titan is a big fuckin' sea of hydrocarbons. You just know Exxon or Shell has got some guy to do a study on the possibilities. Just in case.
Theres gotta a small IPO in that. Lets float it!
Basing extra-terrestial oil price on the price per pound to LEO is silly. Only production equipment needs to go up that hill (at $1000/lb). Oil falls downhill for the price of the barrels to store it in.
And the space industry is one with room for LOTS of innovation. $100/pound to LEO should be achievable fairly easily, given a big wad of private industry money thrown at solving the problem. (or many times the private amount, if a government tries to do it).
Regardless, getting oil from titan is farfetched compared to more simple things like orbital solar power arrays, capturing asteroids for metals, etc.
Mate, the wealthiest country in the world hasn't been able to get its arse to the Moon for 35 years.
No-one's mining any asteroids this century.
If "but there's stuff in space!" is the best someone has to offer, then I'm off to buy assault rifles and spam.
On the surface Simmons assumption of 200 average price in 2005 dollars in 2010 for a barrel of oil is way out there on the fringes, yet recently the price of oil has skyrocketed. If we have 4 or 5 similar type periods in the next couple of years, he might just make it.
I think were Simmons loses is on oil having to average 200 dollars or more for the entire year of 2010 in 2005 dollars. Gees, Simmons sure didn't haggle much on the terms. He could have at least set the terms at 200 dollars in 2010 dollars and have to hit the mark just once in that year. Now that would have been a much more interesting bet.
I think you miss the point that Simmons is trying to make by taking on the bet (he doesn't strike me as a gambler so I think he is quite prepared to cut a cheque for 5 large if he loses - in 2010 dollars, which might be ashtray money by then).
In a way there are two bets going on. One for the money which is a win or lose proposition. The other is the battle over who is more right about the direction of the trends. It appears that Simmons is more right than Tierney, so far that doesn't mean he will get over the line and win the money.
Simmons doesn't really care about the money. He does care about getting the message out and if this bet helps achieve that then he has "won". Extending the bet over the whole of 2010 will mean people tune in every day for a year and take notice of the trend and all the issues surrounding it. This will be far more interesting than simply trying to pick one price point in a year.
The only thing that might have made it more interesting is if the bet had been denominated in gold bullion rather than flaky dollars.
The average price of 200 for the year means he's betting on $200 on July 1 2010... unless we assume a non linear price growth for the year 2010, in which case it could hit that price later than that, say August or September and still average out at 200 for the year.
I personally am going to laugh myself senseless when, sometime before 2010, the following will most likely have taken place:
1. The US economy has collapsed
2. The Chinese economy has likewise followed it straight down the bog, and
3. The price of oil has GONE DOWN, mostly from the collapse of the world economy, with some impact also from the Europeans - the only people to have their sh*t together - still chugging along with renewables.
I'll stop laughing only once I've realized I have the misfortune to be living in the wrong part of the world, the toilet end that only lucked out in the prosperity stakes, and will lose that when the lucky streak finally stops.
If you believe peak oil is driving the collapse then I can't see how the price will drop.
Considering that its getting to the point that KSA might be the only major player left that could maybe possibly increase production and that they cut production to the bone last time prices collapsed the chance of a price collapse is fairly remote.
The only thing that would cause a price collapse is a flood of new oil and this would boost the economies.
I just don't see the logic behind the assumptions that the price of oil would drop significantly as our economies worsened. I mean you would have to have like a 10% drop in world wide economic activity to change the price of oil a lot. And thats way worse than peak oil.
Look at it this way we are at the current price because of potential demand growing at 2-3% per year this would have to be reversed back to below say 2000 levels and with a much larger China/India economy to get prices back around 30 a barrel or so.
In 1998/1999 global economic activity did not drop at all, but oil prices plunged. I don't see why the same thing wouldn't happen again, at least over the short term.
The global economy is growing at somewhere around 4.5% per year. If that growth dropped to even 2%, I would think the oil price would drop by a lot. If global economic activity actually slowed by 10%, which I am not sure has ever happened, I suspect oil would fall to below half of today's prices.
The situation was called a "glut", followed by falling production..
Correct. And if demand falls again, it will be called a glut as well.
Well, I *don't* believe Peak Oil is driving the collapse.
The collapse is financial and exists in and of itself and will have its own ruinous logic. China basically has a bubble economy predicated on exporting crap to the US. And the US has an economy predicated on ... well, bullshitting people. When the bullshit economy comes down, so does the 'selling crap to bullshitters' economy which is much of the PRC.
The Europeans and the Japanese will survive, because they actually have economies built upon making useful stuff. Yeah okay, they may not be able to *sell it* overseas, but at least they have talent they can mobilize for upcoming economic challenges.
The US (and the rest of the Anglo world) has bullshitters: China has low-productivity cheap labour good for cranking out goods made with other people's capital goods.
Take the US and China out of the equation and the price of oil will go down.
I don't believe it is either. But I do believe that it was the trigger to the financial crisis that is sweeping the US. The entire edifice of halucinated nominal wealth "created" in the last 50 years is predicated on a future in which humanity keeps finding new ways to grow our consumption of resources. The apparent halt to oil supply growth from May 2005 onwards has forced up the price on the one commodity that everything else relies on - oil.
It is no accident that the USA is the first country hit by the econmic fallout of this. It was the country most primed to implode once oil prices rose beyond the safety level, whatever that was. There were dire warnings about oil getting over $50 per barrel in 2005 which were casually dismissed at the time. When $50 came and went and the sky didn't fall in, the cynics and mockers said "Look, nothing happened. We are invincible and can soak up any oil price that comes". What it did do however was set in chain a strain, however mild, on household budgets in a country where your means of income and your dwelling place were exclusively linked by your car. There is no choice. You either drive your car to work or you don't eat and you don't live in your house anymore.
In a country where nobody saved anything, this strain was propped up with the still easy to access credit. I've done this myself, whack it on the plastic and keep driving. Refinance the house, the car, consolidate all your debts etc. The whole country was doing it, even the government. Want a big war - sure no problems Visa or Amex?
What we are seeing today in the financial markets might just be the natural fallout from $50 oil after Katrina and $75 oil in 2006 when the Israelis and Hezbollah went toe to toe. The price today of $110 will have further ramifications but they will show up somewhat delayed as they have to work their way through the system, to smack Joe Sixpack around first before he can start taking swings at his credit providers.
America for too long has been booking everything up on credit, especially the oil to which they are addicted. That particular drug must now be paid for in cash rather than credit and this ultimately filters down all the way to the pump. Credit has been extended by the rest of the world becasue there was a belief that Americans would work hard, produce more magic inventions, produce more food, and generally be a beacon of democracy and free markets. The free markets worked pretty well, everything that could be sold was and everything that couldn't be sold was mortgaged. All the Anglo countries did this but America as always just had to do it better than everyone else.
When Joe Sixpack runs out of credit, he runs out of options to keep driving/working/paying bills and consuming. It really won't matter what the price of gas or anything else is then, Joe won't be able to afford it and when enough Joes and Janes get together and stop consuming casue theyv'e run out of credit, that will be a little more than a financial crisis. It will then be a full blown economic shitstorm.
Take 1.6 billion people out of the equation and demand for oil will drop.
Stuart, I think we're being a little US-centric to take the nominal price in dollars.
Tierney didn't say US dollars: he said value of commodity compared to wages. I would take adjust the dollar price by a weighted trade index. Similarly, I would take a world-wide measure of wages, which is probably rising a bit faster than the US, given the relative GDP growth rates.
More importantly, Julian Simon would probably have recommended a much longer timeframe for the bet: eventually the price of oil will crash, as it's much higher than the cost of substitutes (EV's).
Why would the price of oil crash ?
It its higher than EV then it would at best drop to parity assuming EV's had enough market share.
That would be say 75%-80% replacement of oil based transportation considering this could take 60 years not sure EV's are even relevant.
Consider that the automobile was invented early in the 1900's and horses and trains where still a big part of transport till after the end of WWII I can't see gasoline power going away any time soon based on your argument.
However I can see personal transport becoming a luxury for the upper middle class to wealthy well before this.
"Why would the price of oil crash ? It its higher than EV then it would at best drop to parity assuming EV's had enough market share."
EV's are just the main example. Electrification can replace oil for all uses except relatively minor long-distance transportation uses.
Electricity from renewable sources currently costs less than the equivalent of $60/barrel. In 15 years it will be $40. I think that falling back to $40 will be considered a crash.
"That would be say 75%-80% replacement of oil based transportation considering this could take 60 years not sure EV's are even relevant. "
In a $100+ per barrel environment it won't take 60 years.
"Consider that the automobile was invented early in the 1900's and horses and trains where still a big part of transport till after the end of WWII I can't see gasoline power going away any time soon based on your argument."
There was a lot less urgency to the change, and the tech was new. Consider that the EV was invented late in the 1800's, and just needs to be ramped up.
Large scale commercial PHEV's will be here in 2-3 years, and could be 50% of the new light vehicle market in 10, and 50% of the existing fleet in 15.
If we really, really, had to, we could always go back to steam cars using hot sloth grease or equivalent to heat the steam.
http://en.wikipedia.org/wiki/Stanley_Steamer
Powering things with fat makes me think of Fight Club.
You're assuming we'd have enough grease or whatever for fuel. Hint, that won't scale.