Is Oil In a Price Bubble?
Posted by Stuart Staniford on June 23, 2006 - 9:20am
There is a speculative bubble going on in the oil markets. Financial institutions (optionally aided by too much money supply from the Fed) are pumping money into the oil futures market and jacking up prices. This is depressing demand and meaning that suppliers have to leave oil in the ground because there's no customers for it, even though prices are very high.
I've been hearing this argument with increasing frequency - it seems to be particularly beloved by OPEC ministers and oil company executives that don't want to acknowledge peak oil, but also don't want to be blamed for high oil prices. One variant of it is articulated clearly over at A greek speculator's journal. Aspects of it have also been discussed by James Hamilton here in Contango, speculation, and the price of oil, in commenting on strange remarks by Al-Naimi, and then in the last few days in a debate in comments here.
The core issue with this storyline is well put by Professor Hamilton:
I do not share the view that speculation should be thought of as a separate force from supply and demand contributing to the price of oil. An investment fund that today buys a September 2006 futures contract for $75 ($3 above the current spot price of $72) will only make a profit if the spot price of oil in September turns out to be above $75 a barrel. If such speculators prove to be correct and the spot price does rise from its current $72 to, say, $80 a barrel by September, that price hike would be a further factor depressing September demand and potentially increasing September supply. Why would the September spot price be even higher than the current spot price, if users of oil in September will be buying less oil than they are now? According to the speculation theory, we'd have to see even more investment dollars flowing into the market in September than we are currently, causing an even bigger addition to stockpiles (that is, the rate at which oil is added to storage must itself go up at an ever-increasing rate) in order to compensate for the lost demand that $80 oil would choke off as well as to justify an even higher price than at present. And that additional money, in turn, would supposedly be going into February 2007 contracts for $83 oil, in hopes that the February 2007 spot price would be even higher, say $85. All this only makes sense if one believes that investment funds will continue to pour ever-increasing sums into oil futures and an ever-increasing volume of oil gets added to inventory each month. Since the total investment funds and physical facilities for storage are inherently finite, someone in this chain is going to find that they have irrationally thrown their money away. I would argue that this someone is in fact the joker at square 1 who thought you could make money with a September 2006 futures contract betting against the fundamentals.I agree with almost all of this (in general my views on peak oil are quite similar to Professor Hamilton's). However, one area in which I differ is that I do believe in bubbles in general, and in particular I believe that a bubble in oil market prices is a logical possibility, and it is an empirical question to decide whether or not it is happening.To me, a much more natural way to try to interpret this phenomenon is that the investment funds are betting not on a bigger fool to bail them out in September, but rather are trying to evaluate the September fundamentals for supply and demand. First, let's look at the upside. There is currently very little spare capacity in global oil production, meaning that a supply disruption of just a few million barrels a day could easily result in a pretty impressive spike up in the spot price of oil in September. Where might such a supply disruption come from? Oh, maybe Nigeria, or Iran, or Iraq, or Saudi Arabia, or Venezuela, or Russia, to name a few. Even if the probability of such an event is low, the large payoff if it occurs could give an attractive expected rate of return-- play such a gamble over a long enough time period, and you could make out quite well, even if everything remains calm over this particular coming six months.
Professor Hamilton is a neoclassical economist, with a strong commitment to the idea that humans always behave rationally. That leads to the efficient markets hypothesis - the idea that markets will immediately incorporate all useful information about future events, and therefore prices will appear to move randomly (because if future market movements were predictable, people would trade on those predictions to make money and thus cause the anticipated movement to happen immediately rather than on the anticipated future schedule). I have noticed that Prof Hamilton, like other neoclassical economists, is quite resistant to calling anything a bubble.
I view the efficient market hypothesis as a frequently useful approximation because it certainly is the case that most financial market participants are very interested in enriching themselves, highly driven and motivated in this pursuit, and capable of at least some degree of rational analysis.
(As an aside, I should stress that I do not think that humanity generally is primarily driven by self-interest, but the more altruistic members of the species become social workers, nurses, and environmental activists, people driven by intellectual curiousity become professors, and so on, while the people extremely anxious to make a financial killing become investment bankers and hedge fund managers and it is the latter subspecies who's nature mainly shows up in financial markets. From this standpoint, the neoclassical economics professor, who spends his (or her) life studying and justifying the rational selfish behavior of financial market participants while himself forgoing most of the opportunity to engage in this kind of accumulation in order to educate the young and write scholarly papers, makes an interesting paradox.)
However, it is also the case that humans are a highly social species. Psychologists and neuroscientists have shown pretty persuasively that our emotions profoundly color our judgements (indeed emotions are critical to the process of forming a judgement - people with brain lesions that interfere with their emotional machinery are unable to perform the simplest everyday tasks because they cannot prioritize). (See, for example, Antonia Damasio's fascinating book Descartes Error). Furthermore, our emotions and judgements are infectious - we influence the people we talk to to share both our moods and our opinions. Thus human judgements (eg about market prices) are the result of a collective social/emotional process which can undergo large scale self-organizing phenomena.
This means that it is possible for booms and busts to occur as a kind of occasional outlying anomaly in the normally more-or-less efficient operation of the market. A wonderfully concise and jaundiced view of the phenomenon is the late J.K. Galbraith's book A Short History of Financial Euphoria. Galbraith's introductory description of a bubble will serve admirably here:
The more obvious features of the speculative episode are manifestly clear to anyone open to understanding. Some artifact or some development, seemingly new and desirable -- tulips in Holland, gold in Louisiana, real estate in Florida, the superb economic designs of Ronald Reagan -- captures the financial mind or perhaps, more accurately, what so passes. The price of the object of speculation goes up. Securities, land, objets d'art, and other property, when bought today, are worth more tomorrow. This increase and the prospect attract new buyers; the new buyers assure a further increase. Yet more are attracted; yet more buy; the increase continues. The speculation building on itself provides its own momentum.Ok. So in my mind it's very clear that this kind of dynamic could get established in the oil markets as a result of peak oil. The question is, has it yet? Are we, at the moment, in Professor Hamilton's efficient oil market world where speculators are rationally profiting from correctly anticipating constrictions in oil supply and the robustness of demand? Or have we made the irrevocable crossing into the delirious territory of irrational exuberance, where money can only be made as long as there are enough greater fools still wishing to rush across the river after us?This process once it is recognized, is clearly evident, and especially so after the fact. So also, if more subjectively, are the basic attitudes of the participants. These take two forms. There are those who are persuaded that some new price-enhancing circumstance is in control, and they expect the market to stay up and go up, perhaps indefinitely. It is adjusting to a new situation, a new world of greatly, even infinitely increasing returns and resulting values. Then there are those, superficially more astute and generally fewer in number, who perceive or believe themselves to perceive the speculative mood of the moment. They are in to ride the upward wave; their particular genius, they are convinced, will allow them to get out before the speculation runs its course. They will get the maximum reward from the increase as it continues; they will be out before the eventual fall.
For built into this situation is the eventual and inevitable fall. Built in also is the circumstance that it cannot come gently or gradually. When it comes, it bears the grim face of disaster. That is because both of the groups of participans in the speculative situation are programmed for sudden efforts at escape. Something, it matter little what -- although it will always be much debated -- triggers the ultimate reversal. Those who had been riding the upward wave decide now is the time to get out. Those who thought the increase would be forever find their illusion destroyed abruptly, and they, also, respond to the newly revealed reality by selling or trying to sell. Thus the collapse. And thus the rule, supported by the experience of centuries: the speculative episode always ends not with a whimper but with a bang. Here will be occcasion to see this rule frequently repeated.
So much, as I've said, is clear. Less understood is the mass psychology of the speculative mood. When it is fully comprehended, it allows those so favored to save themselves from disaster. Given the pressure of this crowd psychology, however, the saved will be the exception to a very broad and binding rule. They will be required to resist two compelling forces: one, the powerful personal interest the develops in the euphoric belief, and the other, the pressure of public and seemingly superior financial opinion that is brought to bear on behalf of such belief. Both stand as proof of Schiller's dictum that the crowd converts the individual from reasonably good sense to the stupidity against which, as he also said, "the very Gods Themselves contend in vain."
Although only a few observers have noted the vested interest in error that accompanies speculative euphoria, it is, nonetheless, an extremely plausible phenomenon. Those involved with the speculation are experiencing an increase in wealth--getting rich or being further enriched. No one wishes to believe that this is fortuitous or undeserved; all wish to think that it is the result of their own superior insight or intuition. The very increase in values thus captures the thoughts and minds of those being rewarded. Speculation buys up, in a very practical way, the intelligence of those involved.
As best I can judge, we have not yet crossed into irrational territory. (Though I think this is something we should stay constantly on our guard about - it could easily happen in the future). I will make two arguments. The first is based on Professor Hamilton's observation that excessive irrational speculation in oil futures would have to end up showing up in oil inventories. Are oil inventories excessive?
The EIA keeps publishing graphs like this one:


We can see that there has been some increase in inventories during the recent price run-up (which started at the bottom on Nov 15th 2001), but it doesn't seem too enormous given the excess geopolitical risks that the market is now facing).
In fact, looked at another way, there is really no increase at all. We would expect the amount of stocks oil consumers hold to grow over time because the amount of oil being used is growing over time. Thus to maintain the same number of days supply (to provide a fixed level of security against logistical or geopolitical disruptions), the physical amount of oil in stocks must grow over the years. And if we look at the number of days supply, there has been no significant trend of increasing stocks at all:
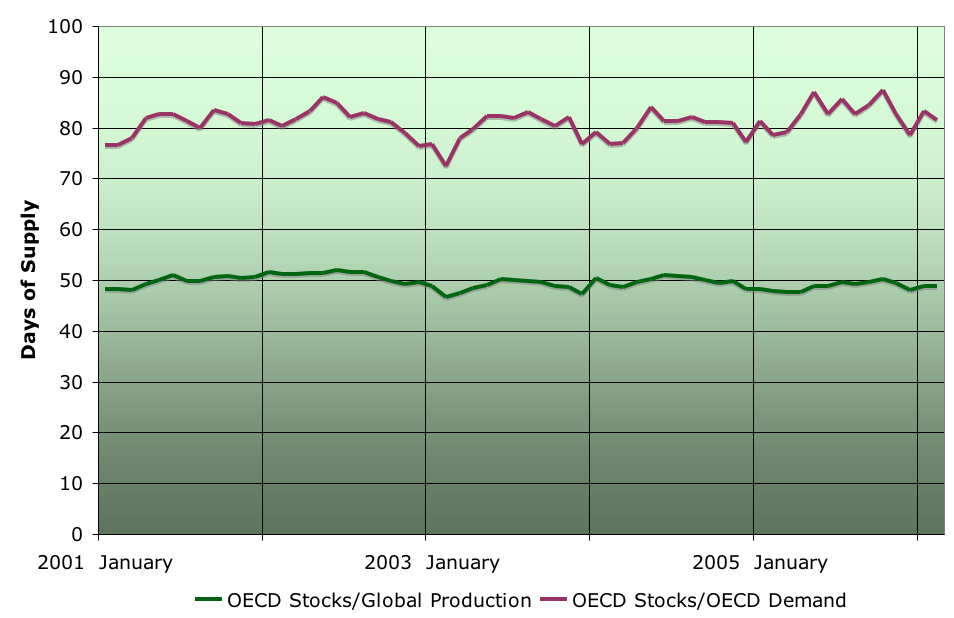
I did it two ways. One (the upper, plum, curve) was to divide OECD stocks by OECD oil consumption (on the view that the stocks are essentially inventory for those country's consumption). The other is to divide OECD stocks by global production (on the theory that the OECD -- especially via IEA mechanisms -- is holding stocks with a view to stabilizing the entire global oil market). That gives the lower, green, curve. Either way, the curves have no real trend and current values are not abnormal relative to the entire history of the price run-up. If there was an irrational bubble, we might expect these curves to be trending upwards, probably at an increasing rate.
Another possibility is that speculators are not holding claims against oil in the storage system that the EIA tracks, but instead are holding the oil in their own facilities which are not counted as stocks, thus meaning the stocks are under-reported. There are news reports of investment banks buying warehouses to put oil in. However, while this is clearly happening on some scale, this cannot be any part of the explanation for the production plateau - such oil if it is not counted as stocks must be being counted as sales to final customers, and therefore is adding to demand for physical oil (not depressing it). The hedge fund warehouse is directly in competition with the consumer gas-tank for the (non-increasing) amount of oil the producers are able to ship.
My second argument against the idea that there is an oil market bubble at present derives from the work of Didier Sornette and his collaborators. Sornette comes from a background in physics studying sudden ruptures in materials, but has increasingly applied physical techniques of statistical mechanics to financial markets, in particular to bubbles and crashes (a crash in a market being somewhat analagous to a sudden rupture in a strained physical material).
Long ago, I knew quite a lot of statistical mechanics so I have been able to understand some of Sornette's papers, and book Why Stock Markets Crash: Critical Events in Complex Financial Systems, which I highly recommend. However, in the interests of keeping an already long post from getting too much longer, I am going to leave a fuller treatment to some future occasion.
At the moment I will just observe that one of the signatures Sornette has identified of a bubble in the making is that the rate of growth in the price of the asset is growing faster than exponential. This happens roughly because the positive feedback process inherent in the bubble draws in more and more buyers and causes prices to go up faster and faster. If we plot the log of price against time, a non-bubbly exponential price rise will be a straight line. However, a bubbly situation will lead to a log-price line that is curving up.
Let me illustrate with some examples from a paper Is There a Real-Estate Bubble in the US? which Zhou and Sornette wrote last year which predicted that the US housing bubble would end around now (largely successfully, I would say - they also earlier successfully identified the end of the UK housing bubble). The paper identifies some states with markets that were not bubbly:
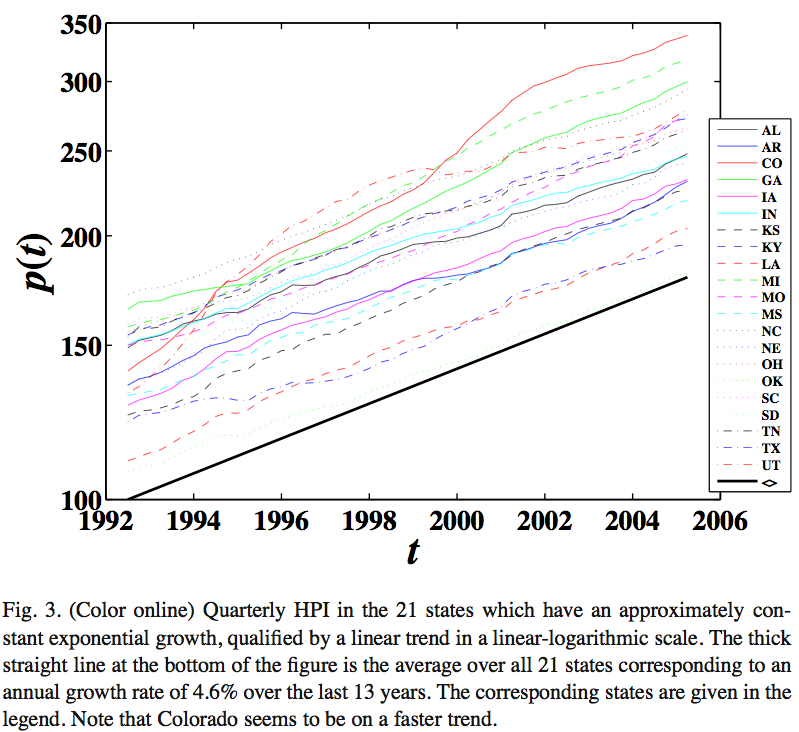
As you can see, these states have straight line growth in their log-prices. These states are largely those that Paul Krugman memorably described as Flatland:
In Flatland, which occupies the middle of the country, it's easy to build houses. When the demand for houses rises, Flatland metropolitan areas, which don't really have traditional downtowns, just sprawl some more. As a result, housing prices are basically determined by the cost of construction. In Flatland, a housing bubble can't even get started.Other states, however, Zhou and Sornette identified as bubbly because the log-price graph curves upwards:
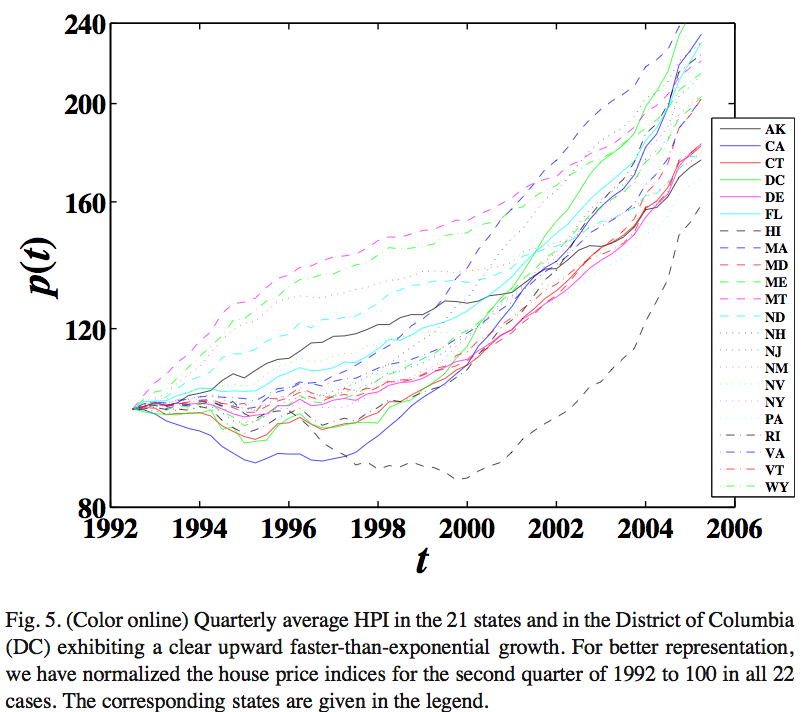
These states correspond roughly to what Krugman called "The Zoned Zone":
But in the Zoned Zone, which lies along the coasts, a combination of high population density and land-use restrictions -- hence ''zoned'' -- makes it hard to build new houses. So when people become willing to spend more on houses, say because of a fall in mortgage rates, some houses get built, but the prices of existing houses also go up. And if people think that prices will continue to rise, they become willing to spend even more, driving prices still higher, and so on. In other words, the Zoned Zone is prone to housing bubbles.So it would seem, according to Sornette's methodology.
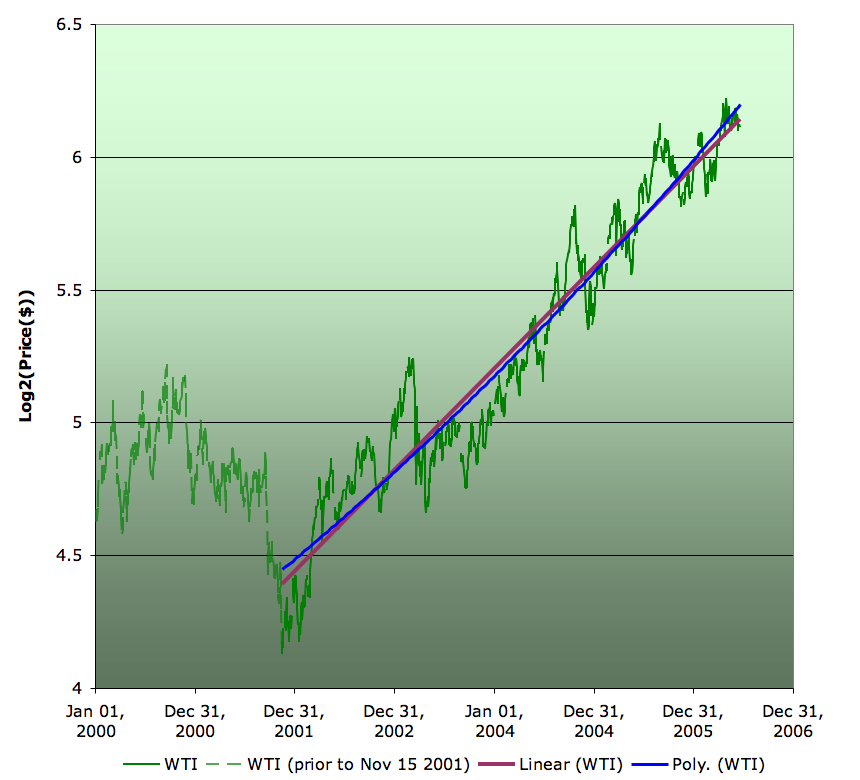
Anyway, looked at with that lens, how does oil look? Here's a quick and dirty way to assess it:
The graph above shows the log spot price of WTI from Jan 2000 to June 20th of this year. (I used log base 2 because I find it a little easier to figure out what the numbers mean than natural logs, and logs base 10 don't have any useful dividers between $10 and $100) I have taken the start of the price rise as November 15th 2001 which is when prices bottomed out after the tech crash and the events of 9/11. To that price rise I fit both a linear trend, and a quadratic. To the extent the price was curving up in a bubblicious manner, we would expect the quadratic to depart markedly from the straight line. It elects not to do so - the two are very close. Thus we see that although there is considerable volatility in the price (and the pattern of that is worth further analysis in the future) the price rise is very much exponential in nature. So I take this as further evidence that we do not have a self-reinforcing bubble.
At least not yet.
Contact
- Content: editors at theoildrum dot com
- Tech support: support at theoildrum dot com
License

This work is licensed under a Creative Commons Attribution-Share Alike 3.0 United States License.
Two comments. On Professor Hamilton's website Econobrowser, there is a 30 minute video of a speech he gave at the American Enterprise Institute. In it he goes into detail about price I highly recommend it.
Second, Bloomberg reported yesterday that oil inventories in the US were the highest since 1998. This seemed significant to me and seemed to be evidence that in the short run at least Robert Rapier's analysis(and my own, and to a certain extent that of the Saudis) in regard to what is going on is correct.
Take Nigeria and Iran out of the equation(but leave Iraq in) and you have $50 oil tomorrow - a price entirely consistent with an overall higher production cost due to a smaller portion of LSC in the mix and the higher level of demand from developing nations in the last 5 years.
It seems to be inconclusive. It would have to be conclusively lower and trending that way to be viewed as evidence that there was a problem or that the current supply, demand, and price were proof of "Peak Oil Now."
As these inventories themselves are trending higher, then there is the distinct possibility that with stalled demand, number-of-days-inventories will rise. We will have to see.
Given my confusion at your conclusion, can you clarify then? Or did I read you correctly?
If you look Stuart's original post here you will see that at the very top he references a TOD thread from about a week ago in which there is an alternate explanation of a plateau. Stuart quotes somebody, I'm not sure who, but also contained in that thread is a hypothetical devil's-advocate question that I posed. There was some lengthy discussion that followed and I believe you read it all since you posted towards the end of it.
There has also been much debate here between Westexas and Robert Rapier regarding related issues.
For me it all boils down to this: Does the current situation with supply, demand, and price point to or verify the existence of "Peak Oil Now?"
If you look at the graphs that Stuart and I have done, you will see that there were two plateaus previous to this one in the last decade. Much of the debate surrounds what is different in this plateau that makes this one the peak, where the other two were not.
My view is simple - I don't know. And I don't think I'll know until I'm looking back.
The opposite point of view(expressed in this debate/discussion) is that we can in fact see the differences and they clearly mean this plateau is the peak.
What may be true, but a position I choose not to defend is that what we see is proof of this current plateaunot being a peak. This may be part of the confusion.
Others are arguing that this is the peak, I am simply arguing that we can't be so sure. I see any inconclusiveness as conclusiveness that we can't be sure :)
One thing I do know, is that if oil ever falls to $55, Saudi Arabia pumps so much as a single barrel more than they are now, Cantarell's production doesn't decline by more than 5% in the next year, or we hit 86 million barrels per day - then there are going to be a bunch of people here who are going to have to seriously re-think things.
I tend to agree with Stuart's position - we can't be sure but there is an interesting body of evidence suggesting that we are at or very near peak. And ultimately, you (and others who have said the same) are right on this issue - we'll really only know for sure in hindsight.
The Saudis have admitted to a 5% decline since December, so a mild increase in their reported production, especially given their large stockpiles, would not be totally unexpected; however, Ghawar, the largest producing oil field in the world (found 68 years ago), has produced more than 90% of its 1970's estimated URR.
Cantarell, the second largest producing oil field in the world, has a remaining oil column of about 825', which is thinning at the rate of about 300' per year. The longer they keep production at relatively high levels (with horizontal wells), the sharper the final decline will be. This is simple physics, which is the same problem that Ghawar has (we have seen what happens when water hits horizontal wells, in the Yibal Field).
Daqing and Burgan are also declining.
What amazes me is that anyone has doubts about our proximity to Peak Oil given the fact that the four largest oil fields in the world are almost certainly declining.
I'll be the first to tell you if you're predictions turn out correct. But for me "almost certainly" doesn't cut it. It has to be "are declining" with numbers to prove it.
Robert has used the line recently,"What is it going to take to convince you..." Well, I will tell you what it will take to convince me. Year-to-year drops in global conventional crude production of greater than 2% for twelve consecutive months(or something roughly equivalent).
If Cantarrell has a catasrophic collapse, you take the cake.
For myself, I don't see THE PEAK as a month, a day or even a year. I see it as more of a process as described by getting on a plateau which shows monthly and yearly fluctuations within certain limits until permanent decline sets in. This plateau could last 3 to 5 years - I don't know. If the current plateau is the "peak plateau" then we rounded the shoulder around the end of 2004. If we get bumps up to perhaps 86 mbpd but not consistently exceeding that before decline sets in, I will consider us to have been "within" the peak at this time. To consider us not at the peak, I would want to see sustained production for a year or more exceeding 86 mbpd.
If we are in the peak at present, it could go on another 2-3 years before the consistent drop you are referring to, so likely both of our criteria will remain unanswered for at least 3 more years even if we are peaking now - which is fine.
I think we can't make too much of short-term fluctuations in either direction, but society needs to be preparing now either way.
I would suggest that this indicates that the 1970s estimates were too low. What is the typical production of a field relative to its peak production when 90% exhausted and what is the production of Ghawar now relative to its peak production numbers from the 1980s?
While we cannot rule out the possibility of a sudden, severe collapse, I believe it cannot be taken as a given either.
The vertical wells in Ghawar started watering out long ago, so the Saudis responded by drilling high tech horizontal wells into a thinning oil column. This has the effect of prolonging the period of high production, but it probably does not increase ultimate production.
When the water does hit the horizontal wells, the resulting production collapse can be dramatic, e.g., the Yibal Field.
I can't think of any other producing region that has been quite so dependent on one field complex. It is not "if," but "when" the oil production in this 68 year old oil field, accounting for about half of Saudi production, starts rapidly declining. It may be happening right now.
(2) Speaking of someone else doing the heavy lifting. Bradshaw, acting on a suggestion I made, posted a graph showing Saudi oil production and oil prices. The most recent oil price increase of 15% to 25%, since December, coincided with the recent reported decline in Saudi oil production.
We have seen panic selling in the Saudi stock market and panic drilling in Saudi Arabia as they reported a "voluntary" 5% decrease in production. Saudi Arabia is incredibly vulnerable to a decline in Ghawar's production, which has already produced about 90% of Aramco's 1970's era estimated reserves.
Mathematically, Saudi Arabia, based on the HL method, is at the same point at which Texas started its so far terminal decline in production.
So, perhaps the simplest explanation is the best?
The Saudis are claiming an ability to boost their total production by 25% or more. Oil prices are at around $70 for years out, which would suggest very strong cash flows in the years ahead.
The HL method says that Saudi Arabia is at the same point at which the prior swing producer, Texas, started declining, and the Saudis have admitted to a 5% production decline since December.
So, what have Saudi insiders been doing regarding their own stock market? They have been selling. As they say, "Actions speak louder than words."
The other problem is the Export Land model. With rapidly increasing domestic consumption and falling production, it may be a challenge to keep the cash flow up, even with higher prices, as net exports fall sharply. A restless large population of resentful young people, combined with declining oil production does not suggest a stable future ahead for Saudi Arabia, which would be a strong reason for selling Saudi stocks.
It is not in the interest of either opec members or oil ceo's for news of limits to get out... the former could easily loes their grip, and maybe their heads, while the latter could face windfall profits taxes, lower earnings and options.
Dimitris Hatzopoulos' blog is excellent.
But isn't he overstating the role of WTI as a price setter? Is the benchmark WTI rare really used to price other oils? and 60%?
Given that the spreads between WTI and heavier (and average) crudes has grown, perhaps reliance on WTI as the benchmark overstates oil price increases. It is true that when we say oil is selling for $70 a barrel we may really mean "the most expensive 1% of all oil sold is selling for $70 a barrel".
Has anyone tracked median oil prices over the last thrity years or so? It would be interesting to see.
I'm guessing the other oils are priced at some type of a premium/discount to the benchmarks using their API/sulfur-content ratings. So we have a market, just not as an efficient one as we might like.
It would be great if more of his site were in English. Perhaps this is selfish. It's all Greek to me.
I find his argument and logic coming to this point to be quite convincing. He quotes the Saudis at length, in context, and juxtaposed with the real-world history of price in such a way that is not often seen on this site.
So explain to me again how all this stuff is so expensive if nobody wants it? Why wouldn't the sellers of it lower their prices to sell more of it?
The truth is, if we're going into a financial collapse, gas may not be all that expensive, but just like in the last Great Depression, people won't be able to afford much of it anyway.
In other words, what those graphs show is partially monetary inflation which does not necessarily show up equally in all goods, especially over the short periods of time.
Another matter is that many oil exporters are already piling up huge amounts of dollar reserves, ie they do not really want to spend more right now. Why ramp up production if you think that oil prices will not fall faster in the future than the value of dollar reserves that you would acquire in return for additional oil exports?
Oil is priced in dollars, although its value has more to do with the basket of currencies it is traded in. For this reason, as you note, if the dollar has fallen, because of increased supply or other reasons, the relative dollar price of oil would be higher than the relative price of oil in a stronger currency.
It would be more useful to follow the oil price against this basket of currencies than against the dollar. This would be recognizing the dollar price of oil is only a measurement, not a determinant of oil value.
However, this does not constitute a reason to leave oil in the ground. Oil producers are not forced to take dollars for oil, and if they were they could instantly trade those dollars on open markets at transparent prices for whatever they want - Euros, gold, capital equipment, etc. In order to leave oil in the ground, you would have to believe that the value of the dollar and everything you could buy with dollars today would fall faster than the price of oil.
True.
Saudi Arabia and Russia for example are already adding to their reserves about $100 billion per year. They could already spend that on more "stuff", but they do not. Why buy treasury bills yielding a nominal 5% when currency appreciation and dollar inflation are likely add up to more.
It's not a good investment decision. China does it to expand its industrial base, get technology transfer and employ millions of people, but Saudi Arabia for example can't even put all those dollars it is receiving now to good use.
Buying gold or capital equipment in exchange for oil only makes sense if you have an economy that can readily take advantage of the latter or if you believe that gold will become much more valuable relative to oil in the future.
See http://www.rgemonitor.com/blog/setser/131126/
If future price falls by a dollar - each short position gains $1000, while long position loses $1000. Actully there might be bubble forming on falling prices, in this case all short positions get accumulated values on expense of long positions.
Bubble would be possible if future market traded physical inventory. In this case with growing price total value of the rights ( positions ) for inventory would go up and may form bubble. But this is not correct for future market. Half positions are short and short positions are loosing money when price of oil growing.
Stock market works differently, total value of portfolios grows with rising price, this is the key element allowing formation of the bubble. Futures market is different.
I feel article explaining future market would very useful.
When you are out of the market, you are out of the market. It is just not correct to include those who have left the market entirely in your scenario. Only those who are actively in the marked must be considered.
Oil storage is simply not worth even mentioning. The mighty US SPR holds about a month of US demand, commercial inventories are far smaller, and China doesn't even have an SPR yet. Basically the life of oil from well to refinery to consumption is very brief, a few weeks, and it is gone forever. The ability for speculators like myself to manipulate the market is quite limited. We can "take delivery" of a contract, pay full contract value, and then pay to have the oil stored in a tank farm for a little while, but the storage costs of keeping the oil off the market are high.
The proof of this is the great liquidity contraction from May 11 through June 13th. Many traders were forced to sell positions to cover margin calls. Gold fell by about 25% in a month, silver fell even more, but oil hardly moved, a 7% drop that was most likely due to seasonal factors. In fact, technically oil has been in a pattern known as "consolidation" for the last ten months, the opposite of a bubble. So the good news is that hedge funds and keyboard pirates are not significantly inflating the oil price. The bad news is that after resting for nearly a year, the oil bull market is due to resume shortly, as growing summer demand again pushes up against a net supply of refinable exported oil that has plateaued at best. Enjoy the cheap petrol while it lasts, and it is still very cheap, especially in US.
How exactly does one define "technically"? I'm assuming this is in terms of numbers and lines on a graph. Maybe not. Can you elaborate more on this? Why 10 months? What defines this period in relationship to those around it? Is there anyway you can demonstate with a chart? I agree that this bull market is set to resume, but I only feel that it has been resting for about 2 months.
let's walk thru it. first, change "size" to "landscape", then hit update and annotate. this will give you a short term, interactive chart. notice that by using the cursor you can draw trendlines connecting prices...draw one trendline connecting the apr24 and may12 tops continuing on to the end of the chart. draw another line connecting the apr13 and may22 bottoms, continuing on to the end of the chart... this would define the recent downtrending channel, i.e. price correction, since the beginning of april. so, to answer your question, yes , we have been in a corrective phase since april. now, lets look at the bigger picture. go back to the original chart and change parameters to a time period of 3 years 6 months,update and annotate... now draw a trendline using the cursor once again connecting the bottoms of oct03, dec04, and mar06, continuing on to the end of the chart. this defines the oil bull market to date... it is an extremely well behaved chart, always rallying and returning to the same trend line. this is another statement supporting the non-bubble hypthesis that stuart makes so well, above. as to where from here? well, price has still not returned to the bottoms-connected trendline or the 200 day moving average (red line) that it has in the past. so, there is still is possibility of weakness down to the $65 range. but, it doesn't always have to. this is an events driven market, and no one knows when those events will occur. as to micro hydro's remarks about a 10 month consolidation... price reached $70/bbl. ~ 10 months ago and has not apprciably advanced since then. i think that is what he is refering to. my interpretation is that the trendline is still moving up , and price is still following it quite nicely. i call that an uptrend.
http://www.resourceinvestor.com/pebble.asp?relid=20981
So the trading range $65-$75 relfects a true market value at this time. Oil also traded inside this range as far back as August 2005. Yes, oil was depresssed below the natural trading range in 4Q2005. But this was due to intervention by the OECD governments pumping out their SPRs, a rare market distortion. Absent this intervention, the market forces "wanted" a price in the $65 to $75 range since last August. Since the world automobile fleet grows around 1.7% per year, that would be a good apporoximation for "natural" demand increase if oil price was stable. As it is no longer possible for oil production growth to match demand growth, the price must rise.
I saw someone else make an interesting point. If you were to plot oil prices in Euro (i.e. factor out recent devaluation of the dollar), that the oil price effectively remains flat.
Thanks
Anyway, my question is whether OECD charts and data leave too much out by missing China?
On "The End of Certitudes" I skimmed this:
http://www.news.utoronto.ca/bin/bulletin/sept29_97/forum.htm
But it looked a little postmodern to me, not another "Sokal's Hoax" is it? ;-)
Seriously I think there are domains of high confidence (and not certainties) in the first place, and the best criticisms are directed at confidence placed in improper domains.
(certitude of doom? LOL)
As for prigogyne, no sokal's hoax indeed. He is a nobel prize winner in chemistry and has some personal ideas about entropy.
His basic idea is that there is no absolute determinism in physical systems (absolute determinism exists only in certain experimental settings). He arguments that if there were such a thing there would be no time flow.
His ideas are debated, as was heisenberg's principle of incertitude. I must say that his writings are rather powerful and have shattered a bit of my world view which until then was shaped by the philosophical axis of platon, spinoza and bergson.
I definitely recommend him because he sheds some new light on fundamental laws of physics and thermodynamics which are after all at the heart of our discussions here.
How is that? I would have thought that principles of quantum mechanics were related to oil in the same way as differential equations are related to accounting - that is to say, not in any practical way.
It's just an entirely different scale.
Note that the values are not in a log base.
Crude oil stocks levels (excluding SPR) in terms of number of days of consumption are above average:
However, refinery utilization is still below average (should be around 95%):
That could explained why crude is piling up in inventories. For whatever reason, refineries are not using as much crude as they could despite profitable margins. Importations for refined products are also above average:
I agree with that, volatility will probably increase with large price fluctuations (+/- $15) spreaded on 6-8 months that some may interpret as a sign of a speculative bubble deflation. Price volatitity may also harm the development of alternatives because of the difficulty to predict future prices.
Could it be for the same reason China cut back on their oil imports? The new, higher-sulfur crude takes more time to refine?
data src: BP Statistical Review of World Energy 2006
Re: "depressing demand and meaning that suppliers have to leave oil in the ground because there's no customers for it..."
What evidence do we have, exactly, that any supplier is "leaving oil in the ground" and not pumping flat out? Aside from the profound yet peculiar statements of this man.
Esteemed and Beloved
Why would the some of countries of the Middle East, including the one the gentleman above represents, be pouring money into refining capacity (where margins are much slimmer) if they percieved future depressed demand and a bubble in prices?
Also look at Is the oil market forming a bubble? by Mark Hulbert, editor of the Hulbert Financial Digest, a service of MarketWatch.com.
Not in a bubble.
This storage (25 hour's worth of world oil supply, but massive on the margin) could be used in a variety of ways. It could certainly mask their depletion for quite a while, or spike prices down or up.
Double click on the Y axis.
Click Scale.
Check the logrithmic scale box.
OK, so I had to add the 20-90 numbers as text boxes, but it took as long as it probably took for you to make a new column with the log of the price and this wouldn't always be necessary (depending on the spread of the numbers).
It doesn't seem like adding the trend lines to this graph would be a problem but I'm not sure exactly how you're getting them on there.
To expand on what I said above, what Hamilton is talking about is the risk premium on the price of oil. There are many kinds of geopolitical risks out there regarding oil supply, but in the case I'm going to cite, the concern is terrorism. The reference I'll cite is this testimony by John Dowd, Senior Research Analyst Sanford C. Bernstein & Co., LLC in July of 2005.
I believe this kind of geopolitical "risk premium" is now a permanent feature of our world. I do not believe that significant spare capacity will be developed ever again. Therefore, this changed (in the last 5 years or so) underlying fundamental for oil supply is now "priced in".As to some remarks above that if you take Nigeria and Iran out of the equation, the price would settle down in the $50 range, my response is simply this: That is a hypothetical case that does not and will not ever reflect the continuing geopolitical "risk premium" on oil. There will always be such geopolitical conditions somewhere or another. Note the other side of the argument. If the world could raise spare capacity easily enough, thus regarding Nigeria and Iran as temporary aggravations causing market tightness and a speculative bubble in oil prices, the real "risk premium" would be non-existent and therefore we could regard what has been happening with prices as a bubble that would burst when supply increased with respect to the quantity demanded. However, it is not possible now, nor will it ever be possible, to increase the spare capacity as envisioned in this scenario.
Is the extent of what I said. I wasn't talking about any geopolitical risk premium. That is something you are discussing. I agree with some of your points here, but I was thinking about something else entirely when I wrote that. Something along the lines of what has actually changed since $50 oil.
What you choose to call "a hypothetical case," is actually history - not too long ago, in fact. So, not really that hypothetical. If we look at a chart to find where oil was $50, we get Fall of 2004 through mid-2005. And in that roughly 8 or 10-month period oil actually fell as low as $42.
Similarity - War in Iraq with reduced Iraqi production.
Differences - Nigeria producing several hundreds of thousands of barrels per day more and Iran received scant, infrequent attention in the news.
Have other things changed in the year-and-a-half to two years since then regarding supply and demand and spare capacity? Only slightly.
I'm not sure what you mean by this scenario exactly, but this statement strikes me as rather hypothetical and, dare I say, speculative.
It is history that I am talking about. What makes current times different from the early 80's is that spare capacity can not be made available, not now and according to Hubbert Linearization theory and the data that I've seen (from Skrebowski, CERA, not the EIA or IEA), not in the future either.
When I consider the "hot spots" all over the world as briefly enumerated by Hamilton (quote above) and the geopolitical shift in power from consumers to producers--and given the lack of ability to create spare capacity, I can only conclude that we've reached a "tipping point" that started, I think, before the $50/barrel time you said, with the Al-Qaeda terrorism, the consolidation of Hugo's power in Venezuela, the shift in Russian oil & natural gas policy led by Putin (Yugos), et. al. As Kunstler is fond of pointing out, we are highly dependent on oil producers who do not like us very much.
Beyond this point of no return, with the US R/P ratio at about 4 years, with declines in Cantarell, etc. I see nothing amiss in current the oil prices. In fact, I think oil is undervalued and so do many financial analysts. As far as your remark about $42/barrel oil goes, this was the beginning of great volatility in oil prices. This will no doubt continue in the future but with an upward trend. Forever. If it's not Iran or Nigeria, it will be something else. The world has changed.
Further, even if you were not talking about geopolitical "risk premiums", I was, as you point out. My argument is that they have been priced in. You merely point to recent events. I just can't agree with you there.
best, Dave
The only scenario where that would not be true is if the production/distribution costs were more than $40/bbl, which I don't believe is the case.
Without the sunk cost, no one could afford oil at more than 40$ a barrel. With the sunk cost they can afford oil up to 200$ a barrel.
It's just that now they will no longer increase production of cars, houses, toys, cotton, or iron ore.
There should be a precise, succint way to say this. Suggestions?
I believe this is true, two years ago the rise in oil prices was blamed on strikes in Norway. I don' recall the markert being that sensitive to geopolitical and weather related events. Obviously, these are only symptoms of a tight spare capacity.
Oil CEO wrote:
That's the drama of our situation, we will recognize peak production only in our rear view mirror one or two years after. The data is so crappy and riddle with manipulation and secrecy that the resulting error margins on any prediction attempts will make them worthless. Another problem is that before production eventually peaks we will witness a production increase slow down probably for a few years. In that case, demand will have to slow down, dry out spare capacity and will be constrained by supply growth. It's probably what we are witnessing now.
Let's imagine that oil were not going to peak for over 20 years, but that somehow this date was known and anticipated. And suppose that the consensus was that the market price 20 years from now as we approach the peak was going to be $200/barrel.
Then it is reasonable that today we could see prices of around $70/barrel just from this effect. This would represent about a 5% per year price appreciation of oil. We could see oil today of $70 even if the market-clearing price, the price which would normally be set by supply and demand, was much lower - say, $25.
Now, if you know a little economics, this may not seem correct. If $70 is much higher than the market-clearing price, elementary economics says that this price will produce imbalances. Demand will be suppressed and supply will be enhanced. Specifically, suppliers will find oil so profitable at this high price that they will produce extra oil in order to benefit from these high prices. In the normal analysis this excess supply would then send prices back down.
However, this would not necessarily happen with a commodity like oil. Suppliers might forego the excess profits that would seem to be available, and instead limit production even though prices are high. The reason is because we stipulated that there was a market understanding that future oil prices were going to be even higher. Any oil sold today at $70 is oil that cannot be sold in the future at an even higher price, up to that $200 oil 20 years from now in this example. It is this promise of future profits that can motivate suppliers to limit production and give up profits today.
The resulting situation does bear some resemblance to what we see today - production limited, demand flattening, high prices, and suppliers claiming that they have the potential to produce even more but for some reason are not doing so. However there are some differences. One is that today, suppliers are not admitting that they refuse to increase production because they expect prices to be even higher in the future. It's not clear whether they are being honest about their motivations, though.
A bigger problem with this model is that oil futures markets do not predict increasing oil prices over the next several years. Instead they show prices rising over the next year to 18 months, then gradually falling back to today's level and even a little less. This is not in accordance with the standard Hotelling resource-depletion model and casts doubt on the principle that today's high prices might be due to a tacit understanding of a (potentially distant) future oil supply crunch.
Perhaps you could make a variant work where oil suppliers have private and secret information informing them of a future oil peak, which motivates them to limit production as I have described. This requires violating the efficient market hypothesis, that the rest of the world would somehow remain ignorant of this. But perhaps, given the increasing percentage of world oil resources that are held by secretive and authoritarian governments, something like this could be going on.
The problem is that all previous price spikes have been followed by price collapse--as supply increased and demand fell, not much of a surprise.
In a world transitioning to a post-Peak Oil environment, we would only see demand fall, as markets allocated oil to the highest bidders, or alternatively to whomever has the most nuclear weapons. Recents reports show that Saudi, Russian and world oil production are all down--as oil prices spiked 15% to 25%.
In regard to futures markets, I'm certainly no expert, but it seems to me that the longer term futures market represent a constantly shifting balance between users trying to hedge against price increases and producers trying to hedge against price declines.
The fundament problem that the "oil production will increase" crowd has is trying to explain how production can keep growing when the four largest producing oil fields in the world are almost certainly declining.
We don't know about Ghawar. The only thing we have to go on are what the Saudis claim and the educated guesses of their detractors. What was the real OOIP for Ghawar? What is the real URR for Ghawar?
All reports on Cantarell say it will decline shortly but so far hasn't. Daiqing has slowly declined from about 1.1 to .95 mmbpd. There have been reports that Burgan's engineers could not maintain 1.9 mmbpd and it has been scaled back to 1.7 mmbpd.
There are another 112 fields I'd like to discuss. Is anyone willing to share the numbers? Or do I have to do all the work myself?
Agreed that Burgan and Daqing are declining.
A recent WSJ article, based on internal Pemex reports, indicated that the oil column at Cantarell, now about 825', is thinning at the rate of about 300' per year. This is the second largest producing field in the world.
We know that the 68 year old Ghawar Field has produced more than 90% of its original 1970's estimated URR. We also know that Shell erroneously believed that they had increased the URR in the Yibal Field by using horizontal drilling--the same thing that the Saudis are doing at Ghawar.
Mexico's total production (including Canatrell) has more or less stayed on a plateau - so far - due to production from newer, but much smaller, fields.
Can you source this?
"Energy: Oil runs out for Mexico's biggest money-spinner
By Jeff Pruzan
Published: June 20 2006 16:16 | Last updated: June 20 2006 16:16
In Villahermosa, a sprawling, prosperous oil city just off Mexico's tropical Gulf coast, Pemex Exploración y Producción seems the embodiment of corporate progress.
Meanwhile, Mexico's estimated 15bn barrels in proved reserves are dwindling rapidly. Two years ago, Cantarell, Mexico's biggest oilfield - an offshore source discovered by a fisherman in 1976 - produced 2m barrels a day. This year Pemex forecasts a yield of 1.8m barrels a day, and in 2008 just 1.43m barrels a day. Non-Pemex sources worry it could actually be far less than that. The company continues to explore other offshore areas, but some experts doubt they will offer much oil, and perhaps none at all.
"
http://www.ft.com/cms/s/fa53ebb6-006e-11db-8078-0000779e2340.html
In Spanish (I don't want to translate because it may change meaning of what was said)
*Reforma (Mexico)
Copyright (c) 2006 InfoShare Communications Inc. All rights reserved.
June 20, 2006
David Shields / El fondo del barril
Colaborador Invitado
En medio de una creciente angustia en la region marina de Pemex Exploracion y Produccion (PEP) por la declinacion de Cantarell, un nuevo documento de planeacion brinda una sorprendente radiografia de las expectativas que se tienen de los principales proyectos y yacimientos de la industria petrolera nacional.
Esta planeacion plantea que las inversiones en la produccion de hidrocarburos en el lapso 2007-2009 se destinaran a cinco proyectos prioritarios. La region de Chicontepec recibira la mayor inversion, con 5,872 millones de dolares. En segundo lugar esta el proyecto Ku-Maloob-Zaap (KMZ), con 4,293 millones. Le sigue Cantarell, con 3,386 millones, la Cuenca de Burgos, con 2,583 millones, y el proyecto Crudo Marino Ligero, con 1,396 millones. Mientras tanto, PEP destinara 5,562 millones de dolares a la exploracion.
Como interpretar esta radiografia? En primer lugar, se observa que Cantarell, por primera vez, ya no la maxima prioridad de inversion de PEP, aunque sigue siendo el eje de la produccion petrolera del Pais y la reserva probada mas grande. Esto indica que, en opinion de PEP, la declinacion de este supergigante es tan inevitable que tiene poco sentido destinarle grandes inversiones.
En lo que va de este ano, la declinacion de Cantarell ha sido mas abrupta de lo esperado. Ya no hay esperanzas de alcanzar la meta de un promedio anual de 1,905,000 barriles diarios (b/d) que PEP fijo para este ano y crece la percepcion de que podria darse el peor de los escenarios previstos por especialistas de PEP en un estudio realizado a fines del ano pasado, en el que la produccion de Cantarell se colapsaria entre mediados del 2006 y el 2009.
Llama la atencion, tambien, el hecho de que KMZ y Crudo Marino Ligero -los otros proyectos prioritarios de la region marina- tampoco son la primera prioridad de inversion. No reciben inversiones comparables a las que antes se destinaban a Cantarell, porque su potencial es mucho menor. Si bien los incrementos de la produccion en estos proyectos compensaron la baja en Cantarell en el primer semestre, hay pocas expectativas de que esos proyectos tengan suficiente potencial para seguir compensando esa caida a partir de ahora. En el caso de Crudo Marino Ligero, la nueva planeacion proyecta solo 24 nuevos pozos de desarrollo en el lapso 2007-2009.
Otra sorpresa en la nueva planeacion de PEP es que no aparece el Complejo Bermudez, en Tabasco, entre las prioridades de inversion. Esto podria ser atribuible a que el campo Samaria y otros yacimientos de la zona se contaminaron con productos quimicos en el intento de reactivarlos. En todo caso, es evidente que en el sureste no hay proyectos de inversion capaces de compensar la caida esperada de Cantarell en el mediano plazo, ni siquiera en el escenario mas optimista.
*
Oil production remains at current levels.
The rise of inexpensive biofuels.
Electricity displacing FF liquids in transportation.
Reduced numbers and higher efficiency of vehicles...
No, nothing I can think of
http://www.grinzo.com/energy/blog_entry_archive/2006/06/2006x06x23_2.html
He says that suburban homes will be able to easily generate enough rooftop solar electricity to drive their electric cars, and argues that this will further drive the move to the suburbs and more single-family homes. The hook is the announcement by Nanosolar of their enormous new factory to manufacture thin-film solar cells (they come on rolls of solar-generating plastic!).
I was skeptical that the numbers would work but then I found this article, Solar PV is Cheaper than Gasoline:
http://www.evworld.com/view.cfm?section=article&storyid=856
This guy argues that just a parking spot sunshade covered with solar cells would generate enough electricity on a typical day for a 90 mile commute, using today's technology. And in fact even with current solar cell prices the cost of energy would be lower than gasoline (which he took as $2/gallon - gave me a nostalgic tear in the eye). Now, the economics don't quite work out yet because the batteries in electric cars are still too expensive. But progress is being made there too.
This ties into one of Lou's overall themes, which is that new technologies like nanotech are going to really change the energy equation. Nanosolar is one of the first examples. Obviously getting there is not going to be easy ("If I were you, I wouldn't start from here") and there will definitely be pain ahead. But in the long run it looks like we should be able to maintain an energy-intensive lifestyle even without fossil fuels.
What in the meantime are they/we going to do with the sunk value that's residing in all the cars and SUV's?
Not to mention 'consumption lag'. One of the reasons I doubt we'll be able to slow down before we get to $200. a barrel is the fuel mileage of the current fleet, the 600 million vehicles running today, and the wordwide trend tword personal vehicles. That's a lot of replacement needed.
Currently US drivers seem to be hanging with their investment longer.
http://www.greencarcongress.com/2006/02/us_vehicle_flee.html
Maybe their just waiting for that PV Boxfish to be availiable. Still that's gonna be quite a cultural shift don't you think?
These have to do with the batteries in EV's.
- They have a low power density
- They take a long time to recharge
- They have poor life
- They are made from all kinds of nasty materials
- They are expensive
Batteries are the only component holding the developement of these vehicles back. We really need better batteries or some alternative to batteries, the other components in an EV are a no brainer.The CEO of Altair Nano just testified before Congress and said, in effect, they're getting very close to that level of battery technology. (http://www.b2i.us/profiles/investor/ResLibraryView.asp?BzID=546&ResLibraryID=15885&Category= 856)
I keep harping on my site about the two technologies that will be world changers: Nanotech (batteries, lighter materials, enhanced oil recovery) and genetic engineering (celluslosic ethanol production). As soon as these super-duper lithium-ion batteries are a commercial reality, everything changes.
One minor point: In my post linked by Halfin above I didn't say that rooftop solar panels will completely supply EV's, as I haven't done the math yet on that. But they would surely provide a lot of the power--a Civic-sized vehicle gets about 4.5 miles/kWh. Even 2kW of panels sucking sunshine for only 4 hours a day (total of 8kWh) would fuel such an EV for 36 miles/day or 13,140 miles/year, which is just over the US average for miles/car-year.
Hmm. I guess I can say what Halfin said I said, after all--the numbers work, even with insanely conservative estimates and an on-the-fly estimate.
But on the larger point: This is why I keep saying that we're right on the cusp of mind-blowing social and economic change, and that firm predictions about what peak oil and peak NG will mean are worse than useless. No one knows precisely what the hell is coming, or the order in which breakthroughs will happen. And in some cases, the synergies--e.g. next-gen lithium-ion batteries + vastly cheaper solar panels--just compound the difficulty of making predictions
But I am sure of one thing--it sure as hell won't be dull.
"However, with PV it is not the rated capacity that tells the truth of the matter, but rather the output which can be expected from the installation. The output from a 100 MW of rated capacity, at a sunny site in Spain for example, would be about 14 MW".
http://www.mnforsustain.org/energy_photovoltaic_calc_output.htm
I live south of 30 latitude, yet our solar insolution is not that good due to diffusing "haze" from water vapor and clouds.
So take numbers on the PV package with an unhealthy dose of salt. Not all of us live about 11,000' (3,300 m) in Ecuador.
I agree that it would be useful to note capacity factors, but this is made more complex by the fact that solar provides peak power, which is much more valuable than night time power.
It is true that the solar peak doesn't fit the consumption peak perfectly, but keep in mind that until now there has been no reason for the consumption peak to be earlier, at solar noon. Look how successful utilities have been at shifting commercial power consumption to night time, to match the production profiles of coal and nuclear. And, that's been without residential metering, and with mostly only the crudest of time-of-day metering (a "demand charge" which measures only the day-time peak).
My understanding is that the 2005 federal energy act mandated implementation of residential time-of-day metering - anyone heard anything about that?
And solar may be under a few inches of snow (not in New Orleans :-)
Just being Devil's Advocate.
Winter is usually a good time for wind.
Well, the winter peak is much lower, and more manageable. We have to keep in mind the basic fact that there is a correlation between electrical consumption and solar because much of consumption is CAUSED by solar, esp A/C.
"And solar may be under a few inches of snow (not in New Orleans :-)"
Well, I think the inclines usually handle that (eventually I think BIPV will include vertical surfaces), but PV does have at least a little maintenance..
"Just being Devil's Advocate."
Yeah, I understand. You want a clear, objective picture of the pro's and con's. That's the best use of the blog & comment format....
One could buy a lot of even $4/gal gasoline with the same outlay.
I REALLY doubt this. The angle is no optimal (except for certain hours, glass reflects a % of incident light. "typical day" where ??
And the energy even on the best day, with the car parked in exactly the right location (no trees or buildings in the way, points in the optimum direction, etc.) will still not store enough for a 90 mile commute IMHO (remmeber battery loss as well).
I looked at a 2 watt solar panel to plug into my cigarette lighter to help recharge the battery (my car has parking lights that turn on just two LED lights on the street side, a little over 1 watt. This dramatically reduces side swipe accidents on out narrow streets). I decided that it would not charge enough to make a difference.
Maxium 5.71 Minimum 3.63 Average 4.92
Assume 10% conversion factor (small amount of dust and one bird dropping) but perfect orientation with no shading, etc.
0.571 kWh/meter2 best, 0.363 kWh/m2 minimum, 0.492 kWh/m2 average.
Look up your (large) city @
http://www.solar4power.com/solar-power-insolation-window.html
130 sq ft doesn't seem bad. The average residential roof space per person is very roughly 600 sq feet, in the US. You've got 3/4 of your roof left to power your house.
A bit more than the "windshield" example.
I have trees shading my roof as well. With many birds. And it is not orientated all that well for solar gain (actually orientated to minimize afternoon sun)
BTW, what is your source for 0.2 kWh/mile ? Is that a GEM ?
I'm assuming net-metering, not an off-the-grid application, so the average is ok, and you don't have to be home. In a well-planned situation, you'd have time-of-day metering, sell your power for $.20 during the day, and buy for $.03 to charge on during the night, in the long run from wind.
"A bit more than the "windshield" example."
uhhhh...huh? Maybe an "arooooh?" sound from Tim Allen on Home Improvement.
"I have trees shading my roof as well. With many birds. And it is not orientated all that well for solar gain (actually orientated to minimize afternoon sun)"
The best application of solar is new construction, where you can do building integrated PV and thermal, and have no additional installation costs. The next best is roof replacement.
Some people won't be setup for solar - some people will be exporters to their neighbors, and some importers. Many will retrofit, but some won't, and that's ok.
"BTW, what is your source for 0.2 kWh/mile ? Is that a GEM ? "
That's the best estimate I've been able to find for the Prius, including battery losses.
I've used the number for kwhrs per day from the site you used. Keep in mind that 10% is much lower than the best commercially available PV (Sunpower, at 20%), so it provides a lot of allowance for site, inefficiencies, etc.
A question then. Since the futures prices don't seem to reflect your current understanding of peak oil doesn't that mean that either a)it's not happening or b)the big investors don't see it yet or c)that they believe some other fuel will become viable?
(Like why wouldn't the big Saudi players who pulled out of that market go in for futures or did they?)
And yes, you are welcome to republish this elsewhere as long as you have attribution to me and the OIl Drum and a reasonably prominent link back to the original.
Not really. The price of oil in twenty years would affect the price now by inducing people to hold oil off the market to satisfy demand in twenty years.
However, this is the unexpected part.
All other methods of making liquid fuels demand high capital investments. Battery cars, Coal to Liquid, Desalination to cassava to butanol, all require huge capital investments that are even at 70$ a barrel not affordable (of someone would be making them).
So if real interest rates (interest rates for fed bills are at present negative, they are below inflation in real terms) were to climb to 7 percent, then in twenty years the 70$ you get from a barrel of oil today would have grown to 280$ in constant dollars.
=ACI have been thinking that the high oil prices are actually helping TPTB to CONTROL runaway inflation. The central banks of the world have pumped so much liquidity into the global economy that high energy prices act like a giant mop to mop up the purchasing power of the proles. The billions that have been sucked up by high energy prices prevent that money from going into consumer goods and driving up the demand curves thus keeping inflation under wraps. The real price increases we are seeing are in necessity items like food. If it wasn't for 70 dollar oil mopping up all the purchasing power we would have already seen hyper inflation taking control. Does this make sense to anyone? I think peak oil is several years away and see no reason why oil should be anywhere near $70 bucks. Money is being funneled into the sector to suck up excess liquidity.
=
========All liquids forecast
Oil demand is for all liquids. So the forecast of oil supply has to be given for all liquids The all liquids production forecast is modelled for an ultimate of 3 Tb with 1 Tb for NGL and expensive liquids, an unlikely 4 Tb ultimate (2 Tb for expensive oils) changes only the slope, but not the oil peak Liquids will peak around 2015 if there is no demand constraint, which is unlikely with soon coming economic crisis forecasted by P.Volcker. The production will then show a bumpy plateau, but well below the 115 Mb/d forecasted in 2030 by IEA.
http://tinyurl.com/k8thn PDF
Jean Laherrere has upped his peak date for total liquids. While we may see a peak in CONVENTIONAL oil soon the decline in conventional can be offset with increases in non conventional like deep water. TPTB are manipulation energy prices keeping them high to control inflation while they finish their "North American Community" project and get ready change the economic paradigm. In other words they are going to "change how money works" and they have time to pull it off. We are entering what Zbigniew Brzezinski termed the Technetronic Era, a post industrial zero growth society...
"In the technotronic society the trend would seem to be towards the aggregation of the individual support of millions of uncoordinated citizens, easily within the reach of magnetic and attractive personalities effectively exploiting the latest communications techniques to manipulate emotions and control reason."
--1970, Between Two Ages : America's Role in the Technetronic Era
I must say that I'm much more skeptical than you are about human beings being anything close to rational economic actors.
In fact, beyond that, I believe that humans are often non-conscious economic actors.
But crude oil is not in a bubble. Here is my brief explanation.
Since January 2004 the largest "NET LONG" position of large commericials and large speculators has been about 20,000 contracts.For those not familiar with this each contract represents 1000 barrels. That is 20 million barrels for months contract. For most of the time from 2004 till now the cumalative effect is a "NET SHORT" position. Get it SHORT. That should DEPRESS the price. There is no further argument needed whether speculators are responsible or not. COT data is available and can be verified. I am seriously going to hurt someone on CNBC if they continue this charade.
The prices are being kept high. They need the high prices to kill the purchasing power of the consumers. There has been way too much liquidity pumped into the system. Can you imagine the billions of dollars being sucked up by high energy prices going into consumer goods instead? The inflation in prices would be astronomical...
==AC
Here is a PDF document by Murray N. Rothbard.
The Mystery of Banking
http://www.mises.org/mysteryofbanking/mysteryofbanking.pdf
Go to page 14 and he explains how prices are set in an economy and why excess liquidity drives up demand curves thus inflating prices.
In a couple of years the money that Exxon has sucked up will be injected back into the economy as it takes it new profits and expands by hiring more people, building new offices etc. I'm sure by then oil will be $85-95 to tax the proles even harder.
Without the high prices I think we would be entering a phase of hyper-inflation. I could be completely off base here it is just my opinion...
==AC
==AC
I can't say I read your 177 page link in detail, but it doesn't seem to address the issue of whether there are fundamental differences between making a purchase at an Exxon station, versus making a purchase at Best Buy. Either way, a large company is taking my money for a good or service that I pay for.
Your reference does indicate that exporting dollars overseas may reduce inflation, but, again, I don't see the difference between purchasing a "made in China" television as opposed to say, purchaing a "made in Kuwait" gallon of gas.
A little bit more info on the COT data. The commercials have always been net short. The oil companies which seldom sell all their product on the spot market short the futures to lock in a price 1-2 months out. The investment banks cannot be seperated from the oil companies. but when the cumalative position goes long there is only one explanation that the investment banks are buying oil with both hands. However the largest commercial "net long" position was around november 05 ( 2nd or 3rd week)with a position of 70,000 long contracts. At that point however speculators were short 55,000 contracts. For a net position of 15,000 long.That was the second highest net long position and it marked an important bottom in the oil price at $57.5.So The second highest long position in the last three years coincided with the lowest price of the last year. Still think speculators are driving this?
Recent COT data indicates that commericials are buying like crazy ( refer to Khebab post earlier) while speculators continue to liquidate. That has led to the highest net long position which too is minuscle considering the amount of oil used every month. Even if only the light sweet crude variety is considered.
The first question CNBC asks any analyst is whether "speculators" are driving the price of oil.Tha includes Mark "I am sad the market is not going up" Hanes" Melissa "The price of oil has COLLAPSED by $2" Francis"
and Bertha "I do not have the first damn clue about the oil markets" Coombs.
http://asia.news.yahoo.com/060626/3/2mdjx.html
"A recent WSJ story implies if anything, that hedge funds are betting heavily on energy prices falling (that is if exclude the most well known and sucessful bulls like Pickens and Jones/Rainwater.) The bearish view from hedge funds is indicated by the usual bearish talk on the Bloomberg and CNBC from fund managers (again when they don't have Pickens and a few other doomers on).
So my conclusion is that we are in a kind of anti-bubble for energy prices - where prices could explode to the upside with the smallest of problems. You may mark my post and even ridicule me at year end [2006] if a crisis comes and goes - but the price of oil never exceeds its recent high of $75."
The short interest in oil, which seems confirmed by the comments above that speculators and hedge funds which have bet on the price of oil falling - not rising. The fact that short selling is not driving the market down, with the supposed increase in oil production from Iraq annuonced today (well actually, they didn't really specify if they were talking about one day, one week, or one month) is telling about the underlying strength in the light sweet crude oil market. That is - we are probably past peak in light sweet crude (and no, I don't have a link proving we are past LSC peak).
The link "Is there a real estate bubble in US" goes to the EIA website. Thought I would let you know.
Keep up the good work.
Evidence: Although some disruptions have been felt in several areas - some simultaneously - no actual physical shortages have been reported (natural disasters aside - they don't figure into regular market behavior). So why is the price of oil moving higher?
Here's a competing economic theory. The value of oil doesn't change. Or rather, it actually changes very slowly - it changes with reference to the amount of oil it takes to produce a barrel of oil.
Price fluctuations are caused, not by the value of oil changing, but the value of currency changing. The sudden rise in oil prices in the early 1970s wasn't the result of sudden scarcity or faulty markets - it was a result of the re-valuation of oil. The value of the American dollar had fallen steadily in the 50s and 60s, yet the price of oil had remained roughly constant - thanks to long-term oil concession contracts. The "sudden" price rise wasn't sudden in any way except that it had been suppressed for 20 years.
Apply that to today. In June of 2004, one US dollar was worth 7900 Iranian Dinars. It is now worth 9558.59 ID. That is an appreciation of the ID of about 20%. To the extent that oil's value is constant, the price of Iranian oil would have to rise by 20% in US dollars to reflect that constant relationship.
Such an analysis is hampered by many things - not the least of which is that all currencies do not fluctuate freely. One of the reasons why China is reluctant to allow its currency to fluctuate is because its currency would devalue, which would raise the cost of oil to China.
XT
Isn't that a depreciation if the Iraqi Dinar?
XT
I have been trying to understand the Saudi mind bender for a week or two now and have found Stuart's original comments on "no over exponential increase in price" and "constant OECD stock levels relative to consumption" to be helpful in understanding the big picture. Many of the other comments are also helpful - too many to absorb all at once. My contribution:
In trying to understand the Saudi position I have considered 4 alternatives. How do you explain Saudi production dropping from a daily average of 11.035 million bopd in 2005 (bp statistical review) to just over 9 million bopd in May 2006 (various press reports)?
- The Saudis have returned to their historic swing producer role and are actually witholding production of the light sweet crude that the world craves in order to support prices over $65 / bbl. There is new production coming soon from Tenghiz and Kashagan in the Caspian - so you never know. Hard to reconcile this thought though with all the frantic drilling going on throughout the Kingdom and their efforts to flog heavy sour crude that no one wants. (does anyone know exactly how much new oil is comming from the Caspian and when?)
- Increased production in 2003 and 2004 was provided from stock. BigEasy Alan (this BLOG) suggests that Saudi stock capacity is 90 million bbls - so that is only 45 days worth at 2 million extra bbbls / day - so this does not seem a likely explanation.
I have returned to Matt Simmons book and re-read the chapters on Ghawar, Abqaiq, Berri, Safaniya et al., but focussing on Ghawar. This provides some possible reservoir engineering and production engineering insight to what may be going on.- Simmons points out that the massive central portion of Ghawar (Uthmaniyah) has poor reservoir properties, in particular low permeability and lacks the natural water drive of the prolific northern part of the field. Simmons suggests that Uthmaniyah has been used in the past to boost production at time of need but doing so results in rapid drop in reservoir pressure. As reservoir pressure approaches bubble point, production must be stopped to allow pressure to rebuild over a period of years as fluids (oil and water) bleed back into the produced zones. So if Uthmaniyah has been producing over the past two to three years, the time to rest the resrervoir may have arrived, resulting in falling production.
- The other favourite theme of Simmons is the water production problems in Ghawar and other fields. If production fluid handling systems have a finite volume and the proportion of water to oil is increasing with time then an essential consequence of this is falling oil production. This problem may be greatly exacerbated if multi-lateral horizontal producers begin to water out.
So what is actually happening? My best guess would be a mixture of 2, 3 and 4 packaged as 1.Another way of looking at this is through Occam's Razor which seeks to explain phenomena in the simplest way:
Saudi production is down
The oil price is up - heading for record highs
I'm probably off to buy Brent futures tomorrow morning.
Cry Wolf