Plateau background
Posted by Stuart Staniford on June 14, 2006 - 9:49am
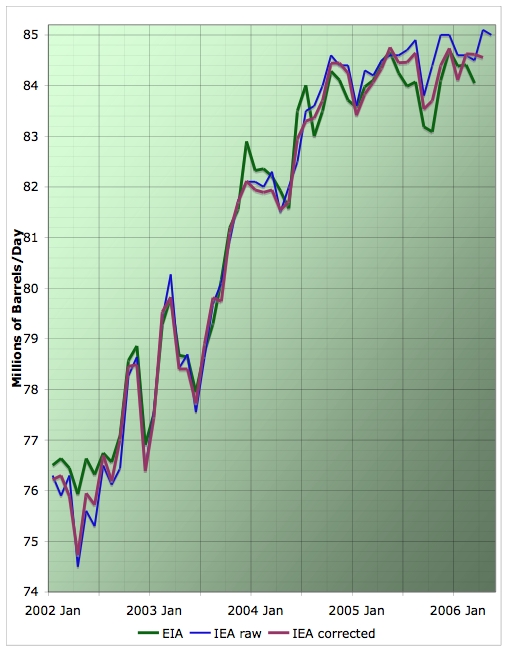
World oil supply rose by 445 kb/d in May to 85.0 mb/d, fuelled by increases from OPEC, a lull in North Sea maintenance and recovering US GOM supply.That sounds good, doesn't it? A healthy increase from April to May? What they don't tell you is in April they were claiming supply was 85.1mb/d, which they've now revised down to 84.55mb/d. You have to be keeping track to notice that. This gives the realization that April, which they had said was the highest supply month ever, is probably not that special (we'll know better when the US EIA weighs in on April supply at the end of this month).
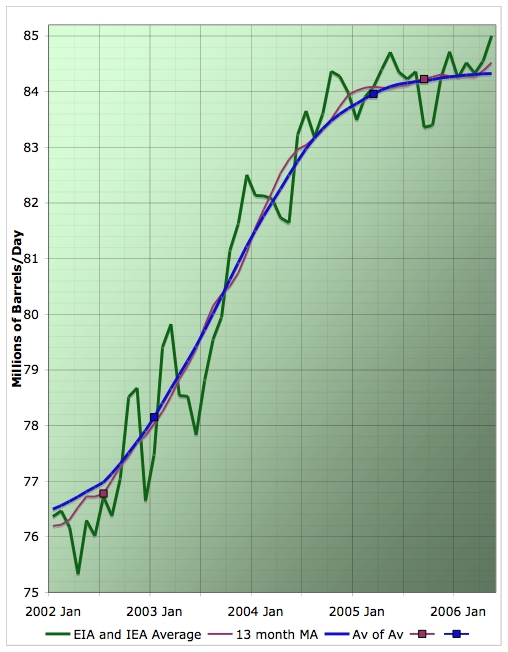
Anyway, this means basically that the pattern of the last eighteen months of more-or-less flat supply is continuing. The moving average graphs now look like this:
I promised I'd give a little more context to these plots in this post. I started plotting versions of these graphs on Thanksgiving Day 2005 (the day Ken Deffeyes had said, tongue-in-cheek, would be the peak of the smooth Hubbert curve of global production). I noticed there was a noticeable flattening of the curve. At that time, I was working from data provided by the Oil and Gas Journal, but I've since evolved my methodology and build these graphs out of data from both the US EIA (a branch of the Department of Energy), and the International Energy Agency (IEA), an OECD agency charged with worrying about security of energy supply. Both agencies produce monthly statistics.
The IEA reports first about 10-15 days after the end of the month. Then the following month, they produce a revised figure. The EIA doesn't report on a particular month until about two months later. Each time either of them come out with a new figure, I update my graphs. One graph (the headline in this story) shows all of the IEA initial reports, the following month corrected figures, and the EIA numbers. Presumably, the difference between the EIA and the IEA is some kind of estimate of the uncertainty in the data for global production.
The other graph I regularly produce shows a recursively applied moving average to smooth the data. The monthly signal that this is being applied to is the average of the EIA and IEA estimates. This is my best effort to see the overal trend in supply through the month-to-month and estimate-to-estimate noisiness. I have argued elsewhere that this plateau is probably evidence of peak oil being near-term (either now, or within the next few years, rather than decades off).
Several caveats are in order. First of all these data are for "all liquids". As well as crude oil, this includes natural gas liquids and condensate, ethanol, production from tar sands and Orinoco bitumen, coal-to-liquids production, and refinery gains (heavy oils cracked in the refinery increase in volume). A good discussion of the issues with this was recently led by thelastsasquatch.
It's also important to understand the region I'm plotting (Jan 2002-now) in the context of the overall history. A long history of oil production from 1930-2004 looks like this:

Average annual oil production from various estimates. Click to enlarge. Believed to be all liquids. EIA line includes refinery gains, others do not. Sources: ASPO, BP, and EIA.
If we move into a more recent timeframe, the next graph shows oil production (green) and real oil prices (plum) since the beginning of 1989.
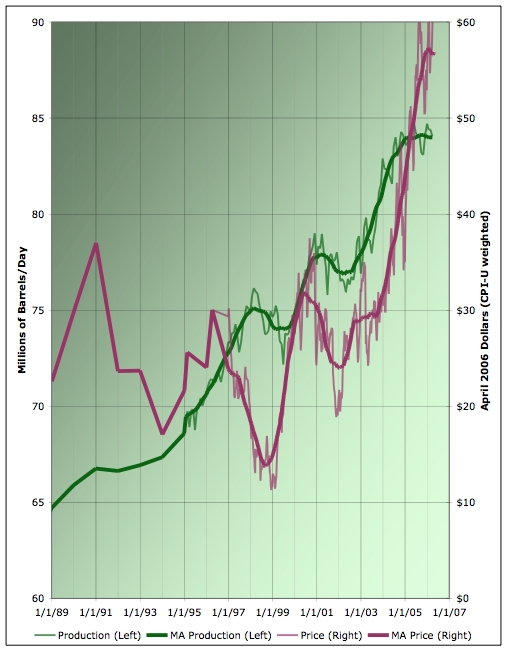
You can see that there have been flattenings or downturns before - three times in this interval. The first is in 1991 and is similar to the events of 1973 or 1979 (but much milder). The Persian Gulf War following the Iraqi invasion of Kuwait caused a moderate oil shock.
The "peaks" of 1998 and 2001 are different in character. In both cases, they were led by demand falling, not by supply constraints. This is clearly visible in the graph above because prices peak and then fall for a year or so prior to those production peaks. The first of these was caused by the cascading emerging market currency crises that became known as the Asian flu. The second was caused by the collapse of the US technology stock bubble. In both cases, recessions in parts of the world led to falling demand for oil, falling prices, and eventually falling production.
The events of 2004-2005 appear to be unprecedented in the history of oil production. The flattening of supply was not demand led - on the contrary demand for oil has remained strong as evidenced by the fact that prices have continued to rise to very high levels throughout the supply plateau.
Nor was it caused by any particular geopolitical (or weather) related outage. I have analyzed this at length, and the basic plateau shape is there even if one assumes various oil disturbances had not occurred (and they are mild compared to past oil shocks in any case).
So, at a minimum, we can say with confidence that there is some kind of unprecedented difficulty in raising global oil production/consumption. The graphs I build each month are meant to track the ongoing story of this period with a view to understanding it as it evolves.
For more information than I can summarize here, see these past stories:
- EIA Insists on Plateau
- IEA Supply Creeping Up
- EIA Reports on April
- Pessimists at EIA Strike Back
- May IEA Oil Market Report
- OPEC Declines and the World Plateau
- Plateau Continues, Aided by Outages
- Plateau Update
- Cigar Now?
- Missing Barrels
- Close, but no cigar
- November Statistics Updates
- IEA Monthly Report for December
- Refining the Plateau
- Can Acts of God and Bush Explain the Plateau?
- November IEA global production
- Happy Peak Oil Day?
- Where Supply Increases Come From
Contact
- Content: editors at theoildrum dot com
- Tech support: support at theoildrum dot com
License

This work is licensed under a Creative Commons Attribution-Share Alike 3.0 United States License.
They seem to operate in exactly the same way as OPEC. It is amazing how many revisions OPEC do to the figures even 3 years afterwards to get the increases or at least minimise the decreases to the yearly and quarterly totals.
You can read the entire eerie chapter 4 of 1984 for free here:
http://www.online-literature.com/orwell/1984/4/
-BB
IMHO we are getting here the peak in Conventional Oil (by Campbell's definition) not being tackled by other liquids.
The question is: is this just a temporary constraint? Can Deepwater or Fisher-Tropsch came and rescue us?
The answer will probably lie in the energy intensity of these alternate liquids, and the way they can be produced without cheap oil backing them.
If we consider the real energy supply, the impact of slowing oil supply growth in the latter part of 2005 will be seen only this year (because of the processing and logistics time lag). And yes, the are clear signs in the economy now.
Zero oil growth will not mean that the World energy supply growth will be zero, but it will mean a further slow down - about a half per cent. But this means also that if the oil production starts decreasing about 5% or more, the World Energy Peak is in.
World coal production growth is unlikely to increase from the present 5% level - the Chinese coal growth is already at the level of 10% and it is not going to get much better. The rest of the World cannot really increase its share enough. Coal is badly depleted in Europe and elsewhere, the volumes of Australia, Indonesia and South Africa are not large enough to make a difference. And the record of the US coal production growth is not such as to warrant a forecast of significantly higher growth than now.
Natural gas is crucial, but the supply growth has slowed down recently, so it is not likely to compensate the depleting oil as much as would be needed. And note, Bakhtiari is predicting Peak Gas in the near future. In any case, the present gas production data suggests that the growth is not going to be much higher than now.
What we will see in the near future is an economic slow down, where the action is mainly in the financial sphere (forex, debt, stocks, real estate). But we might get the World Energy Peak surprisingly soon, may be in a time frame of 5 - 10 years, and steep decline after that. It is not realistic to think that the Chinese coal production can keep the 10% pace for long. Add to that Peak Gas and Oil and All Liquids.
Note, that the the World Energy Peak may arrive quite soon even if the Peak Oil is delayed (the CERA/optimist view) or there will be just a longer oil plateau first, without decline or growth. In this situation natural gas will decide. In any case there is not much energy growth potential left in the World, so even a rather optimistic scenario will give a World Energy Plateau in a few years. The energy volumes involved are so huge that alternatives will not make any difference, CTL and GTL will not count here at all, because they depend on available coal and gas.
There you have the big picture.
Based on Simmons & Company data, total fossil fuel + nuclear energy consumption worldwide is about one billion barrels of oil equivalent every five days. Worldwide, we burn through the energy equivalent of all Texas oil production to date about every 10 months.
The other article was about data processing centers, which the article stated can use as much electricity as a city of 30,000 to 40,000 people. There was an article in the NYT about the new Google computer facility going up in the Pacific Northwest. They located it there to be close to large amounts of cheap (hydro) electricity.
In today's WSJ, there is an article contrasting the fate of the energy exporters to the energy importers, "In Oil's New Era, Power Shifts to Countries With Reserves." There was an interesting quote by the Saudi Oil Minister, "Any industry that requires intensive energy will be welcome in Saudi Arabia.
At I have noted before, it seems to me that we are going to see a population shift, here in the US, and worldwide, to areas that have surplus energy to export. As I have also pointed out, as depletion and rising domestic consumption both work against net export capacity, net exports are going to disappear at a rapid rate, while demand in energy importing areas like China continues to go up at a rapid rate.
Final quote from the article, by Henry Groppe, "We have entered the era of scarcity and price rationing (for oil)."
This is of course a mischaracterization of the Peak Oil argument--that one day we have oil, and the next day we don't. In any case, the WSJ writer went on to state that "But some oil experts foresee the big Western companies running out of easy-to-tap oil, and most of them are already turning to harder to recover reserves."
The overall theme of the article regarding Western oil companies is that they are turning toward GTL projects and to tar sands and very heavy oil and away from traditional exploration--not because they want to but because they don't have a choice.
There were three broad themes in the article: (1) life is good for energy exporters, not so good for energy importers; (2) Western oil companies are turning more toward mining type operations for oil, rather than traditional drilling and (3) they finished with a pretty good summary by Henry Groppe, that we have entered a new era "scarcity and price rationing."
The only mild gripe I have with the article is the mischaracterization of the Peak Oil argument, but the rest of the article all but made the Peak Oil argument, but in different words. The only real question is how fast unconventional oil production can be brought on line. IMO, it won't be fast enough to offset the declines in conventional production.
People don't pay enough attention (IMO) to the increasing role of electricity in the US economy. As implied in the following graphic comparing economic growth in the US to electricity growth and total energy growth, electricity is playing an increasing role in our total energy budget.
According to BP, the US electricity generation in 2005 was 4229 TWh, and the Chinese 2475 TWh. But the Chinese generation grew 12.3% and the US only 1.7%. The growth of the Chinese electricity generation accounted for 42% of the increase of the World electrcity generation in 2005. It is important to note that in China most of the energy and electricity is used in manufacturing (up to 70%), unlike in the US where residential and commercial use dominate (the share of the industrial sector of the electricity consumption is about 30%). This means that the Chinese industry can use considerably more electricity (and energy) than the US manufacturing sector. Here we have a striking example of the importance of energy in economic development.
We should especially note the rate of growth here. China is definitely where the growth is in energy production. The average electricity generation growth between 2002 and 2005 has been nearly 15%. This means doubling the production in 5 years! If the 2005 growth could continue, the Chinese would produce more electricity than the US in 2010 and its industry use it 3 times more than the US industry - and nearly as much as the US and EU industrial sectors together. I think it is easy to understand the significance of this.
An another matter is, if these extrapolations are realistic. It is obvious that China will meet the physical limits to growth very soon. What will happen when the growth engine of the World energy and economy stops?
The Chinese energy (coal) production is, of course, crucial to the Climate Change. China is overwhelmingly the most important factor here. So the future of Chinese energy production is decisive to the climate forecasts. The forecasts of the increase of CO2 in the atmosphere are dependent on the fossile energy (mostly coal) supply forecasts. But most of those forecasts used here are based on EIA or IEA super-optimistic "official" long-time energy scenarios. Closer look suggests that the overall fossile energy production is nearing to a peak very fast, or at least to a situation where the growth slows considerably. I think these are basic facts for a global Climate Strategy.
Incidentally, as I promised someone I would look up, Chinese coal consumption was 70% of primary energy in 2005, up from 67% in 2002.
Here we see the secret of the Chinese economy. The energy production of China has risen 44% from 2002 to 2005, and this at absolute volumes comparable to the US! The Chinese total energy production growth has supplied almost half of the total World energy supply growth during that time (450 Mtoe of 1010 Mtoe growth). China has been literally the engine of the World energy and economy.
It is absolutely clear that low costs are not the main reason for production moving to China. The industrial growth there would have been impossible without this huge growth in domestic energy production. This is the biggest "energy surge" in the World history and the driving force of globalization.
And as Smekhovo noted, the rising share of domestic coal in the Chinese energy mix is the explanation for those missing symptoms of an oil crisis (no real supply problems, prices not really skyrocketing, economy not yet slowing) in face of slowing supply. The rising share of coal is an anomalous phenomenon - developing, modern economy would normally use relatively more of oil and gas, not less.
It would seem that if China will not be able to grow their energy sources, then their economic growth must slow too. But at the same time, the competition for outside sources will then become very great. The key event would then be peak Chinese coal, not peak world oil.
But the Chinese are totally locked into the path they are on. Without burning the coal, their economy melts down and there's another 1949. Unlike here, remembrance of revolution is fairly recent. So the last thing the government will (can) do is allow any great cooling. Nay, worse, they can't even afford to allow things to level off.
And yet, we may be on the verge of just such a cooling off of the world economy if the current slide in the markets doesn't reverse itself.
It's all way too interesting. I'd love to be bored for a few years.
One example is importing from China. Seems like it would exposed to oil price increases. Yet container shipping is very effecient. Large cargo ships loaded with a generic size container with RF Id tags utilizing automation - that can move alot products at low cost. So that's why you can afford to ship all those Dollar Store items.
There is a POSSIBILITY that you have underestimated the potential for wind.
Wind is the only renewable that has the potential for a significant worldwide impact.
IMHO, 30% annual, compounded growth is possible, with occasional spurts greater than that. Designs will improve somewhat (not a mature, but a maturing industry) with 3% to 5% annual improvements in cost effectiveness (measured in a stable economy). In a recession, booming sectors attract capital, labor and materials.
In a decade (optimistic case) this new wind power plus much smaller contributions from other renewables & new nukes could balance the declines in other energy sources.
Of course, legal and social obstacles must not be an impediment (see the Kennedys, English "conservationists", ec.) to allow this MASSIVE growth, ann they likely will be.
Is there any guarantee, if wind is successful (or any renewable for that matter) we will not overdo it as we did the automobile, and simply turn the planet into an infinite powerplant ? What if someone invents better electrical storage so turbines can handle baseload? How can it fail to be overdone, if it actually works? When have people ever stopped drawing on a resource that still yielded more? I'm all for people being responsible for their energy consumption by having their energy plants in their own backyards, but knowing the greediness of my neighbors and their basic disdain for the common landscape as compared to the conveniences inside their monster houses, I am really not sure I would want a breakaway success of wind, or anything.
This is what it takes today to build a Nordex N-90, a windmill capable of producing 2,3MW:
150 tons of steel
10 tons of coper
30 tons of glass fiber
1.000 tons of concrete
If we were to substitute all the world electricity consumption (not all energy!) with windmills we'll need 6.000.000 of those Nordex N-90, ALL OF THEM in type 6 fields, and we'll need:
90% of the world production of steel
113 times world production of glass fiber
3,4 time world production of concrete
Just to let you know how really renewable is a windmill. Having said that, I hope to see as many windmills as we can fit in our territory.
In fact, according to the Hirsch Report the scale of this issue is such that only massive mitigation effort lasting 20 years or more will head off disaster. With all due respect jamaica22, "faith" alone is probably not going to cut it.
Even if you are right, can we keep on growing? Oops. Damn population problem. :P Hawking is right, we need to leave for space.
Sorry for the scarcasm. But the point seems to be missed too often.
Well, no it began way before Katrina. Oil was over $60 a barrel well before Katrina and has been below $60 since Katrina. Oil prices hit $55 in 2004 and that was about the time people realized we had a problem on our hands.
To try to pin the entire world oil crisis on a single storm in the US is just not logical. Most cornucopians are far too myopic and too local, as well as overly simplistic in their thinking.
Ahhh wood! 5,600 BTU per pound- slightly more for those wood that contain resins. IMO we will live on Planet Easter Island if we even consider wood as a replacement at "current levels of consumption" <---I think that westexas has noted enough that it is finally sinking in that this will have to change.
Like the boy that cried wolf.
US is 'not ready' for Chavez oil ban threat
http://www.energybulletin.net/17128.html
Mr Gore, what do you think the public will consider more important -- "Peak Oil" or "Global Warming".
More of the same.
People talk about how the common folk can be manipulated for great causes (like foreign wars) ... well, here's one that fits the bill. Not only is GW a sceintifically valid concern, it aligns with the nation's energy and economic needs for the next century.
We will be in a race for efficiency with other energy consuming nations, and this is a helpful motivator.
It's sad that the knee-jerk reaction from some on GW and PO is the same. A certain element is so afraid of collective action that they will cringe from any factual problems that seem to require it.
So ... both ... they go together. PO and GW both demand some element of collective action, or at least collective coordination, to reduce fossil fuel consumption.
That's the closing paragraph from a box called "Flex Fuel's Big Pay-off" on page 120 of "Car and Driver's" July 2006 issue.
I think a clean slate will have a better chance than mandates that carry such things forward.
(and of course if you are interested in GW you have to mandate not just cars, but refrigerators, light bulbs, heaters and air conditioning, ...)
... it wouldn't be bad, if you ask me, to set "energy star" as a base mandate level for efficiency.
So I got a smaller model with specs close to Energy Star, which was still much more efficient than what we had. It was larger than we needed, but the extra space came in handy when my stepson moved back home.
ah, here it is:
http://www.treehugger.com/files/2005/07/man_retrofits_f.php
can't vouch for the article's accuracy, but it's a neat idea.
But they tried ...
Once more:
http://www.lightrailnow.org/features/f_lrt_2006-05a.htm
All the small constituencies, around rail, plug-in-hybrids, electric cars, hydrogen, biodiesel, ethanol, bicycles, relocalization, is that they indirectly or directly compete.
At the same time, if they really have the fundamentals, they would all gain from taxing carbon and/or the dirty fuels.
I mean, why answer "carbon tax" with "electric rail?"
I see "Carbon Tax" & "Gas Tax" as both being sticks in behavior change and Urban Rail as being a carrot.
Electrified freight rail is just an economic response to external factors. A carbon tac will help them in a difuse way.
Coal is used to make steel, a long life product. A carbon tax will raise the price of wind turbines and steel rail, among myriad other items.
From a global economic perspective, this is good & proper, letting the market allocate resources & "bad" things.
However, the level of carbon taxes that the overall economy can tolerate will (probably) not be large enough to create the dramatic changes needed in the time allowed.
The rest of the world shows that high gas taxes do not inhibit economic growth, etc.
In a hypothetical several months ago, I proposed two taxes:
- A gas tax that rose by 1.5¢/month for 20 years, with inflation adjustements. In 2027, a tax of $3.60/gallon measured in 2006 $.
- A carbon tax based on the cheapest source of carbon in the US, Powder River Basin coal delivered to the railhead.
The carbon tax would be be 0.5% of the value of that coal per year for twenty years, eventually rising to 10% tax on that WY coal, and lesser % tax amounts elsewhere.#1 is much higher and harder than #2. This reflects the ease of change, the time delay of change and so forth.
PO is still not widely accepted among decision makers in UK; when this changes expect many more such re-openings.
With the US consuming 25% of the world energy supply of course its important.
''In this table we grouped the Chinese population by (average) altitude. We found that in China some 228 million people - comparable to the combined population of Germany, France, Italy, and Spain - live only a few meters above sea level (on average, less than 25 meters).''
GW = polar melting = marine transgressions = you get the picture.
The AP yesterday had a story on China asking civil servants to forego energy consumption for a day. They claim that 7 million Chinese civil servants use as much energy annually as 780 million Chinese farmers.
First of all, that's something being done. Second, in my surf I saw (can't remember where now) that environmental concerns were ranked high in polls of Chinese citizens.
I hope that there is enough sentiment in China (and the US!) to support coordinated reductions of 'the bad stuff.'
The gods are laughing
I haven't really dived into it yet, but it has that "CO2 is plant food" astro-turf feel.
Iranian Jews themselves have stated that it was not true.
From CNN:
http://edition.cnn.com/2006/WORLD/americas/05/24/canada.iran.reut/
From The Jerusalem Post:
http://www.jpost.com/servlet/Satellite?cid=1145961377561&pagename=JPost%2FJPArticle%2FShowFull
http://www.energybulletin.net/17142.html
i believe you mean "nominal" oil prices, which are adjusted for inflation. "real" prices are not inflation adjusted.
i'm still confused about the "average of averages" line. what are you averaging the 13 month MA with? and what utility does this recursive averaging provide?
http://www.nytimes.com/2006/06/14/business/worldbusiness/14oil.html?th&emc=th
Heh, I can just seen them now in their plaid shirts and earflap hats...
Suspenders and a bra
I wish I'd been a girlie
Just like my dear papa"
:-)
For a Canadian, a Terrorist is someone who mix waste in the recycle bin.
Even our army wouldn't be a real threat if we would ploy a Detroit attack, Detroit citizen alone would be able to defend more aggressivly.
Maybe that's because we get free medicare for EVERYONE and Umemployments benefits that calm and sooth the people and everybody feel warm and fuzy.
By the way, The PO problem has yet to be shown in public debate in Quebec, even remotly or within the green community. I guess that we will be the most surprised when it will occur.
Obviously supply/demand must balance +/- additions and withdrawals from storage which must be a small effect over the period of the plateau.
Demand is constrained either by recession, price destruction or refinery capacity. We are not in a global recession yet (though we may be soon)- demand is still forecast to rise. There is some evidence of price destruction happening in Africa/Thailand etc so this is likely to be having a downward drag on demand. But refinery capacity is the reason given by the Saudis for recent drops in their oil production - perhaps this deserves more attention.
Supply is constrained either by producers being unable to pump more or unwilling. I doubt they are unwilling with oil prices hovering around $70. Seems unlikely, given Saudi promises to keep the oil market well supplied, that they would choose to defend oil prices at $70, $50 perhaps but not $70.
So if the plateau constraint was caused by price destruction of demand, the Saudis could pump more oil and lower the price to stimulate the demand i.e. fulfill their honoured role of swing producer.
It seems more likely that plateau is caused either by refinery bottlenecks constraining demand (as the Saudis say) or by the inability to pump more oil.
So is it possible the graph is showing us the current maximum world refining capacity ? Is it possible going forward we will be plotting peak refining capacity instead of peak oil...
In Europe domestic oil rapidly declining already now, so oil supply for refineries must come from imports. It is not EU policy to encourage that. Oil producing countries have some interest in adding refinery and petrochemical capacity to add value to their petroleum exports, but those countries do know their production limits - and most oil producers are already past peak!
India and China are adding some refining capacity as their consumption is rising, but this is not much in the global scale. Refiners are mostly upgrading their capacity by upgrading - but who would assure them that there will be enough crude supply for full capacity operation during the next 10 - 50 years?
Iran to build new refinery
What? No Light Sweet Crude refineries?
Hmm...
-C.
My concern is we could see a plateau extend well into the future and all that tells us is that there has been insufficient investment in new refineries in the past 20-30 years.
Its not until there is a convincing drop off the plateau that we can be sure the Saudi refinery "excuse" isn't valid.
Here in the Houston area there are at least two refineries that can deal with "junk oil", or low quality crude. They are Exxons Baytown refinery and Citgo's refinery, owned by PDVSA. But any refinery can if they invest in Crackers. I'm no expert in downstream, but the refinery construction people are booming and I'm certain part of the boom is in refitting for heavy crude.
The 1973 oil crisis was caused by the 1970 oil peak in the US, but triggered by the Jom-Kippur War, the immediate reason for the OPEC embargo. Without the US peak, the OPEC embargo would not have been so successful. Moreover, Matt Simmons found that Saudi Arabia had oil-geological reasons for "resting" their oil fileds.
So the EIA and IEA are posting numbers for all liquids but most people interpret this as petroleum oil production because a decade ago that was the only liquid source?
So that 'all liquids graph' is the worldwide production of any liquid hydrocarbon, from any source, created by any means, with untracked EROEI?
Meaning that a barrel of Canadian tar sands oil is counted the same as West Texas intermediate even though the energy used to capture those two barrels is very different? Ditto for ethanol, biodiesel, and liquified Natural Gas? I read TLS's post, just clarifying here and trying to understand why non liquid petroleum products are lumped in with a 'petroleum liquids' report.
So how does a person track the net energy supply if more and more of the liquids are requiring ever more energy to capture/create a barrel?
I could easily see us moving to a world where the total liquids stay about the same but we are using most of the coal, nuclear, solar and wind energy to make much of that liquid. Not only would there be no net gain in energy, from the non petroleum energy sources, we might lose ground on total energy by making liquids rather than just using the electricity or heat from the other forms.
In the electrical industry, plants are ranked by how much power they can transmit off the plant site (pumping, crushing, transforming. lighting & other hotel loads are subtracted from the total).
AFAIK, this is the only example of "net energy" production, and it does not count energy losses off the plant sire.
By price. As it becomes more energy intensive to get it out, it automatically becomes more expensive unless energy costs themselves are dropping (which we know to be not true).
BP says there was a 1% increase in all liquids production for 2005 over 2004. NB all increase (according to BP) comes from OPEC. Non-OPEC including FSU collectively declined by 0.25% last year.
http://www.bp.com/productlanding.do?categoryId=91&contentId=7017990
Looks like Deffeyes ain't wrong yet...
China has recently allowed gasoline/diesel prices to rise towards world prices, encouraging refiners to sell into the home market instead of exporting product, eg to the US. As a result, crude imports in the first 5 months are up 17% yoy, or about .5mmb/d, and China product shortages are declining. The trend seems likely to continue, with Chinese consumers maybe allowed unlimited access to energy for the first time.
The US might see reduced gasoline imports.
Downward revisions for Russia, Malaysia!
Chad, Sudan?
And in case you were wondering, orimulsion is
Nice to live in interesting times, isn't it? Back-end loaded! You bet. I can't wait for those future revisions.Thanks for the good work, Stuart.
IMO, "downward revisions" is going to turn into "production collapse."
The new "Great Game," is between the two primary net exporters, Saudi Arabia and Russia, versus the two primary net importers, US and China.
Consumption in all four countries is growing.
It now appears likely that production in all four countries is falling.
We know that both Saudi Arabia and Russia are well past the 50% of Qt mark, based on the HL method, and we know that at least some Western oil companies appear to be falling all over themselves to sell their Russian production.
What continues to amaze me is that anyone disputes these basic facts.
Tis true. My favorite example is the Texas State Geologist talking about the possibilty of Texas exceeding its 1972 peak production level.
I will play Devil's Advocate here. But I will play for real.
I don't buy it. This paragraph doesn't prove your case. Nothing is that simple. There is no reason why the present situation is not led by demand falling - rather than supply constraints. You give way too much credit to Bird Flu. "Parts of the world?" If "parts" of the world are important, then certainly I can use them for my arguments as well...
I know we can make this a friendly debate.
Oh, you said Asian Flu. I'm sorry. Still doesn't mean anything :) The West is the Best. How does a currency crisis in Thailand rate higher than $3 gasoline in Ohio? (and prove it)
You know I love you Stuart, but there is no way you can be let off that easy.
The high price of oil in the last 3 years has contributed to a "stabilization" of demand. Demand has also slowed simply because there is no need for it. As we all have been brainwashed - demand has been "wicked" high in China, and India. For years. Well. That couldn't go on forever. And it naturally peaked and stopped. Over. Big Deal. Now everything is back to "normal." Decent growth. High oil and gasoline prices. Steadily rising inflation. Fear of recession. "Slower demand." Simple. - (Nothing is that simple)
Sure we can. IEA full report:
If we choose to believe them, demand growth has been revised downward a whopping 0.22/mbd.And that's all I've got to say. Friendly enough?
Quite flat with variations of 5% to 10% for decades. Until recently, when it has shot up to ~70, backed off to $60 and then back up to $70+.
The earlier spot fluctuations in price bypassed the 5 year market expectations (spot shortages, embargoes, booms & recessions are assumed to disappear in 5 years) but this one has not.
(Hit tip subtr4ct)
I think it's pretty telling that the plateau starts about the same time that the price rise starts.
If this price rise was fear driven, then you would think that it wouldn't affect production for a while after the price starts to rise.
Economic growth has not slowed, least of all in China or for that matter India.
When you have a demand led slowdown in production, you get a fall in price coming long before it. Just look at the graph.
Economic growth and Oil consumption/demand growth are two different things. According to BP, Indian and Chinese combined 2005 oil consumption(accounting for 11.5% of total world consumption) increased by only 1.3% in 2005. This is in sharp contrast to 2002(7%), 2003(7%), 2004(14%).
American consumption fell in 2005. Total world consumption increased by 1.3%(same as China and India). American and total world consumption both grew by 3.5% in 2005.
Do tell me when you find time to look at the graph.
You impugned my grasp of the facts and then proceeded to make statements that clearly have no basis in the data. The data from BP which I presented, on the other hand, clearly shows you to be wrong regarding the level of Chinese, Indian, and worldwide oil-consumption growth.
Your first sentence about production and consumption is related to what? You are trying to say that consumption would be higher if the oil was actually there?
The argument I'm making, supported by many in the industry, is that the oil is there. Maybe not at the price everyone would like, but it is there. How long this will continue to be the case is not clear.
There is a difference between a lack of excess supply capacity and an actual lack of supply. If the supply were actually constrained, my feeling is the price would be higher than $70. The price itself likely has some effect on present demand, producing a self-balancing pressure that we may be underestimating.
My feeling is that many of these factors are in state of economic balance not necessarily seen before in the oil market. It is easy to draw parallels to certain time periods and with the benefit of 20/20 hindsight to make correlations between lines on a graph. It is harder to make a correct assessment of the present. There are some variables that we simply don't know and won't have until we are looking back at the picture.
Whether oil has peaked or at what stage of a peak we are in are still matters of speculation.
You seem to believe that something is proved by the graph. Maybe. Maybe not. A chart produced in 2002 or 2003 relating the price of oil to recession would have led one to believe(given the price rises since that time) that we would have experienced a recession by now. We have not. When trying to analyze the relationship between certain pieces of data to draw conclusions, we must be very careful not to overlook something in the equation that might be different from past experiences.
Now that you have looked at the graph, you tacitly admit that it explodes your argument. We're getting somewhere. Now you just have to admit that you don't really have another one.
And please don't talk so much about your feelings, it makes hard-bitten types uncomfortable :-)
The price axis looks linear, perhaps this needs to be put on a log scale?
I proved my point with data. You have conveniently avoided your erroneous take on Chinese, Indian, and worldwide consumption growth. I contended originally that it has slowed(not dropped). It has. You indicated that it had not slowed.
I acknowledge that growth has slowed. I do not accept your rationale for why it has slowed because there is that other possibility and that other possibility is looking more and more likely, based on all other data, to be the real cause.
I know this topic will come up again, so we can discuss it then.
I value your willingness to respond and engage in debate, so I have to apologize for not responding. Does that mean you win by default? No. I'll be back :)
As for the Man from Leningrad, still awaiting his response. Or have we carried this forward?
http://www.eia.doe.gov/emeu/steo/pub/a5tab.html
20.77 mbd/day in 2004
20.66 mbd/day in 2005
See, I don't always disagree with you Oil CEO.
Chinese demand was artificially restricted in 2005 by gov price controls. Refiners were taking losses at teh controlled prices so exported gasoline, leading to lines at gas stations. The price has been allowed to rise, refiners are now increasing supplies into the home market, and net crude imports for the first half of the year are up 17%.
$70 gasoline is high enough to stagnate demand in the US, but not in china (which is where the $ are.)
A post on another thread talked about how the rich us would always be able to outbid the developing countries. Imagine the wealthy on Nob Hill, looking down their noses at the coolies below... who hold the mortgage, currently in default. Who is rich, and who is poor?
Saudi Arabia can continue to claim with impunity that they were prepared to expand production capacity to 12 million barrels/day, and beyond, but that stagnation of global demand has made it entirely unnecessary.
We are but mere mortals.
The Hand, having written its price on the wall, moves on with loftier goals in mind.
http://pagead2.googlesyndication.com/pagead/iclk?sa=l&ai=BDOP9Qf-RRPSBOIiY0AGCr-TEDcaC2RbmlqX_Af yNo8cGABABGAEgzK-iA0iKOVCQ1dP-B5gBtNP2vwGgAd6Cov0DsgESd3d3LnRoZW9pbGRydW0uY29tugEKMTYweDYwMF9hc8gBAd oBNGh0dHA6Ly93d3cudGhlb2lsZHJ1bS5jb20vc3RvcnkvMjAwNi82LzE0LzE2MzM2LzY2NDaAAgGVAgVvNAqYAvYOwAIByAL64E A&num=1&adurl=http://www.stansberryonline.com/OIL/20060405-OIL-COL.asp%3Fpcode%3DWOILG536%26 alias%3D200604OIL&client=ca-pub-4209842280388498
I haven't seen anything about "shale oil" for a long time on TOD, so I suppose this notion has been thoroughly debunked?
Click Here :)
If nobody responded this would "dis-prove" shale oil more than any EROEI calculation.
I don't see shale as the silver bullet that others see. The verdict is still out on whether or not it even has a 1:1 EROEI IMO (i've heard 3:1, 1: 0.5, etc...)
-C.
Finally. The first sensible law out of washington. I hope they also repeal the law of gravity and some other of that nerd b*s* stuff, so we can all go to the next universe time travelling. All that reality based hype, way to much detail there. Michael Crichton for President!
No, I'm saying that the Saudis do not make themselves look foolish by arguing that there is exactly the right amount of supply for the demand.
Having been reading The Oil Drum and its commentaries for months, sometimes I think I see a confusion of all economics-based discussion with "Cornucopian delusion."
There's a difference between saying "free markets will solve our problems by encouraging investment into alternative energy sources as oil prices rise," which expresses a normative belief,
and saying "free markets will encourage investment into alternative energy sources as oil prices rise" which is a fairly reliable statement based on observation and in any event is a process that's already underway.
It's also accurate from an economic perspective to say "demand always equals supply."
Your average daily demand curve seems to clearly show slowing demand as oil prices rise. Now, it may also show the convergence of daily global demand with daily global production capacity, which might in effect mean peak oil if the curve flattens.
The problem is that the determination of whether that is true won't come for years and years, maybe not for decades, depending on what happens to the global economy in the intervening time.
What's been a steady drumbeat in business news over the past year or more is the threat of high energy prices/high interest reates/inflation putting the brakes on U.S. economic growth and by extension global economic growth.
If oil demand flattens out (and it can never exceed supply) then that will be interpreted by all the business media and economics as the predicted effect of high prices on demand, and hence on economic growth.
Put another way, if we have reached a production peak, and the supply curve goes essentially vertical, the price does not become infinite, it simply rises until demand growth stops. This means that economic growth slows, people are forced by price to undertake conservation measures, and they seek out alternatives (whether or not such alternatives are actually feasible). But an absolute production peak is not of necessity the cause of high oil prices (even though you have me convinced). And it will not be widely recognized as the cause of a global recession, if one is about to occur.
Consequently, the Saudis may not have to admit to peak oil production for decades.
This is so off base. You mean to tell me that supply and demand are always at equilibrium? You're crazy.
From an econ POV S&D are not always in equilibrium and furthermore they are two distinctly different graphs that move inversely. To say a few posts back that oil supply is oil demanded would imply that prices do not change. If prices rise it's either due to a rise in demand or a fall in supply.
Factors affecting supply are different than factors affecting demand so let's be clear that they are very different. Too many times there will be symptoms of a real problem and we spend a lot of time talking about the symptom, rather than the problem. It can be disguised as all kinds of things(hording), but the basic premise holds true.
I'm in no way qualified to make distinct statements as to why oil has risen so hard so quickly, but when you look at the raw numbers, demand has risen considerably in the last decade. No secret there. Supply is currently hitting around peak production ever. Open secret here. These very well may be in equilibrium at this point, but that does not mean let's interchange supply and demand curves.
Stuart's wonderful graph isn't a supply curve or a demand curve, it's the quantity demanded/quantity supplied over an interval of time.
Keep in mind that I'm not arguing against peak oil. I'm arguing for its complete lack of transparency in the face of all economic forces acting on supply and demand. The flattening out of the quantity supplied is indistinguishable from the flattening out of quantity demanded, absent really broad historical perspective that may not be available for years and years.
Except in the case of artificial price controls, it's a complete abstraction to talk about world demand outstripping world supply.
One effect of a global recession caused by peak oil is that it would kill off demand to well below peak production levels and crash oil prices. At that point it might take years and years for demand to creep back up close to the previous peak. It will take that kind of reference point to demonstrate that peak oil actually happened. If you think it's already happened, set your alarm for 2016 or so for confirmation.
No it's not. When lesser developed countries are priced out of the market the demand has outstripped the supply. There are no artificial price controls involved, the country or the people themselves simply can not afford gas and must substitute.
You, on the other hand, are thinking about demand from a more human perspective, of what people would want versus what they can afford.
Demand is a tricky word used by most economists to bolster circular logic chains. Just be aware of that.
You cannot sell what you do not have.
================Alstom chosen to supply Algiers' first tramway
(14/06/06 17:40 CET)
A 225 million euros project
ALSTOM CHOSEN TO SUPPLY ALGIERS' FIRST TRAMWAY
The operator Entreprise du Métro d'Alger (EMA) has just announced that it has chosen an international consortium led by ALSTOM Transport to supply a turnkey system for the first tramway line of the Algerian capital. The total value of this project is 225 million euros. Options may be added.
This project is part of the Algerian Government's development programme to meet the increasing demand for public transport and reduce traffic congestion in the Algerian capital. Algiers' first tramway line, which will link the city centre to the Eastern part of the capital, will be 16.3 km long with 30 stations. It was designed to transport 150,000 passengers daily. The first train sets will enter into service 30 months after the contract takes effect.
As a supplier of global solutions, ALSTOM will provide a turnkey system comprising the rolling stock, the tracks, the power supply system, the traction electrification, the signalling system and control equipment, part of the civil works and a workshop. ALSTOM has long experience in this field with references including the Barcelona tram and the KTX high-speed train for Korea.
Since the development of the first CITADIS in 1996, ALSTOM has sold 778 CITADIS cars to more than 20 cities around the world including Paris, Strasbourg, Lyon, Madrid, Rotterdam, Dublin, Melbourne, Tenerife and Tunis.
I have also a website, http://www.terredebrut.org in french language where I post analysis about the peak oil.
I make the same thing as Stuart. I compiled data from monthly report of AIE but not EIA.
I take only data from table 3 ( Wolrd Oil production) and Table 3a ( Oil Supply in OCDE Country) and I use the data which have three months delay.
I separate countries in different categories to look for interesting things.
And I find it.
You can see on my website http://www.terredebrut.org where you can have the graphs in the different posts in pdf by clic on it.
For example, I find that the production of liquid of countries from non-opep-non-fsu has peaked in dec 2003 !
It's a BIG BIG GEOPOLITICAL FACT!
I don't know how to post a graph here but you can see on my the post " le processus de déplétion" on terredebrut.org. `
the sum of All the countries except the big oil exports countries as OPEP and FSU has already peak since two years!
The plateau that we observe on non-opep production should decline when Russia decline.
I observe another fact :
the production non-OPEP-non-OCDE is a very linear graph. The growth is 1,2 mb/j per year since 2000.
But, it's very likely that this growth will stop in the years to come.
makhnovitch.