OPEC Declines and the World Plateau
Posted by Stuart Staniford on May 3, 2006 - 2:50am
Firstly, the world situation:
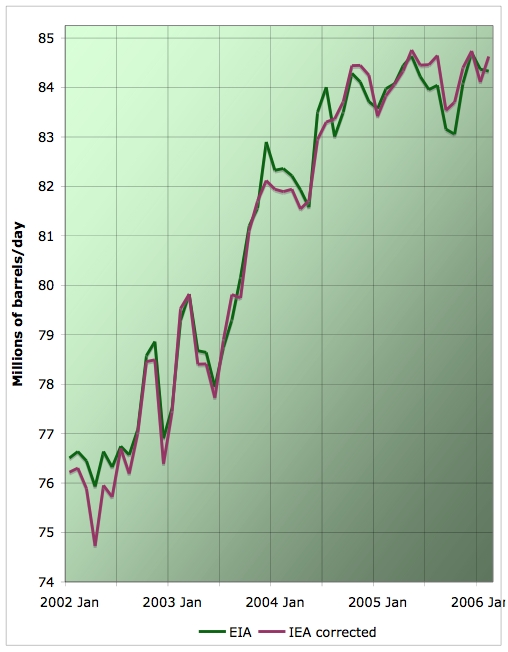
As you can see, the EIA confirms the IEA's impression that February production is down from the all time peaks of May/December 2005, but still definitely within striking range. The EIA is slightly more negative than the IEA for this month, but the discrepancy between the two is not large by historical standards.
In short, the plateau continues for now, but there certainly is not compelling evidence that we have seen the all-time production peak month at present.
A quick update of the graph for the two most key players gives:
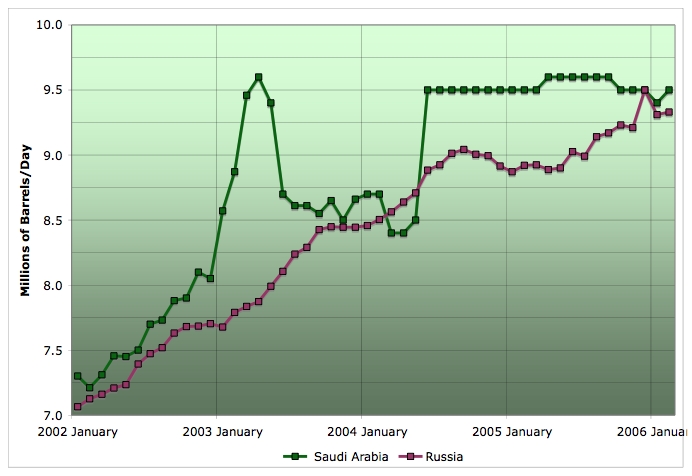
As you can see, February saw Saudi Arabian production continuing in the plateau they've been in for over eighteen months now. More significantly, Russian production in February has not resumed the upward march of the last few years, following a weather related anomaly in January. Is this due to the continued effects of the cold winter in northern Eurasia, or more than that? Time will tell...
Moving onto my main theme, here's an update of the OPEC versus non-OPEC production. Each is expressed as a percentage of the peak month (September 2005 for OPEC, and December 2005 for non-OPEC).
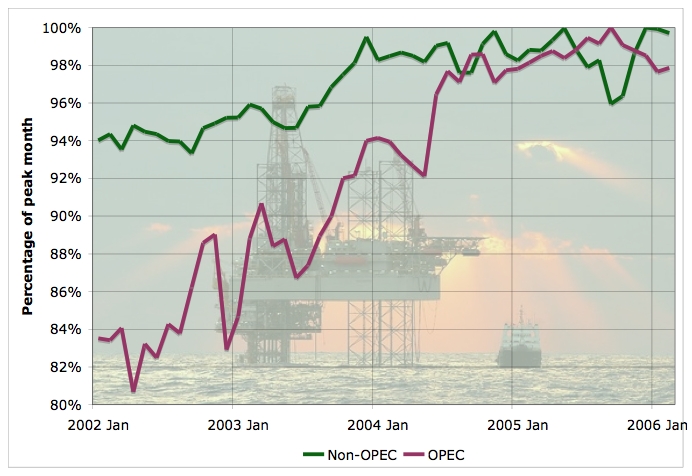
Non-OPEC production has been in a bumpy plateau for two years now (being within 1/2% of peak production on four occasions: Dec 2003, Nov 2004, May 2005, and December 2005). However, OPEC production was increasing rapidly through the middle of 2004, then slowly through September of 2005. Since then, production has been declining. It's too early, I think, to call the decline a trend, rather than a typical chunk of noise in the production curve, but it's been going on long enough to start to make one scratch one's head and want to investigate further.
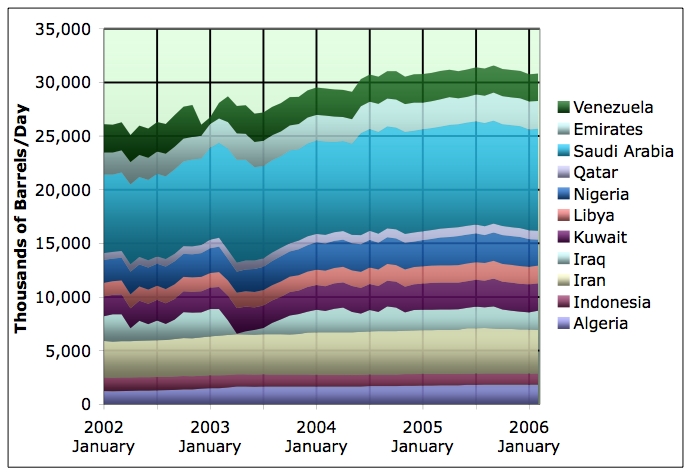
If we stack all the production profiles for the OPEC countries we get this:
This graph makes it clear that most of the short term wiggles in the OPEC production total are caused by the gyrations of Iraqi production, but longer term trends are harder to discern here.
Instead, let's try plotting the curve of each country's production as a percentage of its peak month:

Ok, still rather tough to see what's going on in this curve-knitting soup. But it did inspire me to separate the OPEC countries into two groups. I'm calling them the regular OPEC producers, and the irregular OPEC producers. The regular ones have that name because their production profiles all follow an approximate common pattern. The irregular ones are so named because they all dance to their own individual pipers, unrelated to the common pattern.
First the irregulars:
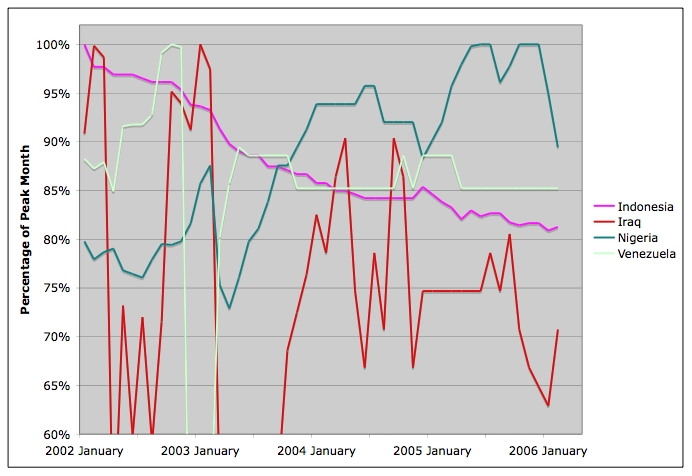
The case of Indonesia is pretty clear: they have peaked and are now declining at a very healthy rate of knots. The others are all cases in which production is noticeably affected by internal political factors of one kind and another. Iraq is the most severe, with production all over the place depending on the relative success of insurgents and coalition/government forces. Venezuela still hasn't restored production to pre-coup-attempt levels. Since there are huge reserves there, it is hard to view this as any kind of permanent peak, as opposed to a reflection of ongoing political developments. Nigeria was steadily increasing, but the political problems that have started to affect oil production in recent months seem quite severe (see Dave's nice summary) and it's not at all clear that they are transitory, so I have placed it into the irregular group also.
The rest of the OPEC countries (the regular ones) have these production profiles:
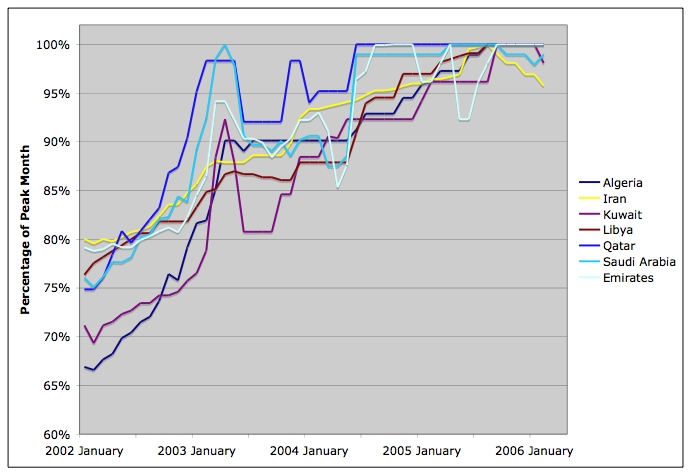
As you can see, these countries have the common pattern of steadily increasing production in the early years of our period of interest, followed by each hitting their individual plateau production. The date of that plateau varies from mid 2004 to mid 2005, but what is significant is that no OPEC country has increased production after September 2005! That's the latest that any of these countries hit their individual production plateaus. And a few of them have declined a bit (Iran looks most noticeable in this respect, though whether this is an additional form of sabre-rattling or due to purely technical factors is unclear).
And that's a key part of the story about why OPEC production has been declining for the last six months. No OPEC country has been both willing and able to increase production to offset disruptions in Iraq and Nigeria.
So which is it: willing? Or able?
Past coverage relevant to the plateau:
- Plateau continues, aided by outages...
- Plateau Update
- Cigar Now?
- Missing Barrels
- Close, but no cigar
- November Statistics Updates
- IEA Monthly Report for December
- Refining the Plateau
- Can Acts of God and Bush Explain the Plateau?
- November IEA global production
- Happy Peak Oil Day?
- Where Supply Increases Come From
Contact
- Content: editors at theoildrum dot com
- Tech support: support at theoildrum dot com
License

This work is licensed under a Creative Commons Attribution-Share Alike 3.0 United States License.
They also risk that the price will go down. And if it does go up because of this very supply being withheld from the market, doesn't putting it back on the market lower the price by about the same amount?
This hoarding issue comes up all the time and I wonder if such conspiratorial manipulation of the market is more trouble than it is worth.
Remember recent reports that Goldman Sachs was buying warehouse space in Amsterdam and millions of barrels of oil to store? A VLCC supertanker holds 2 million barrels. Those things are huge. How was Goldman planning on storing the oil - in actual barrels? On pallets, moving them with forklifts? How much warehouse space does Holland have? And two million barrels, well, that's about 35 minutes worth of oil.
Only the Saudis and maybe the Russians could hoard that much. Someone made light of the fact earlier that Ghawar is a great place to store oil, so the Saudis would be pumping it out to pump back in. Good Idea.
But I'm still open to hearing how this hoarding thing might work.
Sincerely,
Lee Raymond
Ah, but they don't have to supply the whole world, or replace their entire production. The rest of the world will still be producing. They will still be producing. There is no swing producer any more, so a few million barrels either way can make a big difference.
The question was if they are hoarding some oil. I think they could be. Surely they'd want to replace the oil they released during the Gulf War, wouldn't they? Just to be prudent.
The food in my neighbor's refrigerator is just that, in fact I don't know what's in it, nor have I ever even seen the refrigerator. But if I'm starving, hey, now my neighbor is hoarding.
The Saudis or the "speculators" weren't doing anything wrong until gas hit the still ridiculously low price of $2.90/gallon. Now they are hoarding. I think this might just be another case of Americans needing something or someone to point a finger at.
That's a big YES in my book.
The us is accused of insufficient savings. the spr is one of the few places where the us is actually storing something for future use that is likely to have value at that time.
A hidden fund or supply stored for future use; a cache. Or To keep hidden or private.
It's not really hidden, so you could argue it's not a hoard. OTOH, it certainly is "private," in that not just anyone can use it.
Personally, I don't see anything wrong with hoarding. As long as it's not carried to extremes, anyway.
i think politicos try to argue against that kind of small sacle hoarding, and set as "bad" buying extra containers & etc.
as
Storing is to Hoarding
Hoarding has a connotation of secrecy. Hoards are hidden, stores are not. Everyone knows about our SPR, but no one knows exactly how much the Saudis have.
I would think that the amount you need to be able to store to affect the price would decrease as the demand gets close to the supply maximum.
I guess it all depends on why one is storing the oil. If you really want to have a buffer, or a strategic reserve -well you need a hell of a lot of storage capacity. If you only want to affect price as the supply/demand ratio goes to 1, you may not need so much.
Personally, I think their anti-peak propoganda over the last 12 months tells us that they already know.
hint, hint...
If I stumble upon any references or links to / about it I'll post them at TOD, can't even remember the company's name atm, sorry.
This five month period of decline wouldn't be much of a concern if we didn't knew that discovery peaked in 1961, and if professor Bakhtiari hadn't written that alarming piece in the Peak Oil Review.
If Iran is permanently on the decline I do not see any other OPEC country capable of filling the gap.
Peak Oil Review Vol 1. No. 7
Scroll to the end of the file.
They have a burgeoning , young population.
They need to keep the lights on
They need to sell oil and reduce internal consumption itn order to carry on selling oil.
The alternative is an econmy based upon exporting carpets and pistachio nuts
I don't know if nuclear power is really needed in Iran. Still, they have some considerale reserves of Uranium.
They are pumping as much gas as possible into their oil fields to keep oil production up. Mexico uses Nitrogen, Iran uses Natural Gas.
In the first four months of 2006, we have seen: (1) new record high (nominal) oil prices; (2) declining US petroleum imports; (3) falling world oil production and (4) in today's NYT, a headline saying "Energy Crisis."
IMO, we should all base our plans on the following three assumptions: (1) US discretionary income will drop by at least 50% (probably closer to 75%); (2) gasoline prices will go to more than $6 per gallon and (3) your current household income will drop by 50%.
I try to think like my grandparents - they were frugal, and left an investment to their children when they died. If they bought something, they bought ONE, took care of it, and kept it forever. Of course, things were not made to be disposable then either. People do not realize how much engineering goes into reducing the cost and time of assembly, as opposed to making a better product. We see the advantage of a lower cost item, but not the disadvantage of having to throw it away after a very short lifetime. I have an old Emerson window fan - all metal, with oil cups on the bearings. Try to find a quality fan these days - half-decent ones can be found, but they are pricey!
Science usually agrees with your statement above and call it "parsimony" or "Occam's Razor". See Wikipedia's definition of parsimony.
http://en.wikipedia.org/wiki/Parsimony
In science, parsimony is preference for the least complex explanation for an observation. This is generally regarded as good when judging hypotheses. Occam's Razor also states the "principle of parsimony".
In systematics, maximum parsimony is a cladistic "optimality criterion" based on the principle of parsimony. Under maximum parsimony, the preferred phylogenetic tree is the tree that requires the least number of evolutionary changes.
In biogeography, parsimony is used to infer ancient migrations of species or populations by observing the geographic distribution and relationships of existing organisms. Given the phylogenetic tree, ancestral migrations are inferred to be those that require the minimum amount of total movement.
Parsimony is also a factor in statistics: in general, mathematic models with the smallest number of parameters are preferred as each parameter introduced into the model adds some uncertainty to it. Additionally, adding too many parameters leads to "connect-the-dots" curve-fitting which has little predictive power. In general terms, it may be said that applied statisticians (such as process control engineers) value parsimony quite highly, whereas mathematicians prefer to have a more predictive model even if a large number of parameters are required.
We in the west will get by on less money. It's the psychological effects of peak oil I fear.
I expect to see infationary deflation, i.e., rising food and energy prices, offset by the massive deflationary effect of millions of people trying to unload highly leveraged assets. Or, to put it another way, for those who remember the Seventies, just assume that trends that we experienced then, stagflation, periodic three fold increases in oil prices, etc., never ended.
"Opera windows" on hybrids?
Well one thing to be thankful for is that there is no sign that polyester clothes are making a return.
In a world where everyone is holding dollars, expanding the dollar supply is a world wide tax.
Prices going up will just mean that I have to walk far more than I would. In Huntsville to walk anywhere in my area is to take a one half to two mile hike where cars are the norm and walking folks are just like bugs flying in the air, messy bits on the windsheild. I have hiked across part of the city about 6 miles and not even gone but less a 3rd of the way north or south.
I have warned my brother but he want's to get in the speculation house buying market. Buy, fix it up, resell it at a profit. In Huntsville It might just happen, the big money in this town is the Federal Government via the Army, and NASA. High Tech and Low tech companies are here to stay for the forseeable future, even if the rest of the Country starts to fall down a bit.
I am moving to a small town pop: 13,000, For a while the house I will be living in will be within a mile of most every place I'd want to go. If I ever move I'll pick up somewhere or go somewhere, or just stay in the small places. Don't know don't care right now. Just know that the next time I move, I'll have my stuff on my back and not in a minivan.
Great job leading us right to the kernel of the PO case here, Stuart.
Can one infer anything about this from the data?
It seems like we must attempt to read minds somehow, as so many statements come out from nations and corporations about supply issues, problems, concerns, and possibilities.
Some of the satements seem contradictory, but may not be entirely so.
Various constraints on refining capacity, rising demand for product, geopolitical complications, and influx of dollars into commodity speculation are real.
It seems to me that there are many people in producing nations and corporations who still do not want to address the issue of Peak Oil objectively, and who certainly do not want any objective examination of their own assets, or even of potential for new finds.
Petroleum markets have gone into a "contango" (did I get that word right?) mode. Demand has been meeting or exceeding supply for some time now. Coupled with this are the very powerful "fists" of military and geopolitical machinations to control existing supplies of oil.
The combination of these two things (markets and geopolitics) confirm in my mind that we are just passed peak, or on a (possibly short) bumpy plateau, or are very near peak (within 3-to-5 years, say). The research done by Campbell, Deffeyes, and others seems to me to be confirmed by the behaviour of the nations and corporations around petroleum.
But are the key producers unable, or unwilling to ramp up extraction and production -- or neither, or both?
If I was sitting on a large quantity of oil, I would want to dole it out carefully and as conservatively as possible. I'd want to be able to manage the technical aspects of extraction very well, and also to get the greatest financial and energy/manufacturing potential from the resource as possible. I'd also be very worried about others trying to gain control of the resource.
I would not want to invest heavily in infrastructure to extract petroleum faster or to refine it faster.
So, maybe "unable and unwilling" to ramp up extraction of petroleum fits best...???
As a matter of fact, I am starting to form a certain suspicion that much of the whole reserves 'increase' in the 80s on was just a simple way to mask the short term plundering which was going on.
And like much plundering in history, what happens when you run out of new places? It is a sort of chicken and egg problem - what comes first, the collapse followed by plundering, or plundering followed by collapse? In this historical case, I am pretty sure of the order.
But like so many people reading this, I never expected it to really happen in my life time. On the other hand, I never doubted it would happen.
First a serious question, and then time for a brief laugh:
Serious: What thehell happened in first quarter of 2003?
http://www.theoildrum.com/uploads/12/opec_production_stack_feb06.jpg
Notice that Venezuela led with a downturn in last quarter of 2002, but then ran counter cyclical to all other OPEC producers who had any movement at all (thus leaving aside the "flatliners" Iran, Indonesia and Algeria)...every other OPEC country dipped quiet noticably opening 2003, except, as mentioned, Venezuela...refreash my memory, was this an OPEC cut, willfully planned, and if so, why did Venezuela run ahead of it? It does stand out.
Now for the laugh:
http://www.theoildrum.com/uploads/12/opec_plateau_feb06.jpg
hee, hee, hee....I am assuming your going to leave this one on the cutting room floor if your going to do any public presentations! :-O Could you see it now, just as the overhead kicks this slide up on the wall, the presenter says...."Now as this chart makes clear...."
hee, hee, hee,
Thanks for something to cheer up my late night TOD visit....:-)
Roger Conner known to you as ThatsItImout
The local conservatives in Venezuela figured that they could take over and carried out a coup. Unfortunately for them they started quarreling over the loot, some members of the armed forces decided that they weren't going to get cut in, and the coup collapsed when the unit holding Chavez changed sides. The US didn't dare have a civil war in Venezuela at the same time as the invasion of Iraq and we gave sanctuary to the coup plotters rather than forgo a war in Iraq.
Also, the rest of Latin America might have joined an embargo on exports and brought the price of oil up to 200$ a bbl if we continued to support the coup plotters in Venezuela or if Chavez was killed.
Can you recommend some sources (preferably online) where it would be possible to read up further on this?
The coup collapsed when- And so it went: 4:38 p.m., disturbances break out in the popular neighborhoods of the capital. 4:56 p.m., a military junta leader admits on the radio that Chávez never resigned. 6:40 p.m. "Two national dailies and a private TV station have imposed an absolute news blackout."
And, the most crucial turning point of all: rank-and-file soldiers and officers at the nation's largest Army Base in Maracay reject the military junta and begin the counter-coup (Maracay is the base where Venezuela's F16 fighter planes are hangared, and a nervous Washington began worrying about the oil fields that supply 15 percent of the United States' imported oil.)
The Bolivarian Revolution of Venezuela's poor majority has won back more, so much more, than its own country. It has delivered Washington's policy of simulation against democracy its first major defeat, and the dominoes have only begun to fall.
But perhaps even more significantly, the people of Venezuela created the conditions under which Authentic Journalism has now wrestled the microphone from a discredited commercial mass media.
No victory is final. As journalist Bill Vann notes, "An armed uprising that failed preceded the September 1973 military coup that brought down the
Popular Unity government of Salvador Allende and inaugurated General Augusto Pinochet's reign of terror against the Chilean working class. That abortive action, just like the recent move against Chavez, showed how vulnerable the government was to a coup. It also provided a dress rehearsal for a real confrontationwith the masses and allowed the principal figures in the military to determine which units could be relied upon and which could not."
This coup was to precede the invasion of Iraq.
James
You're hard work is much appreciated by me. Looking forward, how can we determine the global geologic depletion rate, and subtract from this gross depletion:the 'logistic' depletion amount that is starting to politically occur?
What I am thinking is that a 'natural' geologic depletion rate may allow a relatively smooth last half of the Hubbert Bell curve, but the logistic interference by all concerned parties will probably cause wild extraction distortions that in the aggregate will vastly steepen the downslope. Thus, I believe ASPO's Energy Depletion Protocols offers the best chance to dampen logistic interference. Sadly, the MSM has not reported any discussion of ASPO's idea-- maybe we will read more from Putin's upcoming G8 'Energy Security' conference in July--but I am doubtful.
Bob Shaw in Phx,AZ Are Humans Smarter than Yeast?
I would like to expand on my prior post to further illustrate logistic depletion. Consider the recent posting that talked about how Saddam Hussein wrecked many of his oilwells: this possibly unrecoverable oil in effect steepens the downslope. Another example: the recently disclosed technical mismanagement of Venezuelan extraction; again this steepens the downslope. Last season's hurricane damage in the GoM caused some previously working wells to be shut-in because the repair cost was greater than the possible profits. Again, this steepens the downslope. The violent conflict in Nigeria with the consequent energy wasting adds another kicker to the downslope. The explosive destruction of Iraqi energy infrastructure; the same last winter for the Gazprom gasline to Georgia,... on and on that all helps to steepen the downslope faster than just a 'pure' geologic decline.
Jay Hanson, some time ago in his Dieoff_Q&A forum, talked about postPeak behavior among the detritovores as being largely reduced to: "if I can't have the oil, then you cannot have it either." Recall that when Saddam's retreating troops left Kuwait they torched the Kuwaiti oilfields. Iran would do the same if they thought the Americans would attack and win. Hugo Chavez and Bolivia's Morales would do the same if they were attacked, and I think this will sadly happen over the course of postPeak time. How long before Canada and Mexico disable export pipelines to America in protest of NAFTA?
In short, I think detrito-terrorists will be out in full force all over the world as we go postPeak-- and this aggregate effect will increase the Hubbert Downslope.
Bob Shaw in Phx,AZ Are Humans Smarter than Yeast?
Oil not currently being extracted shouldn't be seen as steepening the downslope, in my opinion (though of course, by some measures it is) - that is true detritovore thinking about how to measure profit and loss. Basically leaving it in the ground instead of burning it is the final goal anyways, right?
Personally, I tend to be more or less supportive of a voluntary reduction in oil infrastructure, but then, that is the sort of optimistic fantasy I gave up on around 1982.
These days, I pretty much plan things around reality substituting for the idea of 'voluntary.'
The people shutting in the oil are demanding US/Industrial
World living Standards (shorthand), and since oil can't be burned twice, whatever happens when the oil resumes it's flow that oil
wealth will not be coming to the US.
James
Thxs for responding. Please remember Ruppert's warning, "The Paradigm is the Enemy". Eventually, I have no idea when, and including the BIG IF that we can somehow avoid the full-on ICBM gift exchange: all efforts WILL BE biosolar oriented because the present paradigm will be kaput--Detritus Entropy rules all.
In the past civilizational declines, those that saw the handwriting on the wall could retreat into the safety buffer of the wilderness; the 'distance' from the urban mayhem was their 'protection'. The Mayan collapse is a good example.
Not so today; there is virtually no place to run. Thus, to prevent continental Easter Island mayhem with total biodiversity depletion: it is required to build Large biosolar habitats. A land lifeboat with no renewable food supplies is pointless-- thus the growing secession movements in the NE & NW sections of the US.
The creation of Earthmarine zones to protect these biosolar areas is the only way to create 'distance protection' from the hapless detritovores. I believe the richest people in this country could easily afford to jumpstart such habitats [consider R. Rainwater's idea of for-profit survival areas], or $$$-induce Congress to let this happen and let the taxpayers provide for the Earthmarine protection in the normal operation of 'socialize the costs, privatize the benefits'. Of course, the wealthy will need lots of helpers; RR's on-site horticulturist, for example.
If some kind of pandemic gets loose reducing headcount, or ethnic strife begins over illegal immigration, or the dollar and stock market collapses; any of these events can act as a catalyst to start the rapid shift to the new paradigm. Even the rich realize that billions invested in the old paradigm is pointless-- it is the real assets of good food & water, and plentiful biodiversity from a large contiguous habitat that will provide the best survival chances for their children, and the children of their helpers.
Jeff Vail's article is an excellent example of what needs to be done, and is fully in harmony with what Kunstler, Ruppert, the PostCarbon Institute, and numerous others advocate for a postPeak US. The Dieoff is inevitable, the goal should be to optimize the squeeze thru the bottleneck.
Bob Shaw in Phx,AZ Are Humans Smarter than Yeast?
Consider Zimbabwe's sad, poorly planned transition to biosolar sustainability:
http://www.swradioafrica.com/pages/buckle030506.htm
They are doing everything the hard way: I am unsure if this is due to Pres. Mugabe's mismanagement or willful manipulation by economic hitmen from the IMF and other elite 3-letter organizations. Regardless, once the Dieoff mayhem bottoms out and the remaining population is on its last legs, the opportunity exists for many wealthy elites to forcibly emigrate here and build a very large biosolar habitat. They could easily afford to hire Earthmarines from here for protection as the surrounding countries are rapidly becoming destitute themselves:
http://www.blackwaterusa.com/proshop/
I would expect similar paradigm transitions to occur all over the planet, but obviously carefully planned transitions will greatly reduce violence and infrastructure decimation. Time will tell.
Bob Shaw in Phx,AZ Are Humans Smarter than Yeast?
http://www.blackwaterusa.com/proshop/
Nice work, as usual, but I think there may be one small problem with your numbers. On the lead graph you did with the stacked OPEC numbers, the caption says: (believed to be all liquids).
Just eyeballing Saudi Arabia, it looks like it is just slightly under 10 million barrels. I'm assuming you are using the t11a.xls spreadsheet for these numbers. This spreadsheet uses only Crude+Lease Condensate. The world total for the t11 series only amounts to about 73 million barrels per day. All liquids would have to at least include the t13 table number for Saudi which is 1.225 million barrels per day of NGL production. This would put their "all liquids" number up towards 11 mbpd.
The total OPEC number should be at least 33.5 mbpd.
Despite the name, they are not actually liquids at room temperature. They cannot be used for transportation, therefore I agree with Stuart that they should not be included with "liquids".
It is quite conceivable that Nigieria will reach a political settlement/stability in the delta area in a time frame like three years, for example, and regain previous production levels - but depletion in other areas remains a constant, and returning to old production levels in Nigeria merely offsets the declines in other areas not suffering from turmoil.
Of course, the precise timing will be known in the future, but as said for a while, peak has arrived, even if discussion is still open about the details.
The decline rates have always been offset by new discoveries - there simply haven't been any of note since my teenage years. The Earth really is a finite sphere after all, and we are just learning what that means in another area.
Well, some of us - others seem to have read all of Faust, and are still planning their future on all of that undiscovered wealth underground. Who knows? maybe Mephistopheles is the true inspiration for people who believe in endless amounts of crude.
From top to bottom:
Iraq
Venezuela
S. Arabia
Iran
Nigeria
Kuwait
Emirates
Libya
Algeria
Indonesia
Qatar
This will visually isolate Iraq's rather messy production from the rest of the graphs as well getting Venezuela's blip out.
The remaining stacks will then roughly be from largest to smallest production which I think is a nice way to present the information. Just my 2 cents.
The United Arab Emirates will increase its oil production capacity by 35 percent within the next five years to 3.5 million barrels per day, reports said quoting the oil minister.
A drop in the bucket perhaps??
From late 2001 until the present they have increased production from 2.0 to 2.6mbpd, so another .9mbpd in the same basic time frame is maybe an optimistic projection, but probably not unreasonable.
I was in Abu Dhabi in 98 at the Gulf Emerates Hotel between the Armed Forces Officers Club and the Grand Mosque (then under construction) boozing it up. A German Geologist claimed that they (the firm he worked for) had recently discovered reserves that would double total known reserves for Abu Dhabi. This reserve feild was located in a vast area currently under the feild being exploited, double stacked as it were. Is this type of find credible???
Regards
Other than that thanks for the answer....Regards
very good as always!
Venezuela still hasn't restored production to pre-coup-attempt levels. Since there are huge reserves there, it is hard to view this as any kind of permanent peak, as opposed to a reflection of ongoing political developments.
I was wondering, what you would say about the following article concering your statement above:
http://www.rigzone.com/news/article.asp?a_id=31765
Venezuela has a couple hundred billion barrels of extra heavy oil which it should (eventually) be able to produce with enormous investment - the stuff is kind of one step up from tar sands. So the recent production declines are not due to lack of exploitable reserve base.
I would guess no OPEC country is able to increase production. At least, not immediately. Perhaps they could, given time to build new infrastructure. But I think they're producing all-out for now.
Including Iran. They've had trouble meeting their quota for awhile now. And they've made clear that they'd rather produce their oil slowly than allow IOCs in. They see it as saving some of their birthright for their children, so I wouldn't expect any increase from that quarter, war or no war.
Get ready for the new coal-based economy, everybody...
How long can you hold your breath?
http://www.grist.org/news/maindish/2006/02/16/reece/
made my day
You can "fly" all the way up the Appalachians, at any elevation you choose, and the 3D effect is stunning, beautiful, and scary when you encounter long stretches of despoiled terrain.
To get an idea of the scale of Powder River coal production, do the same at 43 degrees, 38', 40" N, 105 degrees, 14', 39.4" W, and zoom as much as you like. Then go up to 20 miles elevation, and trend northward to see the rest of the coal pits.
This is the effect of 1 billion tons coal production/year. It if takes a billion tons of coal to produce 1.5 billion barrels of oil, then Fischer Tropsh, etc., are going to dramatically increase the devastation, and very quickly.
Other than the first OPEC embargo, has there ever been a case where a country intentionally held back production for a time period consistant with this? I would think the pressures to produce at near maximum in the near term are very high, making it difficult to willingly reduce even if that made sense. I would think the vast majority of reductions in output are forced by circumstances beyond their control.
The OPEC graph shows too much similarity, so if they are able to produce more, they must be cooperating on a program to hold back production. I don't really buy that. Of course, this is OPEC, so perhaps they are cooperating, but it seems as if they lack the cohesion they had back at the embargo.
OTOH, you could look at those graphs and ask why they would all level off about the same time. Can someone come up with any physical reasons for that? Different fields of different sizes and outputs, all following the same shape. Is it reasonable to assume that's because it's in percent, and is therefore another way of looking at a HL effect?
I'll have to vote for an inability to produce more.
I thought that was the whole point of OPEC: to hold back production to maintain a desired price level. Do you mean there has never been a case of holding back production while prices are unusually high?
No one commented (in this thread) on the odd shape of the graph of Saudi production. The pefectly flat stretches suggest either (1) the numbers are fake, or (2) they can precisely control production, which suggests they have spare capacity.
This isn't the first time production has levelled off. In the past when it happened it eventually resumed climbing again. This plateau is still not in the rearview mirror so it seems premature to draw any real conclusions.
I guess what is unusual this time is that it's happening while prices are high.
It could be artifically controlled.
It could be BS data.
It could be some other limitation in the system.
Or maybe 9.5Mbpd is just flat out, and over 1 1/2 years they've been able to hold it up.
They probably know at least a month in advance whether or not they are going to raise or lower this output by 100,000 barrels and have plenty of time to make adjustments.
Most of the numbers for the "stable" OPEC countries look like this. I think they've been playing this game for so long that they just know what they are doing.
You can't really fake the numbers because someone has to buy the stuff and someone else ships it to the buyer.
It could well explain the artifical-looking nature of the output graph, but in the end that may still mean that their maximum output is on average around this level.
The quotes I like are at the end:
When former US Energy Sec. James Schlesinger, who moderated the forum, asked the officials for their views of concerns that the world is approaching an oil production peak, Naimi replied, "I believe there are at least 14 trillion bbl of reserves left, 7 trillion of which are conventional. With advancing technology, we'll produce more of it."
Bodman said: "Eventually, we'll run out of it. We had peak oil production in the US in 1970, and it's been declining ever since. I am comfortable that the nations which supply our country are working hard to keep oil coming to the marketplace."
Schlesinger said M. King Hubbert's theory about peak oil and depletion, while technically sound, failed to consider developing technology, availability of tar sands, and other near-substitutes, and the impact of higher prices on increased production.
Nevertheless, he said, the idea that the world's crude oil supplies are finite should not be disregarded.
http://www.marshall.org/experts.php?id=69
Bruce from Chicago
I'd say he is more one of us, then a conservative propagandist. He served as a Republican CIA chief and then as Energy Chief under Carter.
http://www.environmentaldefense.org/article.cfm?contentid=3804&CFID=11601392&CFTOKEN=5618325 2
On the other hand, Naimi and Daniel Yergin where both in maximum rose colored glasses mode. When those who believed the optimists realize that it was not as simple as they suggest to maintain this oil soaked lifestyle, it will be too late.
It keeps me up at night to read such misdirection.
First, you must believe the planners have heard of peak oil and have the sense to believe in simple physics. That means they must balance their future against the future of the world. The question they must be asking themselves is how will we provide for our quickly swelling population? Oil production provides the revenue that essentially buys off the restive population, particularly in Saudi Arabia. If OPEC has the simple epiphany that production levels and price are an inextricably linked ratio, they might decide they can level off production while reaping the same level of cash infusion. A slow-down in production will help extend the life of reseviours and extend the life expectancy of the respective OPEC governments.
Of course, they must also consider the heavy hand of imperialism. The US may interfere in their affairs. Question is: Can the US handle a multiple front war? I think not.
Here is where the thinking of both the western world and a perspicacious OPEC could intersect. As oil men, the US administration must know of peak oil. They know that at some time the population will learn the truth. It may be in their interest to allow OPEC to back off production slightly with the intent of forcing westerners to conserve and develop alternatives.
On OPEC's part, that scenario will ensure that oil will always be in the energy mix at a price that will allow them to continue to buy off their population.
For the west, we would see a gradual, moderately painful, transition to alternatives, most likely those which are easily integrated into hands of the elite. I.E. coal, nuclear, tidal, and wind farms.
Of course, this is all predicated on humans being the swell, rational creatures that we know them to be.
The Saudis and the other Gulf states have been remarkably compliant in turning on and off supply at US prompting.... until recently!
I could never make much sense of the Saudi long-term strategy of keeping oil prices low. If that has now changed, and they are withholding supply, despite high prices (and the extraordinarily flat levelling off of the Saudi production numbers lends itself to that interpretation), there are two things which could be prompting them, and perhaps both are operative :
- they are aware that, if they increased production, they couldn't maintain it for long anyway because they are not far off peaking
- they no longer feel undying loyalty to / are scared to death of the US, after the Iraq adventure.
If that is what they are doing, then it's very smart : a managed peak will surely be far less destructive.The US government has long supported the House of Saud, and vice-versa. Holding down oil prices makes the US happy, and assures Saudi Arabia of continuing American support, military protection, and ongoing purchases of oil.
A managed peak would be far less destructive: if they can continue to manage it. The fact that the Saudis have been so reliable a source, and a good swing producer, has made the world depend on them heavily (Matt Simmons is very laudatory about the Saudis' reliability).
This all works fine as long as 1) the will to be reliable is there [read: Saudi government remains stable] and 2) the ability to produce remains high. If there is a sharp fall in production capability, they won't be able to manage anything. And the world won't have any other large swing producer to depend on.
Oil prices fall on surprise inventory build. Gasoline inventories rise 2.1 million barrels. Crude oil stocks up 1.7 million barrels.
I don't really think that's all that big of a surprise. There was an inflection point in the curve last week as refineries came out of turnarounds, and I am sure people are conserving more at these prices. I had been saying that there was a decent chance of a build this week.
RR
More fuel for Westexas' theory....
On a four week running average, total petroleum imports for the past week were pretty much flat to the week before--and both are down about 7% from the week ending 2/24/06.
Again, consider the fact that we are seeing flat to declining imports, versus rising oil prices.
Back to Stuart's comments about flat OPEC production, remember that flat production = falling exports, since these countries have rising consumption. Just consider the fact that the average Saudi family has seven kids. Consider the math. Four people (two couples) produce 14 children (seven couples), who marry and produce 49 children?
May I respectfully interject some of the following points that may buttress your position?
1. Crude tankers the size of the Bridgeton at 345k tonnes displaced carry alot of crude and the difference between smaller loads being exported upon smaller carriers at or towards the end of an "oil exported accounting month" may very greatly and therefor require quarterly smoothing of either exported or imported monthly data.
2. When tensions rise in Persian Gulf the number of vessels awaiting cargo at anchor off of Fujairah UAE awaiting transit into the gulf goes up. This for mariad reasons such as Loyds of London refusal to allow transit without increased insurance against Iranian beligerancy.
3. Periodic maintenance and weather are factors and considerations with regard to analysis of very small fluxuations in export data as well.
4. Analytical side note: Countries/ Leaders (Egypt/Anwar Sadat) have been known to start wars they know cannot win. This is a Case Study at all the National Defense Universities and War Colleges.
Saudi Arabia is in trouble:
Source: U.S. Census Bureau
http://www.eia.doe.gov/emeu/international/oiltrade.html
RR
There will be more blending components on hand this year because ethanol has to be blended at a local facility. Also Other Oils should be higher then too, but they are not.
Did you fill up this morning?
It's very easy for people to look at production as being constrained only by geology and field-level issues (number of rigs, international tensions, etc.), and ignore the fact that except for some relatively minor demand balancing and SPR changes, worldwide oil production IS demand.
Clearly, 'fear factor' is not at work, or at least not here. If the us is buying less than before while world production is flat, our influence on the world market is to reduce prices vs last year (well, at least to some extent; no doubt our increase in product imports means somebody must be buying crude on our behalf). Therefore, prices must be high on account of spirited bidding from others, eg asia - it is easy to forget we represent only 25% of world demand. And, this makes perfect sense - asian demand is driving all commodities these days, eg copper, steel, cement, wood, and gold. (The latter might be getting an extra boost as surging petrodollars look for dollar alternatives.) Even forgetting po theories, we should expect rising oil prices in the face of flat supply, whether temporary or not.
It appears some analysts at least got it wrong.
Total imports (product + crude) down, consumption up, an average of 267 000 barrels per day drawn from product stocks and yet gasoline stocks increase ??
Natural gas liquids produced are flat or slightly declining year over year alltough the price differental between nat gas and crude must be at an record high !!
Best to say stocks are marginal, supply is tight and production constrained now. Else you look pretty foolish when, or if, TSHTF.
I think the FEDs learned something from the Katrina debacle.
RR
A combination of independent business organizations formed to regulate production, pricing, and marketing of goods by the members.
As some will recall, OPEC basically dropped it's quota system last year. For example see OPEC: Quotas "Obsolete". Lately, all indications from their meetings is that they are pondering the only decision they can make--to cut production based on perceived future demand. Never to increase it. Unable or Unwilling? I vote firmly for the former but with this caveat--
I would suggest that what we call "OPEC" is now a misleading, arbitrary grouping of oil producing countries. Some, like the UAE, Libya and Algeria, are in pretty good shape and most likely can raise production in the future--the regular producers. Others, as noted by Stuart, can not--the irregular producers. It's increasingly every country for itself. Looking at our definition of a "cartel", it seems to me that OPEC can no longer carry out any of the essential functions implied by that word.
This is not a criticism of Stuart's post. Rather, it is my interpretation of the hidden message behind it. Assertions from the beloved Ali Al-Naimi and others have become nonsensical and the reason is simple: OPEC is no longer a "cartel" but continues to act as though it were.
- I always wondered about the impact of the oil commodities markets on OPEC. Nymex established energy trading in 1980. Was this the start of the decline of OPEC's ability to regulate pricing?
- Matt Simmons wrote in "Twilight in the Desert" that OPEC and more specifically, Saudi Arabian, oil reserves are probably overstated. Others have said the same thing but they all agree that non-OPEC oil reserves are declining fast and OPEC has and always will have the largest oil reserves. As non-OPEC oil fades, couldn't OPEC rebuild their cartel?
Just an aside, I remember watching the big oil execs in front of the Congress subcommittee on C-SPAN, and I specifically heard Lee Raymond, then CEO of Exxon Mobil, say that the Saudis tell him how much the price of oil is and he says ok. Looking back on it, this statement could mean, the Saudis set the price for Saudi oil, but it could also mean the Saudis set the price for all oil. I am sure I heard him say that, I just don't know what he meant.Futures prices move up and down according to the balance between buyers and sellers of contracts at various price levels, just like every other commodity. Supply and demand. But if XOM just contracted to buy 100 million barrels from Saudi at $60, they are obviously not going to be in the market for oil on the NYMEX at $74. Then again what they got from Saudi is a different grade of stuff than what West Texas Intermediate is. Close, but not the same. It may cost more to deal with or they might get less good stuff like gasoline per barrel out of it. This is why certain buyers or refiners may or may not want oil from certain places. In other words, oil is fungible, but it's not exactly fungible, if that makes any sense.
But there's another way to think about it. All the historical forces at play right now argue for a free-for-all on a country by country basis. Why?
Each country must assess for itself it's own demand, what it is willing and able to produce and what it can export. Therefore, each country must consider it's self interests first in a world in which fossil fuels supplies are tight and will become more scarce. This would mean that the days of organizations of various types like OPEC are numbered.
Funny stuff. Well worth the read for those of you unfamiliar with the proceedings.
It was an entertaining hearing, I watched the whole thing. My impression was that the oil guys were trying to explain to the politicians how hard it is just to do the things they do right, and trying to rig prices is way beyond any of their capabilities even if they wanted to do it. It seemed like the politicians each had a pet theory about the oil business, and were searching for the information that would back it up.
I'm sure the BO lobby took Domenici et. al. out for a round of cocktails and a few laughs at the end of the day.
[Peakguy's positng of the EIA spread sheet was very helpful and illuminating as it gave a numerical picture to just how narrow this production range really is.]
Updated to most recent February 2006 numbers(May 3rd)
Thanks for the nice chart. But for all of our talk here on TOD about this current plateau, how do we know it is any different than the declines we see in '98 and '01?
We could also see the upper limit of the geological channel as somewhat flexible. Temporary overproduction is possible, but will bounce back to "normal levels" or a little lower.
The economic channel control the actual production inside the geological channel. Low demand makes the supply drop, but higher demand will not take the supply past the upper limit of the geological channel. At this point higher prices reestablish the balance.
In that graph we see three attemps to cross the upper limit of the geological channel. If we look the supply growth in 1995 - 1998, we see slightly exponential trend, and extrapolating it the production would have been over 85 mbpd in 2000. This would have been impossible, of course. Instead, there was a break in the growth rate. I would suggest that the drops in production in 1999 - 2000 were caused by both economic and geological reasons and the oil production might have had impact on the Asian economic crisis, too.
Essentially the same thing happens in 2000 - 2001. The production starts growing steeply and exponentially, and extrapolation shows that it should have reached 85 mbpd already in 2002. This was impossible and the trend broke again. Third time here was in 2003 - 2004 when the production growth was very high and wouild have taken oil supply over 90 mbpd by now. We can see these as attempted breaks upwards from the geological channel. But in fact the geological channel has curved downwards, the actual long range growth rate has slowly decreased.
Lok at the graph: each of the three attempts has been more short-lived and "steep". The price volatility has also increased. I see overproduction problems in 2003 - 2004, mainly in Russia. This caused backlash in 2005, ie. lower growth. The physical supply makes the hidden background of seemingly economical disruptions. Here we could make a prediction of an economic downturn in the near future nad oil prices dropping somewhat.
However I prefer this kind of graph to the one Stuart usually shows, which starts at a date which gives the illusion that the current plateau is unprecedented and that plateaus and even declines have not been seen before. I complained about that and then in response he produced a graph going back to the discovery of oil in the 19th century! All of the recent price changes were lost in a tiny little blip in the upper right corner. So I gave up after that point. Kudos to Oil CEO for his graph which puts current events into a bit of historical perspective.
As important as the actual Peak date is, it is material compared the need to address changes in corporate and social behavior.
- Mounting prices still not stimulating production, suggesting supply issues, not drop in demand
- The other peaks are clearly timed with economic setbacks or recessions, this one is in the face of ongoing growth
- This time, we know that the worlds most productive fields, just a handful but responsible for over 10% of production by themselves, are at or just passing their peak as we speak. They had been the backbone of world production for years
- Spare capacity of usable crude is generally considered absent. In earlier declines there was a lot of OPEC spare capacity, just reduced production
It is true that Nigeria and Iraq could produce more, so we are not at a peak of theoretical production, but we are also coming into hurricane season, so things could just get worse, and I doubt we will ever reach a time when political etc factors don't impact supply to some extent.No matter what, there are plenty of reasons to distinguish this production plateau from times past.
There is not one conclusive piece of evidence but rather a bunch of them:
1- prices is rising since 2003 like never before.
2- production decline in super-giant and giant fields.
3- only 1 barrel out of 4 comes from new production.
4- new supply is deeper, farther and sourer.
Worldwide, we have never been past the 50% of Qt mark, based on the HL analysis, until this year.
Several large producing regions--Texas; Lower 48; Total US; North Sea and Russia--have declined at or about the 50% mark and they have never shown production numbers higher than what they had in the vicinity of 50% of Qt. The only really substantial post-peak increase, in Russia, just made up for what was not produced after the Soviet Union collapsed.
Based on Deffeyes' plot, just as soon as we started down the slope on the other side of the peak, we saw: falling world production; record high nominal oil prices and falling US oil imports.
Since the top exporters are farther down the decline curve than the world is overall, and since I expect the rate of increase in domestic demand in the exporting countries to accelerate, I have been predicting that world net export capactiy will fall much faster than overall world oil production is falling.
IMO, the main reason that it works for large producing areas is that we consistently find the big fields first.
In any case, if you think about the physics involved, if you don't peak at 50%, you have rising production. So, if you continue to increase production as you go from 50% to 65%, just think of the decline rate, when you do decline.
One thing that is different today is the widespread use of horizontal wells, which allow operators to continue to produce oil at high rates from rapidly thinning oil columns. This gets back to my very rough analogy of water in a bottle. The rate at which you pour water out of a bottle does not affect the volume of water in the bottle. A lot of people are mistaking "high pour rates" for "large volumes."
should have nuclear power. I am a crazy evironmentalist
(who can't spell) and I think every country on the
planet should start its own Fast Integral Reactor
http://en.wikipedia.org/wiki/Integral_Fast_Reactor
These reactors were specifically designed to minimize
nuclear waste and this would turn the USA into the
saudi arabia of plutonium. Intergral Fast Reactors
actually consume plutonium. anybody over the age
of 40 is guilty of making a mess and not cleaning
it up. I want all you old people who created millions
of tons of plutonium to pay for an Integral Fast
Reactor so you can get rid of your mess. young people
already have to deal with global warming. It would
be nice if you old people would solve at least one
of the global problems you created.
if you don't think i am crazy go read
http://www.fromthewilderness.com
my other idea was to create a magnetic lift
track system to launch the plutonium into the
sun. using only electromagnets the plutonium
could power the system to lanuch itself off
the planet.
Request: could you guys post a list of the
countries that are declining like
the super field list but by country.
Question: what is the USA decline rate?
this site rules
What is a rate of knots? Is this a reference to knots as a unit of speed, nautical miles per hour? So an equivalent formulation would be: "they have peaked and are now declining at a very healthy rate of miles per hour"? That doesn't make much sense. I'm wondering if "knots" means something in the oil business that I don't know about.
I had never heard that one.
Are we at peak oil? It certainly feels like it is, or is it just me? Crude oil prices are behaving exactly as I predicted - another spring runup, this one more impressive than the last. That has been the basic trend for five years running. Each price top is higher than the last; every dip is higher than the previous dip. (of course, the mass media infames Americans by hyping the issue, although prices are not high even now by international standards; but our myopic land development patterns are a major factor here)
China is busy securing oil contracts in every remote outpost it can lay its hands on. One senses they realize the race against time vs. us and the rest of the West and are acting accordingly.
Here at home, Republicans are abandoning their core principle of "supply vs. demand" economics and are shamefully employing demagoguery over the gas price issue out of political paranoia. And they get their heads handed to them regarding the laughable $100 "rebate", which was nothing more than an act of bribery. Also, the hurricane season looms large like gathering storm clouds just beyond the horizon. Katrina's phychological effects will be felt in the markets like few events in modern times as we get closer to mid-to-late summer.
By the way, I caught the tapes of two events yesterday on C-Span. Roscoe Bartlett went at it again with his basic peak oil stump speech (why does it take a conservative Republican to do this? Just asking). Also, there was a talk at the Center for Strategic International Studies (CSIS) in which the last question directed at the three panel hosts was about peak oil and if they believe in it! Energy Secretary Samuel Bodman seemed skeptical of the theory. Saudi oil minister Ali al-Naimi (sp?) was sneeringly dismissive, and countered that the world endowment of oil totals 14 trillion barrels (I am not making this up). CSIS senior advisor James Schlesinger suggested that while peak oil proponents did not anticipate non-conventional sources like Canadian tar sands, the theory is based on factual science, and should be taken seriously.
Finally, a note of thanks to Stuart Staniford for the excellent graphics and other fine contributions. It is most appreciated.
3.39 and9/10
ouch!!
I will see $4.00 a gallon this summer, easy.
Not that I disagree - I am as pessimistic a peak-oiler as they come - it is just that if we all think natural market forces are the only thing at play here then we are naive.
A "settlement" of the fake Iran issue, some positive made up inventory numbers, forward selling of the SPR on the futures market, and a few other dirty tricks, and the FED can probably move this market any way they want.
I believe that our government has been planning for peak oil for many many years, and that they are most definitely not just going with the flow. They have some surprises for us in store - e.g. fixed prices combined with rationing for one.
I used to have a book called "The Experts Speak" that listed hundreds of expert prognostications concerning a variety of topics. Respected and influential people who were in a position to know, who got things completely wrong - it was actually quite funny...I wish I could locate it. Anyway, Dan Yergin will have a position of prominence in a future edition.
If you are on a mountain top, you can shift the top a short distance by moving dirt from one place to another. But that's kind of cheating as far as looking at the slopes and guessing exactly where cloud enshrouded peak actually is.
In June 2004 KSA turned on all the taps and immediately reached their peak. Was Russia's peak reached in Dec 2005?