Missing Barrels
Posted by Stuart Staniford on February 24, 2006 - 6:50am
HOUSTON -- From 2004 through 2005, the world produced almost 650 million barrels more oil than demand consumed, according to the accepted International Energy Agency model. But where are these barrels of oil?Let's have a quick look at the data for ourselves..."Little of this glut has shown up in observed petroleum stocks," writes Mr. Simmons, author of Twilight in the Desert: The Coming Saudi Oil Shock and the World Economy, in the January issue of World Energy Monthly Review. "In fact, as demand for oil continues to grow, daily usage rates indicate many key stock points are at historic lows."
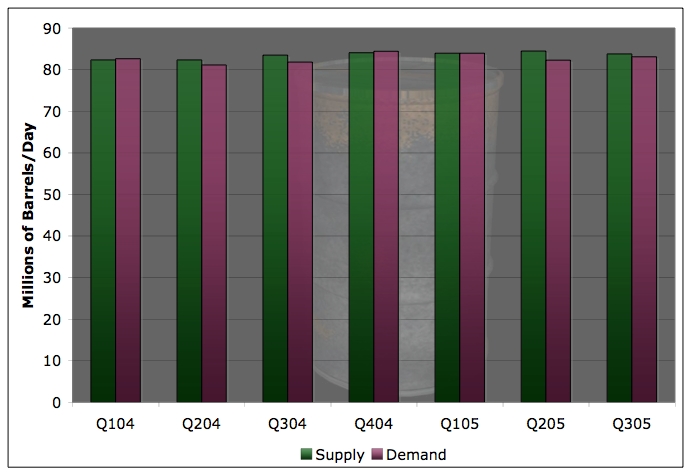
World oil supply and demand by quarter 2004 and 2005. Click to enlarge. Source: EIA.
You can see that there's something of a seasonal effect. Supply has been pretty flat over the last couple of years, but demand seems to dip below it each summer, allowing for some stock build. The EIA data breaks the stock build down. They separately record US stocks (both strategic and commercial), stocks in the rest of the OECD, and oil-on-water. All of that I lumped together as "known" stocks. And then there's the category politely named "Other Stock Draws and Statistical Discrepancy", which is either oil that they don't know where it went, or errors in the supply or demand numbers. So therein is the missing barrels (I assume, anyway). I plotted the net additions to stocks, both the known and unknown varieties:
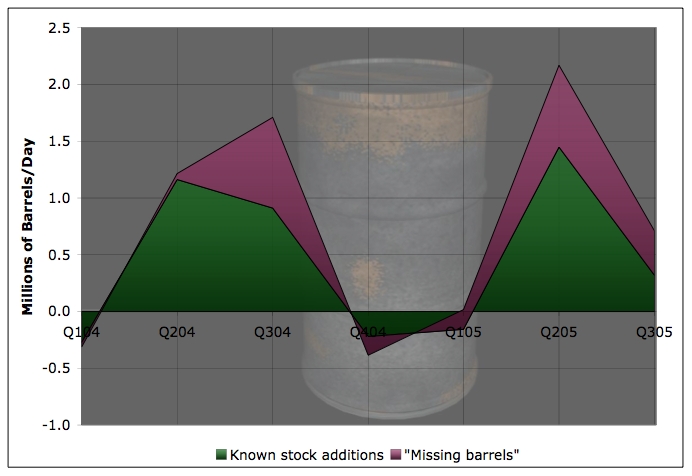
World supply in 2004 and 2005 going to known stock builds, and to "Other Stock Build and Statistical Discrepancy". Click to enlarge. Source: EIA.
The seasonality comes through, but it's also clear we are building stocks in the known area, and also oil keeps going into the unknown category. This final graph shows the cumulative additions to both kinds of stocks in gigabarrels from the beginning of 2004.
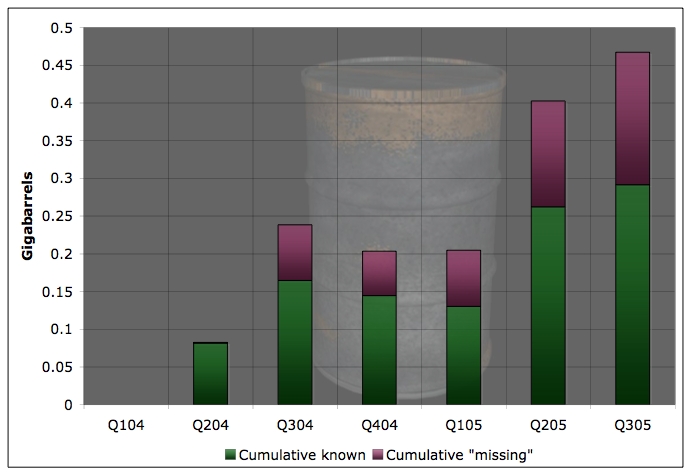
Cumulative stock build in 2004 and 2005 in known locations, and to "Other Stock Build and Statistical Discrepancy". Click to enlarge. Source: EIA.
You can see that the EIA estimates somewhat less than the 0.65 Gb of the IEA - only about 0.47 Gb. Of that, 0.29 Gb went into known stocks. The fact that we are building stocks seems fairly consistent with the idea of a near term peak and also with a risk of oil shocks due to geopolitical events. To the extent the market becomes concerned about those things, it will put enough of a premium on oil prices to cause supply and demand to separate and allow more oil to be stored as a precaution.
However, the build levels aren't huge. 0.47 Gb of oil is about 6 days worth of global production. So a little more precaution, but certainly not outlandish.
I can't quite get as excited as Matt about the missing barrels. The thing is that only OECD stocks are explicitly counted in the known stocks. So the unknown category includes all non-OECD stocks (eg China, Russia) as well as any outright statistical errors (true missing barrels). Since OECD oil consumption is only 60% of usage, it somehow doesn't seem outlandish that something like 0.18/0.47 = 38% of stocks would be outside of the OECD. Presumably the Chinese and Russians need storage depots too. No doubt there is some statistical error in there, but it's not obvious to me there's enormous cause for concern.
Anyone else got a clearer idea than me of why this is supposed to be scary?
Contact
- Content: editors at theoildrum dot com
- Tech support: support at theoildrum dot com
License

This work is licensed under a Creative Commons Attribution-Share Alike 3.0 United States License.
The margin of error may be relatively small, but it will be more and more critical as we approach crunch time.
I still claim that nothing prevents us from nailing a good macro understanding using nothing more than an expected value for a typical reserve growth model or creaming curve. I assert that the two curves basically amount to the same thing; in particular when we apply the numbers in a statistically valid way to the oil shock model, either one fits nicely into the maturation phase.-Mobjectivist.
Stochastic Resonance asserts itself as "thermostats", feedback
loops fail iniating cascade.
Using an ocean-atmosphere climate model we demonstrate that stochastic resonance could be an important
mechanism for millennial-scale climate variability during glacial times. We propose that the
glacial ocean circulation, unlike today's, was an excitable system with a stable and a weakly unstable
mode of operation, and that a combination of weak periodic forcing and plausible-amplitude stochastic
fluctuations of the freshwater flux into the northern North Atlantic can produce glacial warm events similar
in time evolution, amplitude, spatial pattern, and interspike intervals to those found in the observed climate records.
www.pik-potsdam.de/~stefan/ Publications/Journals/stochres.pdf
The first major US city to collapse, New Orleans, is evidence of how this works.
As a Self Organizing Critical(SOC), System the mechanism for
abrupt change in oil production would be identical.
...stochastic resonance (SR) has become very popular in many fields of natural science as a paradigm which epitomizes noise-controlled onset of order in a complex system.
Although in the recent literature the notion of SR gained broader significance, the archetype of SR models is represented by a simple symmetric bistable process x(t) driven by both an additive random noise, for simplicity, white and gaussian, and an external sinusoidal bias. On keeping the forcing amplitude and frequency fixed, the amplitude of the periodic component of the process, x, grows sharply with the noise intensity until it reaches a maximum and, then, decreases slowly according to a certain power-law.
It was initially suggested that such a behavior results from the attuning of a deterministic with a stochastic time scale, that is, the forcing period To and the switching time T(D) of the un-biased bistable process x(t), respectively.
It has been said here on TOD that estimates of World Oil Production are fuzzy.
But as usage of oil increases to max levels, exactness becomes critical.
Just when we need it, we don't have it.
In other words, we'll know exactly how much oil we're pumping only when our most critical function sucks air or our least critical function fails and cascades.
James
http://energybulletin.net/13199.html
Apparently the US military used 144 million barrels in 2004 = 395,000 barrels per day, almost as much as daily energy consumption of Greece.
http://www.groppelong.com/Reports/reports.htm
As Twilight said, if you don't believe that OPEC overproduces, there are no barrels hiding in strange places.
You know "they measure oil exports by checking how deep is the ship's hold sinks in the water."
You've probably already done it already, but one could potentially check for an average yearly bias going back more thsn several years.
http://www.theoildrum.com/story/2006/2/15/02834/6658#23
I can't find the page now, but if I recall correctly he said something like "good data is hard to come by, and experts keep their sets of fudge factors, based on their experience, from official numbers. They apply those fudge factors to new reports."
It could just be that Simmons is on a campaign for better numbrers, and "missing barrels" is what bubble up in the press/
I was wondering if Simmons was in fact talking about the so-called "equivalent number of days of forward consumption" of the oil inventories (equals to the current stocks divided by the current consumption). At least for the US, this number was around 60 days in the 90s and is now around 30-40 days (and reached an historical low in 2003).
Saudi Arabia apparently foiled a car bomb attack on on oil facility today...
http://tinyurl.com/ku3rg
RIYADH (Reuters) - Suicide bombers tried to storm an oil facility in Saudi Arabia's Eastern Province on Friday, a security source said.
"Security forces foiled an attempted suicide attack at the Abqaiq refinery using at least two cars," the official said.
Al Arabiya television said Saudi forces killed the attackers.
Tighter than Fort Knox.
Satellite Photo Ras Tanura
http://www.terraserver.com/imagery/image_gx.asp?cpx=50.10184434&cpy=26.69466103&res=30&provider_id=350&t=pan&dat=
Crude is up $1.86 as I write this. It's going to be a volatile day in the futures market, for sure. Oil, and gold as well.
Sean
Oil Rises on Concern Attacks May Further Cut Nigeria Production
Feb. 24 (Bloomberg) -- Crude oil rose after rebels who knocked out a fifth of Nigeria's oil production threatened further attacks against Africa's largest producer.
The story continues at...
http://quote.bloomberg.com/apps/news?pid=10000006&sid=aqQo.4k5hO8w&refer=home#
by "the chief executive of the prestigious British Royal Society of Chemistry".
Can someone knowledgeable comment on his remarks?
http://www.kuna.net.kw/Home/Story.aspx?Language=en&DSNO=832493
Are they offering a finder's fee?
I've been trying (unsuccessfully) to put together a post to try to explain from a "bottom-up" perspective what Close but No Cigar indicates--that world production is flat for some time now and will stay that way. But I've been defeated by the lack of transparency in the numbers (on a country-by-country basis). For example, Russian production is down right now about 2% due to the harsh winter there and they don't expect to ramp up to full production until May. OPEC is down a bit and will be down further when the February numbers come out due to Nigeria. Is Mexico keeping up in the face of declines at Cantarell? How's Canada doing? Iraq is down and about to go down further given the sectarian violence.
So, it must be the case that world production is down and barely being offset by new projects coming online if the levels stay flat. But I can't put all the numbers together to make a convincing post because I just can't get the data. But I wouldn't be surprised, if we get some honest accounting, that there will be decreases in world production both this month and next month.
So, my intention was to look at only shorter term data (2004 to 2007) given we have so far "peaked" in May 2005. But I'd be more interested to know the details of why you think such an analysis is flawed or useless. What methodology did you use to come up with to establish your conclusion that such an analysis is not a good predictor. My mind is entirely open on this question. Your remarks indicate to me that you have little faith (outside your own Hubbert Linearization approach) in any kind of shorter term predictions at all. And maybe that's right, but I'd like more details.
I think it's time to re-visit the issue.
My assumptions
- The Saudis are pumping flat out now and not playing the games they have in the past.
- Saudi Arabia as an instance of bottom-up analysis has never been a good indicator because of the production games they have played in the past, therefore
- In your figure, there is a fairly good correlation between the Haradh II and Qatif-Abu Sa'fah projects since the third and fourth quarters of 2004 despite discrepancies before that (looking at the OGJ figures).
- World oil looked at bottom-up in the aggregate (including Saudi Arabia) would show a different story .
Maybe I'm wrong but maybe not. That's my point--the hypothesis that times have changed. There is always the possiblitiy that various producers will withhold oil off the market to control prices, contradicting my point #1, but that is an entirely different issue.Using Saudi Arabia as some guide to "bottom up" analysis in the past prior to the dates I just gave is entirely misleading in so far as "world production" goes--since they no longer have any control as a "swing supplier" and nobody wants the "heavy sour" crude which constitutes their surplus capacity. I will refrain from putting up the standard picture--NO, I am weak and can not refrain from doing it
Esteemed and beloved-and above all, trusted.
But you've seemed to miss my main point entirely. I think that production capacity (world-wide, including Saudi Arabia) has fundamentally changed and can not rise much above current levels. I think that this is a position you are currently in agreement with but maybe not if you are unwilling to take any bottom-up projection seriously. In the view you are expressing here, why couldn't CERA be entirely correct?
It is a seriously flawed and risky position to take your position entirely based on Hubbert Linerarizations and other types of statistical extrapolations. Where we need to meet at is in the middle--both the top-down and bottom-up projections coming into agreement. I know you like to model stuff, Stuart--and I admire that--but to convince the people as it were I would prefer a more general kind of agreement from both ends.
So, where do you stand here? or are you in a kind of "wait and see" position?
CERA, Lynch et.al. do make the assumption that the past is a good predictor of the future. Both are fond of referring to predictions made about 25 years ago (after the oil shocks) that people were making dire predictions at that time that did not come true. And due to several factors, including the North Sea, Alaska and lots of spare capacity in Saudi Arabia, etc. these predictions were wrong. This is the basis of CERA's report and the predictions of the IEA and EIA (given, of course, that many trillions of dollars of investment are applied to the problem). Historically, I want to establish that
- There is no spare capacity now and likely to be little or none in the forseeable future.
- Realistic production numbers now and in the near term from places like Saudi Arabia, Mexico and Russia can be known to a fairly high degree of confidence.
- There are no more big discoveries to be made (at least for conventional oil).
In conclusion, the period we are in right now is historically unique and a reasonable bottom-up analysis of the production data might confirm that we have peaked now but, looking back at historical data as you seem to have done, would not have worked. Of course, I may be wrong. Might I suggest a post on your part on this interesting question?best, Dave
Odds are that SA still do have some spare capacity of the heavy, sour kind, but that is of little current use since there is a refining bottleneck for it. I don't think there is currently any significant spare capacity outside SA. If we did make any new giant discoveries they would probably take 5+ years to bring onstream hence would have no material effect on the timing of peak oil.
The last 6 months have seen a set of minor production disruptions (GoM, Russia, Nigeria) generally ticking along at between a total of 0.5 to 1.0 mbpd. If one optimistically views this as abnormal we have a further 6 months' demand growth covered. But odds are disruptions will happen and I think we should presume this level of production constraint as routine.
That leaves us on the plateau with perhaps enough new capacity coming online to balance demand over the next couple of years at most. Best hope decline rates don't get too nasty in an important way.
The other factor SEEMS to be that when a field is initially drilled with "old" technology the decline rate post peak is gentle but when a field has been drilled with "new" technology and production maximised from day 1 it peaks faster and declines faster.
src: adapted from Simmons (Twilight in the desert, appendix B (p. 374 and 375))
Do you have that chart on your blog? And are you planning to write on it? I have a bunch of catching up to do as I have been away for a couple of weeks and noticed that you have a boatload of interesting recent posts.
Am currently looking at your particle filtering approach.
I agree. Looking at the USGS distributions for undiscovered field sizes, I was surprised to see how small they were on the whole. Most fields wouldn't even show-up in a bottom-up analysis. Also, I think there are other important sources which don't show up: especially reserve growth, but also non-conventional, and substitution (GTL, ethanol etc.)
The shear number of small fields make almost impossible to apply a bottom up analysis, statistical analysis is better suited for that kind of problem.
Agreed. Looking forward to seeing you and WHT tackle the problem!
I'm saying this to provoke -- but I don't know enough to back it up. I'd like to see those who know more discuss. SA I can see has an interest in overstating. I can see a good reason for some to understate.
I'm like you, I don't know much either, but as it turns out, no one seems to really "know" much. We see the glowing reports from consultants like CERA, but they never say EXACTLY where all this oil is to come from, at least not to anyone unable to pay the big bucks for their reports.
In the end, ALL agree that Saudi Arabia is the pivot around which all other smaller bodies orbit, and even if transperency was in the interest of EVERYONE ELSE, if it were not in the interest of the Saudi's, we are still in the dark.
"In whose interest is transparency?" Well, it would be in the interest of shareholders of oil companies to know what they are holding, but that's the problem: Fewer and few barrels of oil each year are in the control of private shareholder firms, with nationalized oil companies and reserves becoming the norm.
Interestingly, the case can be made that all these models and the "over vs under estimation" has only a marginal effect anyway, if we asssume we are at the top of world production. Everyone is wearing themselves out in trying to guess the exact moment, down to the day or the week or the month of "peak". (We can call this Deffeyes syndrome, and discuss it's symptoms and manifestations at a later date)...but we should ask, what if peak has already occured...or comes in one year....two years (?), three? What possible difference would it make? Anything less than a full decade to prepare means the peak might as well have happened yesterday (call that the Hirsch syndrome), and even a decade is too short unless MASSIVE shift in usage is already being built into the system.
Back to Saudi Arabia. Using Simmons logic the equation looks something like this: World=OPEC=Saudi=the four big fields in Saudi Arabia...when they begin to decline, we know we are in crunch. Logically, we cannot known the fields output (no transperency), and for the same reason we cannot easily know Saudi output....we have a rough approximation of OPEC top production at barely above 30 M/bpd to this date...even if growth in consumption STOPS we know that 1. North Sea is down greatly (much more than predicted only a few years ago, 2. Bergen in Kuwait is down (not predicted at all a few years ago, 3. Canterell in Mexico is topped (and so seems Mexico, something not predicted only a few years ago), Russia (???), West Africa (???), and Deepwater(???) and gas to liquids (???)...can they make up for the declines even if OPEC can hold at 30 M/bpd? The four with the question marks are now EVERYTHING (with the possible exception of Arctic, which is still several years out in front, and very challenging) and of course we have little tranperency in most of those cases, not because someone is lying, but because no one really knows what may be available there....putting us back to OPEC...
WATCH THAT 30 M/bpd (Million barrel per day) MARK LIKE A HAWK ON THE HUNT...IF THEY CAN TOP IT FOR SUSTAINED PERIODS, WE MAY GET OUR DECADE TO SALVAGE....if they cannot, we are essentially in for the crunch, and things will change by emergency means....
Matthew Simmons, T. Boone Pickens, Ken Deffeyes and Colin Campbell are all betting against OPEC on this one....CERA and some other optimists are betting for them....RIGHT NOW, IT IS THE ONLY NUMBER THAT MATTERS ENOUGH TO MATTER AT ALL.
If you were to plot separately arrived at monthly or quarterly demand/consumption and supply/production numbers, you would find that the discrepancy is as much as 1.5 mpbd in any given period. Sometimes the consumption line is (unbelieveably) above the supply line.
One may counter, but that is "per day." But you must remember that is per day over an entire month or quarter.
From the actual numbers here is what we get. In the EIA's latest monthly revision for November 2005 we have 84.105 mbp production. If we look back two months we see that in September we have a revised 83.237.
I have reproduced the relative accuracy of these numbers using the following method. I have produced a list of the top 75 oil producing countries in the world. I have then placed them in a monthly table. I have filled out these monthly numbers by using data from numerous EIA tables, and BP's annual energy review.
The numbers for the bottom 45 countries on list list are obviously extracted from yearly data that is now as much as two years old. This is not so important since the relative percentage of oil coming from these countries is very small and the month-to-month change even smaller.
We can then figure the very recent monthly production of the important producers at the top of the list by consulting news sources such as Bloomberg, the NYT, etc.
What do we get when we add up the columns? We get numbers that closely match (+/- 100,000 bpd) EIA's monthly numbers until November, which was their last release.
Now to bring us to the present. We can actually make a very close estimate of February production. Again we do this by paying attention to the news.
Nigeria had production in November of 2.695 mbpd. Iraq 1.821 mbpd. From Bloomberg's long oil release on the Saudi attacks today we get Nigerian production at minus 455,000 bpd, so we will arbitratrily use 2.240 mbpd for Nigeria for February, although since this effects only the second half of the month, their monthly figure will undoubtedly come out higher later on. For Iraq we see that production in January was 1.53 mbpd. I carry this change into February.
I also carry most of the rest of this list's January numbers into February except where I can verify through the news that there have been or should be slight changes either up or down. I won't list the details.
I do this simply to show that If I can come up with these numbers, this community, Matt Simmons, and anybody else should be able to with a few days work.
What do we end up with? For January I get 83.961 mbpd. For February, 83.601. If we compare February with the September 2005 number I listed above, 83.237, we see that world production has been increasing at an annualized rate of almost exactly 1.1%, which is the lower marker of the range 1.1%-2.2% where production has growing for the last 3-20 years. Normal.
If one wants an possible explanation why demand is not higher, we can simply use the high price.
Spare capacity is another issue. This appears to have been shrinking for at least the last several years.