Saudi Arabia from the Bottom Up
Posted by Stuart Staniford on November 22, 2005 - 4:48am

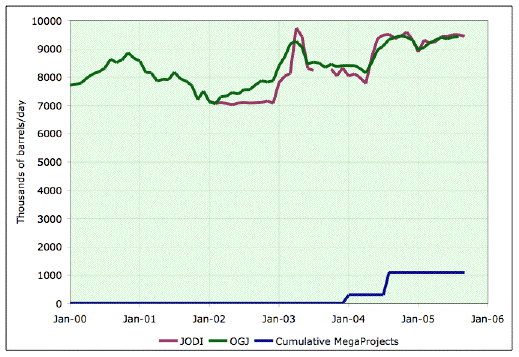
Saudi monthly crude oil production in kbpd (excluding NGL), since January 2000, as estimated by both the Oil and Gas Journal, and the new Joint Oil Data Initiative. Also shown is the cumulative capacity increase from documented megaprojects to date.
At any rate, neither production series is at all well explained by the Saudi megaprojects so far. I went back through all Saudi Aramco's press releases, and also looked at the EIA's country analysis brief, combined with some Google background checks to come up with this list of MegaProjects.
| Project | On Stream | Increase (kbpd) |
| Haradh II | Jan 04 | 300 |
| Qatif-Abu Sa'fah | Aug 04 | 800 |
| Haradh III | 2006 | 300 |
| Abu Hadriyah/Fadhili/Khursaniyah | 2007 | 800 |
| Shaybah | 2008 | 300 |
| Nuayyim | 2009 | 100 |
| Khurais | 2009 | 1200 |
This list ignores Hawiyah, which will produce around 310kbpd of NGL, since our production statistics do not include NGL. The first projects (Haradh II and Qatif/Al Sa'fah) have already happened, and their cumulative capacity increases are shown along with the production:

Saudi monthly crude oil production in kbpd (excluding NGL), since Janurary 2000, as estimated by both the Oil and Gas Journal, and the new Joint Oil Data Initiative. Also shown is the cumulative capacity increase from documented megaprojects to date.
However, it's harder to make that kind of explanation for the production decline after the peak in early 2003. That was happening as prices were going up and demand was starting to increase in the very bullish way we saw over the last few years. So that might be interpreted as some kind of production problem. However, if so, the fix for it -- a 1200-1500kbpd increase which comes in late spring of 2004 -- is much too large to be accounted for by Haradh (300kbpd), and it occurs before Qatif/Al Sa'fah was supposed to have come on line (unless the Saudis misreported that timeframe - they announced it in December, but said then that it came online in August).
Indeed, there is no noticeable production increase coming from the completion of the Qatif/Al-Sa'fah project. We must assume that they brought it on line but then just used it to rest some equivalent amount of production elsewhere.
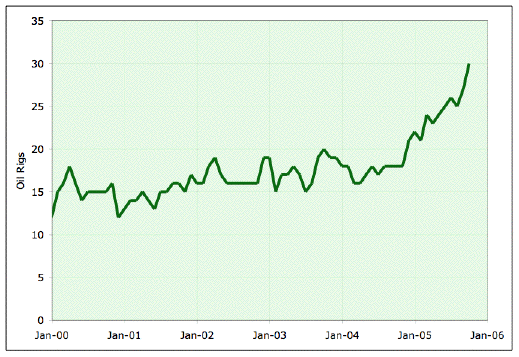
To explore this question a little further, I looked into the history of rig counts in Saudi Arabia (available from Baker-Hughes). This next plot shows that history just for oil rigs (ie not NG) over the last five years. Interesting! If the megaprojects required any additional rigs, it wasn't very many:

Oil rigs working in Saudi Arabia according to Baker-Hughes.
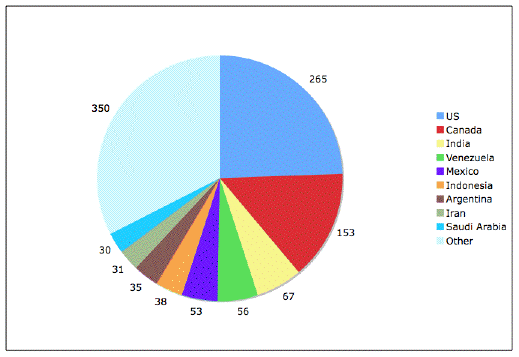
You might wonder - is this a lot of rigs? The answer is very clear: no. Baker Hughes stats (which exclude the former Soviet Union countries) show Saudi Arabia ninth in the world for oil rigs, with only a little more than 10% of the oil rigs working in the United States (which is itself far down from the levels of past decades). Interesting that the world's biggest oil-supplier is such a pygmy in rig-count. (Again, all numbers are oil rigs; NG rigs are excluded).

Oil rigs working around the world in Oct/Nov 2005 according to Baker-Hughes. Numbers exclude Former Soviet Union.
For example, in the U.S. you have infrastructure — there must be tens of thousands of miles of pipelines. If we, in Saudi Arabia, evolve to that level of commercial maturity, we could probably produce a heck of a lot more oil. But to get there is a very tedious, slow process.So if we can't find a decline rate by looking at past megaprojects and production, what are others saying? The EIA quotes the Saudis as saying their fields are declining at 5%-12% annually. HO mentioned that the IEA is estimating that the Saudi production base now declines at 600kbpd/year, if they don't do do additional drilling and projects. That is a shade over 6% of current production - towards the low end of the EIA-cited range.
That kind of decline makes for a problem: by 2010, they'll have 3mbpd of declines under their belts, and there's only 2400kbpd of new projects coming on stream. Hard to see how production can get increased that way. However, bear in mind that the IEA number could be pretty uncertain either way. On the upside, there's no way to know how much drilling they might do outside the context of the Megaprojects. On the downside, decline rates after use of MRC horizontal wells etc have a nasty tendency to accelerate. So it wouldn't surprise me to find the Saudi's looking for excuses to keep production flat or declining while they still go ahead with their projects (as after Qatif/Al Sa'fah).
We can compare this bottom-up megaprojects analysis to the top-down Hubbert analysis. Remember this picture created by Jean Laherrere, with a projection to a 180gb ultimately recovered reserves (URR), suggesting Saudi Arabia is already past peak (at least in the sense of the smooth fit midpoint which comes in 1998).

Hubbert Linearization of Saudi Oil Production. Credit Jean Laherrere.
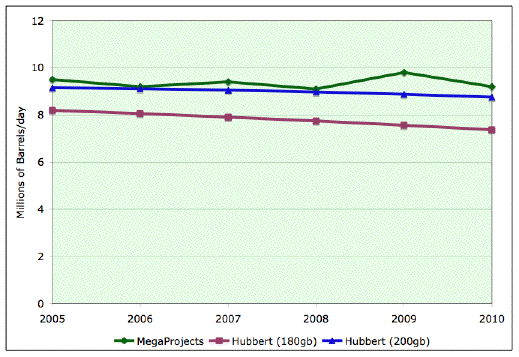
However, it's worth noting that the last couple of years have popped up above the line. If we suppose they are really more representative of the Hubbert curve, and the Saudi's were voluntarily restricting production in between, we'd get a curve that went out to about 200gb, with a midpoint in 2003. On the last graph, I plot the megaprojects plus 600kbpd annual declines and both of those Hubbert projections:

Three Projections of Saudi Production. One (dark green) adds the tabulated megaprojects to the IEA 600kbpd decline in existing production estimate. The second (plum) is the Hubbert production curve implied by Lahaherre's linearization fit with a 180gb ultimate recovery. The third (blue) takes a Hubbert curve with a 200gb ultimate recovery.
However, I think the truth is it's very hard to tell from this data. A great deal is going to depend on the level of effort in terms of rig-count going forward, and what is really going to happen to Ghawar production (which probably nobody knows). If JODI ever manages to pry out field production data from the Saudi's, we'd be in better shape.
And finally, we must not forget Mr Al-Naimi, with his 460gb of reserves still to go (implying an ultimate recovery of 570gb). If he's right, Saudi Arabia is an immature province, production could be increased enormously over where it is, and all a set of hard-drinking SUV drivers needs to do to keep the party going is persuade them to use a lot more rigs. Mine's a single malt, please.


Russia has saved the supply situation during the last few years by increasing production at very high pace. Now it seems to be over and sharp depletion might be ahead. China is about to peak and their rapid growth predicts rather sharp decline, too. This would mean that Chinese import demand increases considerably. There also smaller, but numerous, producers that could decline "unnoticed". BP statistics show that of the large production areas Central and South America peaked in 2002 and Asia-Pacific in 2000. Europe-Eurasia (North Sea, Russia, Central Asia) is about to peak now. This lefts only Middle East and Africa left to increase. We don't need Saudi production collapsing, just flat, in this context.
Simmons says they've probably passed peak sustainable production, but Jeremy Gilbert told Steve Andrews at the ASPO-USA conference that he thinks the Saudis can get up to the high teens. But if that's true, how many rigs would they need, and where will they get those rigs?
I guess it's interesting to speculate, but it's important to keep in mind that in the bigger picture, it doesn't matter a whole lot. There are plenty of indicators that we're at the front end of the period of "demand destruction," that lovely euphemism for people with fewer resources being shut out.
Or maybe those energy miracles are about to happen!
I wasn't watching the energy biz at the time, but a lot of people remember the collapse in oil prices in the 80's (which helped bring down the Soviet Union by killing its export earnings). That collapse also killed the alternative fuels movement in the US.
If the cheap oil coming from OPEC can't meet world demand any more, the price floor will be set by much higher-cost producers. This means the downside risk for other energy schemes is limited compared to history. This may get interest, and money, moving on those "miracles".
The result of the Hubbert linearization done by Stuart (URR @ 200Gb) seems to be consistent with the current production levels.
Congratulations, I hope those 50$ can be proved well spent. I considered doing that myself, but instead I downloaded the BP data.
Can you do me a favor (and to the rest of us)? Could you compare OGJ data with BP's? You can use the ASPO's newsletters to subtract the Gas Liquids from BP (for instance nº 59 states 6.3 Gb in 2000 and 8.0 Gb in 2005).
In what concearns Saudi Arabia I believe they already peaked, and are producing below the 'model' peak, creating an artificial plateau. The 200 Gb seems a quite good number, no way to prove it though.
A surprise colapse like last week's Burgan field can be expected in Saudi Arabia any moment now.
On IOR and EOR I'd advise everyone to take a look at the graph in page 40 of Koppelar's latest report.
In my humble point of view the Hubbert method is the best tool we have to predict the Oil Peak.
Happy Thanksgiving to all the folk in the ex-colonies.
Several months ago we discussed the Monte Carlo simulations run by the USGS in 2000 that automagically "found" about 1 trillion barrels of yet to be discovered or recoverable oil. In the report referened above you can find out a little more about that method and its failure so far (over the past 5 years) to even come close to reality.
The authors note tht the 95% scenario of USGS is closest to reality. As I recall, when reading the 2000 USGS report, this model pretty much conforms to predictions by ASPO and like mided modelers.
For those who want to have at the USGS 2000 estimates: try this link Note: their predictions for natural gas are here too.
As far as the Saudi numbers go, it's not clear but when you add in the Hubbert Linearization done here previously for Saudi Arabia, I wonder if that rise above the line is like the East Texas line, rising due to managing the tail but not really indicative of more URR?
Given the Saudis inability or reluctance to increase production the last few years despite much rhetoric about doing so, those Hubbert Linearizations make interesting points of speculation. I also saw the recent Saudi request for a "roadmap" of future oil demand as a bit of politcal posturing enabling them to avoid (once again) raising production by throwing the issue back at the consuming nations.
Thanks for pointing this out, I will change this in the next revised version (Due to be out in January or February probably) as soon as the new production numbers from the IEA statistics arrive.
Of course actual demand and output may be wrong, but what is most striking is that crude output is nearly always above refinery capacity. Crude that can't be refined has no value (well, not today), so if this case is valid product prices should rise (refinery capacity remains lower than the 1% demand assumption until mid 2009) while crude should fall. Mid-2009 is also when refinery capacity exceeds crude output, so crude prices would be expected to resume climbing at this point.
THis helps explain Saudi complaints regarding the west's failure to expand refinery capacity in line with their own demand growth, and also explains their own plans to add refineries. And, it might explain oil companyies' reluctance to expand theirs; refineries' profits are growing sharply while the major's crude output is beginning to decline. It is OPEC that hurts - they might have to cut output to maintain prices. OTOH, peak is delayed while high product prices encourage thrift.
It would be great if future peak models include refinery capacity.
Prices are down supposedly on account of warm weather, but there may already be more crude in US storage than refineries want, particularly now with futures prices lower than spot. Refineries are flat out, and would be regardless of weather. There could easily be more crude produced than can be stored this winter just as many freeze on account of too little heating oil.
The market links crude with product, so crude rises when product rises, which would be ok if refineries could handle as much crude as is now being produced. Note that OPEC had excess capacity, so could handle excess demand from China and others, but the world does not have sufficient refineries to process the excess demand. Saudi is right, complaining that the problem is too little refineries rather than too little crude.
The "turbulent" chart (which may or may not have the correct assumptions, but there is probably more certainty regarding future refinery capacity than onset of peak oil) shows 2009 to be the critical year, with refineries catching up with demand just as lack of crude takes over the bottleneck role. This chart strongly predicts higher product prices and lower crude prices to mid-2009, meaning the downstream end will do better than the upstream end.
I am reminded that in 2001 Norway thought it had a supply cushion, and choked back production as a voluntary measure in conjunction with OPEC to maintain oil prices. By mid-2001, Norway realized it wasn't even producing up to its quota due to decline rates in it's fields. It then threw off all limits on production and still never made what it intially planned to be a choked-back production figure. That's when they realized they had peaked.
On page 25, they show cumulative production/reserves for the Ain Dar/Shedgum portion of Ghawar, with "reserves" listed as 41 Gb, and cumulative production to end 2003 of 27 Gb. Production in 2003 on this section was 0.73 Gb/year, and is probably higher than that now since the Saudis boosted production by about 1 million bbl/d since then. Note that the exit ARAMCO 1979 proved reserves were 34 Gb.
Now, on the next page, they show depletion rates, but AS A FUNCTION OF INITIAL FIELD RESERVES. Of course if you have these enormous initial reserves, the depletion rates as a function of initial field reserves are small. That is not the question, however, at this point in time. Rather, the question is the extent to which this can be continued into the future. For this Ain Dar/Shedgum, the CURRENT field depletion (end 2005) is given by
0.73 Gb/year / 12.7 Gb = 5.7%/year, and that number is growing by 0.3% per year. So in other words, the depletion rates on this resevoir are already at the levels of the North Sea. The North Sea resevoirs ((Brent, Forties) ultimately collapsed when produced at these levels.
The thing that I find most curious about that whole Saudi Arabia thing is that they are treating Ghawar and Abqaiq so differently. Abqaiq they have always produced at a depletion rate of 3%/year of remaining reserves, whereas they are producing Ghawar (Ain Dar and Shedgum) at a rate of 2% of initial reserves. Why the difference? The reservoirs are basically the same aside from size. When Abqaiq had 12 Gb left (in the 1970's), it was being produced at a rate of 1 million bbl/d. In contrast, Ain Dar/Shedgum with 12 Gb of reserves left is being currently produced at 2 million bbl/d. I think this is truly the question that Simmons is asking (aside from the doom and gloom fluff) - why are you treating Ghawar so differently, and how can you be so certain that it won't collapse?
But then there is nothing purely geological about the hubbert curve; production is also affected by economics and politics. I think the key question for the future of Saudi production is the rate at which the Saudis discount future production. In other words, are they going to continue to limit their production to save the oil for the future or are they going to pump up production because they need the cash now to buy off their people and remain in power.
http://www.mees.com/
For example, here is their view of Saudi Arabia's recent production, conveniently charted from 1/2000:
http://static.flickr.com/32/57255932_5db769743f.jpg
In 2000 the world economy slowed and OPEC had to cut production to maintain prices. This was an "economic" peak. In 2003 Saudi and others opened full production to compensate for the Venezuelan oil strike and then the Iraq invasion. When these settled down, they again reduced production. This was a "political" peak. Neither of these is a production peak in the way we are discussing the term, they were modifications in how much supply cushion was maintained. 2004 was just a blip - not needing interpretation.
Beloved, esteemed Al-Naimi on the right.
Since I (unfortunately) became aware of PO 6 or 8 months ago, (Is there a deprogrammer in the house?!), I've made TOD my GO TO site. Brilliant posts and the comments are often just as good.
But I'm neither in the industry or a math wiz, so I'm often left confused as to exactly your conclusions.
Suggestion: Please follow up the more recondite or dense discussions with a final section labeled something like: "Conclusion" or "Nickel Version."
Happy Organic Thanksgiving,
Geo