Plateau update
Posted by Stuart Staniford on April 4, 2006 - 1:44am
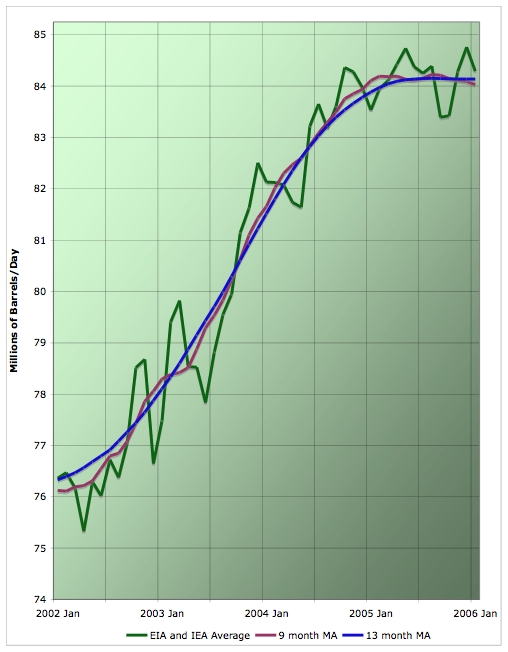
The new 13 month centered moving average makes for a nice smooth curve and shows the recent flatness in supply well. Readers are welcome to speculate about whether the break, when it comes, will be up or down.
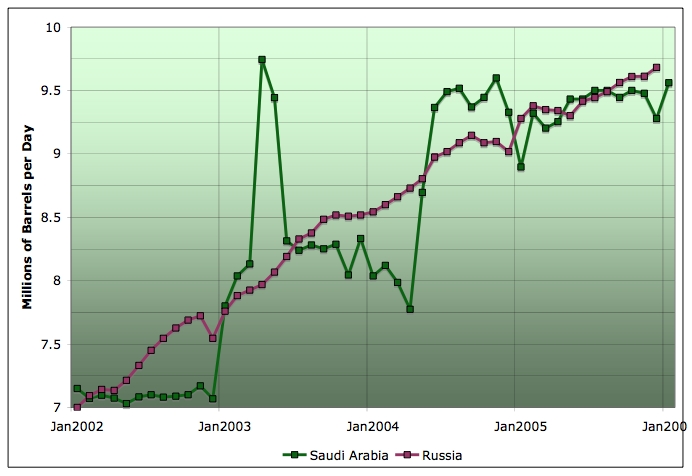
There was a small frisson of excitement in checking the Saudi and Russian numbers (the two countries most important to the near-term peak oil debate). The EIA has them both down in January.
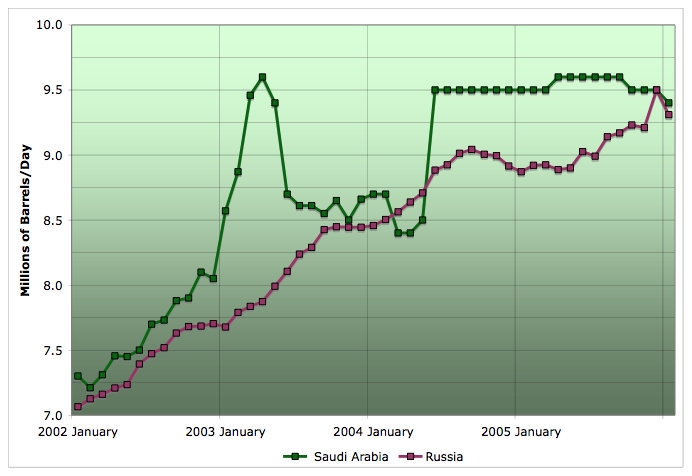
However, I really don't think we can conclude anything from this. Russia was affected by transitory problems due to cold weather in January. And as to Saudi Arabia: well the Joint Oil Data Initiative has January data for Saudi Arabia, and they reckon the production notched up in that month.
All in all, nothing very significant to report.
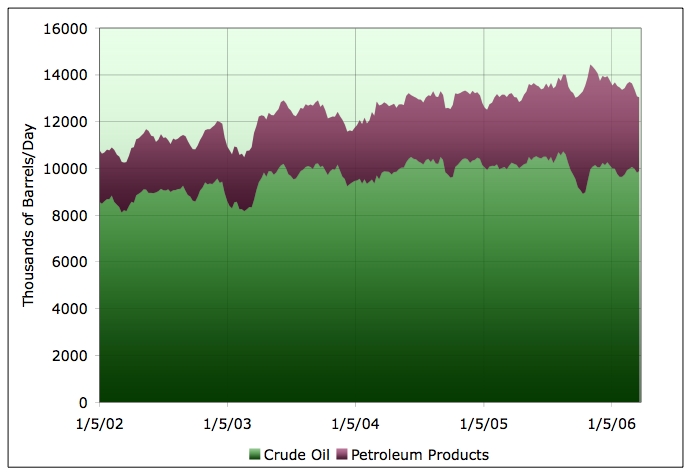
Finally, one last graph (a new one). This shows US imports of crude and petroleum products over the same time period as the other graphs (since January 2002). The graph is a four week moving average from the EIA. WesTexas has lately been raising the concern about world export capacity falling much faster than total production in the future. Not much sign of an issue at present (note that imports fall nearly every winter, and 2005 is exaggerated by the post hurricane import peak). However, if imports kept falling as we go into the summer, that would be something new.
Past coverage relevant to the plateau:
- Cigar Now?
- Missing Barrels
- Close, but no cigar
- November Statistics Updates
- IEA Monthly Report for December
- Refining the Plateau
- Can Acts of God and Bush Explain the Plateau?
- November IEA global production
- Happy Peak Oil Day?
- Where Supply Increases Come From
Other relevant coverage
Contact
- Content: editors at theoildrum dot com
- Tech support: support at theoildrum dot com
License

This work is licensed under a Creative Commons Attribution-Share Alike 3.0 United States License.
I'll also point to Lou Grinzo's analysis of the monthly U.S. consumption figures:
http://www.grinzo.com/energy/blog_entry_archive/2006/03/2006x03x29_5.html
U.S. oil "demand" (i.e. consumption) in January was down 2% from a year earlier, and for gasoline it was down 0.6%. Especially interesting in conjunction with your vehicle miles travelled data being up in January.
Lou concludes:
The lesson I take from all this is that the production graph up there is also a consumption graph. Leveling off may not necessarily be entirely due to production limitations, in the sense that it is becoming impossible to increase production, per peak oil dogma.Now, clearly there are production issues (possibly in the future) or otherwise prices would not be as high as they are. But it is still possible that the immediate driver for the leveling off shown in the graph is due to consumption stalling more than production hitting a wall.
With all due respect to Lou, I think he's not paying quite enough attention to the seasonal issues (January is invariably the lowest demand month for gasoline), and the fact that this particular January was unusually warm means that demand for heating oil was sharply reduced.
As to your last two paragraphs. Obviously, the "production problems" cannot be mainly in the future, or stocks would have sharply increased (whereas they have only increased by about six days worth of production/consumption over the last two years). If there were producers who were able and willing to produce more, prices would not have increased so much, and demand would have continued to rise (given that the global economy has otherwise been doing well).
So I think we have to posit some combination of lack of ability or lack of willingness to increase production. (I'm inclined to think it a mixture myself - most countries can't increase production any more than they have, and Saudi Arabia maybe could but isn't trying very hard).
He means 10% in one year. That is completely implausible. Year-on-year gasoline consumption in the US has never dropped by anything like 10%, and drops in driving of only 2% have only come in the past with significant economic pain. Recall this graph:
Also, while US auto sales have started to shift, there's no sign of impact on overall fuel efficiency so far:
<small>
Vehicle miles traveled per gallon of supplied gasoline in the US. Source EIA and FHWA.
</small>
Did the drop in GDP cause the VMT to drop or the other way around?
There is some sort of relation between VMT and GDP increase, but unclear who does what, I would say.
http://www.fool.com/News/mft/2006/mft06040403.htm?logvisit=y?logvisit=y&source=estmarhln001999&a mp;npu=y
The other problem is, they only ask how much less they would drive if gas cost more. People always say they wouldn't drive less. But they never ask how much more people would drive if gas cost less. I'll bet people would say they'd drive quite a bit more if gas were a lot cheaper.
In this survey, people said they wouldn't drive less no matter how much gas cost. So we should ask, would you drive more if gas were free? And I'm sure the answer would be, yes, a lot more.
The first answer makes it sound like demand is inelastic, the second answer makes it sound like demand is elastic. It can't really be both. They should ask the question both ways and average the results, to get a better estimate of true elasticity.
I read a lot of discussion about the elasticity of demand for gasoline, but it's all couched in terms of the economic driver. That is, the only factor that is assumed to influence VMT or vehicle choice wrt to fuel efficiency is fuel price.
My interest, and one that seems very relevant to PO, is the role education plays in modifying demand elasticity. I'm a case in point. I could drive pretty much any car I wanted, within reason, and not worry about fuel consumption. Even quintupling the price would be more of a financial irritant than an impediment. However, education about either PO or GW seems to make people much less elastic in this regard, to the point that some of us stop driving for those reasons alone, not just the price. This same mindset seems to be working in a number of my acquaintances.
Does anyone have any thoughts on the validity of this observation, and does anyone know if any research has been done on these sorts of factors?
I'd say to that, look who's buying the Hybrids, who's putting PV up on their roof.. it might help them financially, and it might not, but it seems to be essentially done for prinicple at this point. ( I think it will bear out economically, as prices rise ) For people to change their driving habits means a huge leap of faith. I drive our daughter to a daycare 6-7 miles away. Not much, but it's frustrating since I used to walk her 1 mile, at a different age. But it's the right place for her right now. Which part of her future do I sacrifice for another part of her future?
- car sharing
- reduced shopping trip frequency
- reduced leisure travel
- substitution of public transport
- walking
- etc
Education does help, as does facilitation of substitution, but price is the most effective driver (sic). If you can afford a Ferrari then the price of gas is a trivial consideration, but what proportion of drivers can afford Ferraris? Extrapolate.When does gas price pain hit you? $5, $10, $20? How about a shortage or rationing? Do they change your mindset?
Now imagine your wage is halved, or you lose you job, or your mortgage payment doubles.
Nah, don't be so silly, Agric, these things can't happen
The definition of GDP has changed over the year because the government has changed the rules of GDP calculation to show rosy GDP figures to voters. Also in the last thirty years the component of GDP has changed very dramatically. In other words the financial economy has increased very rapidly in USA. I would assume that most of financial economy depends on the activity of traders and bankers. I don't think that their activity is very dependent on motor vehicle transportation.
Once I tried to do the same analysis for Japanese data. However, I soon found out that this analysis is meaningless for Japanese GDP and VMT. Japanese GDP increase had stagnated between 1991 and 2004. However, the number of motor vehicles has rapidly increased since the late 1980's. Therefore in this period VMT increased very rapidly while GDP either increased slowly or even decreased a little bit. Japanese saving rate is high. And deflation had kept their wealth intact. Therefore Japanese could buy nice cars without much economic activity increase. Therefore the correlation between GDP and VMT in USA data is not fundamental bur rather specifically for the situation of USA.
I remember that about 70-75% of oil is consumed for motor vehicles in USA while about 35-40% is in Japan. Since Japanese have more options for transportation than Americans, it would be easier for Japanese to reduce VMT without affecting economic activity than for Americans. However, the difference between USA and Japan is relative rather than absolute. I am sure that there is some room for US economy to decouple with motor vehicle usage.
IMO the correct word will be requires - a certain level of GDP requires a certain number of VMT. If GDP rises you need more VMT to support it, if you cut VMT (oil shock) you will get less GDP. If you cut GDP you will also get less VMT.
I don't doubt that fuel economy will improve in response to the high gas prices. I'm just pointing out that it hasn't really got going yet.
Second, I said "gasoline consumption", not "VMT". Some conservation from reduced VMT would surely play a part over time, but simply drving less aggressively would save most or all of the 10%.
Third, as for their being no change in the effective MPG so far: What would the fuel consumption and MPG have been had SUV sales not fallen off a cliff? What will the effective MPG be as this buying trend continues? As with VMT changes, a turnover in vehicles will clearly improve MPG over time, but in the short run a change in driving habits will provide a much bigger kicker.
Will people make these changes? Push up gasoline prices enough, and they will. Doomers (and I don't mean you, Stuart) keep telling us how PO will be an unprecedented event in human history, triggering economic and social armageddon, etc., but they never assume that people will take unprecedented steps in response. My view is that PO is very, very serious, but that the actions, both collective and individual, we can and will take to mitigate the effects of PO and peak NG are just as formidable.
I believe you are exactly correct (although some people will certainly resist making changes - demanding that the government save them from high prices). In fact, I am working on a blog essay along these lines. There will be pain, and probably an unprecedented hit to the economy, but I believe we will make it through. I think it is great that prices are increasing before the peak, because it gives everyone additional time to change their behaviors before change is forced on them.
RR
Make no mistake, I agree that we are in for some very difficult times. I just don't believe we are doomed. The current supply/demand imbalance, leading to higher prices, will push the peak further out.
RR
- Fantastic site. Keep up the good work.
- My id shows you where I am and how I feel (Sitting Duck!!)
- The price of petrol here in Bombay is about USD4.50 per gallon (Rs,50.00 per litre) Been this way for about six /eight months.
- Our current economic growth does not seem to have been impacted with petrol at these rates.
- we are putting about 1 million cars per annum
- last moth saw the highest growth in sales of cars in the country. (will try and find a link)
- I would not be unwilling to pay 2 ot 3 times the current price of petrol. (drive about 1500 km / month)
- All our Rickshaws, Taxis and buses in Bomay, are run on CNG only. It is mandatory here.
- I would really like to see a live chart of the world petrol /gas prices color coded for rate of recent rise. This would help us to see where the prices are going. If all of us provide the info for our own areas it would be possible to keep a good record of the rises as they hit. It will also reveal stress points in the systems.
- I am now investigating ways to reduce my carbon footprint.
Just my 2 bits ;0)Many people do not have the luxury, at least short-term, to reduce driving much, but should they somehow manage to decrease driving enough to promulgate a significant percentage reduction in usage, then, given the nature of fungible markets, the supply will go elsewhere and the price will not be mitigated, particularly in a world where population continues to grow. In effect, that new population means a defacto increase in consumption, requiring new conservation. The cycle trends down from there. So far so good. Conservation is the goal.
But Americans may suffer disproportionally due to our enormous deficit and a world awash in our fiat excesses. Many countries, particulary in the far east, are waking up to this reality and they are already taking steps to multilaterally ease their pain.
I guess my main point is, there will be suffering no matter how you look at it. I am a doomer because I feel that the human propensity to cooperate is about as reliable as Microsoft Windows and because physics does not care what we do. A world defined by global warming is a system with mega-mega-mega tonnages of extra energy boiling up monster hurricanes and 351 tornadoes in a record tornado season that has barely started. That is some eight times the last highest number for this early in the season. The Ghawar's water cut keeps increasing and it is only a matter of time, a very short time, that the field collapses like the Yibal field did in Yemen. (Both fields have been using the same advanced water sweep and bottle-brush technologies for about the same period.)
I too wish that we could all just get along and hold hands and sing kumbaya and gently, gently lower the American behemoth of an economy into a swell post-oil paradise, but that is the kind of thinking that will cause the really intense pain. The belief that if we all stand on tippy-toe on the thin branch of human intent we can keep ourselves safe is a special belief often advocated by those who are heavily leveraged into the American dream -- too much to lose and not enough incentive to make the hard decisions.
What is it that Upton Sinclair said? I paraphrase at best: It is difficult to convince a man of a truth when his livelihood depends on his not understanding.
Happy talk, such as you might expect from George Babbit, is only cheerleading, not bread nor oil. We know where we want to get: a system that is stable and sustainable. Why not shoot for that right from the start? Why not use our fabulous intelligence and go-get-'em attitude to make it happen? That is the question that nags me. Everyone seems to agree that we live on a finite planet, but the arguments belie that fact. Technology is a product of cheap energy. Cheap energy is NOT a product of technology. So why do we think that building more widgets will magically slake the cheap energy thirst of an ever-growing population?
V
LOL, I wonder how this breaks down by platform.
(moderate, Linux user)
(The full quote is, "Complexity kills. It sucks the life out of developers, it makes products difficult to plan, build and test, it introduces security challenges and it causes end-user and administrator frustration." Talking about why Vista is late, I think.)
Free Software rocks!
Believe:
- Alternatives are a cruel hoax (for business-as-usual).
- TPTB are keeping PO card close to the vest.
- It's gonna be an 'interesting' (painful, etc.) decade going forward.
- We will see a wide range of unexpected and effective responses to dwindling BTU/day.
Open source kinda guy.Our family has done a fair bit over the last year to reduce our energy footprint.
If there is a widespread collapse of mankind (which I doubt), I will be fighting tooth-and-nail to try and keep my family and myself alive.
Anyway, good to have the moderates speak up for a change!
I think that honestly we cannot proceed with these fixes because so very, very few people are willing to acknowledge that capitalism is a completely failed experiment. I have no doubt that they will when millions in the U.S. who were recently middle class are suddenly starving.
I believe that a wonderful human culture can live a fantastic life for many centuries to come in a sustainable system. However, capitalism **IS PREDICATED ON GROWTH**. Trying to keep the capitalism means having to keep the growth which means unsustainability, and extremely painful collapse.
I'm glad to see sustainability growing in support and familiarity to a broader range of people. Unfortunately, it is just a word if they cannot see that it is antithetical to capitalism.
We do have excellent options for economic systems based on cooperation and sharing (as opposed to competition and private ownership) that would make sustainability happen almost automatically.
Errr - would you care to mention one such that's received a large scale trial?
What has been tried honestly is capitalism, which is having the result of nearly destroying the planet's capacity to support human life. It is now time to honestly try a form of Marxism, which, as you point out, has not been tried.
Cooperative societies were also common in American Indian tribes, in all of the Americas, and I'm sure I could find other examples like the Amana religious community, the Amish, Mennonites, Quakers and many buddhist communities.
Most people are completely ignorant of the many alternative governing methods that have graced this earth because they have never been spoon-fed that particular history. The job of the public school system is to confirm the legitimacy of the current government and not to point out its flaws and the success of alternate systems.
A brief foray into history will quickly convince anyone with an open mind that our history is the history of the victors. Should Hilter have won, our school books would be touting his politics. If Soviet style communism had overcome our consumer blandishments, then we would be getting their version of history.
I'm of the view that it will take a pretty good-style recession to make people serious about conservation again.
Whenever anyone says something like "completely implausable" I'm reminded of that line form The Princess Bride ... you just think that because no one has ever done it before ;-)
Let's see ...
U.S. Finished Motor Gasoline Product Supplied (Thousand Barrels)
1978 - 2,705,308
1979 - 2,567,573 (-5%)
That's just one year, stretching it out ...
1978 - 2,705,308
1982 - 2,386,824 (-12%)
So we've never done 10% in one year, it's taken 5 years ... ah well, what's the point here, that we do it in one or that we do it?
I agree totally with those who question why a unique change (peak oil) should behave like past markets.
Here's the odd subtly though. I might join you in making a specific prediction, as the best possible projection from available data ... I just differ in the confidence I apply to that prediction.
In something as wide open as peak oil it is quite possible that the "best prediction" is still a "low probability event."
As far as your point about predictions vs confidence: One of the nice things about the futures markets is that they not only give predictions, they give the error bars. JDH at Econbrowser showed the market's 95% confidence interval for future oil prices a few months ago:
http://www.econbrowser.com/archives/2006/02/oil_at_1530_a_b.html
The market is 95% certain that in 2010 oil will be anywhere from $14 to $251 a barrel. Now that's a heck of a prediction. I'll bet the TV shows would just be lining up to hire a pundit who gave predictions like that!
One of the most common human failings is overconfidence. People don't do that badly on predictions, but they're way too confident about being right. One of the great things about markets is that they are structured to overcome this flaw. As the example above shows, oil markets clearly do not suffer from overconfidence in pinning down future oil prices.
I think the economists writing and reading things like that are taking it with a grain of salt. They are smart enough to know that a projection based on the 1970-2005 experience is only valuable if (insert hocus-pocus) the world continues to behave as it has 1970-2005.
http://www.econbrowser.com/archives/2005/07/100_a_barrel_wh.html
This comes out to about the same result, a 32% volatility. So the markets apparently believe that volatility going forward won't be much different from the past 10 years (which have actually had quite high volatility, when you consider that the price has gone from 10 to 70 in about six years).
I think the rational observer is using it as slang, with the expectation that if markets believe anything today, they can equally well believe anything else tomorrow.
That doesn't stop people from reading the tea leaves, and applying post hoc explanations to the market's every new "thought."
The MSM do portray markets as having rationale, minds, a queer kind of reason. They do it with a purpose: to make the markets a friendly and understandable thing to the naiive. It's 'personification', humans like it, check out their religions ;)
Whenever the various markets do something all sorts of pundits leap out and rationalise the move in a way that suits them. It is mostly post hoc nonsense.
I do believe that the markets move in mysterious ways, sometimes with uncanny awareness of what will come. I also believe that less visible hands are conjouring spells of significant power (money, as in repos, etc) that have fluence. Whatever ability the markets had for prediction has been sorely weakened by the fed-like shamans, you have been warned - the phase shift to reality will probably be sickeningly abrupt when it happens.
I notice that you often cite market futures as something of a reliable (more or less) predictor of the actual future. It seems to me that if you check the far-ahead (say 10 year) futures prices of a commodity like crude oil at various times in history that you will find the volatility of that futures price depends greatly on the current volatility of the market. IOW take a period of relative (!) stability in the crude market and you would find the 10 year future price maintaining close to the current price with a fairly narrow band of difference. On the other hand, in today's crude market, volatility seems high and futures predictions are pretty much anybody's guess. Hence the big spread. Altogether, I personally don't think markets predict things very well at all. I think they reflect current perceptions which are based on current volatility.
http://tonto.eia.doe.gov/dnav/pet/hist/mgfupus1A.htm
I know plenty about seasonal variations--remember, I'm one of the other card-carrying economists around here, with more time spent studying stats and econometrics than I care to remember. I even have a minor in a foreign language: Greenspan.
Trailing averages are often used, but I don't like them because they don't go through the middle of the data, so it doesn't act as a useful smoothing function to help see the trend in the data. As you can see, this one is lagging six months behind the action.
I do agree your philosophical preference for centered ma, and admit to surprise at my apparent preference for trailing, it could be because I have tended to use a weighted ma for things I have analysed.
Regardless, an upturn now would be a mite surprising, lol.
http://www.resourceinvestor.com/pebble.asp?relid=18338
2004 - 3,332,579 (Thousand Barrels)
2005 - 3,330,805
We can provisionally call that a hurricane effect, somewhat, but if we think hurricane prices are going to be repeated this year ...
http://tonto.eia.doe.gov/dnav/pet/hist/mgfupus1A.htm
Though I suppose that could happen again this year, too...
I've always tried to put no more than provisional explanations on past events. Reading Nassim Taleb has reinforced my distrust of post hoc explanations.
So, I provisionally see an economic downturn associated with the hurricane. I also see a large oil-burning response to the hurricane. I see a lot of oil-burning mirgration following the hurricane. How does it add up? I'd be a fool to try.
It's easier to be patient and see what gas prices do to consumption this year.
(I've seen premium over $3 in my neighborhood for the first time since the hurricane. The average price for regular has climbed here to $2.79. Post hoc explanations for these California prices abound.)
If I do something, millions of others are doing or will do exactly the same. We are the sheeple. I know it might sound as if I'm being sarcastic, but I am dead serious.
Other stuff we average Joes are doing: compact fluorescent bulbs at home, biking to Walgreens for prescriptions & etc., adjusting thermometer, shopping local farmers' market more often, growing vegetables in the backyard, buying only energy star appliances, replacing windows, composting, paying more attention to what we reuse and recycle.
Believe me, the number of people who will be doing all these things will grow fast.
Well, actually I know of one way to reduce my uncertainty, and that is to trust longer timescales. It is definitely fun to watch the data roll in (particularly this month's SUV sales data), but I try to remember that any one month (and possibly any single year) could just be "noise."
I am sheeple, hear me baaa. We are waking up out here. Power to the sheeple.
Good for you! Kudos and applause! Please keep spreading the Peakoil Outreach to all you can.
Bob Shaw in Phx,AZ Are Humans Smarter than Yeast?
I'm in the process now with a 1,100sqf small village house and low energy footprint lifestyle.
Hoping that everything holds together for the next year or so to complete the transition. No, I'm not a doomer, but reading the data and seeing the obvious patterns developing as prompted my action.
You are being impolite. You should be congratulating him for powering down, as I did. Everyone is entitled to the entropic energy beliefs of their choice. AFAIAC, as long as they refuse Denial and strive to understand entropy--that is 99% of the Peak Everything battle.
Bob Shaw in Phx,AZ Are Humans Smarter than YEast?
It is my firm belief that if you keep holding out some fantasy techno saviour, you will lull the population back into their consensus trance. Why do that?
We know there will be a transition. The only question is do we want to start now while we have X amount oil or when we have X-Y?
I want people to start now. Not one day later. The only way to do this is to either scare the bejesus out of them, use government forces to do it, or simply let the placid teeming masses caught up in Hummer dreams march towards the cliff. Oh happy lemmings!!
And, by the way, I am extremely happy. The path to happiness lies not in the great American consumer fantasy but in self-reliance and local action. Traits that used to be associated with Americans, but no longer. Now, we demand the free lunch, no taxes, no guilt, and all covered in a creamy helping of cheap oil. I like the old American way. This new way is far too liberal. Damned namby-pamby republicans and their love of cheap oil. The current overwhelming fiscal irresponsibility of the Republicans is wonderfully ironic and simply mimics the typical American's feeling that they have an entitlement to their solar spendthrift ways.
Unhappiness will come the way of those who place bets that counter the iron-clad rules of physics. Touch the fire, you will be burned.
I guess you noe (=intuitive know) by now that I share your bleak estimate of the future, Cherenkov. I don't think it inevitable, just highly probable unless we humans make the most massive change in our species history (and even that may not be sufficient).
Accept it: they are not going to start now. Even if they did there will still be great pain. Some mental phase shifts must happen, if they don't this species (humans) should die, if they do then we may survive to meet the next challenge.
Happiness has nothing to do with consumerism (that is just a clever delusion it would take me pages to fully explain), but nor is it very much to do with self reliance etc. Happiness and contentment are mostly an internal process, though having external aspects, it is quite easy for most people to be happy without the things they believe make them currently happy.
And yet all we seem to hear from you guys is "Dieoff is coming, so sit back and enjoy".
Do you have any idea how damaging to the PO cause this kind of crap rhetoric is? You say you want people to change, but you force them to view a future with no hope. Why would someone decide to change their ways when they are told that there is no hope?
Worse still, this kind of wild scaremongery makes the whole PO topic look like it is backed up by a bunch of nut-jobs. People will view your arguments the same way that we view the Abiotic Oil theory.
You want people to change now, but I'm afraid you have to realise that this supertanker called mankind cannot turn on a sixpence. If you try to turn the steering-wheel round with too much force, it will simply snap off in your hands.
We all need to apply gradual pressure in as many places as we can until the momentum builds and wholesale changes get the ship turning smoothly.
Anything else is a waste of time and effort.
That means applying that pressure NOW.
Don't put words in my mouth unless you understand the concept of sarcasm. Nothing is more disheartening than to have an argument with someone who lives in literal world. It's like having an argument with a child.
My thesis has always been the change is coming and the sooner we do it on the best possible terms the better.
I would sure hate to scare someone standing on the train tracks and scream at them to get the hell off the tracks. Far better to whisper and make coy waving motions. Scaremongery is not a word, but I get the drift. The problem with calling someone a scaremonger is that the scaremonger must be drumming up fear over something that is not true. Either you are a cornucopian or just a someone who is not well versed in the art of argument.
Yes, it is a supertanker. DUH. But, if you want to turn the thing you better start now. I have even used this image before in my posts. The sad thing is you have read your thoughts into my message and mangled it badly. Another example of poor rhetorical skills.
Yours is an attitude that will sink the world -- the idea that we just need to sit around and figure out a new way to continue the old paradigm.
This is magical thinking on your part bub. Physics is not about your touchy feely weirdness. Physics just is.
I have yet to see anyone make the "we're all doomed" case with any kind of solid quantitative reasoning. What exactly is the critical resource (or combination of resources) that will be limiting of the human population, how much of it is there, and how do we extrapolate it into the future in such a way that we can be confident there is no escape, and that no combination of innovations and substitutions can solve the problem. I've never seen anyone even try to make an argument like that.
All I've seen is handwaving - English professors telling us that they have the true understanding of the implications of physics (without writing any equations...), or laywers telling us that only their understanding of sociobiology can lead us to a correst assessment, and the rest of us must be idiots for not seeing the truth as clearly as they do.
An important (to me) way that I judge people is by their "permeability to evidence". That is the human tendency to change their views when contrary evidence shows up. People who are deeply stuck in some psychological script of their own (often from childhood experiences, but sometimes from a societal paradigm) that they aren't conscious of see the world through some kind of distorted lens that makes it very hard for them to absorb any evidence that will change their mind. Some are rabid optimists and cannot accept that anything bad can ever happen to human beings. Others are rabid pessimists who feel that we're all doomed and there's nothing that can be done about it.
The appropriate reaction to a new piece of evidence or a new possible technique is a sense of curiousity, and a desire to know more about it to see if this changes the picture or not. If instead, you find that your first reaction to a new piece of evidence or technique is a sense of discomfort and a casting about for ways to discredit it, that suggests that your permeability to evidence is rather low.
I think people of low evidence-permeability are not helpful in solving problems. Regardless of the particular script they are stuck in, they make things hard. They burn witches, ban books, commit genocide, fly planes into buildings, invade countries for false and foolish reasons, ignore and deny important problems until very late, and then make unsupported pronouncements about the solubility or otherwise of those problems.
Please read my post of Tues APR 4 @12:20 EST on the thread "NYC: Best Place for $100 oil? Maybe..."
Your quote: "An important (to me) way that I judge people is by their "permeability to evidence". That is the human tendency to change their views when contrary evidence shows up."
Now I am no computer guru nor a statistician, but I too agree with your quote. I am going to try & see if there is some way to quantify the concepts briefly described in my posting, but it seems intuitively obvious to me. I gonna flail away....I shall return.
On another forum, I generated a posting with a huge number of ratios and variables that hopefully could be used to predict Duncan's Olduvai Gorge, but nobody volunteered to statistically evaluate it for me. Yet, I suspect the CIA/NSA routinely uses supercomputers to generate all kinds of scenarios and wargame simulations.
Bob Shaw in Phx,AZ Are Humans Smarter than Yeast?
Just a quick glimpse at some of the research directions I hope to be heading to: KAROSHI, Death from Overwork. I believe as the downslope really kicks in, there will be a massive shift to increased hours of manual labor to replace the luxury of machines [optimistically? thinking society will still prefer work to violence].
http://www.workhealth.org/whatsnew/lpkarosh.html
----------
The first case of karoshi was reported in 1969 with the death from a stroke of a 29- year old, married male worker in the shipping department of Japan's largest newspaper company [1]. Karoshi can be translated quite literally as "death from overwork." The major medical causes of karoshi-deaths are heart attack and stroke, including subarachnoidal hemorrhage (18.4%), cerebral hemorrhage (17.2%), cerebral thrombosis or infarction (6.8%), myocardial infarction (9.8%), heart failure (18.7%), and other causes (29.1%) [2]. The Ministry of Labor began to publish the statistics on karoshi in 1987, as public concern increased [3]:
For example, a big life insurance company investigated 500 male white-collar workers in top-ranking corporations in Tokyo. The report shows that 46 percent of respondents were anxious about their own risk of karoshi. A quarter of them experienced complaints from their families related to anxiety about karoshi. Around 5 to 20 percent of the workers themselves were afraid of the high risk of karoshi. This fear increased with age. The report also shows that family members are much more afraid than the workers themselves. Nowadays, there are almost no workers who do not know the word [karoshi]. Many Japanese workers and their families are anxious about karoshi.
There are no epidemiologically sound estimates of the prevalence and incidence of karoshi. Until recently, there were 20 to 60 deaths each year from overwork for which the Ministry of Labor awarded compensation. However, critics state that the number of people the Ministry compensates for such deaths is much less than their actual occurrence [4]. The overall number of deaths related to cerebrovascular or cardiovascular disease in the 20 to 59 age group is around 35,000 per year according to vital statistics data. Kawato estimates that one-third of these are work-related, or more than 10,000 each year [4]. In 1994, the Japanese government's Economic Planning Agency in the Institute of Economics estimated the number of Karoshi deaths at around 1,000 or 5 percent of all deaths from cerebrovascular and cardiovascular disease in the 25 to 59 age group [5].
---------------
This is all occurring during the cheap energy upslope when optimism reigned in Japan. Will this deathrate triple, quadruple, quintuple, etc, on the Hubbert Downslope? How will Americans, already in poor physical health, medically react to a massive increase in arduous labor?
Bob Shaw in Phx,AZ Are Humans Smarter than Yeast?
Office workers! Exactly the kind of jobs that are most likely to disappear post-peak.
And it's not what I call "arduous labor". I use arduous labour in my graden to relieve my stress.
The kind of stress that office workers deal with is very bad for your health. Deadlines, office politics, and other workload factors signal the body to produce adrenaline, the "fight or flight" hormone.
But we can do neither of these in an office situation.
After prolonged stress levels, the adrenal glands become exhausted and the brain signals the release of the hormone cortisol.
Together, this prolonged mix of toxic chemicals takes an incredible toll on the body.
Another reason why a post-carbon world will be better for us.
Switzerland and Sweeden during WWII
Cuba post USSR
Russia post USSR
It is hard for my brain to go from Stuart's wonderful fact-based graphs (crack for PO'ers) to opinion-based Doomers.
Very helpful are the powerdown stories.
Very well-stated! A+
And as far a preparation for the coming future goes, I think the single most important skill is to have an agile mind. The faster one can recognize and adapt to changes, the better off one will be. If you are preparing for a future that is not going to happen, you are at an extreme disadvantage.
I can just add the following: it is normal that at the moment you receive new information contradicting your current views to you resist accepting it. Denial is the first reaction to anything chaning the status quo. But if you are critical and inquisitive enough you can overcome that phase and actually expand your views and correcting them eventually after some iterations (in TOD for example). The most important and hardest point is to identify yourself being in denial, after that it is easy.
Stuart,
How about Catton? He makes a pretty compelling case that we're living on ghost/phantom acreage, either importing food from somewhere else, or consuming sunlight from somewhen else, and that since we now have a population dependent on a spectre, as it disappears, so must many of us. Tie in what Lester Brown has to say about water depletion (even though aquifers recharge, we can tax them well beyond that rate, and suddenly have an unsupportable situation when we need 90 units of water, but the recharge rate is only 10...) and the whole energy/water/food equation seems highly unsustainable, and as much as I appreciate and practice conservation, efficiency, renewable and organic approaches, it seems pretty clear that even in concert they can't replace the "productivity" that fossil fuel and fossil water extraction temporarily has allowed us.
I have studied (informally) the impact of Urban Rail on cities (mainly US but also others). I had concluded (say in early 1980s) that it was "enough" to build a decent Urban Rail system in a growing city (shrinking or stable is another matter) and it woudl start to grow around it. TOD (the other one) woudl entice growth there.
Seems to be working well in Dallas & Portland, less so in San Diego but sort of, etc.
That was the limit of my ambitions. In New Orleans, the "next" streetcar line.
Then I clued into electrified intercity frieght (with some pax) railroads. An easy solution taht made sense.
I still see building all of the "on the table" Urban Rail that cities want + electrifying major railroads as Step 1.
New cities will want Urban Rail when others get theirs IMO.
But is this "enough" ?
Add hybrids, small diesels, less plastic waste, more bike lanes, and other easy steps.
Closer for sure.
Tar sands, coal to liquids, remote natural gas to liquids, ?
Maybe.
I do NOT know if this strategy will work out for the next 20 to 30 years. More may be needed. The number of unknowns exceeds the number of knowns, which makes for an insoluable problem. The number of assumptions required for the unknowns in order to find a solution is so large that some are surely wrong. So I see Peak Oil as a "wrestling with jello" problem.
However, I am quite clear about what needs to be done in the next few years in the US and will concentrate on that.
Ya don't say! And I thought we had to do it next year! Silly me!
Which is something you seem to be very good at: Please point me to any comment that I have ever written here on TOD which states that everything is just fine and we can carry on with business-as-usual.You see, this is the trouble with your kind of attitude.
It's the "either you're with us, or you're agin us".
I do not buy your mankind collapse arguments, therefore I must be a cornucopian, business-as-usual, energy-hungry consumer. QED!
Masterful reasoning, Cherry!
The aggregate of the analysis I've seen on this site over the six months or more I've been lurking has validated the shape of Stuart's graph and the story it's telling - the Peak Oil plateau is here now. That appreciation makes reacting to the data (as distinct from further validating it) a matter of some urgency. My contribution, therefore, is to assure those of you crunching the numbers that your efforts are having some effect on people, and thereby to encourage you to keep doing it.
The numbers exist not of and for themselves, but to goad people to action. Whether I'm a doomer on the global scale has little significance. The important thing is that the numbers are now believable enough that I'm willing to make real-world changes in my life because of them. I'm convinced that the more of us that do do so, the more of us will survive, which is a far cry from throwing up my hands and wailing "All is lost!"
This pattern is also repeated in my work environment as of late. People are on edge and quick to start a conflict for unfound reasons.
Of course, staff reductions and work reorganizations do not help.
Just an observation.
There is a general tension among people I know as well, a sense of things going wrong. I think it is more due to economic and political concerns.
This could be something as subtle as less people at the call centers causing longer delays when trying to get assistance for troubleshooting an issue with your PC.
Just a little more frustration thrown into our daily lives because the company could not afford to keep the call center staff it did a year ago.
And you have probably made more change in three years than most puffed up enviromentalists.
So, what made you change? can we 'bottle' it and infect other sheeple with it?
Why are you awake?
In terms of how to get the message out to the marginally receptive, words and numbers won't do it on their own. We're a visual species, and the one mechanism I've found most arresting is charts and graphs. Every time I see one of Stuart's big green graphs I stop and read very carefully. I've had more "Oh shit" moments from looking at graphs than from anything else.
One more thing that the movement needs to do is to develop a succinct sound-bite to counter the notion that it's the all the fault of profit-gouging oil companies. People notice the pump prices, but as was said earlier, their initial reaction is usually one of "damn oil companies". While it doesn't help that ExxonMobil is now the richest company on the face of the planet, we know that PO isn't their fault. I'm still trying to find some way to get this notion across to others without having their eyes glaze over.
And one more comment about doomers - there's a subtle but huge difference between "We're all going to die, nothing can be done", and "The scale of the problem is so vast and its implications so severe that many of us will probably die. We need to minimize that number as much as we can." This probably shouldn't be the first concept you hit a prospective PO convert with, though...
Different people use different methods of communication. I suspect most of us are trying to help, and we spreading the word in the way that worked for us. For some, fear and apocalypse is the best way to reach them. You have to admit, it draws attention that dry charts and graphs do not.
I was part and parcel of this planning effort. The attitude of ordinary people of New Orleans attending these planning sub-sub-committees was QUITE positive again & again.
We "Get It" here and asked for $3 billion in new Urban Rail. We are likely to get only $1 billion now, but the die is pretty well cast.
At the same time hybrids had a record year with sales of 0.206 million cars representing 1.2% of the total passenger car sale of 16.95 million.
The effect of using the more fuel efficient of your two cars must be bigger, in the short term.
Were are we going no one knows, but Russia won't grow forever; 10 MBD might be their terminal point. All in all, we're no where near the path to meet the demand of 87 MBD projected by the IEA for the final quarter of 06.
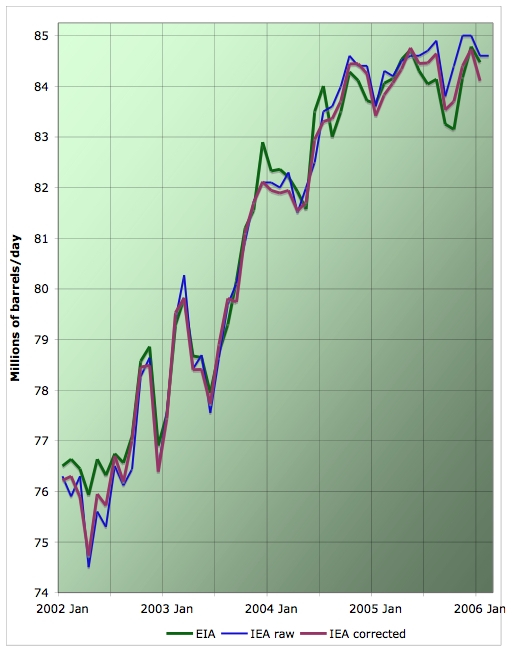
- Not only the absolute production figures, but even the month-to-month changes claimed by these sources cannot possibly be consistent with each other, even when allowances are made for the different ranges of hydrocarbon products involved.
- This problem is by no means limited to data concerning those producers, like the leading OPEC members, which many people believe publish misleading or incomplete information. It is equally acute for such countries as Canada, Norway and the UK.
- Only for the US and Mexico among large producers are differences negligible between the three sources.
- Incompatible as EIA and IEA figures are with each other, those from JODI are even less compatible with either of them.
Can anyone do better than a guess as to why things should be so?In the data with which I am most familiar (estimates of current velocities in oceans and harbors, population estimates, various kinds of sociological statistics, economic data published by various government agencies, and especially by the Federal Reserve System) the margins for error are frequently far larger than are realized by people not in the business of collecting and analyzing and adjusting the data.
For exapmle, you have to have considerable training or education or experience as an economist or statistician to be able to separate noise from information in GDP data. Few business journalists have the expertise to understand the data they comment on at great length. Getting accurate and valid data is enormously difficult and rather expensive--and sometimes impossible. Relatively few people--and even a relatively few Ph.D. economists--have the skills needed to do a worthwhile analysis of, for example, data published by the Fed. (However, I suspect that Lou G. is one of the few.)
As to oil statistics, they're even worse. There are clearly significant errors, they are clearly systematic (at least in part) rather than entirely random, and we have no way to estimate how large they are. I don't know what else to do than investigate most questions from multiple sources of data and hope that when all the data sources agree, there's most likely a real effect.
If you are correct that oil-production time-series data are more prone to error and uncertainty and lack of precision than are inflation statististics, then I do not know whether to laugh or cry. About those statitistics I know plenty, and a pinch of salt will not do--maybe about five pounds to a gallon . . . or thereabouts when trying to do either the GDP deflator or the various versions of the Consumer Price Level index. Briefly, if there are three digits, the first one on the left is probably right;-)
The right-most digit is almost always always "wrong."
The middle digit may be correct or only off by one about half of the time, depending on exactly which chunk of data and what time period one is looking at.
Despite these limitations, the data are extremely useful for understanding what is happening, how fast things are changing, and what monetary and fiscal policies might be appropriate.
I recall that Jay Hanson warned some time ago of the danger of using previous hi-ERoEI barrels and infrastructure to find ever-decreasing amounts of lower-ERoEI energy in increasingly numerous, but ever-smaller fields at ever-greater depths at ever-greater costs. It is difficult to determine when this exactly occurs as the total embedded ERoEI aggregate approaches unity.
Does a portion of this appear to be happening now in the 2nd graph [with the smoothing long term averages]? If the relative energy quality of the now extracted oil, and the total infrastructure ERoEI dedicated to bringing this extraction to market could somehow be incorporated into a new graph that reflected these effects: then the slope might possibly be declining for the last period. In other words, the graph appears plateaued, but significantly less refined product will actually hit the enduser markets in the months ahead. Who knows? Is it even possible for you TOD geniuses to graph this?
We might be close to the point of unity ERoEI on many individual wells, but we keep pumping to help recover the already embedded financial cost at a net loss of that well's lifetime ERoEI. The best example I can think of, at this moment is: a Hummer driver unknowingly burning 42 gallons of premium gasoline to make a roundtrip of getting, then hauling home 42 gallons of low-grade crude to earn enough money to make his Hummer payment.
For example, consider the wells in the GoM, and now Australia, that were flowing before the hurricanes, but were shut-in because the repair costs to the damaged infrastructure didn't justify re-establishing the flow. This new estimation of repair cost is a much easier calculation than trying to determine a unity ERoEI crossing point for a still functioning well.
The ongoing conflict in Nigeria doesn't lower the energy quality coming from the wells, but all the required infrastructure repairs do tend to lower the final ERoEI. Or the vast military infrastructure costs trying to protect the Iraqi oil infrastructure, this lowers the final lifetime aggregate ERoEI from the wells too. Is this something that can be graphed?
Bob Shaw in Phx,Az Are Humans Smarter than Yeast?
How much energy does it take to run a stripper well, with all logistics of getting it to market included?
I agree that in the future a much greater percentage of our petroleum energy is going to cycle right back around to obtaining petroleum energy.
Can the market ever tell that a well is consuming more energy per barrel than is contained in a barrel?
This is particularly true of sour crude which requires a lot of post well processing. Someone explain to me how the market watch dogs this equation. Seems to me high dollar values on crude will will be favored over EROEI if any other form of energy can be used in the refining and distribution steps. I can imagine a net negative return on energy, to create liquid fuels and we would still be doing it.
Thxs for responding. Yeah, it is 'negative efficiency' in the extraction system; a direct, but hidden process loss of energy! Like a polar bear burning the equivalent of 1.25 seals trying to catch just one seal to eat. Polar bears rarely drown [it requires being injured by a walrus, killer whale, etc], the bears just become exhausted and spent trying to reach the foodsource on the ever-shrinking ice floes. Then they drown. Entropy rules all!
Bob Shaw in Phx,AZ Are Humans Smarter than Yeast?
In a less extreme exampe a well might appear to be economically viable even where the electrical power used to run the pumps was greater than the net energy represented by the crude oil produced [where because of pricing mechanisms the electricity costs less than the crude produced.]
You are however correct that a lot of other stripper wells do not go negative in a pure EROEI basis. They go negative economically before they reach that point because royalties [to the mineral rights holders] and severence taxes come off the top before an operator can begin to cover expenses. When a well starts to bleed cash with no prospects for further upside, it gets shut down and due to ground water considerations it gets plugged.
A great many US stripper wells were plugged and abandoned during the period that prices held at the $10 to $15 mark. Now that prices have increased fourfold those wells would be economic; however they are no longer available unless redrilled.
We will have to wait and see what happens, but I predict a quickly developing and severe problem with net export capacity worldwide.
--------------------------
Hi West Texas, sorry to be pedantic, but I checked your link and I think the EIA is right. Your figure of 10,245 kbpd is correct, but only for the last week in March 2005. The 4 week average for March 2005 is more like 10,049 kbpd. So, apples to apples, the reduction in gross crude imports is 1.7%, year on year.
However, I agree with all your points: the trend is down and given the increased income of the exporting nations, their consumption is likely to increase and hence their exports to decrease.
The website has average daily oil imports into the US, on a weekly basis.
The average for the past four weeks of 2006 (all falling in the month of March) was 9,879,000 bpd.
The same website has the average daily oil imports into the US, on weekly basis, for four weeks in March of 2006. That number is 10,244,500 bpd
10,244,500 bpd - 9,879,000 bpd = 365,500 bpd
You have been looking at the four week moving average. I am comparing weekly numbers to weekly numbers, and then averaging over comparable 30 day periods of 2005 versus 2006.
365,500/10,244,500 = 3.57%
We have historically high spreads between light, sweet and heavy, sour. We have historically high (nominal) oil prices and we have falling imports year over year. I think that this is a sign of things to come.
The same website has the average daily oil imports into the US, on weekly basis, for four weeks in March of 2005. That number is 10,244,500 bpd
I would agree if we were at 40% of Qt worldwide; however, I think that production declines and import declines are potentially far more significant after 50% of Qt than before 50%. And as I have pointed out, net export capacity is going to be squeezed from two directions, by falling production and by increasing domestic consumption, which is why I am paying so much attention to the year over year import numbers.
I think that these small import declines are like a small cascade of pebbles falling down the mountainside--right before a massive landslide.
Water crisis predicted on the Prairie
Canada may have to choose between producing oil and producing food:
Climate Impacts on Washington's Hydropower, Water Supply, Forests, Fish, and Agriculture (scenarios)
Impacts of climate change on Washington resources
Potential Impacts of Climate Change on Agriculture and Food Supply (Consequences 1(2), 1995) (a bit dated)
Let It Reign: The New Water Paradigm for Global Food Security
Can irrigation be sustainable, (Crop Science for addressing water scarcity Symposium, 2004)
Water in a Changing World (2001, RB Jackson, SR Carpenter, CN Dahm, et al., Issues in Ecology)
Crude Production less NGL down 8.7%
Crude imports down 2.9%
Crude runs to refinery down 3.6%
Gas supplied up 1.0%
Gas refined production flat 0.0%
Gas imports up 28.8%
Gas impt's + production up 2.7%
Distillate supplied up 1.9%
Distillate refined production down .7%
Distillate imports up 27.9%
Distillate impt's + production up 1.6%
The percentages were derived by summing the weekly posted daily averages for each year.
I suspect much of this is due to loss of refining capacity from Hurricanes in the Gulf.
So the U.S. hasn't changed its consumption of gasoline, just the source.
So unless a whole lot of offshore excess capacity just came on line, who over seas gave up gasoline so the U.S. market could have it?
No shortage in the U.S. does not mean no shortage worldwide of a fungible product. The highest bidder can always maintain his supply. He will never see a shortage until everyone else has 0 supply, if he is willing to outbid everyone else.
If this is what is happening, how long can the U.S. economy outbid all other economies?
Totally agree with you - this is the real story now.
However, if there has been a loss of refining capacity worldwide and it is not replaced than my argument holds. Someone else is doing without gasoline so the U.S. can have it.
I find it hard to believe there was a large surpluss of gasoline that could be purchased on a daily basis. Expensive gas, either from lack of crude or just lack of refining capacity, keeps poor countries from purchasing gas.
This feeds back to the supply/price ratio indicating what the ROI would be to build more refineries or get more crude. If poor countries can't afford gas above a certain price there is no incentive to try and make it. Clearly this speaks to the price of refined products. For one reason or another they are getting more expensive.
High price is driving out buyers, just not the one who is consuming the most. Since the U.S. consumes almost 25% of the worlds oil we should be the one curbing consumption. This won't happen as long as price impacts our buying habits last.
The analogy I think of is to water in the southwest. I have seen this example first hand. Golf courses use an enormous amount of water per person. In areas that had water rationing they crank up the price but often have contracts to deliver water to all customers if they want it. So the price of water goes up in an effort to force conservation. What happens is the poorest people stop taking showers to save money but the golf courses don't change because tourists can afford higher greens fees to pay for the water. There was actually more water being used on the Golf courses during drought than before. It was drier and hotter so more irrigation needed.
There was very little net change in water usage just on price changes. It just went to other places. The only solution was to break the contracts on delivery with the water districts regulating how much water users could get. This was a large financial problem for some owners of grass that couldn't survive without irrigation.
The US is now running a huge 'energy deficit'. Adding up crude oil, natural gas, LPG, fuel oil and petroleum products from the trade releases, in 2004 the deficit was $185bn. In 2005 this rose to $258bn. Jan 2006 was $25.4bn vs $16.8bn in 2005. The 2006 deficit might well be over $300bn, even if all the refinery capacity is brought back online.
http://sydneypeakoil.com/phpBB/viewtopic.php?t=1972
Unless the Haradh project with its 300 thousand barrels is reflected in production statistics (wherever we should look for them :-)) perhaps one shouldn't count too much on the further 4 mb promised by Aramco for 2007-13.
I still wonder, however. First, while he acknowledes the peaking of Mexico and other countries now and in the very near future, he doesn't go into any detail about how he factors them in (while in his analysis new production is very detailed). Some have suggested that Cantarell by itself would take up to 2 mbpd off the market by the end of his study. He also only subtracts world capacity from countries/regions clearly past peak (N. Sea, etc). However, the peaking and decline of Ghawar and Burgan (producing together equivalent or more than the entire North Sea) have profound implications for the whole world that I do not believe are reflected at all in his analysis, since he's not considering S.A. or Kuwait as declining producers. I believe we are at a great historical discontinuity in the production of the largest of the megafields, with most peaking last year or this, meaning historical data will not adequately reflect the impact of their decline. I don't have the answers, I just think these are clear concerns that are not taken into account in his numbers.
Overall, I think his work is a very fine and valuable contribution.
FIP decline of 2% is probably very silly, 5% would be nice, more, perhaps 10% and more for some, is plausible. You are right: FIP decline is absolutely critical. Now go enjoy your last summer.
Don't confuse the rate of individual field decline with the overall decline rate of all existing fields. Even if we assume that a particular field is declining at 5%, 10%, or more (or, in a more extreme case, that all fields, when declining will decline at rates of 5%-10%), it cannot be inferred that sum of all existing fields (some of which are increasing in production, some of which are level, and some which are declining) will add up to an overall decline of 5%.
Hopefully someone better informed can enlighten us, but I just don't see refinery utilization as being a big issue, at least as reflected by the market.
Also, as I posted a few days ago, the usefulness of the crack spread is declining as refineries shift to the processing of heavier crude. The 'coking spread', which gives an indication of refining margins for processing Mexican Maya went over $25 last week, against the 1994-2004 average of $6.89.
In short, refining margins are currently very high.
RR
I think "Slow Squeeze" should be added to relevant posts list.I believe it is a very very important post to the overall issues, especially to beginners.
On June 1, 2006, US refineries must start producing 0.015% sulfur diesel instead fo 0.5% sulfur diesel for 80% of their "Over-the-road" (i.e. taxable) runs. The other 20% can go to fleet sales, fleets without 2007 and later engines.
This June start gives the supply chain time to reduce (via dilution) the at the pump sulfur levels for the new low pollution diesel engines required on 1-1-07. New pollution control strategies are fouled by excessive sulfur levels (think lead in gasoline & catalytic converters).
There has been time to build new desulferization units, BUT some refineries plan to make "off road" diesel (farm, construction, barge, railroad) for a number of years till that to is required to go to lower sulfur content (June 2010).
IMHO; plenty of places fro foul-ups.
http://ecdiesel.com/environment/ulsd_qa.asp
RR
Sour crude oil now looks even less attractive. I noted on the BP site that they were adding desulpfurization units to some refineries, but others were already "OK".
I strongly suspect that certain sulfur inputs were assumed when capital planning was made several years ago and desulpherization units were designed and approved.
That is, these refineries will have trouble processing higher than designed sulphur crude and producing legal over-the-road fuel.
The biggest impact, though is that low sulfur gasoline makes it harder for gasoline imports to meet our specs. I don't have a direct link, but I pulled the following quote out of a Bloomington, IN newspaper last week:
"Effective March 1, federal law requires oil refineries to remove more sulfur from gasoline. The law added an operating cost to U.S. refiners, but it also limited gasoline imports. Some foreign oil refiners stopped exporting gasoline to the United States to avoid the stricter laws, putting more pressure on U.S. refiners to produce more gasoline."
This is an additional restriction in supply that I haven't seen get very much press.
RR
And Brazil was a solution to exactly what again, oh ye cornucopians?
Sustainable agriculture is a real issue (and goal) but it is not a "peak" problem.
So it could end up being a very real "peak" situation.
(They are easiest with imports of animal manures etc., but I think green manures, cover crops, work also ... though more slowly.)
I'm relying on the rusty chemistry degree floating around in the back of my head, and my similarly ancient experience as an organic gardener. I will yield to any active practitioner in sustainable agriculture.
Actually, I worry when experts in one area (oil depletion?) suddenly extend their expertise to override those in another field. I think sustainable agriculture practitioners believe they have an answer.
Good point. Think of the Sun as an unlimited Ghawar oilfield, but the extraction infrastructure is the critical part. plant seed=drill rig, water added=oil pipeline, soil fertility=refinery. If you don't keep refurbishing the refinery to produce at optimum levels, or the pipeline breaks, or you cannot buy drill rigs: your infrastructure quickly becomes worthless.
Bob Shaw in Phx,AZ Are Humans Smarter than Yeast?
In the case of fossil fuels - isn't the problem coming down to our enormous rates of consumption? If we used, say 10 mln.bpd. of oil world-wide, then we could have easily switched to renewables to synthesize oil when it starts declining (not very soon if consumption was controlled indeed). I think it is safe to call those 10 mln.bpd a "sustainable level".
Similarly overproduction above the sustainable level is the cause of concern in the case of sugar. We are consuming natural capital (in this case topsoil, water, forests, biodiversity etc.) that in the long term will bring the production well below the sustainable level and will have severe consequences for everyone that came to depend upon it.
But the argument made above is really about sustainability of agricultural lands. See also:
http://www.theoildrum.com/comments/2006/4/3/184927/4733/110#110
There are two aspects of the problem - intensive agriculture uses more fertilizers, irrigation, machines etc. to produce higher yields. I personally do not buy it that with the decline of fossil fuels this will need to be abandoned - many decades of decline will be more than enough to develop alternatives to current practices. The problems may come from erosion and loss of nutrients, but these are manageble with crop rotation, proper irrigation etc. IMO as long as we keep cultivated land under some percentage of the total land, IMO the human impact can be mitigated for indefinite time.
The elephant in the room is extensive agriculture - when areable land grows and replaces existing ecosystems - this besides being a death sentence to crop rotation or other sustainable practices will produce enormous risks long-term. And with intensive agriculture less affordable and population booming this is a very real threat. I'm particularly worried by the prospect of deforestating Brazil so that we can drive our cars on ethanol - this simply does not seem right.
On the continued conversion of native forests into agricultural lands - that is a problem. I kick a few bucks now and then to "conservancy" groups. But what are we going to do? Our ability to influence other nation's conservation programs are limited. And the biofuels market will be bigger than us.
... back to individual action, and conservation.
Barren soil is starving Africans:
Experts call for focus on fertilizing exhausted earth.
Good article, thxs. Shows how overpopulation creates an unsustainable biosolar burnrate [Remember, these people never had any or little fossil fuels.] If the NE or NW parts of the US secede to become the initial biosolar habitats, this article points out how most of the people living there now will have to move out to reach a sustainable habitat human/acres density.
Bob Shaw in Phx,AZ Are Humans Smarter than Yeast?
Chavez rules out return to cheap oil
Didn't Saudi Arabia open up a new pumping station (with all kinds of fanfare attached) that's supposed to pump out 600,000 bbl/d? So I don't understand why SA production would be DOWN in the first graph, unless their older oil fields are declining a lot faster than anybody thought. Thoughts?
As I've mentioned before, I have a bit of fascination with the 70s. I suspect there are significant lessons we can learn from that era that can help guide us with respect to the near-term responses to oil peaking.
So I've been busily looking up a few numbers, in particular the time frame from 1978 to 1981. This seems to be the nastiest part of the previous gas price spike, when oil went from around $45/bbl to almost $90/bbl (in 2005 dollars.)
In this time frame, we have one of the rare reductions in US VMT, some real changes in behavior, and a reduction in gas consumption in the US. The other main text of this era is that this is when automakers got religion and increased fuel economy, with perhaps a nudge from the US government and new CAFE standards.
However, I've found a really interesting subtext that has real bearing on our discussions of consumer behavior. A while ago, a poster here pointed out that all people had to do to deal with oil peaking is go out and buy a car with much better fuel economy. I pointed out that that is not as easily done as said, since many people are in hock so deeply that they can't go out and buy much of anything. Also recently, I found a Washington Post column that advised an SUV owner to keep driving their Expedition since it was more cost-effective to do that than to buy a new SUV with better gas mileage.
So I did some looking and found three extra pieces of auto information about the 78-81 era that aren't much reported. First, while new domestic and import car and imported truck fuel economy climbed rapidly in that era, new domestic truck fuel economy actually fell initially, and then rose. See the lower dashed line above.
Second, while new vehicle fuel economy rose, existing fleet fuel economy barely budged - from about 14mpg to 15-16mpg for cars and about 11mpg to 12mpg for trucks. This hardly looks like everyone running out to buy a new fuel-efficient vehicle and scrapping their old one.
Finally, which corroborates the last statement, car and truck sales fell off a cliff then too. Car sales went from about 11.2 million in 1978 to about 7.8 million in 1982. Truck sales went from 3.3 million in 1978 to about 1.8 million in 1981. Both sets of sales then slowly rose after that, with truck sales beating the 1978 record in 1984, but with car sales never beating its 1977 peak of 11.3 million sales. From EPA Light-Duty Automotive Technology and Fuel Economy Trends: 1975 Through 2005.
Here's what this all says to me. Americans are, for the most part, unlikely to ditch their current motor vehicle for a new one with better mileage for a long time. That long time may be the life of the vehicle, which could be 15 years or more. They are more likely to keep making the calculation that sticking with their current truck/car is more cost effective than making a change. This situation is likely to be exacerbated because the trade-in value of that truck/car will have fallen substantially and the person will have wrecked their finances paying for fuel for that vehicle/driving distance. This is pretty much what happened last time, and the things that saved people were rapidly falling gas prices and the safety valve of bankruptcy. Neither of these is likely to help as much this time.
I wonder how many families have one large car and one small one? My parents do; that's the pattern they've had since they could afford two cars. But I know a lot of people who have two big cars, or an SUV and a mid-sized sedan, or a big car and a truck.
I certainly think there's room for a component of "The Saudi's could increase production but aren't very motivated to do so" in the overall explanation. Their rig count is not very large, and perhaps if it was, they'd produce more. In the grand scheme of things, it's probably better for everyone if they keep their production stable for a longer period, rather than using it up at a higher burn for a shorter period.
The article you link is interesting though - Haradh was another step in the much vaunted scheme to increase Saudi capacity to 12.5mbpd. It will be interesting if the mythical capacity keeps going up, but like Haradh, none of it ever causes production to increase.
Simply to demonstrate they can? Oil is steady around $60-$65 with no indication that this is either killing demand or driving the world to recession.
It would seem that given this situation the posture of oil-exporters would be to see how much higher they can afford to edge this price.
While I used the term killing demand above, there are also indications that demand/consumption is itself in a present plateauing period. Halfin's comment above that this may be as much a driver of these production numbers as anything seems appropriate.
In fact, if such is the case then the theory that these numbers and what we see in your graph prove "Peak Oil Now" goes right out the window, because we know that Peak Oil has to be geology/supply driven.
I like your addition of both centered and trailing moving averages and hope you keep them for the next release. I would like to see perhaps two more years previous included in this data-set, but should probably be working on this myself.
One possibility now, I grant, is that the rest of the world now has very little ability in aggregate to increase production, but the Saudis could if they wanted, but won't. In other words, the rest of the world is really peaking, despite trying hard not to, but the Saudi's are deliberately capping their peak production below their maximum potential.
Absent inside information from Saudi Aramco, I don't see any way to confirm this idea, but it's consistent with the low rig counts. However, in a sense it doesn't really matter. As long as there's no effective way for the rest of the world to change Saudi Arabia's behavior, it doesn't matter whether it's deliberate or geologically constrained (as long as they continue to do it). What it might tend to do is flatten the peak and reduce the post-peak decline rate. Those are good things.
I respectfully disagree. One of my first posts was "What if everyone thinks like the Norwegians", where rational exporters restrain supply due to an expectation of higher future prices (Peak Oil or just Bumpy Plateau) in the not too distant future.
The actual Peak will, IMHO, be caused by external factors. War, hurricane, coup (If the Islamic Republic of Arabia replaces Saudi Arabia next month, April will be Peak).
Yes, geology underlies the trend, but "other factors" than geological decline are more important short term and will, hence, determine actual Peak.
Price manipulation has been around since well before 1973. It has been around since oil was discovered. Texas Railroad Commission?
Try:
Chernow's biography of Rockefeller - 'Titan'
Yergin's 'The Prize'
Hubbert curves in my understanding are applied to individual oil fields and are quite accurate.
There is some confusion about the inclusion or not of discovered reserves on a yearly basis into that equation. I'll let others comment.
As far as 1971/72/73 - Hubbert apparently fit all American fields into one big curve to predict a peak in American production.
As far as price-fixing, any producer would want to do this, hence the creation of OPEC - a cartel. The oil exporters thought they would pool their strength in order to counter both the influence of Western consumers and Western Oil companies.
The reason you want to price-fix - to get the price for your product as high as possible. As long as people are going to buy it, you want to sell it for the biggest profit possible - this goes for anything. But at some point the price is too high, and your customers go away - a line you don't want to cross. I'm sure you know all this.
The feeling in the peak-oil world is that at 85 million barrels per day, and a certain amount of oil in the ground to start with(1.2 Trillion barrels or whatever it is) that that equation produces a curve, the top of which we are either at or very close to.
For the last 100 years or so, everyhing has proceeded(even during the disruptions in the 1970's at a more or less normal pace) How do we know this? Because the price of oil has averaged around $25/barrel and has never gone above $90. Of course the "oil shocks" that have occured are certainly nothing to dismiss, but the world didn't come to an end, and instead change and transition occurred.
The feeling that change and transition could occur now if there was a shock is met with much skepticism at this site.
The deals that oil-producers had with Western countries and companies had oil selling steadily at about $5 until I think about 1968. The Arabs got their act together and we are where we are now.
As far as how price fixing figures into this, while it may have effected the supply/demand (and hence production) situation one way or another in individual regions, individual years or even decades, it doesn't really change the larger historical shape of the curve, which when said and done(and if correct) will span 200 years.
Spare capacity, if you can believe the accuracy of the numbers has been steadily decreasing for years. Remember, the world was awash in oil in the 1970's, it was supply-situations completely influenced by humans that caused the disruptions.
Today, the feeling (at least many of us here) is that even if there were no political problems or other obstacles - the geological aspects of oil (field decline) and the lack of new discoveries simply negate the possibility of pulling more than approximately our current rate of 85 million barrels per day out of the ground. Price fixing isn't big enough to significantly effect that equation other than in the short-term.
Hope this helps. There are others here like westexas who can probably do a better job explaining how the curve fits.
You have clarified your view on my question. I note that even taking into account price fixing as Drollas has done in the pdf I linked to, he predicts a peak at around 2020 which is quite soon in any case!
Cheers,
Marcus.
Drollas' presentation is decent. Probably a bit on the optimistic side, in my view, but contains interesting information. I'm a little hesitant about his numbers. He has current production at 65 million barrels for his peak/curve graph?
I don't know if you noticed, but he uses 2002 as his last year on the projected-price graph titled "How wrong could you be," even though the presentation is dated Nov 2005. If you were to actually update this chart, 3 or 4 out of the 5 predictions would be correct.
(from the BP energy report) other than the peak oil one: those giant jumps are a dishonest attempt to increase quota by miststating reserves upwards. There were no major discoveries in those countries in the 80s, and honestly reported reserve growth should have happened much more gradually.
My mental model of someone who is lying, and has not come clean and tried to clear up the mess, is that all further communications from them will be at least in part about supporting and propping up the original lie, and therefore cannot be relied on, unless they can be independently verified.
If there were to be some useful outside audit of OPEC reserves which demonstrated that indeed there is still 700gb+ of proved reserves in the Middle East, then I would undoubtedly have to conclude that peak oil was much further away than I currently think, and any current difficulties are entirely the result of deliberate rate limiting by OPEC.
Right now, we cannot distinguish very well between deliberate OPEC rate limiting and peaking. However, I suspect the number of parties who could easily increase production a great deal more must be very small, or the cartel would fall apart from cheating. Iraq would certainly be in this category if only it were stable (which seems very unlikely anytime soon). Saudi Arabia may possibly be in this category. We'd also need an explanation for why they started doing this (unannounced) in late 2004, after not doing it before that.
Regarding increases in reserves, doesn't it depend on price and cost of extraction some what? For instance according to the DOE, at $50 a barrel Venesuela has larger reserves than the rest of the world combined (see here), but not below this price. So why are increasing reserves etimates as a response to extraction or conversion cost vs price unreasonable? Not to say they have definitely not lied about it but it seems to me that it is possible they are telling the truth. Again, it seems to be just another part of the increadible uncertainty regarding this whole phenomenon.
I wonder if a combo of solar assisted + electrical heat pump could create enough hot working fluid (steam or ?) to extract a decent amount of Orinoco heavy oil ?
More heavy oil, less alumninum
Leanan notes that a lot of families support two cars. I'd go further and point out that a lot of families support whole fleets of cars. Everyone enjoys driving around in the '05 Tahoe with the great sound system and the cool alloy wheels, but if one of those alloy wheels breaks there's a '98 Escort available. And spending a whole weekend cruising in the '72 Trans Am is fun but will not much happen if gas is $4.
Driving around in the old beaters will become a lot more socially acceptable when everyone is in the same boat.
And all the American families that already live hand to mouth will stop being ashamed of asking around about some carpooling when all the neighbors are doing the same.
We have no idea how resourceful people will be since it is so long since they have needed to be resourceful.
And to respond to another line in this thread: My working-class friends are well aware of global warming and a little aware of peak oil while my Kellogg School of Business friends and University of Chicago friends know absolutely nothing beyond what Alan Greenspan and their stockbrokers sell them. The educated classes in this country are indoctrinated and ignorant to the final degree. Let us hope those of you with engineering degrees will be more useful than my friends with polisci and econ degrees.
When plotting out maximum capacities year by year, a peak appears around 2010 but only when everything works according to plan.