Plateau continues, aided by outages...
Posted by Stuart Staniford on April 15, 2006 - 6:05pm
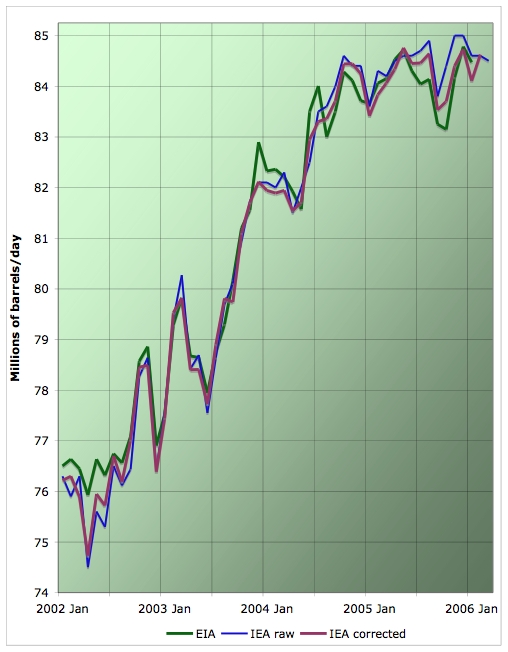
World oil supply fell 125 kb/d in March to 84.5 mb/d. OPEC, North American and North Sea production outages outstripped higher non OECD production.
March OPEC supply fell by 215 kb/d to 29.7 mb/d on Nigerian outages and lower Iranian and Iraqi exports. Damage to Iraq’s northern pipeline suggests exports to Ceyhan are unlikely for some time. Cold weather and supply outages lifted the 1Q ‘call on OPEC crude and stock change’ 700 kb/d above OPEC supply, pointing to a draw in 1Q global balances.As you can see in the graph above, we remain more or less flat below the all-time highs so far of May and December 2005. But something interesting is emerging.
Recall that some time ago, following debate with Freddy Hutter, I analyzed whether Acts of God and Bush could explain the plateau. At that time, the answer was clearly no. Following debate with Robert Rapier, I updated that analysis and the picture has changed somewhat.
Here's my estimate of geopolitical and hurricane outages since Jan 2002. There are several slight changes from last time. One is that the EIA statistics for Iraqi production in November and December of 2005 were less depressed than figures in newspaper reports at the time. Last time I relied on the newspaper reports as the EIA numbers were not available yet, but now I use EIA numbers for consistency. Also, I have treated the 255mbpd of hurricane loss that will be out at the start of the next hurricane season as a permanent loss and written it off as of the date of the hurricanes (if anyone has a better estimate for what the permanent loss will be, let me know). I have also included an estimate of Nigerian outage.
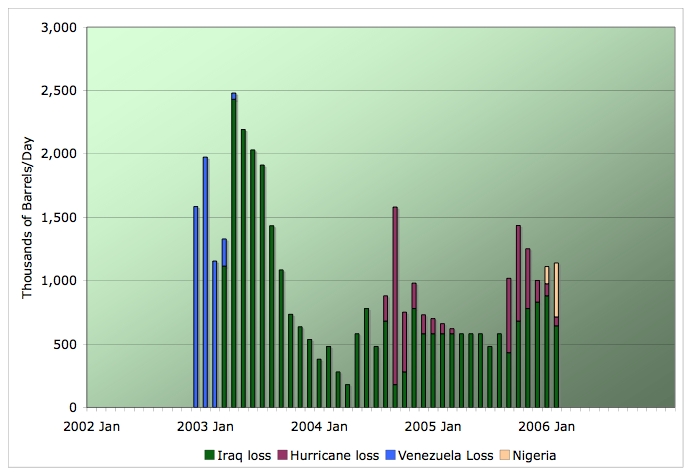
Production losses due to Iraq (Source EIA table 1.1a with production subtracted from February 2003 level), Venezuela (Source EIA table 1.1a with production subtracted from average 2002 level), hurricanes (Source: EIA hurricane losses archive. Shut in production at mid month. Frances and Ivan shut-in eyeball-estimated from graphs.), and Nigeria (Source EIA table 1.1a with production subtracted from December 2005 level). February 2006 statistics are from IEA OMR rather than from EIA.
If we add these back on the EIA average, we get
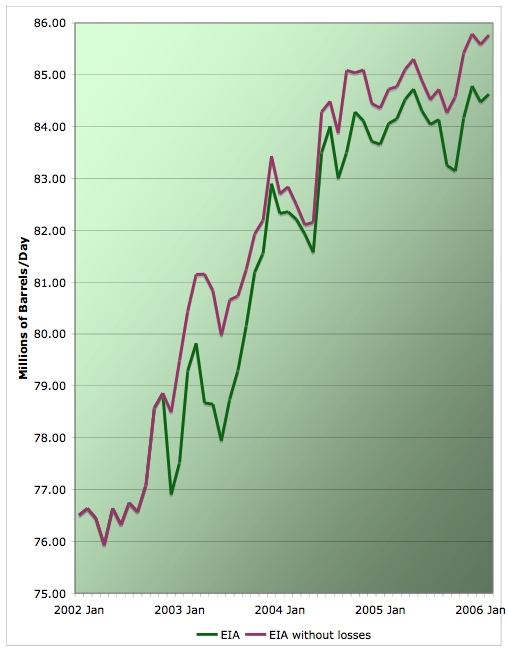
Average monthly oil production from EIA, and as corrected for geopolitical and hurricane losses. Click to enlarge. Believed to be all liquids. Graph is not zero-scaled. Source: EIA except February 2006 is from IEA OMR.
As you can see, while the plateau is still there, we would have had a modest 0.5mbpd breakout as of December 2005 if it wasn't for a resurgence in geopolitical factors. Whether this is a case for increased optimism about the future is tough to say as it's hard to see the geopolitical tax decreasing much soon, and there is significant risk of it worsening - both Nigeria and Iraq look increasingly unstable, and Iran and the US appear to be on a collision course. And as the Oil Minister of Chad reminds us today, we are in an era where every terrorist or dictator dissatisfied with the degree of world attention he is receiving has only to close a pipeline to change the situation. The temptation for them is going to remain high.
But it what it definitely means is that we need to revise estimates of 2005 decline rates.
Past coverage relevant to the plateau:
Other relevant coverage:Contact
- Content: editors at theoildrum dot com
- Tech support: support at theoildrum dot com
License

This work is licensed under a Creative Commons Attribution-Share Alike 3.0 United States License.
As to the economics of the plant in question, the Federal government is putting up a $100 million loan guarantee, and private investors another $500 million. All this for a plant that will produce - drumroll - 5,000 barrels of diesel a day. Hey, one plant and $600 million down, 3,999 plants and $2,399,400,000,000 to go, and we can replace our current oil consumption with coal, and increase our greenhouse gas emissions to boot.
O.K., o.k., I know that last sentence was erecting a straw man, and conflated diesel barrels and oil barrels, but the point is that this is just a drop in the bucket compared to the scale of the problem. Scaling this technology up at a rate that will offset declines in oil production will be expensive in dollars and horribly damaging to the environment, and may well be impossible due to constraints on materials and expertise.
http://72.14.203.104/search?q=cache:e7TADu2VLmsJ:fuelcellbus.georgetown.edu/files/MethanolFromCoalFi nalReport04-2004.pdf+&hl=en&gl=us&ct=clnk&cd=1
for html, or http://fuelcellbus.georgetown.edu/files/MethanolFromCoalFinalReport04-2004.pdf for pdf
gives a two year old analysis of methanol plant designs.
As I said elsewhere, it may be a coincidence, but Khebab and I, in our article published March 6, 2006, predicted that world export capacity would fall faster than world production. The recent EIA crude oil imports and total net imports numbers are troubling. (A comparable time period last year showed increases in imports) You can review the data yourself at the following link. Note that the EIA summaries seem to be wrong. I am proceeding on the assumption that the data tables are correct.
http://tonto.eia.doe.gov/dnav/pet/pet_sum_sndw_dcus_nus_w.htm
Select four week running average and click on total net imports and crude oil (excluding SPR). I am especially interested in using the 12/30/05 data as a reference point, since this averages the import numbers across Deffeyes' prediction of 12/16/05 for the peak of world oil production. Note that the decline in total net imports only really kicked in around mid-March.
Are there a number of explanations? Yes. But consider the simplest explanation. The world is past Peak Oil, and the top net oil exporters are farther down the depletion curve than the world is overall.
There is also the ticking time bomb at our back door, the second largest oil field in the world, Cantarell, which has a remaining oil column of 825' that is shrinking at the rate of about 300' per year, which will translate into a decline rate of up to 40% per year.
Note that no large producing region that has increased production beyond what they had in the vicinity of 50% of Qt, based on Hubbert Linearization (HL). This holds true for: Texas; Lower 48; Total US; Russia and the North Sea. Insofar as large producing regions are concerned, there have been no exceptions that I am aware of. (I define a large producing region as one having 2 mbpd or more for about 20 years.)
In regard to high crude oil inventories, we have no idea what percentage of inventories and imports consists of light, sweet versus heavy, sour. My theory for some time has been that increasing inventories of heavy, sour have been obscuring falling inventories of light, sweet. In effect, we may have had a looming light, sweet inventory problem right under our noses. We do know that we are seeing historically unprecedented spreads between light, sweet and heavy, sour, and we know that light, sweet oil prices are up about $10 since late December, as imports have been falling. The markets seem to be sending a price signal that US refiners need more light, sweet crude oil.
This may be a case of post hoc ergo proctor hoc; however, following is an excerpt from the article that Khebab and I coauthored, dated March 6, 2006:
"We are deeply concerned that the world is probably facing an imminent and catastrophic collapse in net oil export capacity because of declining production and increasing domestic consumption in the top exporting countries."
M. King Hubbert's Lower 48 Prediction Revisited
http://www.energybulletin.net/13575.html
However, the volume of the pyramid that is full of oil is much less than the volume of the pyramid that is full of water. Let's assume that we drill horizontal wells into our oil leg and let's assume that we can produce the field at a relatively high rate until the water hits the horizontal wells. Let's assume a moderately strong water drive that is augmented by water injection into the water leg, in order to maintain a fairly constant pressure as the oil is withdrawn.
Initially, the oil column would thin at a fairly low rate because the lower portions of the oil column are being depleted first. However, if we look at the oil column in terms of 100' intervals, the volume of each successively higher 100' interval is less than the 100' interval below it. (Key point.)
So, as we continue to produce the field at a fairly constant rate, the rate of thinning in the oil column accelerates dramatically.
If you throw in a gas cap, this is grossly simplified explanation of what is happening in the two largest oil fields in the world, Ghawar and Gantarell, accounting for almost 10% of world crude + condensate production. (Note that Cantarell has had a pretty sophisticated nitrogen injection program.)
In any case, you can see how the fields would have the appearance of robust production right up to the point at which production starts crashing.
Like a pinacle reef on a grand scale. The offshore environment means high development cost per well. Wells drilled well off the structural high would produce a lot of oil initially but are unnecessary because the reservoir is extremely porous and permiable so that a limited number of wells can adequately drain the structure. There aren't going to be any other entities producing from the structure so there is no rush to produce before someone else gets the oil. Thanks again.
Isnt this just saying that demand (in the exporting countries) is still rising, like the rest of the world?
Second, back to my Export Land Model:
Let's assume a country with production of 2.0 mbpd; consumption of 1.0 mbpd and exports of 1.0 mbpd. Over a six year period, production drops by about 25%, down to 1.5 mbpd (similar to the percentage decline in the North Sea). Consumption increases by 10% to 1.1 mbpd. So, because of a 25% drop in production and a 10% increase in consumption, the decrease in net exports is 60%. Net exports = production (1.5) - domestic consumption (1.1) = 0.4 mbpd.
Predictions: (1) production in the top exporting countries will fall faster than the decline in world oil production; (2) increasing cash flows in the exporting countries will cause domestic consumption to increase even as production begins to stagnate and fall; (3) as production in the top exporting countries falls rapidly, and as consumption increases, net exports tend to fall markedly. For a while, the cash flow coming in may not fall that much, because of rapidly rising oil prices; however, the trend toward becoming a net importer from a net exporter will be relentless. Two recent examples: United Kingdom and Indonesia.
IMO, net oil export capacity is going to evaporate far faster than most of us anticipated.
In any case, the most recent four week running average of US crude oil imports and total net imports are down 4% and 8.7% respectively from the four week running average at the end of December.
Let's assume that Import Land produces 1.0 mbpd and consumes 2.0 mbpd. Import Land imports 1.0 mbpd from Export Land.
Let's fast forward six years. Import Land's production has dropped by 10% to 0.90 mbpd. Export Land's exports have fallen from 1.0 mbpd to 0.4 mbpd.
So, no matter how much Import Land would like to consume, the total available to Import Land is domestic production (0.9) + imports (0.4) = 1.3 mbpd, down 70% from six years ago when Import Land was consuming 2.0 mbpd--even though Import Land's production was only down 10% and Export Land's production was only down 25%.
I guess one solution is for the Neocons in Import Land to invade Export Land, claiming that Export Land is a threat to Import Land.
So, no matter how much Import Land would like to consume, the total available to Import Land is domestic production (0.9) + imports (0.4) = 1.3 mbpd, down 35% from six years ago when Import Land was consuming 2.0 mbpd--even though Import Land's production was only down 10% and Export Land's production was only down 25%.
I suspect that we are going to see this within the US and on a global basis as people move toward the energy supplies--roughly equivalent to trying to gather around a camp fire on a cold night. This will tend to aggravate the rate of increase in consumption in the energy exporting areas, thus accelerating the decline in net exports.
Absolutely right, the world's wealthy are buying into the modern mega-campfire of Dubai's skyscapers as fast as they can. I am sure you have seen the astounding photos of rampant construction on every corner. Of course, a new eruption of widespread ME war could turn these buildings in ruins rather quickly. We'll see.
Bob Shaw in Phx,AZ Are Humans Smater than Yeast?
A really fascinating development is going to be on the natural gas side, especially here in the States. I would think that you would want to move away from big natural gas importing areas at the ends of the distributions systems as fast as possible. California comes to mind. Note that this would increase consumption in the exporting areas, accelerating the decline in natural gas "exports" to the "importing" areas.
I wonder if we might see the Canadians construct a wall, to keep the Americans from migrating North?
On the oil side, an obvious problem is going to be the dollar. The question that the oil exporters are going to start asking is what thing of value can you offer us in exchange for our oil, especially if the exporters have trouble exchanging dollars for hard assets. They could always buy stock, but the question arises to what the inherent value is in the US stock market, especially if the currency is depreciating.
The Neocons reasoning for putting 150,000 troops in the Middle East becomes more transparent every day. Unfortunately, I wonder if we are rapidly approaching the point at which everyone in the neighborhood is going to be shooting at us.
The case study/history that fits your criteria and is also a big player in US machinations in the ME is England. They are also on the end of natgas distribution. And only missed bigtime economic shutdowns this past winter because the weather kept breaking warm. Thoughts?
I'm sure any wealthy peaknik will move to all manner of oil-rich places depending on personality match. Of course, that will only run up consumption in those places - and exports drop quicker. I'm sure a lot of people on this site will want to move if possible to the Dubais and Ft McMurrays of the world.
(From Fuelling Fortress America)
I find your posts on net exports thrilling, as there is no doubt that the combination of increased domestic consumption and declines from countries that now are net exporters will have a significant impact on future oil prices.
Some time ago and based upon BP Statistical Review 2005 I did some evaluations and found that total global net exports amounted to 33-35 Mb/d (which of course equals the net imports of the importing countries). This is the amount of oil which might be considered to flow freely to the highest bidder.
A decline in Russia and Saudi Arabia combined with increased domestic consumptions would reduce this amount signficantly. Russian domestic consumption has yet to reach levels prior to the dismantling of the Soviet Union.
I also checked the cumulative import figures for US (EIA data) for the 15 weeks of Dec. 31 2004 to Apr. 08 2005 versus Dec. 30 2005 to Apr. 07 2006.
For crude oil the cumulative imports for 2005 was 1 057 Mb.
For crude oil the cumulative imports for 2006 was 1 033 Mb.
A year on year cumulative decrease of 23 Mb.
Refinery throughputs has been 500 kb/d below so far in 2006 compared to 2005.
US domestic production down 400 kb/d year on year.
Did the same for gasoline for the same periode (15 weeks) and came up with a year on year cumulative increase of 23 Mb.
In other words US total net imports of crude and gasoline is presently running close to last years figures.
So it is possibly a little early to cry out that the sky is falling.
IMO, we need to use December, 2005 as the reference datum, since Deffeyes put the 50% of Qt mark right at mid-December. My reasoning is that the HL method has been validated in so many very large regions--in the sense that I have seen no evidence yet of a large producing region showing production higher than what they showed in the vicinity of 50% of Qt.
Using four weeks in December as the reference datum, the most recent crude oil imports (four week running average) are down 4% and total net imports (four week running average) are down 8.7%. Also, the big drop really didn't kick in until mid-March. What I find odd is falling imports of crude oil and products as the markets are bidding up the price of crude oil and products.
We are offering to pay the world more dollars for crude oil and refined products, but the supply of crude oil and refined products coming in is falling. IMO, it suggests that we have only begun to see the price increases. I suspect that $3 gasoline will soon be a fond memory. BTW, I believe that the price of Brent crude is now higher than light, sweet here in the states. Kind of suggests a bidding war doesn't it?
You're inferring trend out of the noise. There's usually a notch in imports in winter, early spring. Give it a few months and then see.
In particular, despite Deffeyes, HL to the extent it is valid has an uncertainty in the date of peak of several years either way.
You are of course correct that time will tell, but the same time period last year (12/31 to 4/8, four week running average) showed increases in both crude oil imports and total net imports, while that time period this year showed a 4% and 8.7% drop respectively.
That is an astute observation: obvious after you hear it, but not something I (or most of us?) would think of.
Could you please again include a graph with the nine- and 13-month moving averages? I, for one, find those extremely helpful; the trends they convey have in fact been sufficient to give me the confidence to give the "Peak is probably now" line to some of the very skeptical people in my life.
(My apologies if you have already explained this somewhere, and I missed it....)
It might clarify matters somewhat if you just showed crude + condensate.
I am agnostic on this issue. Short term, production declines are driven by externals, not geology (Nigeria, GOM, Iraq to name three). Gelogy underpines this all, but the month to month #s are affected more by insurgents and weather than geology.
I am NOT willing predict peace (or increased conflict) in Iraq & Nigeria and ...
We know that Sakhalin Russia cannot produce when shipping is shut down by weather, so winter production is affected. Other Russian fields are affected in bad winter weather (and this was a historic winter). Would you go out in -40 weather with strong winds to defrost a frozen valve or wellhead ?
In the medium term, the "price signals" for more oil have not had time to take effect. It has been almost 2 years since the leading edge of this price signal was given. Precious little cna be done in less than 24 months to increase production.
The world is not uniform in it's depletion curve (as Texas was in 1972), so forecasting the results of the price signal is "extremely complex".
So, we may be at peak, or we may see world oil production peak at 86.4 million b/day in 2007 (peace breaks out in Iraq & Nigeria, calm GOM, CO2 injection revives some old fields, Cantarell declines are between the most optimistic and second most optimistic of 5 Pemex projections, tar sands come online on schedule, more refineries are adapted to heavy/sour oil which creates demand for shut in low quality oil, Saudis have been speaking the truth about expansion, etc.)
Or the Islamic Republic of Arabia could kick out the Sauds next month.
I am agnostic about the timing for Peak Oil. I could see it being as late as 2009 (IF there were enough refinery & pipeline capacity for ALL types of oil, what would current production be today ?)
The "small effects" are, with higher prices, almost all towards higher production.
Small effects are unlikely to overhwelm the declines of major fields, but they can shift the peak a bit, and change the downslope.
Regarding Skrebowski's estimate of the 2010 Peak, I agree with Stuart's assessment from the other day that this is predicated on an unwarranted and nearly unargued-for optimism regarding decline rates over the next five years. As I said in a post on that thread, what's really needed is a comprehensive and systematic empirical study of present and expected decline rates in the major producing regions to supplement studies of the type Skrebowski does.
(I'll try to get the relevant links for these two points and post them in a separate comment.)
http://uk.theoildrum.com/story/2006/4/14/8748/80174#9
and Stuart's critique of Skrebowski:
http://www.theoildrum.com/story/2006/4/6/4461/28812
BUT, geopolitics and geoeconomics is going to mess up any precise fixing of the top. By that I mean war, hoarding for war, drastic economic decline, and rapid (as possible)replacement of conventional with non-conventional sources, etc. The available information itself will become less forthcoming and reliable.
All the geopolitical players are well aware of peak. The game in on.
Looks like it's time to start thinking about sustainability
(The changes I'm talking about include increased awareness of the situation among mainstream consumers, a continued shift to more efficient transportation, the arrival of mainstream all-electric cars, continued build-out of wind power to help fuel those electric vehicles, increased refinery capacity for dealing with heavy crude, the arrival of a sane US gov't with some notion of what a useful energy policy looks like, etc.)
Me too.
But I think gas prices are the big news outside our happy little group. My local prices reached a $2.90 average for regular yesterday (http://www.gasbuddy.com). The fact that this is correlated with (audio effect: quack), is no doubt striking to us ... but how is it breaking out with the general population?
.......But how is it breaking out with the general population?
I just searched googlenews for gasoline thefts: got 18 hits. I believe this is just the tip of the iceberg. I think we can expect this hitcount to exponentially rise along with the gasoline prices.
Bob Shaw in Phx,AZ Are Humans Smarter than Yeast?
It's always fun to search for "vespa" stories when prices rise as well.
http://www.madison.com/tct/business/index.php?ntid=79914&ntpid=0
A. There is no swing producer to offset disruptions
B. We are threatening Iran over their nukes
I think most people think it's B, but I think A is the background that nobody recognizes.
Expectations of future prices vary from person to person, but everyones' expectations are higher today than two years ago.
I suspect that the longer Laurie waits, the greater will be her "sticker shock" at how little her status symbol is worth. She may decide to keep it once the sales man gives here it's real value on a trade in for a small Acura.
I hope she has a lease that expires soon on her moving fortress.
BTW; I noticed lots of used Hummers on the lot of "Truck City". I suspect that the owner is not interested in any more. Has anyone tracked used SUV prices ?
I chuckle at the Land Rover example because that purchase is a perfect example of the "self branding" aspect of vehicle choice.
Give higher prices, she might sell it, but given higher prices, it might go to someone who keeps it as a low mileage perstige vehicle.
I am not sure how we could have any gasoline demand destruction at this time of year. It's been between 80-90 degrees F this last week in KC (I believe we hit a record one of those days) and all the lawn machines have kicked into high gear. Add that to the usual driving trips. I expect another fairly large drop in gasoline inventories next Wednesday.
Man, we should have a reunion, all wear Binghamton Mets caps, Senators jerseys, etc...
All this of course occuring as humand demand to have babies and resources for these babies continues unabated.
As I said earlier in this thread, it seems to me that we have "more-likely-than-not" arrived at the logistical peak right now. However, I think it is useful and instructive to think about how different this would be had the United States NOT decided to make Iraq an enemy in 1990. That alone would have significantly shifted the historical shape of the "logistical Peak," because Iraq would probably be pumping at 6MB/day right now following 15 years of aggressive, world-class energy infrastructure investment, rather than sputtering along at 1MB/day as it currently is. Very roughly speaking, this would have had the following effects in reshaping the daily production curve from what it actually is:
Remember that from late 1990s into the US invasion in 2003, Iraq had steadily been taking missile potshots at various US planes that patrolled the no-fly zones.
Statistically, those were bound to succeed in shooting down an American airman at some point, just from a numbers game.
If such a shootdown had occurred, and IF the airman had been captured alive and paraded on Iraqi television, right now Iraq would be producing ZERO oil because the US would probably have bombed Baghdad back to the stone age in the blind fury of massive retaliation.
Just an alternative thought experiment... :)
http://newswww.bbc.net.uk/1/hi/world/middle_east/1175950.stm
I'm sorry to say that international law is now a quaint, outdated concept that the world will soon see the US has no use for. Unfortunately many young Americnas have died and will continue dying in the ME.
Neither the US nor the UK had any formal authority from the UN to conduct air operations in support of the Iraq no-fly zones.
The UK and US were engaged in undeclared acts of war against the state of Iraq. Under prevailing International law this would be deemed to be illegal and may therefore rightly be described as state sponsored terrorism. In the event of an aircraft being downed inside Iraq, it is not clear what status the pilot would have had under the Geneva Conventions.
In fact, legally the Second Gulf War was quitelegal due to teh violations of the armistice of the First Gulf War without further UN resolutions.
Iraq did not treat the POWs they captured in the First Gulf War according to the Geneva Conventions, so whether they were covered or not is a mute point. Clearly they would be legally though.
I oppose the Bush policies, but you are "off base" quite a bit on this one.
Should those UN terms be violated, there was no provision that the US unilaterally was authorized to use force in the event any resolution was not followed by Iraq.
Here are the UN resolutions in questions:
http://www.un.org/Docs/scres/1991/scres91.htm
If the day after, (or the year after) the cease fire was signed, the Iraqis violated it by resuming hostilities, the US would be justified in resuming hostilities as well (as in destroying the remaining Republican Guard divisions in detail).
It would not be the first ceasefire to break down in warfare.
You are omitting some history. The first confict did have UN sanction. An armistice was signed to end the conflict. After the end of the conflict the US incited a Shia uprising in the hope it would depose Saddham. Saddham ruthlessly suppressed the Shia. The US, Britain and France then unilaterally imposed a set of no-fly zones.
There was no UN sanction for the no-fly zones.
http://en.wikipedia.org/wiki/Iraqi_no-fly_zones
UN Resolution used as justification for the Zones:
http://en.wikipedia.org/wiki/United_Nations_Security_Council_Resolution_688
Charles is correct. There was nothing in the manner of ending the first conflict that gave justification for the US to initiate the second conflict.
The second conflict had as its pronounced aim regime change. Under international law this is not an acceptable grounds for war.
I made no statement about POWs in the first conflict. I did raise the question of the legal status of US or British pilots in the event they were shot down while engaged in an unlawful act of aggression.
The ceasefire signed by Saddam's generals & Schwarzkopf was not an end but a suspension of hostilities. The First Gulf War never formally ended AFAIK. They just agreed to stop shooting, the Iraqis agreed not to fly fixed wing a/c (Schwarzkopf later regretting agreeing to letting them fly helos. They claimed to get around bridges, in reality used to surpress the spontaneous Shia uprising), Iraq agreed to uninhibited inspections, release of all civilians & military captured and on & on.
Iraq violated the ceasefire in numerous ways. The US was legally allowed to resume the First Gulf War (absent a repeal of the earlier authorization by the UN) the day after it was signed (if the Iraqis broke the ceasefire) or five years later (if the Iraqis broke the ceasefire).
Iraq was not a free, independent and fully soveriegn state after the First Gulf War. It was like Germany after WW I, a defeated power bound by the agreements that it signed.
The British & US pilots were "not engaged" in unlawful activity. They were enforcing agreements made with the ceasefire. As such, Iraq was engaing in unlawful aggression which could have justified the First Gulf War, Phase 2, without any new UN resolutions.
Emphasis added
http://www.fas.org/spp/starwars/offdocs/b920330.htm
The following is from the text of the resolution empowering UN action against Iraq (Gulf War I). Emphasis added.
http://www.fas.org/news/un/iraq/sres/sres0687.htm
The UN observer unit was deployed and the UN authority for further action was then ended. Three UN member states then undertook unilateral action against the state of Iraq by imposing no-fly zones.
In the course of searching for the excerpt from the UN document I also located the text of remarks made by President Bush. These remarks ring true even today and raise questions in regard to the actions of George II.
Russian automaker OAO GAZ agreed to buy the production lines from Daimler Chysler's Sterling Heights plant when they are replaced with newer equipment. OAO GAZ will produce D-C vechiles under license with the new equipment.
To support West Texas's concerns about Russian export capacity vs. their total production. (I disagree with him about Norwegian domestic consumption increasing).
Terrific chart, thxs. If the 'Nuke their Ass--I want Gas' scenario continues its presently sad course: this chart shows that the US PTB should actually be more concerned with overthrowing H. Chavez than Iran's Amajinedad. Venezuela's much closer proximity to the US, larger potential reserves, and the fact that the US currently imports no energy from Iran shows that, from a purely energy perspective, our MilGov priorities are focused on the wrong country. Thus, Europe, China, and Japan should be the primary leaders of dissuading Iran's nuclear ambitions.
Bob Shaw in Phx,Az Are Humans Smarter than Yeast?
And if any of you are wondering just what this "heavy oil" is, try NATURAL BITUMEN AND EXTRA-HEAVY OIL
... Because of the chemical nature of the crude, it may be assumed that enhanced recovery methods are required for production. In certain areas diluents are introduced into the well bore and gas lift is sometimes used but cyclic steam injection, usually followed by steam flood, is the common practice. A notable addition to technology has been the SAGD, or steam-assisted gravity drainage, following the evolution of the horizontal well. For transporting extra-heavy crude it is generally necessary to add a diluent, such as gas condensate, to improve the mobility; the diluent is then recovered for re-use. These heavy crudes are often upgraded in the field to a refinery-acceptable 21º API. At the refinery the processing most commonly involves carbon rejection although hydrogen-addition methods may be utilised to maximise fluid yields and reduce coke production. The higher pressures and the hydrogen requirement add appreciably to the cost of the hydrogen-addition technology...
... Because of the chemical nature of the crude, it may be assumed that enhanced recovery methods are required for production. In certain areas diluents are introduced into the well bore and gas lift is sometimes used but cyclic steam injection, usually followed by steam flood, is the common practice. A notable addition to technology has been the SAGD, or steam-assisted gravity drainage, following the evolution of the horizontal well. For transporting extra-heavy crude it is generally necessary to add a diluent, such as gas condensate, to improve the mobility; the diluent is then recovered for re-use. These heavy crudes are often upgraded in the field to a refinery-acceptable 21º API. At the refinery the processing most commonly involves carbon rejection although hydrogen-addition methods may be utilised to maximise fluid yields and reduce coke production. The higher pressures and the hydrogen requirement add appreciably to the cost of the hydrogen-addition technology...
Congratulations !!
LMAO :-)
Kind of makes one want to become a vegetarian...;)
And a question for WesTexas - or HO: could you explain a bit more about the 850' column and its rapid drop of 300'/year. A picture or graph would help too. I gather Canterell is a deep but very narrow reservoir of oil being rock, but how deep, how narrow, and how long?
Thanks. I am not a geologist, scientist, or economist - but am a "quick study" (the secret to the dreaded litigator)
And then there's helpful graph linked in at Vital Trivia's (Chris Vernon - TOD UK) 120 million barrels per day will never be reached.
This is all you really have to know.
Since it is relevant now, I post it again. It is a graph were you see the major import from regions of the world. The thickness of the lines are proportional to the transfer.
To answer your question: most of the oil that Mexico exports, goes to Mexico.
the big version of the graph
(gif 64k)
Also, when the graph is small, if you filled in some parts with primary colors, and squint a bit, you could sell it for a Joan Miro painting. (meaning I think it looks cool)
Actually, it looks to me like most of the oil goes to Other Asia Pacific. The extent of the relationship between the Middle East and Asia (Japan, China and Other Asia) vs the amount of oil flowing to US is a suprise. Also how little China draws compared to Japan or Other Asia.
The other aspect of interst is the degree to which US provides for its own needs.
Given the likely level of future conflict due to "resource sharing," the next version should probably be done in the style of Jackson Pollack.
That's what happens when you write a message in a hurry :-)
Thank you for the Miro compliment!!
This graph will probably change gradually. I am curious about this year's statistical review of
world energy 2006.
Surprising to me is just how much oil flows from "Former Soviet Union" to Europe. Russia plus "the Stans".
Lots of work here. I appreciate it.
Interesting/amazing how large the loop is for the Middle East.
It encourages a lot.
http://home.entouch.net/dmd/Oilcrisis.htm
He is also very active in the Creationism/evolution debate, and has a number of essays here:
http://home.entouch.net/dmd/
RR
I knew a few people like this at Caltech, they used much of their intellect in the construction of breathtakingly complex religious apologetics.
Why I left Young-earth Creationism
He has been a thorn in the side of Creationists for many years.
RR
Before I really started spending a lot of time discussing energy issues, I spent my time debating Creationists, writing letters to legislators any time a piece of Creationist legislation came up, etc. Debating a Creationist is not like debating someone on an energy issue, because they are impervious to logic. They have absolute certainty of their position, and they can come up with a twisted, inconsistent rationale for almost anything you can throw at them.
RR
Answering my on question: On March 14, Stuart posted the initial IEA February productions estimates at 84.6; the revision suggests a statistically insignificant addition of 25,000 barrells to 84.625 for February. The possible significance I see is that this may be the first upward revision in IEA production numbers in several months.
The Cantarell news is truly dispiriting.
Answering my own question: On March 14, Stuart posted the initial IEA February production estimates at 84.6; the revision suggests a statistically insignificant addition of 25,000 barrels to 84.625 for February. The possible significance I see is that this may be the first upward revision in IEA production numbers in several months.
The Cantarell news is truly dispiriting.
I am becoming interested that we are seeing continuing flatness with no hint of a decrease yet.
There was another topical story today in the Billings Gazette:
Governors to meet, discuss oil pipelines
Some pertinent excerpts
Wyoming Gov. Dave Freudenthal and North Dakota Gov. John Hoeven will join Schweitzer at the Petroleum Club in downtown Billings to discuss the recent drop in oil prices at the wellhead.
Pipeline capacity to move the oil is limited because existing pipelines are full with Canadian crude.
Refinery turnarounds and seasonal product changes also have limited refining capacity.
The region is taking discounts to get the oil to the markets, some in the $25-a-barrel range.
RR
Playing devil's advocate... ;-)
That brings Hirsch to mind. "The bell curve has a sharp crest, and you can't see it coming."
The reality is that neither you nor anyone else knows what's going to happen in the rest of the year. Very small changes in the type II decline rate could wash out the currently catalogued production increases. And there's no reason to think the geopolitics is about to get better!
I maintain my view that we are basically in a bumpy plateau until the next big oil shock. But I've increased my subjective estimate of the size of the bumps :-)
Of course. Geopolitics, weather, etc. can all affect the actual production. The primary point I have been arguing is that if we look at the plateau, it is not because we have hit peak production. The plateau at the present can be explained via other factors than "we just can't produce any more".
RR
I have said this before, both here and at my blog. We both agree that Peak Oil is coming, the consequences are going to be bad, and we should have started preparing for it years ago. I think we disagree on the timing. I think we could see it by 2010, but I don't expect to see it sooner. But I am keenly interested in knowing when we are going to peak. That's the only reason I debate the issue. I am doing this for my own edification as much as anything. I learn a lot here.
Having said that, I think a more imminent problem looms, and that is the supply/demand imbalance. While Peak Oil might be postponed for a few years, I see no relief in the supply/demand imbalance. For all practical purposes, this mimics the effects of Peak Oil. Some people will simply have to do without, and the others will have to pay more. I think the economy will slow or stagnate before we reach peak because of this.
RR
RR
Maybe not.
Tame oil's wild price ride with a tax
RR
As Stuart also points out the depletion cuts relentlessly and with increasing effect into any to expand net production.
RR
As Stuart also points out the depletion cuts relentlessly and with increasing effect into any effort to expand net production.
If only we didn't have all these disturbances to oil production sounds like fantasy talk to me. What's revealing is that there is no swing producer to take up the slack of any interruption any longer. And history will surely show the years 2001-2005 to have been peaceful and nondisruptive to oil supply compared to the exploding global warming and resource wars now upon us.
What that indicates is that at this point in time there is no swing producer who is both willing and able to take up the slack. I have discussed this before, and I see a disconnect. Let me see if I can explain myself a little better.
Sure, disturbances will always occur. That is a fact. My argument is not that we ignore the disturbances and just say "what if". Producers plan to bring production online to meet demand. They don't want to get into an oversupply situation and make prices fall. In fact, I quoted a news article a few days ago in which the Saudis said exactly that. So, a few years ago when they were planning the timelines for new production, they didn't account for all of these disturbances. I think demand growth also caught everyone off guard. So there are 2 points I would make about the disturbances: 1). They have contributed to a production plateau that is not actually indicative of a Hubbert peak; and 2). Their magnitude was larger than most recent disturbances, causing producers not have new supply ready in a timely fashion.
RR
Just curious about the graph. Do you know off the top of your head what, if any, particular reasons there are for the big jump in production between Jan 2003 and Jan 2004?
Thanks.
It seems that in the optimist camp (CERA, etc) the tendency is to put the most positive spin on the projects coming on line and either ignore or totally play down any depletion of existing fields.
I'm just wondering if the 2003-2004 jump was related to specific projects entering production (Kashagan?)
Until late 2004, there were statistically significant increases in oil production. Since then, we have mostly gone flat. If this flatness is due to a world Hubbert Peak, would there not at some point soon be inexorable downward pressure that would result in statistically significant decreases in production?
I am wondering at what point I could conclude that this flatness has been unrelated to a hypothetical Hubbert Peak in the absence of manifestations of production decreases?
Any thoughts? Any mathematical curves that fit the data that would indicate when we would expect a tendancy for drops in production if there is a smooth bell curve hiding behind the noise?
Also, I remember Ali Samsan Al-Baktiari (former senior official in the Iranian oil sector) claiming recently on his website something to the effect that the official reporting agencies are fudging things a bit by taking what are in fact 82-83MB/day monthly totals and massaging them to get the reported 84-85MB/day. I'll see if I can find the pertinent quote and post it.
http://www.theoildrum.com/story/2006/4/3/235314/3734
"In my humble opinion, we should now have reached 'Peak Oil'. So, it is high time to close this critical chapter in the history of international oil industry and bid the mighty 'Peak' farewell... At present, global oil output fluctuates around 82 mb/d as some institutions try vainly to push 2005 statistics towards 83 and 84 mb/d (as they always do). But they will be obliged to backtrack as 'actual' oil supplies fail to follow their 'paper' ones."
Does anyone who knows how these things are officially tracked care to comment upon Bakhtiari's fudge-factor accusations?
And I do like the curves, but my mind gets weird trying to eyeball where they actually turn downward.
I was actually a math major, but I'm a bit fuzzy on how I would retrofix an equation to the curve or data to determine when the theoretical 1st derivative goes negative. You would think an actual date could be produced by smoothing the data and fitting a curve. Or am I nuts? (Oh god don't answer that last question).
Russian output of oil flat
Interesting.
Perhaps this is how Russia will preempt an US attack on Iran.
Or, more worrisome, Khebab & Westexas may be right afterall.
Also, Russian car sales are up 15% year over year.
Agreed.
My first point was that given the supply constraints, this Russian production stall might not be a geological or infrastructure event but rather, a geopolitical maneuver to forestall an attack on Iran.
Russia's saying, "If you attack Iran we will not be able to meet the shortfall in production."
So it hardly seems worth it to protest at the "Russians bad, oligarchs good" slant of the piece.
there seemed to be problems earlier today with posting, ruining another perfectly cynical comment based on things like where did Chad get PR/lobbyist help from, followed by a 'never mind' dismissal -
'An Exxon Mobil-led consortium exported 133 million barrels of oil from Chad between October 2003 and December 2005, according to World Bank statistics.'
Then there was the point about why ExxonMobil would care to have this noticed -
'The consortium invested $4.2 billion in the pipeline.'
Though I would hate to say ExxonMobil is going to have any cash flow/debt rating problems based on a few billion here or there, I bet things are starting to look pretty grim for the next CEO hoping to earn his 400 million dollar retirement package.
And one reason I tend to believe peak is truly here that what used to be essentially rounding errors in terms of production (humorously meant) are now geopolitical events on a fairly obscure but increasinly all-consuming chessboard - were the 'rebels' local, Chinese backed, French backed, Libyan backed (old history there), Islamic/religious, or simply freedom fighters against a corrupt government previously in ExxonMobil's pocket? Who knows?
And as a side note - the Dutch have sent or are sending 4000 troops, tanks, etc. to Dutch islands off the coast of Venezuela, according to Der Spiegel. No one wants a Falklands situation, but it is interesting to see how Royal Dutch interests are also being kept in mind. Chavez really seems to have a knack for not making friends among countries with large oil companies.
Of course, this is likely just a coincidence with the American exercises. But it is how these coincidences keep adding up which reinforces my view that the future is now, and that quite honestly, the required 10 to 20 years of preparation needed to start 10 to 20 years ago.
Carter's prediction about American soldiers dying in the Middle East for oil in a generation if America didn't change was made a generation ago, for example. Just another coincidence, certainly. As a Naval Academy graduate, I'm pretty sure he didn't worry too much geopolitically about America's pre-eminence in Monroe's backyard. Of course, if the Dutch are players in this game (the number reported being sent is larger than their Iraq contribution, I believe), the idea of European involvement may have so blindsided Carter's sense of historical American privilege so as to prevent even contemplating it. Not every single scenario is wargamed - using European help to knock off a South American oil producer's government simply goes against literally centuries of American policy and practice, especially from a naval perspective. Invading Canada or Mexico are just old American habits, for example, in a way that inviting Europeans into meddling in the Western Hemisphere isn't.
There is more than one way to look at peak oil arriving, and what it means. Having facts is the best way to look at changing circumstances where the concept of fact is so flexible - I bet ExxonMobil will always find and support the true believers in deomcracy in Chad (or anywhere else), who will just coincidentally ensure ExxonMobil's interests will be appropriately looked after, with an appropriate article in the Post to let us all know that supporting some strongman who seized power in a coup is the right thing to do. Or removing him, of course - profit rarely bothers with principle (though principal is very important).
But really, didn't 160k barrels a day used to be what a few FARC rebels in Columbia would disrupt between cocaine shipments? Wonder when the Post will have that article - any bets sometime around the scheduled arrival of an American carrier and a few thousand Dutch troops?
I understood we are replacing US troops, but for now I believe this coincidence doesn't add up...
I wonder if it's of any help, but here's the file from one of our leading newpapers: http://www.volkskrant.nl/dossiers/den_haag/missie_afghanistan
And please keep wondering ;)
I don't have a link to Der Spiegel, I have a subscription. The article on page 108, 'Ärger auf der Insel' from 10.04.06 is somewhat less than obvious about troop numbers in the text, though, when rereading it -
Um den irrlichternden Präsidenten vor möglichen militärischen Abenteuern zu warnen, veranstaltet Den Haag in den kommenden Wochen das große internationale Militärmanöver 'Joint Caribbean Lion 2006' in der Region - bereits über 4000 Soldaten sowie 'Leopard'-Panzer wurder entsandt.
This is followed by more information about America sending ships, including the carrier George Washington.
Admittedly, apart from being in German, you have to read Der Spiegel with certain skills, much like reading the Washington Post requires its own set of skills.
The translation, more or less -
To warn the erratic president [Chavez] against possible military adventures, Den Haag has arranged the large international military exercises 'Joint Caribbean Lion 2006' in the region - more than 4000 soldiers have already been sent, as well as Leopard tanks.
As said, reading Der Spiegel is a skill - notice that it is Chavez that is threatening, and the Dutch are only responding to an erratic figure who buys weapons, including 33 military helicopters and 100,000 Kalashnikovs. Der Spiegel is part of the Western media, after all.
And the number of soldiers is open to intepretation - the Leopards are decidely Dutch equipment, but the number of soldiers 'already sent' for the exercise is 4000, not that it is necessarily 4000 Dutch soldiers.
Glad to offer some more information and background - these things do tend to be complex. Apart from the facts as less than clearly reported, keep in mind that Der Spiegel essentially approves of Her Majesty's government protecting Royal Dutch (it is a pun, sort of) property against an erratic military figure.
Chavez is a problem in a number of ways, and I am quite certain that neither Dutch, British, or French oil companies are any more happy with his style than American ones. Regardless of what many Americans seem to be believe, the West is still a functional political unit/concept. Oil, for example, seems to have the same value for Japan, Germany, the U.S., as for Sweden or Poland - some things transcend petty barriers.
But interesting to see someone else's exercises this spring - I guess the Dutch regularly practice with tanks on Curacoa or Aruba because the soldiers need a good tan after the gray wet winters. Or something.
There's some discussion of Kuwait's supposed new discovery, too. Sounds like no one really believes it's as good as advertised.
http://www.theoildrum.com/story/2006/1/20/193723/259
I'm not going to believe a damn thing any OPEC country says about their reserves until they provide a detailed accounting for the history of their reserve estimates.
The Texas Peak was 1972 (at 54% of Qt), and production started (permanently) dropping in 1973, when oil prices started climbing. Because of two oil shocks, we saw about a 1,000% increase in oil prices between 1972 and 1980.
Texas production fell by about 30% from 1972 to 1982, despite:
(1) A 1,000% increase in oil prices; (2) a record drilling boom and (3) an increase in the number of producing wells (by 14%).
Based on the Texas case, one could assert that: higher oil prices + more drilling + more producing oil wells yields lower production.
The reality is that one Gb and larger oil fields drive the oil business--Texas then and the world today. Higher oil prices will bring on nonconventional production, but IMO higher oil prices + more drilling + more oil wells will have no discernible impact on declining conventional oil production.
Even in Russia, the post-peak production fits the cumulative HL estimate.
Also, if you just look at crude + condenate, 1/06 was down by by 468,000 bpd from 12/05. (December to January last year showed an increase.) Granted, there have been some production problems, but there are always production problems of some sort around the world.
By the way, in regard to inventories, crude oil is up 7.9% year over year (again, we don't know what percentage is heavy, sour), but total product inventories are only up 2.9%.
http://www.theregister.co.uk/2006/04/13/oled__white_light_invention/
Britain took part in mock Iran invasion
http://www.guardian.co.uk/iran/story/0,,1754307,00.html
Iran deploys ballistic missiles within range of U.S. bases in Iraq
http://www.geostrategy-direct.com/geostrategy%2Ddirect/
Chad Threatens to Cut Off Oil Pipeline
http://www.washingtonpost.com/wp-dyn/content/article/2006/04/15/AR2006041500386.html
great animation about bunker busting nukes
http://www.ucsusa.org/global_security/nuclear_weapons/nuclear-bunker-buster-rnep-animation.html
world. Westexas and Khebab_ I think world capacity may turn
out to be even less than you are predicting as far as we are concerned. Those OPEC nations that are astute enough,
(Russia, Iran?)may withold a percentage of their oil for
"Future" use as well as current use even though it may be
painful economically. It seems to me it would be suicidal
for them to plan on selling all of the oil available beyond
their current increasing use. Comments?
When you think of the economic impact of the torrents of cash flow into the exporting countries, it has to have an effect on consumption, especially given the family sizes in some countries such as Saudi Arabia (seven kids per family on average).
Once we are past peak, it will become apparent to the exporters that they can cut back on production and sell less oil for more money per barrel. Inevitably too, I suspect that they are going to question the wisdom of selling oil for dollars.
IMO, we are in the early stages of a massive bidding war for dwindling export capacity. Just look at the ages of the large oil fields in the major exporting countries.
To add incremental production from nonconventional sources--GTL, tar sands and CTL--it looks like it is going to cost about $60,000 to $120,000 in capital costs per bpd of production, not counting operating/energy costs.
IMO, it is sheer insanity for the US not to raise taxes substantially on energy consumption--at least fossil fuel energy consumption--offset by tax cuts elsewhere. Compared to Europe, we are, in effect, encouraging profligate energy use.
To answer your question, yes, I think that net export capacity going to evaporate much, much faster than most of us have been anticipating.
I am still somewhat amazed that most people seem to be indifferent to the 8.7% decline in total net imports into the US. (last week, versus 12/30/05, four week running average).
I am certainly alarmed, but the Big Problem is that our leaders and the unwashed masses are ignoring reality because Detritus Delusion is so comforting.
Bob Shaw in Phx,AZ Are Humans Smarter than Yeast?
No amazement from me, Jeffrey. It is the inexorable working out of the global supply situation. And Mexico, too.
Couldn't it be just because we don't need as much?
I dunno, I just find it hard to get alarmed when the inventory picture looks like this:
That build is due to the unusually warm winter, not because we're stocking up in case of shortages.
If we ever do reach the point where individuals, nations and corporations start hoarding for fear of shortage, the gas stations will probably go dry overnight.
A change in paradigm.
Second, total product inventories are only up 2.9% year over year.
Third, what do you expect to see at peak world oil production? I expect to see peak everything, followed by a permanent and irreversible decline.
Remember folks, insofar as I have been able to determine, the HL method has never been wrong regarding large producing regions such as: Texas; Lower 48; Total US; Russia and the North Sea, in the sense that none of these regions were able to equal the production that they had around 50% of Qt. None. Zero. Nada. Even in Russia, the cumulative production post-peak through 2004 was 95% of what HL predicted.
The large exporters are farther down the depletion curve, based on HL. Therefore, the data suggest--and I believe it--that net oil exports are going to fall at a rate faster than total world oil production for two reasons: (1) falling production and (2) increasing consumption.
IMO, we are at the very beginning of a ferocious bidding war for remaining net oil export capacity.
If you want an example of rearranging the deck chairs, just consider the fact that we are even debating the significance of declining imports when the Cantarell Field, the second largest producing oil field in the world, right at our back door, is probably now experiencing a 40% annual decline rate. Note that this will impact the heavy, sour supply.
One other point. I first raised the import issue back in January, and I stated that the HL data (based on Khebab's technical work) suggested immediate production problems ahead for Russia. I'd say about 70% of the posts took the opposite view.
Since January, a host of articles have come out suggesting possible production problems ahead for Russia. The Russian energy minister is warning the possibility of a "real collapse in oil production" if they don't start an emergency drilling program in frontier areas. Even the IEA has started sounding the alarm.
I am indifferent because an analysis of the weekly detail numbers (not the summary) shows a YTD INCREASE of 2.7% year-on-year. Thank you for noting earlier that EIA summaries are out of sync with their detail reports (I agree) and for providing a link that works. I also agree with your -8.7% number; I just don't think it's significant in light of the above statistic.
Let's look at Texas oil production:
- 3.309 mbpd
- 3.239 mbpd
- 3.452 mbpd
- 3.444 mbpd
Based on your premise, the small decline from 1972 to 1973 was not significant because 1973 was 6.3% higher than 1971. 1973 was significant because it was the start a permanent and irreversible decline in production.The common connection between the world now and Texas in the early Seventies is that both were in the vicinity of 50% of Qt. Texas, the Lower 48, total US, Russia and the North Sea never equaled the production they had in the vicinity of 50% of Qt.
I repeat my predication. We are in the early stages of a ferocious bidding war for net oil export capacity.
http://www.rrc.state.tx.us/divisions/og/statistics/production/ogisopwc.html
http://www.opensourceenergy.org/C17/News%20Viewer/default.aspx?ID=1135
50-60% efficient, to good to be true or a silver bullet
RR
by your estimation does this have a chance at being up and running any time soon or should I exhale (stop holding my breath)
Mark is a Peak Oil believer, though, and he is doing research to try to mitigate the effects. Here are a couple of links that describe Mark's other research, which is cellulosic ethanol:
RR
How Stirling Engines Work
RR
What a nest of worms doth here appear.
I remember clearly the final lecture by Prof Marble at Caltech in the early 50's in which he declared the near-term demise of the truck diesel- killed by the recuperative brayton gas turbine's lighter weight, smaller size, higher efficiency and mechanical simplicity. All we had to do, said our good Prof, was "get the compressor a little better" Ha!
So what happened? The gas turbine got better, all right, but the diesel got better better. And so we are still passing those thundering monsters on today's highways 54 years later instead of the quietly whining monstors of Prof. Marble's dreams.
Moral of story- it is damn hard to beat the cost-effectiveness of a simple diesel piston sliding in a round hole, made of dirt cheap cast iron instead of superalloys running red or yellow hot as the brayton demands. Believe me, I have tried.
As for stirling engines. Ah, that's a different story. All we have to do is get----.
Incidentally, there are no end of ways to vastly improve what we have already.
Back in the 90s there was extensive research funded by GM [some UK engineers involved] into better combustion. They used a much bigger spark to ignite a deleberately swirling gas mix due to piston shape [apparently the feeble standard spark can't cope with much gas movement]. Prelim reults were published in the authorative 'Electronics world' back in about 97 - I think they said about 30% better in both power AND mpg.
Presumably GM have sat on this since.....
Reason I like stirling is that it works fine burning trash I can pick up in my back yard. But then if you start picking up my trash, where am I? I gave my gun to my son-in-law.
http://www.rawstory.com/news/2006/Retired_colonel_claims_U.S._Military_operations_0415.html
"I would say -- and this may shock some -- I think the decision has been made and military operations are under way," Col. Gardiner told CNN International anchor Jim Clancy (as noted by Digby at the blog Hullabaloo).
Just another item going back at least a year. Both the USA has been operating in Iran for the past year, just as Iran has agents in Iraq and has for quite sometime. Iran is a big country physically with lots of mountains. Easy to operate in there.
Has any one noticed that in the March OMR (14/3/2006) on page 14 the OPEC and Non-OPEC supply curves have been moved down by appr. 1 mb/d compared to those in the February OMR report (10/2/2006) on page 16? It seems as if the curves have turned around some point in 2003, swinging them lower for the last month.
The OMR contains in table 3 (world oil production) monthly supply data for 3 months preceding the month of publication. It is worthwhile to enter these in a spreadsheet for the period 1/2005 to date and see how these data are being revised later (mostly down).
What's going on here? Has this to do with Bakhtiari's suspicion?
Can you superimpose the 2005 (or older) CERA and IEA predictions on that graph? I would like to see how accurate they are.
May I request that Stuart create this addition on some future thread ?
I shows the inflection between growth in volume to growth in price rather nicely, a key point taht is now in the rear view mirror.
Thanks,
Alan