Critiquing the 2006 Megaprojects report
Posted by Stuart Staniford on April 6, 2006 - 8:31am
The executive summary is that while I think this report
- was a good deal of work and is a considerable service to the public
- has some improvements from prior "bottom-up" reports
- I don't think this methodology is reliable at this time.
- I disagree with the conclusions of the report.
The basic conclusion of the report is that, as long as there are no major shocks/disruptions, total oil supply will continue to increase at a modest 1mbpd-2mbpd rate per year through 2010. The report does not analyze beyond 2010. Thus it proposes that the peak of oil supply is later than 2010. However, since 1-2mbpd increases are not likely to sate a fast growing world economy, the report suggests that prices will continue to be high throughout that period.
This picture is markedly more optimistic than last October's report, which suggested that essentially all spare capacity had been used up in 2004, and it seemed unlikely that enough new capacity could be added to make up for an assumed 5% decline in existing production. Therefore peak oil was presumably real soon.
The causes of the greater optimism are twofold. One is an increase in announced projects (especially in OPEC, Canadian tar sands, and the inclusion of smaller projects down to a 50kbpd peak flow cutoff). The other is a change in the way that depletion is computed, which is effectively quite a bit more optimistic.
The new estimates are summarized as follows (this taken directly from the report).
| 2005 | 2006 | 2007 | 2008 | 2009 | 2010 | |
| Opec new capacity | 1,160 | 1,520* | 1,420* | 1,320* | 2,240* | 2,235* |
| Non-Opec capacity | 1,416 | 1,865* | 2,320* | 1,886* | 1,710* | 1,035* |
| Total new capacity | 2,576 | 3,385* | 3,740* | 3,206* | 3,950* | 3,270* |
| Capacity erosion | 1,226 | 1,400 | 1,600 | 1,750 | 1,800 | 1,850 |
| Net new capacity | 1,350 | 1,985 | 2,140 | 1,456 | 2,150 | 1,420 |
| Gulf of Mexico loss | 300 | |||||
| Net Net | 1,050 | 1,037** | 1,300** | 1,866** | 1,622** | 1,189** |
All figures are in thousands of barrels per day (or millions for Europeans treating the comma as a decimal). Let us take the lines in turn.
The first three lines concern new capacity based on a tabulated list of projects (assume to occur without delays - that is the meaning of the *). I have two minor concerns here, but basically I am willing to accept that these values are reasonable - the process of tabulating these lists in the various reports has been improving steadily in the last few years as the different players improve their lists and compare notes with each other's efforts. My minor concerns are that the 2010 numbers are probably not very reliable since further 2010 projects could easily be announced this year, and perhaps even into next year a little. Secondly, the way that new capacity is allocated between years is not clearly described. This issue arises because a project that reaches first oil in one year probably doesn't reach it's plateau until some months or a year later, and may not have it's first full year of plateau production until two years after first oil. There is a little text in the report suggesting there is some accounting for this, but it's not possible to assess the details. Still, I do not think either of these caveats are likely to be conclusion changing.
The next line (capacity erosion) is where depletion is accounted for, and therein my critique will lie. However, let us come back to it in a moment. The "Net new capacity" line is the new capacity with the "capacity erosion" subtracted out. The line after that is a one-time loss to account for 2005 hurricane impacts on production. Finally, the "Net Net" line also adds in some fudge factor for Murphy to enter the picture and delay projects and cause them to fail to meet their hoped for production targets. So that last line is really the bottom line, and as you see, it is positive in every year: Chris expects capacity, and one assumes production, to increase each year through 2010.
The Achilles heel of this whole methodology, in my opinion, is that we have a very poor handle on the decline part of it. The typical bottom-up analysis in the past has, after completing a long, careful book-keeping exercise on the new projects, devoted about two sentences of handwaving to justifying a fixed percentage for the decline rate. However, the conclusions are invariably very sensitive to the decline rate. And this uncertainty renders the whole analysis moot. Although this latest report has a different approach, I do not believe it is reliable either, and thus this report does not move us any closer to a solution. I am not personally very persuaded that there is going to be a solution, but I'd be glad to be proven wrong.
Let me quote in full the justification in the report text for the "capacity erosion" row in the table above. This paragraph pertains to how the 2005 capacity erosion was computed:
The projects that actually come onstream in 2005 had a notional capacity of around 2.6mn b/d. [Capacity additions are allocated by year and time of start-up – so this total includes increments from fields that started up in earlier years, and the amount of new capacity added in 2005 adjusted for start-up date.] However, the actual increase in 2005 supply was just 1.05mn b/d (according to IEA’s Oil Market Report, Febuary 2006). The explanation is the loss of capacity through depletion and the loss of capacity caused by the Gulf of Mexico hurricanes.and this one explains how 2005 was extrapolated into the future.
Capacity erosion or depletion will increase as more countries reach the point where their production declines year-on-year. Over the next few years China, Mexico, Malaysia, India and Brunei will move into decline. All the evidence shows that depletion tends to speed up rather than slow down – the North Sea being a good example.That's it. That's all the substantive discussion there is on this row.
From my standpoint, there are major problems with both of these discussions. To take the 2005 situation first. Obviously, the capacity erosion number is a sum of several terms. It represents the depletion in existing wells, less workovers and additional drilling in existing fields, less new fields with production less than 50kbpd. I don't object to lumping these together: at least for now we have little choice.
However, the way this is done is problematic. I cannot find the IEA February Oil Market Report figure of 1.05mbpd increase in 2005 - the nearest thing I can find in there is a statement in the oil supply summary that January 2006 was up 1.25mbpd over January 2005. This appears to be approximately true, but meaningless: month to month fluctuations in supply are easily that large. It is also true that 2005 production on an annual basis was an increase over 2004 by about 1.2mbpd to 1.4mbpd, depending on which agency you like. So Chris says that there's a 1.05mbpd net net increase, subtracts out a 300mbpd one time charge for the hurricanes, and says that the difference between that and the 2.6mbpd of capacity additions is the capacity erosion of 1.226mbpd (four significant figures, no less).
Ok, but the real story of 2005 is that production plateaued! The "net net" increase was indistinguishable from zero! I know most of you must be sick to death of tracking these graphs twice a month, but I really do need to repeat it to make my point:
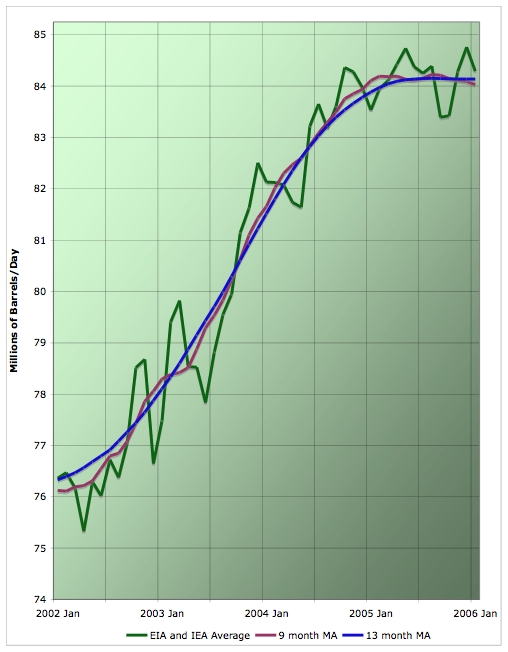
So you can see why Jan 2006 is up sharply over Jan 2005 - Jan 2005 happened to be a big spike down. But that isn't representative. You can also see why 2005 as a whole year is higher than 2004 - in early 2004, production was still increasing. But that has stopped. Across 2005, if we average out the noise, production was pretty much flat. So I think there is no sound basis for this 1.05mbpd of "net net" increase. (And no, the plateau is not due to hurricanes and wars.)
I also think there is no basis for putting in a one time charge of 300kbpd just in 2005. Firstly, there will be a smaller but non-trivial charge just in the GoM from permanent hurricane damage. Secondly, we are down 600kbpd in Nigeria for an unknown period, with the rebels threatening to make it worse. Thirdly, Iraqi production fell significantly in late 2005 and prospects for recovery are uncertain at best. So we are well on the way to at least as big a one time charge in 2006 even before hurricane season starts. And in an uncertain world, I see no reason to think 2007 to 2010 are likely to be any better.
So my position is that what happened in 2005 is that 2.6mbpd of new capacity was entirely offset by capacity erosion.
So, like Chris, I tend to assume that capacity erosion will increase in the future. By how much? On a year to year basis, I think there's basically no way to tell. In the grand scheme of things, over decade long timescales, I expect net declines to only increase to a few percent annually (absent major shocks), but year to year changes are likely to be noisy. Chris puts in some numbers without saying how he got them.
In the next year or two, Chris shows the gross capacity increases being a little higher than 2005 - 3.4mbpd in 2006 and 3.7mbpd in 2007. But that's before delays and disappointments. So we maybe get about 0.5mbpd ± 0.5mpbd of new capacity more than we got in 2005 (error bars subjective estimates of mine). Against that, we on balance are likely to get a highly uncertain amount of increased capacity erosion, and a highly uncertain amount of hurricanes, rebellions, and wars. Does that mean 2006 and 2007 will be better than 2005? Doesn't seem clear to me.
My basic view is that we are in a bumpy plateau until we hit a big oil shock because one of the various simmering problems around the global oil supply system boils over and sharply cuts supply for a while. Or in the alternative, we are in a bumpy plateau until the housing-bubble/crazy-hedge-fund-credit-derivative/global-trade-imbalance situation blows up and cuts demand for a while (eg see Mish for a primer). My wild-ass-guess probability of one of those things happening is about 0.2-0.4 per year. Which means we won't have to wait too many years.
And once one of those things happens, people will start really serious efforts to conserve which will cut demand for a decade or so, during which we'll consume another few hundred gigabarrels towards the URR, and after doing that, production will not be able to reach these levels again (which is good - we have some big ice caps to save).
At least that's my best guess and now I'm going to bed.
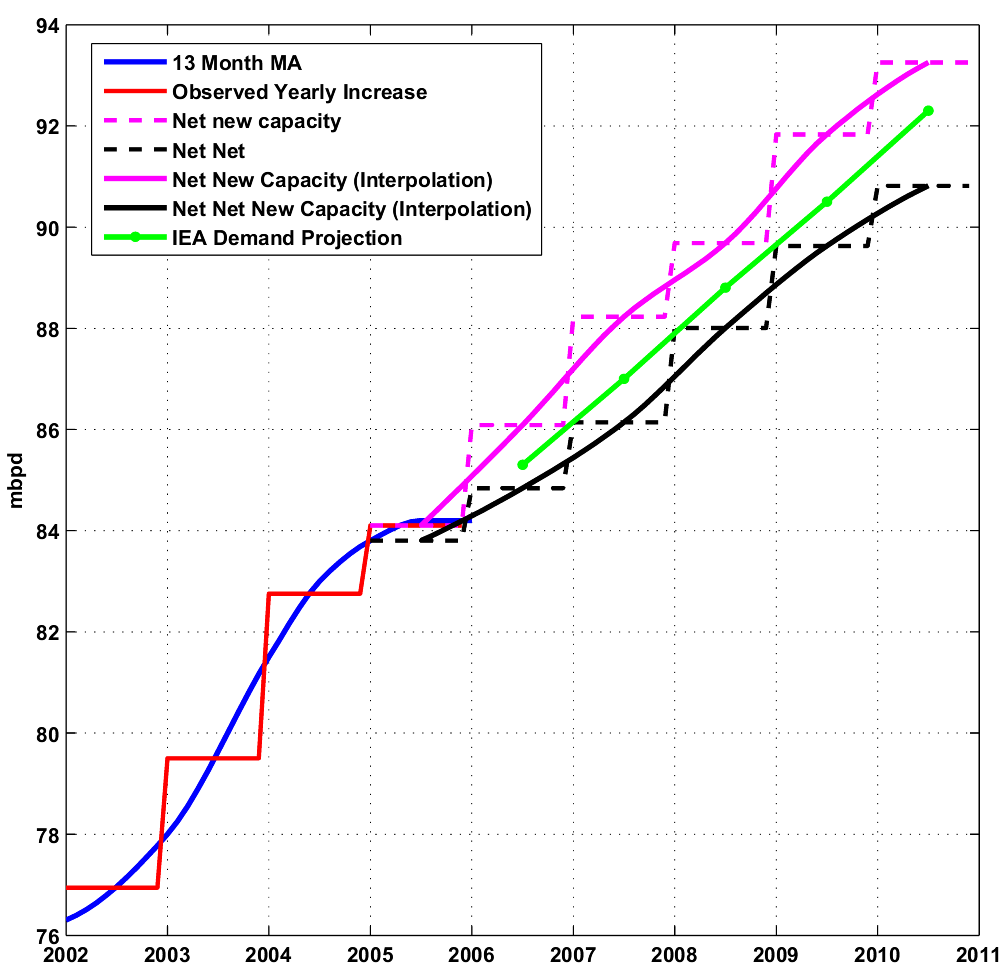
Update [2006-4-6 15:31:21 by Stuart Staniford]:
Khebab made a nice graph summarizing Chris's projections tacked onto the data in my graph above, together with the IEA's demand projections.
Contact
- Content: editors at theoildrum dot com
- Tech support: support at theoildrum dot com
License

This work is licensed under a Creative Commons Attribution-Share Alike 3.0 United States License.
So when a new well is discovered, the projected production numbers and reserves are always on the high side. When production starts, it often beats "expectations" much to the delight of our investors. But who is going to tell investors and loan officers that production is declining faster than expected? Who is going to hint to them that you may not be able to pay dividends or loan obligations this year? You'd have to be a fool to blast them with the bad news.
Contrary to the popular myth, bad news (of the financial sort) does not travel fast or far.
Sometime between Chris's ASPO presentation last fall and this month, he was paid off.
And no, a change in the megaprojects report does not count as proof.
I was using 'tongue and cheek' commentary method.
-Squatch
Which is highly implausible given the shortage of rigs and people.
I think it's increasingly clear that we'll be on the infamous bumpy plateau at the current production level (or slightly higher) for some time, and not see a pronounced production peak. The ASPO production graph that we can all draw with our eyes closed is really showing actual/past production and future/possible production--it mixes two different things on the same graph.
The things that will keep us on the plateau are the infrastructure limitations you mentioned and price increases, temporarily locked-in production (Iraq, part of Nigeria in the very short run), plus a shift to a greater capacity for processing heavy, sour crude (as in Venezuela's), with a smidge of production from tar sands.
Prices will keep rising until they really are high (they're not high yet, in my opinion), which will accelerate the shift to greater oil efficiency.
There's a lot of balls in the air all at once, but the net effect is: Get used to 85 million barrels per day. We'll be here for a while.
The Iranian wild card is just scary. Iraq may get so bad this year that it may almost zero out.
I agree with these points.
IEA data which is the basis of Stuart's analysis reflects several different situations at the same time.
i) Physical limitations of oil exploitation (This is a physical oil peak).
ii) Demand destruction derived from high oil price.
iii) Demand destruction derived from the policy of energy conservation (Oil demand doesn't increase much in many European countries and Japan recently. China reduced the oil demand increase without hurting economic development last year).
iv) Oil production sabotage (Iraq, Nigeria, hurricanes, and so on).
v) Existence of borders (Oil must be exported from oil exporters to oil importers. Some countries might limit oil productions from strategic reasons, most notably Russia and Venezuela).
On the contrary, Chris' analysis reflects mainly on physical limitations of oil exploitation. He summarized the maximum oil production which should be physically possible without considering other factors. In fact he himself did not draw any graphs suggesting rosy pictures. Khebab did. Chris's own conclusion is that only if new capacity flows into the system rather more rapidly than of late, will there be any chance of rebuilding spare capacity and softening prices. I don't think that he believe this scenario.
I think that these two pictures merely depict one thing only from different perspectives. The reality does not happen in a manner depicted by Chris' analysis because all the factors described above work together. However, we can't know how flat and how long the plateau will be either.
is disguising already depleted fields.
Once the "Cut" is no longer "working", the fields'
decline will be in the double digits.
Also, the failure rates of these fields have never been anticipated.
# Such an Accord-the Rimini Protocol- shall have the following outline provisions:
1. No country shall produce oil at above its current Depletion Rate, such being defined as annual production as a percentage of the estimated amount left to produce;
2. Each importing country shall reduce its imports to match the current World Depletion Rate, deducting any indigenous production.
Of course, the Oil Importers would never allow this to happen.
http://www.peakoil.ie/protocol
James
Re the decline rate - how CS arrrived at this is desribed in previous article in PR - it makes more sense to read this megaprojects update in the light of those. here is a link to the depletion rate article:
http://www.aspo-australia.org.au/References/PetReviewAug2004Skrebowski.pdf
When supply gets tight the fastest and cheapest ways of increasing production are:
- increasing production from existing fields / wells by EOR
- infill drilling of existing fields
These are basically one off tactics. They have probably been used (though probably somewhat rig availability limited) to a near maximum extent in several major producers over the last 2 or 3 years. This is probably a one off gain and it would be unwise to assume further such gains, without a balancing downside, continuing for long. I wonder if CS's reduction in depletion rates have been somewhat skewed by this?Batten down the hatches.
What I find murkiest and do not care to venture an opinion on is what the political response to stagflation--possibly much worse than that of the seventies--will be in the U.S.
Put another reef in the sails and check the life boats. Stormy weather ahead.
Hard unpopular decisions have been made fairly recently across all major parties, both in power and in opposition. The government run pension system where changed into one that follows the ability to finance it thus probably screwing at least 1/3 of our population to not screw all of us by crashing the system. This is propably the kind of not especially democratic political black magic needed to handle the more depressing peak oil scenarios.
I think most nordic countries will do ok in a financial sense. Denmark recently repaid the last of its foreign debt, Norway has a fair ammount of oil and plenty of gas, Iceland export power intensive goods and can manufacture far more, Sweden has good export industries and a shrinking foreign debt, Finland is better run then Sweden.
I am trying to figure out what will attract investments and industrious people in likely peak oil scenarios thus making them easier to handle. My best ideas so far is to rationalize the state and get it to work better with less waste of tax money, make it easier to start and run businesses, investments in energy production and more efficent infrastructure and investments in more reliable electricity production and distribution. A serious handling of likely global warming scenarios with more district heating, prepairing for eventual flooding due to tormental rains and so on cant hurt. Basicaly trying to get ones country to be one of the most reliable places on the planet.
It looks like people changed very little during the crises, but there were lagging changes that carried into the early 80s. A really interesting point is that according to the FHWA, VMT for light trucks (pickups, SUVs, vans) and semis increased continuously throughout the oil shocks. The reductions were in cars and delivery trucks.
I'm beginning to wonder if we should take it literally when people say "You can have my SUV when you pry my cold, dead fingers off the steering wheel." What if Americans are really so stubborn that they will avoid making changes until they can't afford to change anything?
That said, some driving is discretionary and will be volutarily curtailed but the bulk of driving will not.
What price "joy riding"? That cost will increase but how much of that do we do now when most of us consider driving a chore rather than a pleasure?
Excellent mobility might not be a right but it will be a option that Americans will rightly fight hard to keep out of pure self-interest. The AAA is just one interest group that needs to voice this position.
And here's another one:
Energy Alliance Urges Congressional Action to End U.S. Energy Crisis
In the red corner we have The American Way of Life, world champion for over 50 years, in the blue corner we have Planet Earth, the unknown challenger, quoted at 100/1 by the markets.
If, when?, they reverse the multiplier effect also reverses. So much of the US economy is now driven by these basically non-essential activities that the resulting implosion could be quite shocking.
Before that happens we should expect to see a reduction in consumer discretionary expenditure as increased energy costs eat in to disposable income for many, it will be the first material sign of what is to come, pay attention, lol.
We've not done that analysis and neither has AAA. Instead we have AAA trying to declare mobility as a "right" without even considering the costs at all.
So driving will become more expensive, and they say it won't decrease. But imagine the reverse secnario. You can bet that if driving were becoming less expensive, they'd be saying loudly that the decreasing costs would increase VMT.
This brings up an overlooked point --- if the total cost of driving the car is 52 cents/mile, then for a 20 mi/gal car at $2.50/gal, the gas is 12.5 cents/mile, or only 24% of the cost.
If gas goes to $4.00/gal (60% increase), that is 20 cents/mile, and the total cost of driving has gone up only 7.5/52 = 14 %.
Great insight! Because I have sunk costs of $40,000 then I may as well spend $0.25 a mile to extract some value from those sunk costs.
The same also applies when the SUVs and Land Yachts are sold when trading down to fuel efficient transport. The SUV goes into the used resale market where it sells for a fraction of its value. Had a girl friend once with a Caddy she bought for a song. The amount she saved in capital costs paid for a lot of expensive gas.
Not to mention the stories that backseat could tell :-)
That is, on a month to month basis, increasing the cost of gas one US dollar makes a huge difference to the average family, versus the relatively small, and fixed, car payment. From a GDP standpoint, once we stop people taking out all these insane home equity loans, which appears to be happening now, the results of rising gas prices will be quite severe when it comes to discretionary spending.
- Pick up a 2nd day air delivery package in rural Colorado.
- Drive it to Montrose (60 miles)
- Fly it to Steamboat Springs and Commerce City
- Then fly it east to Kentucky
- Only to put it on another plane and fly it west to Long Beach, CA
- Then drive it to Annaheim
- Continuing on to Vernon,CA and finally,
- Driving it back to Los Cerritos,CA from where it is delivered to Long Beach not far from where the plane landed.
The point is that so much of our economy depends on them being able to do all this for almost peanuts, and for that they need critical mass. As our discretionary income is eroded, and we ship less stuff around, we get to a tipping point where some things just dont work anymore.Location Date Local Time Activity
CERRITOS, CA, US 04/06/2006 7:25 A.M. OUT FOR DELIVERY
04/06/2006 5:38 A.M. ARRIVAL SCAN
VERNON, CA, US 04/06/2006 5:11 A.M. DEPARTURE SCAN
04/06/2006 12:52 A.M. ARRIVAL SCAN
ANAHEIM, CA, US 04/06/2006 12:10 A.M. DEPARTURE SCAN
ANAHEIM, CA, US 04/05/2006 7:45 P.M. FORWARDED TO THE FACILITY IN THE DESTINATION CITY
LONG BEACH, CA, US 04/05/2006 5:56 P.M. DEPARTURE SCAN
04/05/2006 5:24 P.M. ARRIVAL SCAN
LOUISVILLE, KY, US 04/05/2006 4:04 P.M. DEPARTURE SCAN
COMMERCE CITY, CO, US 04/04/2006 8:43 P.M. ARRIVAL SCAN
STEAMBOAT SPRINGS, CO, US 04/04/2006 7:45 P.M. DEPARTURE SCAN
04/04/2006 7:35 P.M. ARRIVAL SCAN
MONTROSE, CO, US 04/04/2006 7:05 P.M. DEPARTURE SCAN
US 04/03/2006 6:43 P.M. BILLING INFORMATION RECEIVED
The bad scenario is that a significant slowdown occurs, PO happens during that, and the recovery from the slowdown begins to happen on the basis of relatively cheap and relatively unlimited supplies of oil and natural gas. This is recovery from a low point meeting declining oil and NG supplies. Weakened economies are less able to switch to alternatives and adapt to / invest in alternatives.
A better scenario would be for the oil / NG constraints to be widely recognised before and perhaps be partial cause of the slowdown. That way the constraints become a serious consideration in the solution to the general economic problem.
Of course some geopolitical and / or market events could well intervene. I would see that as good if they focused awareness on the oil / NG resource limitations and resulted in a serious attempt to address such problems by investment in alternatives / infrastructure / conservation.
On balance I expect the bad scenario to take place unless appropriate geopolitical shocks have the desired effect.
I would be careful to make step further on Iran on the same basis though; this country is much tougher target and the results can be far more devastating - including the total loss of US credibility worldwide and the loss of positions in ME.
I would argue that true OPEC new capacity is hidden from all but a chosen few people, as OPEC doesn't have "depletion", so OPEC's new capacity each year could just be covering field production "problems" or depletion rates to us TODers. The best way to see OPEC's new capacity would be to see actual increases in production figures given in their monthly report. If each OPEC country's production figures drift around the same value through the year, I would argue that no new capacity has been added, only capacity to make up field depletions. If production values in the monthly report increase (e.g. Algeria increases production to 1.9 Mbpd), then I would accept new capacity has been added for that year.
Saudi Arabia has a few projects which will "increase" oil production by 500,000 bpd each, but Matthew Simmons has predicted that one of those oil fields which produced a maximum of 210,000 bpd 25 years ago before halving in value within 2 years of the peak, will be unlikely to reach those ambitious totals. To increase production in those same fields 25 years later by a factor of 5 from the final reported daily rate and keep producing 500,000 bpd for many years when the oil field was depleting fast, seems impossible.
Chris Skrebowski deserves all my respect and is by far one of the most important oilmen of today. But there are some things I do not understand.
Wasn't Chris who warned us of the 5% or higher decline rates in major oilfields? How can he turn up with a report like this?
These higher than previously thought decline rates on older oil fields is the best explanation we have for this almost two year long plateau.
When we look at total production for 05 and see an increase over 04 we have to realize that's caused by an increase in early 04, and not in 05. That's not an intuitive thing at all, and you only get it by observing monthly data.
I mean it's one of the problems with that.
Does anyone have a take on the Megaprojects prediction track record in the past? I suspect Mr. Skrebowski has been way off if he's consistently ignored external events like weather and war. Maybe we could come up with a correction factor to apply to future reports to get a better read on production - the TOD "reality" factor for the Megaprojects report.
By taking that line out, and those assumptions it makes the future potentially look rosier than before.
I don't, however, understand why he drops the depletion number by more than half. My only immediate thought is that he has assumed that Aramco are using in-field drilling to offset depletion (which is what they claimed that they were going to do, and why they are increasing their drilling fleet). If they can offset 800,000 bd then this is obviously significant, though their rig counts are still going up to the level needed. If they succeed, then perhaps the world will be in precarious balance for the next few years, if they don't then the earlier, gloomier, scenario will prevail.
As Stuart notes the major changes to the lists are in OPEC supplies, one can assume that there may be some additional potential increases in non-OPEC supplies, though the only significant ones that are included in the tables are for the Canadian oil sands.
One thing about the graph, shouldn't "% of total energy available to society" be X/(X+Y), since X+Y is the "total recoverable energy resource"?
Has anyone saw linear growth and oil together before?
Did the ASPO people or Chris himself give an explanation for such a limited discussion of the topic or offer to give more detail/justification of how they arrived at their depletion numbers?
I can't believe his anaysis adequately takes decline in Ghawar, Burgan, Cantarell or other mege-giants into consideration.
Ah, the elephants in the room, the aged, doddering kings and queens of the oil patch. Has anyone ever looked at the history of the Yibal field? It is in Oman. It has used the same technologies as the Ghawar, Burgan and relatively nearby fields in the Arabian pennisula, and when it started into decline, it went in a spectacular fashion.
Here is a summation of its history:
In 1997, production at Yibal peaked, and the yield began to decline. Two papers written last year by Petroleum Development Oman officials show that production in Yibal dropped at an annual rate of about 12 percent for six years. The two papers adduce different production data.
The first described a decline from 251,592 barrels a day in 1997 to 88,057 barrels a day by 2000. The second described a peak of 225,000 with a drop to 95,000.
This situation maps almost exactly to the concerns voiced by Matthew Simmons, head of Simmons International, about the big 5 Saudi oil fields -- i.e., that the fields may be close to peak production, and that water drive and other enhanced production techniques have been used to the point where the reservoirs are straining.
http://www.greencarcongress.com/2004/04/the_shadow_of_y.html
This is what the oil "experts" are refusing to address. The immense abuse the fields in Saudi Arabia have suffered. When the decline starts, and many believe it will start within a very short time, it will go fast.
Wishing will not stave off physics.
Wildcat producer sparks oil boom on Montana plains
http://www.post-gazette.com/pg/06095/679602-28.stm
The field they discuss has a production rate of 48000 per day, not bad for onshore lower 48 but obviously not a big dent world or even national usage. But they talk about potentially 20 billion barrels recoverable out of 200 billion in place which if true would seem to be a great find.
It would be a good find, if it's there but it's still a Prudhoe Bay sort of find. That's not peanuts but go back and look at the chart of US oil production for 1949-2004. I graphed this info from EIA historical data and keep a chart of it handy.
Prudhoe Bay is that bump on the chart in the early 1980s. It helped, very briefly, but did not alter the long term trendline too much. A Prudhoe Bay sized find in the lower 48 now would help tremendously, if it actually exists, but I have not seen convincing evidence that it does exist. And mind you, finding a 150 million barrel field is not nearly the same thing as finding a 20 billion barrel (produceable barrels) field. To suggest that there is such a field there implies that multiple oil companies all got it wrong repeatedly for years and years. And for perspective, that 150 million barrel field is 7.5 days consumption in the US. It's a big deal to a small producer and will make the guy in the article rich. In ExxonMobil's world, that's peanuts and may not have been worth the investment compared to other ways to invest their money.
Not enough to go buy those GM bonds yet.
Proven reserves of 150 m bbl, all the other numbers seemed speculative. But it may encourage further similar exploration. Nice one.
Charlie Brister, a driller who talked at the ASPO conference last summer was drilling horizontally into very thin very deep oil layers in Montana. Sounds like it might have been the same play.
OPEC has actually fallen back a bit, further deterioration in Iraq outweighing small gains from UAE and Kuwait.
Overall we've moved a bit forward nevertheless. And we have Canada (almost entirely unconventional I think) and Angola to thank for practically all of it. Smaller contributions from Russia, Brazil and Azerbaijan.
My point was that we've hit plateaus before, and even had declines, in recent history, but we've always gone back up from them. The way the graph is shown here, it makes it look like the current pattern is unprecedented.
Mathematics is wonderful.
Sound logic is wonderful.
But neither takes away the fact that we are in an unprecedented situation.
We are after all, knee deep into offshore extraction and heading towards the edge of the continental shelf. Not being an expert, I rely on Bubba's explanation way back that there is zero chance of finding oil beyond the edge of the continental shelf. Just because we have "always" before found oil along our long trek from Titusville, Pa. 1886(?) to ThunderHorse, GoMex (2006)does not mean that the "graph" will continue linearly. It is not more of the same. The winds are blowing (i.e Katrina) and our ladders are teetering as we reach for the high hanging fruit.
If this is "just another plateau", then why has the market reacted differently to this one?
I mean, there have been other geo-political factors during the last 16 years that affected spot prices, but this is the first time that a marked uptick in the long-term prices has occurred.
If you have an explanation of this Halfin I would seriously like to here it, because this graph makes me worried.
Is anyone in a position to send me this data? I'd especially love to have the data from earlier than 1990 as well. I'd really like to do a whole piece just on this curve.
Also, it looks like the hurricanes caused that last big movement downwards in the curve (it's hard to tell for sure without gridlines). What's with that? Were the markets thinking higher prices short term would cause long-lasting demand destruction?
http://www.dailykos.com/story/2006/3/25/173852/003
I really would like to hear someone try to explain this. I can't think of anything that might justify this rise that isn't related to an imminent peak. But if someone else can, please speak up, because I feel that it's validity needs to be debated.
The only argument against this being related to peaking is that the market may be 'buying' into the "Peak Oil" hype, but it seems unlikely that so many people could be just duped.
That's an interesting theory. When I first heard about peak oil, I happened to jot down the number of Google hits for "peak oil". On 8/3/04, the number of hits was 53,200. Today (4/7/06), that number is 6,200,000. I wouldn't be surprised if the traffic stats for peakoil.com show a pattern almost identical to that futures chart.
I would be. Since I've actually seen the traffic stats for PeakOil.com. ;-)
Alexa
IME, traffic to PeakOil.com and other peak oil sites is driven by mostly hurricanes and oil/gas prices.
Personally I don't believe this theory, I just thought it could be the only 'non-peak' theory that could explain away this amazing graph.
JD, do you believe that the markets are 'betting' all this money on hype?
How did you arrive at the conclusion that the 'pricing in of the peak is mostly complete'? We could be in the first inning of an oil price increase and this is just a pause -doesnt have to go straight line up.
Or are you saying that even AT peak oil, these will be the prices we'll see because of alternative supply (CTL, biofuels,etc)?
And I think the selloff late in the graph coincided with the overall oil sell off POST hurricane - just not clear from the axis time label
I was wondering that myself. Futures are still rising, aren't they? I don't keep track of the 5-years out futures, but the end of year contract cracked $70 recently.
Then, the metals and oil connection. $600.00 gold and $12.00 silver along with the $68 crude today. These seem to jump each time oil and gasoline rise. I think if you chart them together they will 'track' pretty close. In general people buy metals when the don't trust the inflationary controls, right? Oil price push drives up everything.
Since many of us believe decreasing 'net' energy extraction, increased in-producer-county consumtion, and the conflict/hurricane draw are inevitable. Could hedge fund managers be 'signaling' they believe these things as well?
Exchange traded funds (ETFs) now exist for Gold, silver and oil (oil should start trading this week under symbol USO). Short of buying a futures contract and all the hassles that entails, people can just buy this stock that replicates the oil market return minus a small management fee.
The problem is that to start these ETFs there needs to be a certain amount of underlying collateral in the trusts, which is a primary reason silver has gone from $8 -$12 recently in anticipation of the opening of the silver ETF. I wonder if that is part of the reason for the recent oil rise as well, though that market is much bigger.
There is commodity INVESTMENT demand as well as commodity actual demand - some times the cart leads the horse, however briefly.
An interesting theory ... but how do you explain the recent run up in for example -- copper? All the metals appear to be on fire.
I don't subscribe to this theory, but about the only expanation I can see beyond a real world supply available at a given point on the price curve balancing is too much speculative or "hot" money sloshing around. There is certainly plenty of that [thank you Easy Al], but as previously stated, I do not think that is the underlying cause. Peak metals?
That said, what struck me as odd about Skrebowski's report is the
- The Capacity erosion (depletion) is not taken as a fixed percentage (eg. 4%) over the period but actually decreases as a percentage of overall capacity year-on-year. The warning signs are there however. Consider Burgan (Kuwait) and Cantarell (Mexico).
- Skrebowsky's own Type III depletion is mentioned but does not apply to the list of new projects. So, when we consider various above-the-ground constraints on production in Russia or Nigeria or Mexico or Iraq, etc., these contraints are not figured in. Rather, in calculating the Net Net Chris applies a function across the board (20% slippage and 10% capacity shortfall).
- Production costs or investment uncertainties for individual projects are not considered. These are part of the "constraints" listed in #2 above.
- Skrebowsky does mention wars, revolutions and hurricanes but says they are unpredictable. Stuart addresses the current "oil shocks" happening now in his remarks. Actually, in the real world there are always oil shocks of one sort of another occurring. You could just as easily assign an idealized fixed percentage eg. 2% of world capacity for any given year and you wouldn't be far off.
For example, I would consider production additions in Nigeria to be a highly dubious proposition at this point in time. Additions from the GOM are equally uncertain. On the other hand, additions from Brazil deepwater are probably a safer bet. Likewise for Algeria. As we know for Mexico, they have both equipment and manpower shortfalls. And so on for each producing country. As for the capacity erosion numbers Chris sets, I have no idea where he got those.It appears to me that some in the Peak Oil community are a bit alarmed by this report since it seems, to some extent, to lean toward CERA and away from the "depletionists". However, even given Skrebowski's very generous (IMHO) assumption of 21/mbpd of new capacity by 2010 (CERA assumed 16.4/mbpd), he concludes, assuming a demand rate of 1.5%/year
This is contrary to CERA's assumption that excess capacity will exist by the 2010 timeframe and that prices will drop. Considering the factors Stuart mentions and my own small contribution here, the high ceiling Chris sets is, as I stated at the outset, the best of all possible worlds.Unfortunately, we do not live in that world.
I would like someone to explain to me clearly why the IEA is assuming a constant 5% depletion rate which gives a depletion erosion of about 4 mbpd/year (see table posted by Heading out above) whereas Chris is assuming an erosion between 1.300 and 1.900 mbpd (<2%)!
My own WAG would be that Chris calculated the 2005 erosion the way Stewart quoted and chose to be conservative in predicting its growth in the years up to 2010.
I would be careful in accepting these numbers... What if the low 2005 decline rate has been due to producers pushing the fields to their limits? If this is the case how long will they will be able to hold on? And how long before production starts collapsing?
If I had to guess the truth should be in between - in the beginning 1.5-2%, rising to 2.5-3% by the end of the decade. This initial 5% is just too pessimistic - it assumes that all existing fields are on average decline of 5%. This contradicts the observations - many fields are expanded, and even mature fields are rising due to EOR. Anyway we did not see 5% depleion last year, even though North Sea continued its fast decline and fields like Cantarell and Burgan also went into decline. Basically without field-by-field analysys it is impossible to come up with any meaningful prediction IMO.
Total New Production= (New Capacity) + (Capacity growth in existing fields) - (decline in existing field) + (Previous Total Production)
Maybe that the Capacity erosion used by Chris is in fact equals to (Capacity growth in existing fields) - (decline in existing field).
If we assume that the average field decline rate is 5%, statistically the overall decline rate will start moving towards that number as more and more existing fields move from growth/stable towards decline phase. Instead his number stays around 2% for the whole period - he is essentially saying that the ratio growing/declining existing capacity will change very little in the next five years.
With big offshore fields getting in steep decline and many major fields like Ghawar almost certainly entering in decline during this period this is a questionable assumption IMO.
Stuart,
Unless I missed mention of it, isn't the report's argument of Weather and Geopolitical events as contributors to this Erosion also ineffective since those and similar factors would have been (whether accounted for or not) part of the production curves while it was rising, too? To allow it to help 'explain' a plateau, these factors would have to be a truly unique phenomenon to that time-period. I mean, Katrina WAS unique, but there have been setbacks throughout the rise of oil, and yet it rose through them.
Dear NewsMax Store Customer:
Oil prices will dramatically fall in the next 12 months to $40 a barrel!
That's the prediction of Financial Intelligence Report. You may know that NewsMax also publishes Financial Intelligence Report, a financial monthly for investors.
Financial Intelligence Report has made very accurate predictions. In April of 2004, Financial Intelligence Report revealed that oil prices would skyrocket from $29 per barrel to over $60 within 12 months.
A Special Financial Intelligence Report reveals:
How oil prices have been inflated through Wall Street manipulation setting the average investor up for big losses.
3 actions to take now to position yourself for the monster profits when today's speculative oil prices fall back to the $35 to $40 range.
- Why there is plenty of oil to meet the growing worldwide demand.
- Why hedge funds will start dumping their oil contracts like there is no tomorrow. And how to double your money when it happens!
- Why Steve Forbes predicts that skyrocketing oil prices are just temporary and that a massive price collapse is coming that will bring oil down to $35 to $40 per barrel and dwarf the Dot-Com crash of 2000.
- Why many doom and gloom forecasts of $100 oil are based upon a common misunderstanding about oil supplies, and is being fueled by frenzied speculators.
The surprising truth about how this past year's hurricane season is really affecting oil prices.To them, the high price of gas lately is them damn ay-rabs, Internationul bankers, and those ee-litists wearing what Kunstler would call "pin-stripped" suits.
Besides, oil is abiotic. Above all, oil is abiotic.
The other option is they expect the demand to drop... a stock crash? a nuclear war?
While the chart, at first glance, swaggers optimistically, CS's personal opinions do not. I don't think he shares his own optimism in this article; if anything doubt seeps from more paragraphs than do proclamations of well-being. For instance he mentions that that in 2005, "notional" or theoretical capacity to be at 2.6 mn b/d while actual additions amounted to 1.05 mn b/d. He states the loss of capacity to depletion and hurricanes in GoM. He clearly sees that actual output did not even meet 50% of projected productions. He doubts the notional numbers to 2010. This article that so clearly begins in sunshine, ends, at least for me, in a fog of pessimism
What is interesting is that of the 150 some "megaprojects" listed, only 1 exceeds 1 mn /d:. Khurais in Saudia Arabia at 1200 kb/d.
This report shows that Canada, Angola, Brazil, Azerbaijan are promising substantial capacity additions within the next couple of years. As I pointed out above, all these producers are already providing modest gains on last year's averages. Not much, but a start.
Nigeria and, on much the largest scale of all, Saudi Arabia, are making the same promises, but have shown us nothing so far. We know Nigeria's problems. What's KSA's excuse?
Time for Aramco to put up, or for us to draw conclusions.
Don't forget that the same thing is true on the demand side. We could easily see anything from being down a percent or two for the next couple of years (in case of a recession) to growing two to three percent per year if the worldwide economy heats up and Chinese growth remains strong.
Then, to figure out the net oil situation, you have to basically subtract demand from supply to determine if there are going to be shortages, and the likely direction of prices.
Well, as anyone knows who has worked in the physical sciences, when you subtract two data items that both have substantial error bars, the percentage error on the resulting term skyrockets. In many cases you can't give any kind of meaningful statement at all.
I suspect that is the case here. Excess capacity worldwide is recognized as being extremely low. As we try to extrapolate forward, there is so much uncertainty on both the supply and demand side that there is very little that we can say about the net difference between these two factors. The future is genuinely uncertain, and while that may make many people uncomfortable, it is the reality that we have to deal with.
That is the charge.
Ex-"...that general demand growth will be slower".
Remember all the talk of demand destruction occurring
Fall 05 because of Hurricanes.
fuel usage dropped 1.5% max (I'll find the source on demand).
Point-the opposite of optimism is not pessimism, it's reality.
As pointed out here at TOD, small deviations can compound
exponentially.
And I noticed also that COM losses are one off, while experienced oilers do not expect 30% of Shutin to ever come back.
James
Then we'll have diminished resources to affect any healthy change (to electric rail, or at least to improved rail and water, to more nuclear, most of which require heavy investments and have long lead times). We not only won't be pro-active, anticipating the problems (We dismissed that opportunity when Reagan defeated Carter), we will wait until long after peak to begin to act. Then we can have blackouts, shortages, and riots, of which the French riots and the immigration demonstrations are peaceful picnics. No, humans in the aggregate may not be smarter than yeast.
Not a problem. The Fed has powers to make money appear or disappear at will. Actually, it is easier to "vanish" money than it is to create it. Helicopter Ben and his buddies are sweating bullets and hoping the price of oil goes down and stays down.
I would not serve on the Board of Governors of the Federal Reserve System at this time for all the tea in China.
(For all the oil in Saudi Arabia, I might think about it, but the choice would not be an easy one. I feel sorry for good people in impossible situations.)
The increased price of oil does tend to increase the holdings of US$ as a hedge for future purchases of oil and because those selling it have more US$. This effect is probably fairly minor in supporting the US$, however. It probably does have some multiplicative effects in that some of the surplus US$ find their way to buying US assets, primarily US treasury bonds etc.
So, I would guess that the increased oil price has been marginally supportive of the US$. Holders of US$ assets are showing signs of jittery-ness, though, and begining to diversify (oh so softly, for fear of breaking the $ spell) into non-$ assets.
A significantly reduced price of oil, say, below $40 would probably have relatively minor downside implications for the US$, but that may be balanced by the positive effect of reduced oil prices on the US economy. A gentle decline in the US$ of 5% or 10% plus a 20%+ reduction in oil prices would be overall beneficial for the US economy.
It may be very marginally easier in the physical virtual world for the Fed to vanish money, but in the politico-economic virtual world the evidence suggests it is easier to continue creating more of it, Don ;)
Not that we are allowed to know now, lol. I will have a hunt round for alternative sources of M3 in a few weeks and post any I find here.
Economic apocalypse is notoriously hard to predict.
Just to give you an example, I recently got an interesting old book from a friend when he moved and threw out all his old paperbacks. It's called "Blood in the Streets: Investment Profits in a World Gone Mad". It was written by two financial commentators/analysts (James Dale Davidson and Sir William Rees-Mogg) in 1988. Here's a quote:
The authors describe in great detail the coming upheaval due to the Latin American debt default, the immanent real estate crash, the end of American supremacy etc. etc.
It's entertaining reading because the authors were 100% wrong about everything. The U.S. didn't go down the toilet in the 1990s. Rather, the country experienced the greatest surge of technology-driven prosperity in its history.
My point is that people have been predicting the implosion of the global financial system for more than 30 years. Davidson and Rees-Mogg made a really convincing case for it 20 years ago. Nevertheless, nothing actually happened. In fact, anyone who actually bought into their immanent collapse theory in 1988 got burned.
The warning sign, I think, is the tone of the analysis. Davidson & Rees-Mogg were so sure of themselves, and it's eerily reminiscent of the tone here. Many of the quotes from their 1988 book could have easily been lifted off The Oil Drum yesterday. That's the problem. The economic future is highly unpredictable and should be addressed by hedging -- not by being sure of yourself, but by questioning yourself. Seriously and toughly asking yourself: Could I be wrong? And if so how? What am I missing? That's what Davidson & Rees-Mogg didn't do and that's why they were so wrong.
How sure are you in the optimistic case? You 'debunk' peak oil but obviously understand its principles - are you as certain as Rees-Mogg was that we will avoid a Peak Oil collapse?
It's really interesting how people can miss things which seem so obvious in retrospect. Consider, for instance, the rise of the gay community, gay marriage etc. Nobody saw that coming... not H.G. Wells, not Orwell, not Aldous Huxley, not Verne, not Poe, not Fritz Lang. There wasn't anybody gay on The Jetsons. All the futurists completely missed it, and yet it's a very real and pervasive part of modern culture. Maybe the only person deep enough to predict the coming change was Wilhelm Reich -- but he was a quack!
So I look at peak oil as one branch of futurology, and the lessons I've learned from futurology are: 1) Above all, be humble. The future is truly and deeply unpredictable, and 2) Don't totally dismiss cranks. They might be onto something.
That said, there is one thing I am 100% sure of regarding peak oil, and that's my desired outcome. I'm simply working to make that outcome more probable, spreading positive information and keeping people's morale up -- in the hope that that will contribute to a good outcome. That's a big difference between me and the doomers. If we take them at face value, they aren't working to make their dark vision of the future come true. We optimists, on the other hand, are very sure what we want the future to be, and we're doing our best to make it turn out that way. So there's an asymmetry of effort. It makes me very happy when doomers spend all their time obsessed with idle predictions of the future. They're arrogant and overeager, and don't respect the caprice of the future. So they end up shooting themselves in the foot, and that's very predictable. It's fun. It's like playing chess with someone who isn't concentrating on the board.
I also am an optimist--though I believe Peak Oil will create extraordinarily hard times. By way of metaphor, storms at sea are forecast all the time; sometimes they materialize, and sometimes they dissipate before they become anything to worry about.
When there is a hurricane in your intended path, it is prudent to alter course so as to avoid the worst of it; then if the hurricane dissipates you are out some time and fuel maybe, but so what? The Big Problem (BP) is that, by their nature, the path of hurricanes cannot be reliably predicted. Thus, all responses to weather forecasts are based on subjective probabilities--and in the back of my mind I have confidence that with plenty of sea room under my lee the boat has a good chance of surviving the worst that Mother Nature, that cruel bitch, can dish out.
Similarly, I believe neither the path nor the magnitude of financial and economic collapses can be predicted with any reliability. I prepare for the worst but with hope (and some expectation) that the worst will not happen.
Another analogy: You prepare for fire by having fire insurance, and if you never have a fire, so much the better. My experience is that when one prepares for the worst, it seldom happens. On the other hand, if one is not prepared, then Murphy's Law seems to attack with the vengeance of an angry Greek god.
I've almost reached to the point of abandoning any insurances, trying to keep as close to neutral position as possible, and investing all I have in myself. Easier to live this way.
Also, I think those that wish for the collapse scenario for this reason will be unpleasantly surprised once and if it does occur
You are not following your own principles and this puts you in one camp with those you call "doomers". How can you say 2) Don't totally dismiss cranks and 3 lines later do the very same thing with all of them?
And then you attempt to present your mission as a fight of the good guys against the bad guys. As you said by yourself nothing is certain about the future. How do you know you are from the good guys? More specifically how do you know that (more or less grounded) optimism is better than alarmism? I think that if you want to have a fair and balanced opinion you should be able to accept them both with some kind of weights. A balanced opinion is easy to identify because its author is constantly questioning him/herself - again you claim doing that but I don't see it in your arguments; instead you are usually in a contradiction mode. How does this comply with your "humbleness" principle?
With all due respect for a fair fight against extremist doomers you need to take a look at how others like louGrinzo Don Sailorman and Halfin. In their responses or even intended silence sometimes I can feel them balancing their own preconceptions against those of their opponents. This I find more interesting.
I don't violate that principle because I don't make predictions.
I don't agree. Many optimists aren't doing a damned thing. Because they think "the market" or "better technology" will fix it. Without their having to do anything themselves, of course.
That's your idea of fun? That's my idea of a boring waste of time.
What matters is if you have the wealth and/or power to help alleviate the PO problem and you are using your resources for that end goal.
This was published in June last year. Their methodology had earlier allowed them to predict the timing of end of the UK housing bubble correctly. What they cannot do is predict whether the bubble will be followed by a crash or a plateau.
All the reasons listed are also mentioned by Chris, so it is nothing new. All you are saying is that Chris is presenting the optimistic scenario.
I view Chris's data and presentation as presenting the best scenario based on what data we have. I don't think he calculates projected delays, etc... into his numbers.
I am amazed to see so much new oil production coming online. A lot of PO advocates are portraying the lack of new production coming online as the problem. The real problem is the tremendous declines in existing oil fields. That is the scary part. Declines drop over 1mbpd and going to increase dramaticly overtime as more fields become brown fields.
Chris also said, "I will stick my neck out and pin the Peak in 2008" - based on his data in November.
- Dick Lawrence