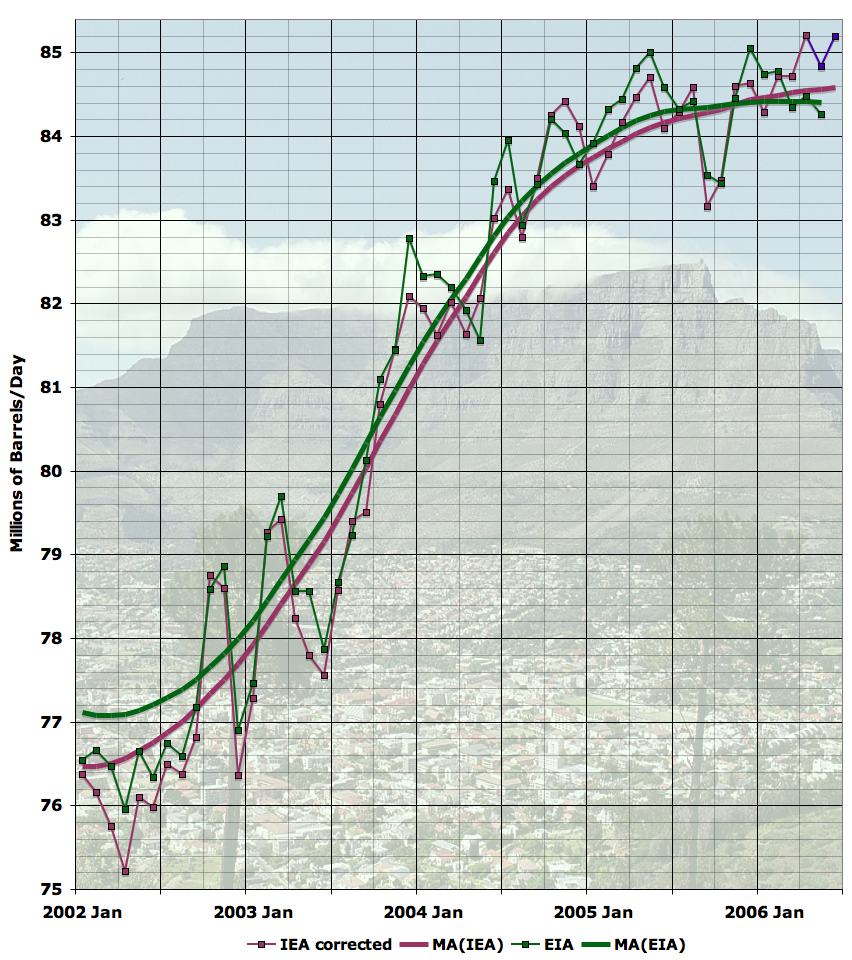
EIA insisting on plateau
Posted by Stuart Staniford on August 3, 2006 - 12:14pm
If we average the two data sources in an attempt to determine the peak month:
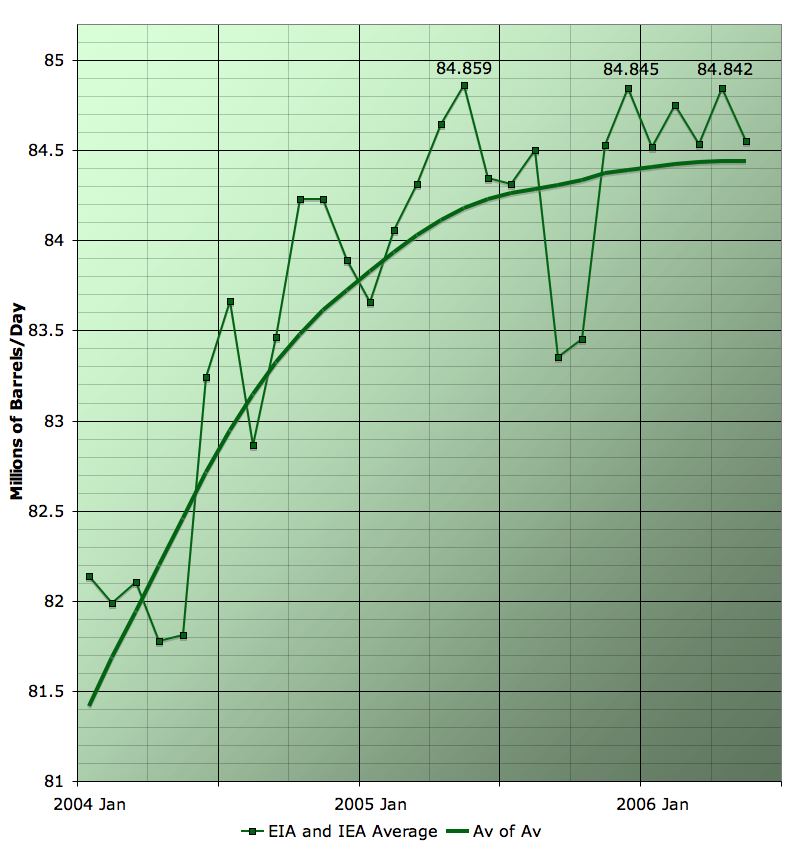
Right now, May 2005 is the winner, but December 2005 and April 2006 are statistical ties. Minor revisions and changes to methodology could very easily change which is exactly the winner (indeed it was December 2005 for a while). But anyway, the oil industry doesn't seem to quite be able to tip it past the 85mbpd mark (on a combined agency basis) for the time being.
Finally, some folks expressed interest in just looking at crude plus condensate (ie real honest-to-God oil, rather than including natural gas liquids, biofuels, CTL, etc, etc). The EIA tracks that in Table 1.1, and here is the plateau in that:
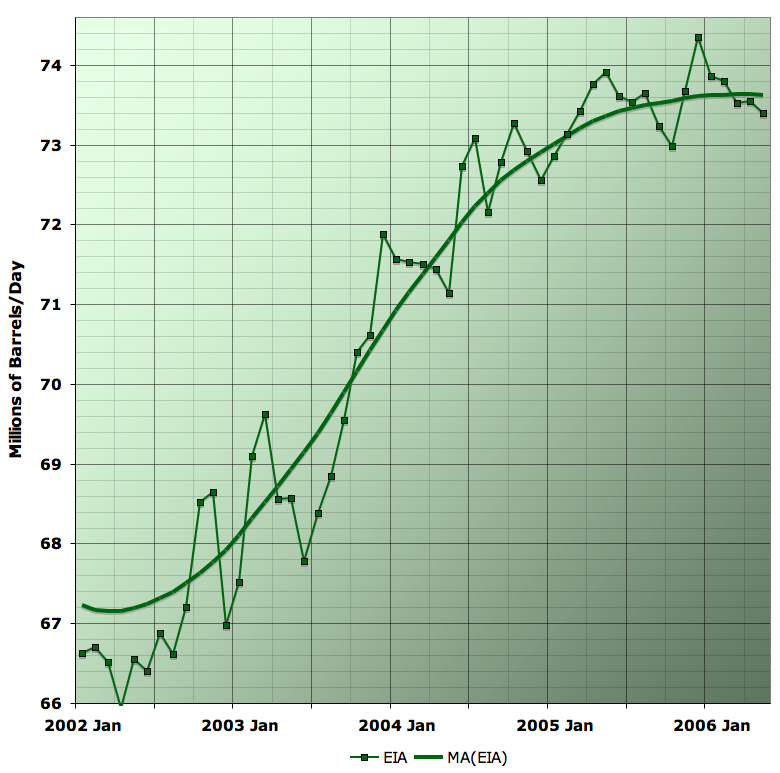
As you can see, the basic plateau shape is just the same.
See here, for more background on these plateau posts if you haven't been following them.
Contact
- Content: editors at theoildrum dot com
- Tech support: support at theoildrum dot com
License

This work is licensed under a Creative Commons Attribution-Share Alike 3.0 United States License.
The US has grow quite vibrantly since 2003. However we are not consuming as much petroleum as we were last year. This is unusual for the US. Although, gasoline consumption has grown, it's just that consumption of other products has diminished.
Another way of saying this, is that the US is getting less of the market share of oil production. I expect this trend to continue (other nations may adjust their currency in order to make it continue). When global oil production tilts downward, then the US will be getting a declining share of a declining resource. A double whammy that will undoubtedly make a lot of people angry.
If you are using GDP growth for the basis of the above quote, the discrepancy you note could be due inflation is not being adequately accounted for in the governments GDP numbers. If increasing GDP is primarily due to inflation instead of increasing national output the decreasing or flat petroleum usage makes sense.
Gasp are you saying the US goverment may be hiding real inflation numbers from the public while the Feds continue to raise rates ?
And a lot of companies still have not passed down high fuel costs yet once they have to it will be a perfect storm.
When I consider inflation and GDP numbers I see in my mind a bunch of gov't guys telling me "You want the truth? You can't handle the truth."
Alternatively, if you want the truth, assume the opposite of what most government officials are telling us.
Right now our collective response seems like an ostrich responding to Chicken Little with its head in the sand:
"Ain't no sky falling down here!"
Have you seen the cover story from todays "USA Today"?:
What's the real federal deficit?
Rob Portman, director of the Office of Management and Budget, presents "The Mid-Year Budget Review" at the National Press Club on July 11. Due to increased tax receipts, the Bush administration says it's goal of cutting the federal deficit in half by 2009 is a year ahead of schedule. But deficit numbers vary depending on who's counting.
By Dennis Cauchon, USA TODAY
The federal government keeps two sets of books.
The set the government promotes to the public has a healthier bottom line: a $318 billion deficit in 2005.
The set the government doesn't talk about is the audited financial statement produced by the government's accountants following standard accounting rules. It reports a more ominous financial picture: a $760 billion deficit for 2005. If Social Security and Medicare were included -- as the board that sets accounting rules is considering -- the federal deficit would have been $3.5 trillion.
Congress has written its own accounting rules -- which would be illegal for a corporation to use because they ignore important costs such as the growing expense of retirement benefits for civil servants and military personnel.
Last year, the audited statement produced by the accountants said the government ran a deficit equal to $6,700 for every American household. The number given to the public put the deficit at $2,800 per household.
Read more about it here.
http://www.usatoday.com/news/washington/2006-08-02-deficit-usat_x.htm
Looks like those bogus government numbers are starting to get a bit more scrutiny.
Grow up.
People who look at unemployment generally double the gov't figures.
The same kind of tricks are used for exports, and all kinds of things. It's a HUGE shell game and this is fairly mainstream knowledge. You have to pretend it's all legit to get a job in the US media, and you have to sound like you accept it all at face value to get various "selling" jobs where you're convincing people to give you your life savings to throw away in the stock market, but most people know much about our economy is hallucinated.
Take "Productivity" for instance. Amazing things are called "productivity" including, or should I say especially, exporting US jobs.
And here's where Kunstler is dead right, the current "booming" economy is based on the real estate bubble. Building sprawl. Building statues! More statues! Bigger statues! Jobs for all! Making the stone tools and the people who get that red rock for the top of the head, and the people who keep the grass trimmed around the statues, etc. You get the idea. A huge proportion of US jobs depend on those McMansions, and even more jobs, like nail salons and the Olive Garden, depend on people feeling "spendy" because their McMansion appreciated this year. And car sales are very much driven by "home" sales, look at all the ads on TV for trucks, showing someone loading lumber because they're gonna get some work done on the house, yep.
The gov't's job, almost, is to keep the people from freaking out, and try to make the coming Depression more of a slide than a crash. Like in The Matrix, can't break the illusion too abrubtly (sp?), it could be fatal.
The problem is clinical not factual.
I always considered them smart.
Try "shadow government statistics" in google and see what pops us. You need to quit drinking the kool aid mate.
The monthly NFP stats are hugely skewed by the CES Net Birth/Death Model:
http://www.bls.gov/web/cesbd.htm
While I think that such a model is probably reasonable and necessary it is based on GDP estimates...
Which are probably overstated by about 3% since these are based on the 'GDP deflator' - a measure of inflation - which seriously understates 'real' inflation and inflation as measured 20 years ago.
Had you noticed that the US GDP estimates for the last few years have been revised downwards by a pretty uniform 0.5% because some basic assumptions have been somewhat incorrect? The news was about a week ago, I don't have a link but might be able to find some.
Have you properly read John Williams 'shadow government statistics' stuff? the arguments are quite compelling, here are links:
http://www.shadowstats.com/cgi-bin/sgs
http://www.financialsense.com/editorials/williams_j/main.html
If there are any aspects in the above you find questionable and want substantiating data and links ask and I will see what I can do.
(I have an extant response to you on climate change in the works but incomplete, might manage to finish tonight but Sunday is more likely)
I sincerely regret not continuing this debate with you but after 20 yrs of listening to too many nuts i just have run out of patience. Absolutely no reflection on yourself. Take care.
I'm no novice at statistics, though no expert at the esoteric mathematical nuances of statistical theory. That the BLS and other govt / official stats producers have changed the basis of calculating several important economic measures over the last 20 years is very evident - and they admit it.
There are some valid logical arguments for the changes made but they seem to be more dictated by govt 'self interest' to me. The currently 'preferred' US measures of unemployment, inflation, GDP are significantly different from the way they were calculated 20 years ago and the way European countries calculate them. On the 'old US' or 'European' basis the numbers would probably be about: 8% unemployment, +1% GDP for Q1+Q2 2006 together annualised (+0.0% Q2 alone), +5.5% CPI.
Replied on rapid climate change:
http://www.theoildrum.com/comments/2006/7/28/19350/1306/169#169
My favorite, though, is Bob's Furniture, or as I call them, Bob's Chinese Furniture. Are they nationwide? I'm thinking so... But they are the low price leaders with their "no-name" brands. The latest adds on the TV are saying "buy now, before the prices go up due to higher energy costs".
I've set aside a flyer from my local grocery chain and put a date on it. It may be quite interesting to compare it with a current one in a few months. Try it, amaze your friends...
Higher energy prices will indeed tend to push up furniture prices, of course, but barring some economic catastrophe, they're likely overplaying it by a fair amount.
Tracking that actual food prices is a much more useful exercise, in my opinion, as it's real data, not advertising claims.
My wife usually does the shopping so I had stayed a bit insulated. But shopping at Walmart the other day, it was very clear that there has been a significant "up tick." (I seem to recall paying about $5 per four-pack of shaving blades a year or so ago -- now it's $9!)
Must be all of them doomers stocking up on essential shaving supplies. ;-)
We now know for a fact that Cantrell is going to tank over the second half of this year and next year. Ghawar is very very suspicious with just Cantrell going its enough to send us into terminal decline much less other factors.
Can any one take the mega projects stuff and add in only Cantrell decline at various rates that should be enough to send us over the edge.
Where is the miracle ? I think its time to start focusing on decline rates not peak.
Algeria: 400 kpd
Iraq: 500 kpd
Kuwait: 230 kpd
Nigeria: 1.1 mpd
Saudi Arabia: 1.5 mpd
Venezuela: 1.5 mpd
Angola: 470 kpd
Argentina: 100 kpd
Aruba: 122 kpd
Brazil: 150 kpd
Canada: 2.1 mpd
Chad: 100 kpd
Columbia: 200 kpd
Ecuador: 300 kpd
Gabon: 125 kpd
Mexico: 1.6 mpd
Netherlands: 150 kpd
Norway: 230 kpd
Russia: 400 kpd
Trinidad: 100 kpd
UK: 400 kpd
Virgin Islands: 300 kpd
The major importers are Canada, Venezuela, Mexico, Saudi Arabia, and Nigeria, all more than 1 mpd for a total of about 8 mpd or 66% of our imports.
Canada relies far too much on oil sands which are not sustainable given that they constantly need so much NG and that will turn out to be a major problem in the Americas if not the greatest problem. Much less in the future; less than 1 mpd(?).
Venezuela has pledged to stop selling us oil if we attack Iran which seems very likely. Even without an Iranian invasion, they are still attempting to move their markets to Chindia for political reasons. Zero oil in the future.
Nigeria will continue to suffer from major disruptions due to MEND and other groups of the sort. Only expect it to get much much worse as prices rise and the population becomes even poorer and much more desperate. Lucky if we get anything for a significant amount of time after 2010.
Saudi Arabia is a time bomb. If Ghawar, Abqaiq and Safaniya don't go under within the next decade naturally, then they will artificially as the region either explodes in war or SA is overrun by millions of unemployed youths. 0 barrels per day.
Mexico...Cantarell. None.
Those 8 mpd turns into just over 1, maybe 2 mpd, thus a loss of 6 mpd, at least. The other 4 mpd are from almost all from very poor African, Middle Eastern, Asian or American nations that aren't too fond of the US especially when PO hits. Maybe half a million barrels per day. So that gives the US 2.5 mpd. We have 7.5 mpd now and are suffering from 2% depletion. The depletion rate will climb much higher as Gulf oil peaks in 2010-2012. But even at 2%, the US will be down to 6.1 mpd in 10 short years, a decline of 1.4 mpd. In 10 years, the US may only have access to ~8.6 mpd of oil when demand is more than 24 mpd (guessing in the dark)...When's the next boat ride out of here?
Very gloomy mathematics. Makes me feel pretty unconfortable here in Europe as well. Russia doesn't seem to me very reliable in the long and as well medium run.
Middle East - Similar problem to Russia but add in India for a three-way. Couple that with increasing numbers of religious nuts who want big bombs. I'll pass again
Venezuela - Close enough to the US, and small enough not to put up much of a fight, that if we enter a world where TSHTF, Venezuela is likely to be annexed. PS the Canadians will probably be an equally attractive 51st or 52nd state.
Personally, I'm thinking the US is still in the top 3 places to be next to Australia and Canada. We do have coal reserves to buy a little more time and are on the lower half of the population density list. Plus, If/when the US goes imperial on the world, I'd much rather be a citizen of Rome, than a corpse in one of the tribute states.
Besides Don, why would you want to leave Colorado? You are sitting on the biggest well kept oil secret in the world.
Why not some place like Tahiti? Once the honeymoon industry goes away, it would be quiet, and maybe I could become a member of a cargo cult.
When you post numbers like xxx mpd, are you saying mbpd? (million barrels per day). or are you trying to say,
xxx thousand (what ever) per day)?
Kpd= thousand(s) barrels per day
I thought this was pretty common? I've only seen the 'b' placed in their if it is less than 1,000 (bpd).
So far it is not anything like PO.com. We try to minimize ad hominem attacks, pointless diversions like pop culture and polarizing fights about religion, sex, and politics. The average IQ of TOD posters is at least 20 points higher than the present masses at PO.com. The very small resident population of trolls and pathologically narcissistic personalities is actively discouraged and thankfully not growing. In short, this is a much better neighbourhood. Very glad to see your thoughful analysis showing up here.
I would gladly read Freddy or Sailorman anytime. Others may disagree with these two, but there are still more who find them entertaining. I'd rather drink bleach than have to sit through another un-capitalized sentence of yours. Especially one without a period!
This was simply vicious. Cease and desist. Or, as the UN says,"there will be dire consequences."
Oh. And thanks for the laugh. This was actually one of the funniest posts I've seen all day. Can't tell you why yet. I may never. But the reason will be apparent soon enough.
Do I smell some jealousy, Oil CEO?
Just because you are jealous not to be included?
(just kidding oily - you guys should put your penis back in and zip uop - if you didn't attach your ego to your alias you would be offended and bicker less often).
I feel pretty stupid for not having found it before... and discussing in the past that it probably didn't exist. I apologize to those who were misled by me.
Note how Crude seems to be the real driver of the plateau.
Also interesting is the smaller impact the September 2005 Hurricanes have on Crude production.
The lower blue lines are crude + condensate only. I subtracted out tar-sands as well.
The second graph just displays 13-month centered averages so you can see the divergence over the last ten years. I also raised the blue line by a uniform amount along the whole series to emphasize divergence.
Why did you substract the tar sands?
What are you calling "Non-Conventional Oil"? It appears to be about 4 mb/d, where does that come from.
How much of this is included in the EIA's Crude + Condensate.
I was under the impression, and still am, that crude oil is crude oil, regardless of its source. When crude oil peaks then that will be the peak, or perhaps more correctly, was the peak.
I believe if you can distill it into gasoline, diesel, and other refinery products then it should be counted. If it comes out of a corn field or must be contained in a pressurized bottle then it is not oil and should not be counted. But breaking it up into deep water oil and tar sands oil just adds unnecessary confusion to the mix.
All crude oil is crude oil and everything else is something else.
"All crude oil is crude oil and everything else is something else." Hahaha, that's what I though, too. What's condensate, then? Of course, I know now. As Axl Rose once said,"Welcome to the jungle."
Thanks for pointing that out. I have to revisit that issue when I update this and look at the tar-sands factor which Darwinian brought up. Probably this weekend. I'll run some analysis on the numbers themselves so we can filter-out visual influence.
Where were you guys when I posted these the first time?
It was actually Freddy, I believe, who remarked on the trendlines the first time around.
I will email my excel spreadsheets to anyone who wants them. I've spent a lot of time on getting the data into a shape that can be worked with. I'm all about open source. I just don't always have the time (or the ideas) necessary to work this stuff the way it needs to be.
In my opinion, the reason that we can compare various regions to each other using Hubbert Linearization (HL) is that we consistently find the big fields first. Once the big fields roll over and decline, trying to reverse the decline is like trying hold back an avalanche.
http://www.grinzo.com/energy/blog_entry_archive/2006/08/2006x08x03_2.html
I do it cuz i need an accurate base year(s) for projections of the Depletion Scenarios. We continually go back three years and six quarters and three months upon the biannual revisions. But GIGO prevails if one relaxes...
Of course we do have the problems in Nigeria and Iraq but there has never been a period in history where there was no political problems causing some shutdown in the world. What we have now is probably far less than what one would normally expect. And anyway, it is unlikely that the situation in either Iraq or Nigeria will get any better any way soon. Did you catch the general talking to Congress today? It is likely that we will have an all out civil war in Iraq. And we already have an all out Civil war in Nigeria.
Basically it is currently corresponding to our theory that we are at or very near peak.
In previous plateau's we knew there was enough oil to be extracted in the fullness of time. That is not at all clear today.
be the result of the much more rapid decile of Cantarell and the reductions in production in SA, probably as a result of water problems in Ghawar. Time will tell on SA but I for one do not believe they would be reducing production, in the face of the present markets, voluntarily. it completely goes against the " Yamani" mentality which has guided their policy on production for the last 35 years. These two declines could be offsetting the deep water gains that are supposed to be driving us to 90 by 2010. Of course we also need to discuss whether GTL can really ramp up as fast as indicated as well.
I think the deep water gains and other alternative resources like oil sands etc are only maybe enough to offset depletion excluding the mega fields. I don't see how we can handle Cantrell much less decline in Ghawar or any of the other big fields.
Again its time to assume were pretty much maxed out worldwide and start working on decline rates. Best case the max is 86mbd
where just quibbling over the details now what the real peak is. From now on out lest see if there is a consensus on decline rates I see numbers all over the map from reputable sources. And I haven't seen any real refutation of the super straw theory. Sure your recovery may go up to some extent which causes a delay but I see serious cliffs in production from advanced methods that seem to cause serious decline rate once they set in. Since were basically at peak now advanced recovery will keep the plateau for a while but I still see a cliff.
When you have field decline rates of 8-15% and a few of the big ones going down wiping out new production gains its hard to see why we won't see and overall decline rates of at least 5-8% and that seems to be generous.
What I see is a initial slow decline till Cantrell is toast say 2008 Ghawar has to be having problems at this point then a cliff till demand destruction ( a lot of dead people )
gets us back to a smaller decline rate of say 3-5% a year.
Say about 2010. At this point I think we will see demand destruction ( steady population decreases ) match decline rates.
So the big demand destruction ( I love that word ) seems to be about 2010 2011.
Looks like Bush started working on demand destruction a bit early but thats probably a result of a twist of fate that American elections come at the wrong time I bet he is miffed.
There is no way that shale oil will make anything other than a negiable contribution to supply.
This chart shows price and supply on a time scale. I adjusted the scales to bring the curves into alignment and as you can see they are beginning to diverge significantly (again, I know this isn't high math).
From trough to peak (1970 to 1980): nominal oil prices went up by about 1,000%.
From 1972 to 1982, number of producing wells increased by 14%.
From 1972 to 1982, production fell by about 30%.
Based on the HL method, Saudi Arabia, in 2005, was at (as a percentage of Qt) where Texas was at, in 1972. We are seeing the same kind of price/production divergence now with Saudi Arabia.
Production Data: http://www.rrc.state.tx.us/divisions/og/statistics/production/ogisopwc.html
A. As supply growth slows, the price will increase until demand destruction restores the balance.
B. In the face of slowing supply growth due to a global production plateau, the cost (to the consumer) of adding additional capacity will grow exponentially until market forces make it impossible to grow further.
They both say the same thing, but in two slightly different ways that reflect differently on the nature of the problem.
When oil production starts to fall my guess would be that prices will continue to rise - at that point your dots will head for the top left corner of the price - supply chart. I wonder if there are not signs of that already in the data?
So, yes, there the elephants may be peaking, and yes that may result in some near term leveling off in global production over the next few years. But a true geological peak in a Hubbertian sense is not here now or in the near term. What we are seeing is a lot of military fog interfereing with petroleum production and the start of some countries (like Russia and Kuwait, according to recent news noted here by Leannan) hoarding their production.
Bottom line in my view:
+ the oil supply world is tight mainly due to military issues.
+ a geological "Peak" is still years off
+ the visibility of a global Hubbertian Peak sometime within then next decade is spawning a trend toward hoarding that is exacertabing the supply shortage
+ for all these reasons, prices will probably continue to trend higher UNLESS PEACE BREAKS OUT.
+ all this massaging of production data is interesting but only an academic exercise. To the extent it is taken to indicate a Hubbertian Peak it is misunderstood.
"But a true geological peak in a Hubbertian sense is not here now or in the near term."
CERA:
"Rather than a 'peak,' we should expect an 'undulating plateau' perhaps three or four decades from now."
Mr. Robert Esser
Senior Consultant and Director, Global Oil and Gas Resources
Cambridge Energy Research Associates
EXXONMOBIL:
"Contrary to the theory, oil production shows no signs of a peak... Oil is a finite resource, but because it is so incredibly large, a peak will not occur this year, next year, or for decades to come."
ExxonMobil Advertisement in New York Times, June 2, 2006
OPEC:
We in Opec do not subscribe to the peak-oil theory.
Acting Secretary General of Opec, Mohammed Barkindo
July 11, 2006
www.mg.co.za
Brown/Khebab:
"In summary, based on the HL method and based on our historical models, we believe that Saudi Arabia and the world are now on the verge of irreversible declines in conventional oil production."
May 25, 2006
http://www.energybulletin.net/16459.html
As well, all your positive quotes are speaking of "all liquids" whereas your negative comment is based on conventional data.
I don't think anyone in this forum disagrees that a conventional peak occured between 2004 & 2006. Please don't mix apples and oranges.
I would have preferred to use just crude + condensate for the world plot, but the only data base that Khebab had handy was the BP data base.
BTW, in regard to the accuracy of the method, post-1970 cumulative Lower 48 production was 99% of what the HL method predicted, using only production data through 1970 to generate the predicted post-1970 cumulative production.
Depletion rate(t)= K*Q(t)/URR
so the logistic-based depletion rate is not a constant and is in fact dynamic.
http://www.angelfire.com/planet/peakypie/
I still laugh every time I go to that thing. Excellent work.
Perhaps u can decipher where the differences have their basis:

Those who followed Stuart's linearise this sereis of a few weeks back, and Daves follow up post may recall that no conclusion was reached but certain key observations were made:
EOR - the effect of EOR (horizontal wells) seems to be to skew the Hubbert Peak so that peak is reached after 50% of the way throgh URR, but this is followed by more rapid decline. So decline rates are slower to start with because you produce dry oil for longer but then the decline rate accelerates as the water hits the whole productive interval of your well all at once.
HL - the geologists among the TOD contributors recognise that HL only works in a dynamic equilibrium situation of "business as usual". I guess the HL addicts believe that the World is so big that nothing man can do will alter this dynamic but that simply isn't true. The little kick up in the last 3 years of JL's World all liquids chart is caused by the oil industry going out a drilling till they drop, basically doing everything they can to maintain and increase production - but in the absence of new discoveries this does not impact URR. DuncanK has now posted several times what I consider a key HL for Yibal (he has posted this again further down this page). This shows a dog leg in the HL caused by man intervening and drilling lots of horizontal wells followed by a production crash. The key observation here was that drilling the horizontal wells did not alter the URR. The kick up in JL's chart pointing at URR of 3000 may be followed by a turn down that will point at 2250.
ME OPEC - if you look at the HLs for KSA, Kuwait and Iran, they all show this flattening as shown above, and these countries are probably the main contributors to flattening on JL's chart.
MEGA PROJECTS - in a small post below this thread (but posted several hours before it) I point out that Skrebowski has 3.4 mbd new production pencilled in for 2006. This for me is the real world, many of these projects in the Caspian Sea etc are tangible and major amounts of new oil comming to market. The key to understadning if peak has been reached or not is finding out how much of this new oil is already on the market (included in Stuart's figures) and how much is in the pipeline. As indicated below the only two fields I know about are Buzzard (not on yet) and Chinguetti (came on earlier this year). If 7/12ths of 3.4 mbd is already on then you know that capacity erosion is running at same pace as new capacity - we are on a plateau that will shortly turn down. If less than 7/12ths is on and there is a huge chunk of new production bearing down on the market then expect production to rise above 85 mbd later this year. If more than 7/12ths is already on then capacity erosion is running well ahead of new capacity then expect production to turn sharply lower - and run for the hills.
Dave has posted the link to Skrebowski's latest review http://sydneypeakoil.com/downloads/PR_APR06_Megaprojects.pdf - if anyone knows the status of the 28 new field developments pencilled for 2006 then please say so. For example is Thunderhorse up and running - that's 250,000 bpd new production - it makes a big difference whether or not that oil is already on the market. Given the platform's problems last year I would be amazed if it were up and running.
The list is as follows:
AOR - E delta (Nigeria)
Asab upgarding (Abu Dhabi)
Bu Hasa (Abu Dhabi)
Darkovin phase 2 (Iran)
Dolphin, Al Khalij (Qatar)
EA (Nigeria)
Erha (Nigeria)
Ghawar Haradha (KSA)
In Amenas (Algeria)
NEB Ph1 (Abu Dhabi)
South Pars (Iran?)
ACG ph2 (Azerbaijan)
Albacora Leste (Brazil)
Atlantic (USA)
Benguela- Belize (Angola)
Buzzard (UK)
Cachalote (Brazil)
Chinguetti (Mauritania)
Dalia (Angola)
Enfield (Australia)
Foster Creek (Canada, tar?)
Golfinho (Brazil)
Jubarte (Brazil)
Surmont (Canada, tar by sagd)
Syncrude (Canda, tar by mining)
Tengiz/Kololev (Kazahkstan)
Thunder Horse (USA)
Upper Salym (Russia?)
In total 3.4 mmbd - is this bearing down on the market or not? The majority are operated by western companies so it shoud be fairly straight forward to find out what is going on. I'm away this weekend but will research this and post next week. But if anyone has first hand knowledge of any of these projects please post info.
THIS IS THE REAL WORLD
Neo Wolf
Frantic drilling over the past 3 years:
- HAS increased production
- HAS NOT - made any major new discoveries
- HAS NOT - made any significant change to recovery factor
Therefore, activity of last 3 years HAS NOT increased URR. This is a perfect illustration of the caution required in using HL . I think it is a great technique but needs to be interpretted with reference to the real world.All that is happening is companies are getting at the remaing oil faster. In other words the industry is running up a gentle slope and is about to fall off the cliff at the top.
Neo Wolf
PS energy used to get at this last oil is increasing all the time.
This does not logically follow. URR can be increased in an existing field, without a new discovery. URR is a function of both what is in the ground and what portion of that is economically feasible to recover. As price rises, URR should increase.
IMO, the only reasonable plot of this data set is the middle case, which derives about the same Qt that Khebab and Stuart came up with. Are there fluctuations above and below the "glideslope?" Yes. Whether one use crude + condensate or total liquids, the HL plots show that the world is right at about 50% of conventional URR, and recent EIA data show that world oil production is trending down.
I first become of aware of the HL technique when I read Deffeyes' second book. I did some research and came up with the pre-1935 Texas production data and then generated a HL plot of Texas production. I believe that Stuart's first essay on Hubbert Linearization (the one where I think he coined the term) used my Texas HL plot as an example. In any case, this exercise convinced me of the accuracy of the method. BTW, my HL estimate and Khebab's estimate of Texas Qt's were within 5% of each other.
It is becoming increasingly aware to me that, despite your loud protests about the certainty of your conclusions, you have simply not done your homework. Which is fine, we still (so far) have some degree of freedom of speech.
I do take exception to your continued personal attacks on gentlemen like Deffeyes and Simmons. You continue to refer to Deffeyes' many failed predictions. As I have pointed out before, Deffeyes has been very consistent regarding his mathematical models--that the peak was between 2004 and 2008, most likely around the end of 2005. In 2003, he made an observation that he may have been wrong, and that the peak was in 2000. An observation made after the fact cannot be construed to be a prediction.
Below is a post you made on 7/31/06, in which you refer to Deffeyes and Simmons as "Sleazebags both." I have met both of these two gentlemen. I have reviewed their work in considerable detail, and in my opinion you have libeled both of them. Do you wish to retract your statement?
Freddy:
[new] Freddy Hutter on Monday July 31, 2006 at 1:50 AM EST
Apparently u and greyzone know about as much about the pope's pre-omipotent days as y'all do about deffeyes seven predictions and all his backpeddalling. They guy is on the book ciruit and looks only for notoriety. Simmons $200 public bet for $5k is of the same ilk. Sleazebags both. And we see the have any easy time attracting koolaid drinkers here at TOD.
- he applied the logistic modeling on synfuel (oil from tar sands) whereas only a few years of significant production has been observed. Consequently, the extrapolation based on the logistic curve may be way too optimistic.
- Because production from tar sands are heavily constrained by economic conditions and infrastructure investment, the growth rate for tar sands will be very modest compared to the growth rate for NGL. In that case, can we apply the Hubbert modeling on oil from tar sands production?
- Because production from tar sands are heavily constrained by economic conditions and infrastructure investment, the growth rate for tar sands will be very modest compared to the growth rate for NGL. In that case, can we apply the Hubbert modeling on oil from tar sands production?
Besides, his last URR estimate at 3Tb is based on only 2 or three years.Because it is not arbitrary, it is the decline rate that is predicted by the HL method. I obtained the same results from my own HL analysis. To plot any other decline rate would be to total ignore the obvious trend in the data. You just can't wish for more palatable numbers, no matter how hard you want them to be true.
The long term (net) decline rate was for Texas 4.1%, but it varied quite a bit from year to year.
In 2005, SA was at the same stage of depletion, based on the HL method, that Texas was at in 1972, when we peaked. Since December, Saudi oil production is down--just like Texas.
The quantitative support for proximity to the peak is the HL plot of world oil production. The world is at about the same point at which the Lower 48 peaked, and world oil production is down since December.
OK, now what? Two questions.
When in human history did PEACE BREAK OUT?
Why are Kuwait, etc acting like oil is finite? Clearly because it is and because they see steadily rising prices as a result, thus making it more profitable for Kuwait, etc to limit production. There is no argument here.
Finally, when was there peace in the world? Dunno and don't expect it to happen soon.
You need to be familiar with that database.
Megaprojects Database (small pdf file).
You can believe me when I say that even if I put some lost production back onstream, the new stuff won't be coming from Iraq and only a relatively small amount would come from Nigeria (see the database). If you're going to argue here, know the data. And -- this is for everybody -- Forget Iraq. Just wipe it out of your mind. Civil War. Chaos. Damaged Oil Fields. Blown Up Pipelines. Massive casualties. A Failed State.
In other words, Hell.
== Dave Cohen
Be all that as it may, the question we were discussing (I believe) is not really whether Peak will come in '08 or '10 at 90 or at 92 or 94 mbpd. It was simply whether the charts of production of all liquids over the past two or so years that have been the focus of this discussion can be taken to indicate a peaking of production in the Hubbertian sense of geological imperative. It seems to me they can not because a central assumption of Hubbert was that a given field or country of fields would be exploited as rapidly as technology would allow. Clearly, when one looks at such major oil producing countries as Iraq, Nigeria, and Venezuela, one cannot say that is the case. By a longshot. Therefore, I simply am observing that the production charts prove nothing about a peak, in a Hubbertian sense. They cannot guarantee that production could not spring back to higher levels if all of a sudden Iraq, Nigeria, and Venezuela began to be exploited the way the U.S. is and has been.
To say that "there's always something" also proves nothing except to suggest that it is not possible to apply Hubbert's work to the entire globe. There is no sense in anaylzing HL or global production data points if the assumption of maximum exploitation efforts being applied to all fields is not valid. Therefore, it may not be possible to apply Hubbertian analysis to the real world unless you exempt certain very significant countries from your analysis by making the simplifying assumption that their production, which is inhibited by warfare and/or mismanagement, will remain around the present level. I doubt M. King would find that sort of assumption consistent with his thinking.
All of which is not to say that the global production charts are not interesting. They are. To me, they suggest that supplies are very tight. If the elephants begin to decline at rates significantly higher than Skrebowski assumes and/or the projects he lists are delayed, these charts suggest there may not be a lot of room for additional global production. But they don't say a damn thing about what Hubbert was talking about.
Surmont for example is listed at 100 in 2006 but production for 2006 is listed as 27 kbpd "bitumen" with greater production through 2012 from resources being evaluated (not even under construction)
Thunder Horse is still in 2006 but the latest news I've seen pushes it's repair into early 2007.
I think it's safe to say slippage is build into this list.
No. In a civil war, oil fields are a natural target. And I don't believe in miracles. In the NY Times, we read that US generals testified before congress that Iraq was falling into civil war. Screed?
During previous oil shocks (Iranian revolution, Iran/Iraq War, Gulf War I), additional production was able to be quickly brought online (within a few months) by the Saudi's, acting as swing producer, bringing supply/price relief to world markets. This time there does not appear to be any spare capacity available from the swing producer which adds further credibility to the argument that production has peaked, and that this is a geological peak.
The tendency for national oil producers to hold back supply in the face of production slowdowns and high prices will probably exacerbate the world overall decline rate once all the big 4 oil fields have rolled over.
http://www.eia.doe.gov/emeu/ipsr/t11a.xls
And check how much Iraq is down since the year 2000, and how much Nigeria is down since their 2005 average, their highest production ever, you get a combined total of -925,000 bp/d. Just a tad over half your estimate.
So to do it properly, you might study events like the Iranian issue in the late 70's. You can see the effect of a gap between demand and supply which was around 4% I believe. So if we project forward from now and say that in theory over 3 years demand would grow 4% but supply will be flat then prices will have to soar in a similar manner. It's not perfect but it is better than ignoring the demand side I think.
The mathematician might try to build an ansatz, most simply:
Price = A * Shortfall + B
and then try to figure out A and B by looking at the historical behaviour of the Oil Price. It's a toughy.
Thanks.
The only fields I know about are Buzzard (North Sea) which is not on yet (still bolting the platform together) and Chinguetti (Mauritania) which came on earlier this year but with flow rates well below forecast.
1) Global refining capacity is not currently a limiting factor, in which case the chart looks like a possible Hubbert's peak for what can be pumped out of the ground.
2) Global refining capacity is currently a limiting factor, in which case the chart might merely show the need to build more refineries so the world can merrily swing back up off the plateau.
Would someone please point out the flaw in this reasoning?
The peak is upon us, and the oil companies had a good idea it would come and didn't build many more plants. (Conspiracy..blah)
I have to think that if they were that smart, why didn't they start building more Heavy Sour refineries a few years ago.
Bah...I am sure there is a conspiracy idea about that too.
==========It's all about population!
I can definitely see an oil company questioning long term profitability of a proposed refinery on the basis of whether affordable feedstock will be available. They could even come to this conclusion without realizing the broader implications of peak oil.
Never underestimate the ability of the human mind to not see the forest for the trees...
But I still find is hard to believe that they wouldn't have planned a little better on the heavy sour side, if they knew what was coming.
=========It's all about population!
If it was truly refining capacity then you would see demand for refined products outstripping supply and a widening gap between the price of crude and that of the products. Crude would be relatively cheap while gasoline for example was expensive. Plus there should be some shortages or very low numbers in refined products.
Looking at US refinery capacity is a red herring to some extent since we import a significant amount of refined products and have for some time. There is no reason to build in the US if its cheaper to import. Also if its lack of capacity say for heavy sour again you would see deep discounts there. And the spot market for refined products world wide would be skyrocketing agian this is not happening.
It certainly does look like refiners at least have bought into peak oil in a big way and don't see any reason to increase capacity.
Finally I don't see it as a big conspiracy since who benefits from explaining to the world that were running out of oil ? It's not productive for the establishment.
Also it should be understood that if you have a gaussian data set from 1906 to 2106, with mean on 2006, and stddev=50, then the timespan when production is 98% of peak or more, covers 20 years - the plateau. With the jitter we have in the 'real' data, the plateau might last even longer.
Dave
www.peakoil.org.au
Tony
Does the fact that growth of refinery capacity has slowed in recent years prove that significant new refinery capacity won't be built in the future (perhaps for reasons we can't appreciate now)?
I can think of a couple of scenarios:
1) For strategic reasons, China starts massively building up its own refining capacity as they appear to be planning to do.
2) New refinery technologies emerge (e.g., to handle heavy / sour crude) and they have the effect of increasing overall refining capacity rather than displacing existing refineries.
Can we really interpret your chart with respect to these refinery capacity issues except through the proverbial rear-view mirror?
For China there growing of course but also Daqing is declining most probably I can't find info on its oil quality which is weird but there is no mention that its heavy sour which is normal if a field has low quality so we assume its reasonable.
This means China has to build out support for heavy sour.
New refineries are needed because I suspect the original ones are not positioned for imports.
Throught asia its true that they need more refining capacity for heavy sour oils but this just means a peak of light sweet which seems to be the consensus for a while.
Now thats just China doing two things they have massive demand growth and two preparing to import heavy sour oils as there own internal fields deplete no magic there.
The US despite talk to the contrary already has significant heavy sour capacity and there is not a big reason to build more if its felt heavy sour will itself peak and the spread between it and light will decrease with time.
The only thing amiss is the Asian countries seem to have not done enough work to develop heavy sour refining capacity if you assume peak oil.
I guess I don't see that your statements mean playing devils advocate.
As far as new refining technologies I don't see any chance of a breakthrough catalyst that would be incompatible with your with existing refineries.
A explanation for the current refinery situation.
To reply to my own post I do see a fairly big fight on who get stuck with refineries for SA heavy sour that they won't discount.
http://business.timesonline.co.uk/article/0,,9072-1782657,00.html
We know this that no one wants to build them.
And it looks like Saudia Arabia lost and got stuck with building the refinery themselves.
http://in.news.yahoo.com/060521/137/64ez3.html
So there not going to get there margin on heavy sour but are going to have to eat the refinery costs themselves.
If there is any conspiracy it was that SA did not win the
refinery war for junk oil. I suspect the US was happy with close Canadian oil sands.
China on the other hand lost and has to build the refineries
http://www.marketwatch.com/News/Story/Story.aspx?guid=%7BBF8FB491-0426-4715-9C3A-EA70916870B6%7D& ;siteid=google
I think these events explain today's tight refining capacity again assuming that the refiners don't expect production to increase or better they expect it to fall.
So the one place we have a surplus SA heavy sour will be handled via refineries in SA for export to the west and increased Chinese refining capacity plus in the US re targeting current refineries that use Cantrell oil.
See problem solved and SA got stuck with the cost of refineries. The only assumption is refineries are peak oil aware or that some other economic reason caused them to take
actions that amounted to the same thing. They certianly know about Canterll and we just add there confident that SA can't
expand its heavy oil output. Without and obvious new source coming on line there response would be the same as if they were looking at a overall peak situation.
Venezuela is the odd man out here but do you think China really wants to depend on oil coming from so close to the US. I mean they can say what they want but strategically Venezuela is stuck with the US. Sure China will play SA against Venezuela for oil but realistically if things get nasty I can't see China wanting a significant amount of its imports coming from a place so close to the US.
To be even more sinister consider that the US may actually want its potential enemies to become dependent on Venezuela oil gives us a lot of leverage. I'm sure the neocons are getting quite the cackle out of China/Venezuela if Venezuela starts selling oil to North Korea they would probably cre..
ther pants since we basically controll if anyone gets access.
In reality, Campbell-ASPO, Koppelaar, Skrebowski & IEA have released Outlooks this past half-year showing refining capacity and resultant production will approximate 11.7-mbd over the next five years. There is no fricken peak. They are just navel gazing again. The curve is up on IEA cuz it includes updates for May and an estimate for June. EIA does not yet incorporate June. When it does, this thread will head to the trash like all others before it.
2005 was no more a peak than many of their same declarations in Y2K, 2001, 2002, 2003 & 2004.
When and if Stuart commences using the most accurate data, quarterly production, 'cuz its revised indefinitely, i am confident a truer illustration will present itself for all.
Exports from Mexico will probably fall. In the 14 largest exporters, domestic growth grew much faster than importing countries. Therefore a peak in exportable oil may precede any "peak" by years. Nobody know the price at which demand destruction occurs, but it doesn't seem likely to have been reached (subjective reasoning here). There is also a peak for light sweet that is relevant to areas of transportation where substitutes for oil are scarce. the dollar is down 36% in 4 years, the twin deficits make the future dark there also. Although you could draw a winner on the river, I'll place my bets long on oil.
If there really was a refining bottle-neck limiting crude oil purchases, the price multiple between crude oil and refined products ($/bbl refined fuel = multiple * $/bbl crude oil) would rise. (This happens with petrochemicals all the time -- when a fire or even a planned shutdown at a plant increases the price of the oil derivative.)
We certainly have not seen this with refined fuels lately. If anything, last I checked the price multiple was dropping.
Stuart - a little request. Could you not use photos as the background to the graphs? When I am using a slow link, they take forever to load.
The green shaded background seems to be fine - those images are fairly compact and load fairly quickly.
My best fit is a very slow downward trend that is not probably statistically significant.
If you look at the crude oil production for Dec 2005 - May 2006 you get an average of 73.563 mbd and a standard deviation 0.364 mbd - that is flatter than any pancake I make. This may be a better indication of plateau than "all liquids".
(Freddy wants to continue revising the IEA monthly figures based on the quarterly totals, but that involves more guesswork than I'm comfortable with). If you want to know what the quarterly graph looks like, the IEA themselves show this:
as you can see, the picture is not materially different from what the monthly graph shows - it's very slowly creeping up (but EIA disagrees, and if you average the two together, the upward trend pretty much disappears). In any case, any trend is not very material relative to the typical fluctuations. What really matters is what KSA and Russian production is about to do.
I am of the overall conclusion (however helpful in raising consciousness of our risks), the political issues would be the driving factor to price.
A most interesting subject to me is "peak profits" which would make a good graph. Oil exports now are making a HUGE increase in profits. Since it takes time to figure out how to spend those new profits, I imagine a prudent producer might actually want to lower production to moderate immediate income, and "bank" reserves on the assumption of continued even higher prices later.
Anyway, I wonder if you took the oil production graphs (past and future extrapolations) and multiplied them by oil prices, and then tried to predict when "peak gross profits" will occur.
Obviously we're in exponential growth of profits now, and this growth would likely continue into either a plateau or slow decline in production, since prices will keep rising.
It is ironic - if prices go too high and cause a recession, which could drop demand and cause oil prices to plummet, and oil exporters in need of their income will want to flood the market with more oil to compensate for lower prices, which will lower prices more. So the sooner they get "addicted" to this new income level the more trouble they'll be in when demand drops.
Oh, well, I'm not smart enough to imagine how it'll all happen, except to know getting used to high income you can't control is trouble!
BTW, my screen name comes from Twilight in the Desert, in which Mathew Simmons comments, "the simple notion that oil is 'just another commodity' is an absurd fantasy promulgated by self-aggrandizing traders!"
First of all, I would like to point out that the, "absurd fantasy" of treating oil as, "just another commodity," has served us self-aggrandized traders pretty well for the last 50 years or so and continues to do so to this day.
As traders go, I am a chartist, meaning that I pretty much ignore the news (Iraq war, Nigeria, peak oil, etc.) and just watch the charts. In fact, over the years I have found that the worst trap a trader can fall into (and the best way to lose a lot of money real fast) is to pay too much attention to what's happening in the news. In the end, I have found, the news just doesn't seem to matter all that much. The charts always seem to win out. My motto has always been, "The charts know everything."
On the other hand, the physical reality of peak oil, as described so well by Mathew Simmons, as well as by many contributors to The Oil Drum, is a fact that is hard to ignore, even by a hardened, cocky, self-aggrandized trader.
Lately, I have found myself wondering if, at some point, peak oil might just win out. It's a scary thought. There's a lot of money riding on this (and some of its even mine!)
But for now, I stand by my charts. Watch and weep: Oil will pull back to the high 50's by mid-november. This fairly rapid pullback (which, by the way, will occur regarless of insignificant, "news," i.e. pipeline explosions, hurricanes, Iran war, etc.) will be followed by a resumption of the long term bull market for oil and other commodities which will last for approximately another decade.
I'm a cocky bastard and as I write this I feel like that big buck standing out in the field, everyone's taking shots at him but he just won't go down. On the other hand, if peak oil really is at hand, I might end of looking more like a deer in the headlights.
It'll be a cold night on Wall Street if you people are right.
Thats quite a bold statement! Are you sure? or pretty sure?
Is this based on "all things being equal" concept, barring any significant changes. Like, umm, maybe Oil being traded for Euros exclusively, or a decline in world oil production?
In a way, believing the charts is the opposite of being cocky. It's a way of admitting that all of the information available regarding oil prices (much of it contradictory) is too much for the human mind to process.
Welcome to TOD. My problem with your statement is that you've simply asserted it with no justification. If you can do so without giving away trade secrets, please provide a rationale for your pricing position.
== Dave
I tend to agree that everything you need to know about the underlying is built into its price action as reflected on a chart, which allows you to be dispassionate when it comes to making trading decisions, and that technical analysis (tape reading) can help give you an edge if applied correctly. However trading is still a probabilities game, as no one can foretell the future (beyond a few seconds), so you still have to have a get out plan in case your analysis goes pear-shaped.
A sample analysis:
http://www.gold-eagle.com/editorials_05/rosen070206.html
What technical indicator do you favor? I'm not a trader, just trying to observe all aspects of this historical event.
All comments based on HL method:
The Lower 48 and the North Sea peaked in the vicinity of 50% of Qt.
Russia peaked at 50%, centered in a decade long plateau.
Mexico just hit 50%, based on Khebab's HL plot, and Mexico is now declining.
The world hit 50% in late 2005, based on Deffeyes plot, and world oil production is now declining (EIA).
Saudi Arabia is at the same stage of depletion at which the prior swing producer, Texas, peaked, and Saudi production is down since December.
It's a very likely that the world's four largest producing oil fields are all now declining. We know Cantarell, the second largest, is crashing.
Based on a 2004 list of top exporters, seven of the top ten oil exporters are showing lower production since December.
I suggest that you buy some long johns.
Regardless of my continued faith in my charts (what choice do I have?), I was spooked by the Simmons book to the point that I can now quote most of it from memory.
There is something that's been bothering me that maybe you (or someelse) could clear up. Simmons seems to hint on several occassions that he feels that Ghawar could just as easily be considered 5 separate oilfields: Ain dar, Shedgum, Uthmaniyah, Hawiyah, and Haradh. Each of these, he estimates, currently produces about 1 million barrels of oil per day. What effect might the fact that Ghawar may well be 5 oilfields instead of 1 have on peak and depletion in Saudi Arabia?
I'm not an expert on Saudi Arabia (although I did play one on PBS), but it is my understanding that there are five separate structures that have been so charged with oil that they more or less merged into one productive complex.
I think that the original Original Oil In Place (OOIP) estimate for Ghawar was about 172 Gb. The field has probably made about 60 Gb, or 35% of OOIP. According to Simmons, the world record recovery factor for this type of reservoir is 45%. A roughly analogous field, Yibal, was making 90% water at 42% of OOIP. Shell was gearing up their surface facilities at Yibal to handle an expected flood of new oil, just as Yibal started crashing--when the water hit the horizontal wells.
At Ghawar, the remaining oil is between an advancing water leg and an emerging secondary gas cap. The permeability to water and to gas is higher than to oil. In other words, it is very easy for the water and gas to bypass the oil.
This is the key point: going forward, Saudi Aramco can have higher production rates or higher remaining recovery rates--but not both.
The Cantarell Field has similar reservoir characteristics, and it is now crashing. All we know for sure regarding Saudi Arabia is that their production is down about 7% since last year. They claim that it is voluntary. I have my doubts.
Wait your saying Ghawar is way past 50% of total URR ?
35% of OOIP
mac 45% of OOIP
leaves only 10% left to recover.
How does this compart to estimates I've seen of 48-53% URR ?
Something seems wrong with your comment.
Hmm and its only because of advanced methods that there keeping the flow rates up I assume.
I mean that fits basically there extracting Ghawar the same way they extract offshore. High flow rates fairly low water cut right to the end. That lends credence to my thought that you would have a slowly decreasing plateau followed by a steep crash in production. I think assuming 70-80 style of slowly increasing water cut and declining production is probably not applicable to today's fields. The next question is has it been shown that advanced methods result in significantly better recovery ? I've not seen evidence of this.
I read this its pretty good
http://www.npd.no/npd.no/Templates/Report/ReportPage.aspx?NRMODE=Published&NRORIGINALURL=%2fEngl ish%2fEmner%2fRessursforvaltning%2fRessursregnskap_og_-analyse%2fRessursrapport_2005%2fress-rapp-05- 4%2ehtm&NRNODEGUID=%7b0285CF68-E5BC-4D10-B6B4-E2BF711D714B%7d&NRCACHEHINT=ModifyGuest#4.2_Wh y_do_we_not_recover_100_per_cent_of_the_oil_
Its pretty good the best possible seems to be 70%
That's fine but what is the recovery rate past say 40%
I suspect it drops significantly with the last percentages taking quite a while to recover. The steep declines of the
North Sea fields seems to indicate that increased recovery really does not help maintain flow rates and the new methods simply cause a massive drop in flow rates followed by a longer term low flow rate recovery via advanced methods.
So again a cliff.
Can experts here discuss flow rates even at the well level for advaced recovery methods assuming the latest in water cutoff technology ?
And what is the percentage of oil being recovered today via advanced wells vs simple wells ?
Ghawar for example seems to have a significant number. I suspect most of the rework done in the last 20 years used advanced methods ?
So will there be a cliff ?
In the introduction to the paperback, under the subheading Seeking the Future, Simmons talks about how so far (since the original publication of the hardcover), "the Saudis have continued to deliver the goods," raising their oil production by 1.5 million barrels a day to 9.5 million.
In the next paragraph he states that, "The Petroleum Ministry now openly admits that 800,000 barrels a day of this new capacity are needed to replace declines now under way in mature fields. This seems to imply that total Saudi production is declining by only 2 percent per year..."
Is this a typo? Isn't 800,000 barrels a day more like 9%? In a country which produces 9.5 million?
Care to make a side bet on that one? say a quart of the 12 year old bio-fuel of your choice against one of mine? :)
"Oil will pull back to the high 50's by mid-november"
The only way I can forsee this Nov. price is if a hell of a recession/depression gets started now from the current price of approx. $75/barrel.
12 year old liquor is remarkably tasty, but I would prefer to go with volume, say a couple of cases of premium beer. It also will allow you to shout out 'Peakoil' a lot more often as each bottle reaches half-empty.
Bob Shaw in Phx,AZ Are Humans Smarter than Yeast?
I figure this is my chance since there is no local distributor for Royal Lochnagar Single Malt 12 year old around here that I can find anymore, but I hear tell it is still available in most of the US.
I did have a very fine bottle of their Select Reserve at one time but the last of it went on Y2K new years. That was the last time I thought the world was about to end, and there are very few things more worth doing at a time like that...
They only sell 3,000 bottles of that per year globally, I hate to think what it costs now.
Ssshhh! TOP SECRET!
Peak Scotch? Now that is the end of our world if the only place you can get it is "AREA 51" in NEVADA, LOL!
http://www.scotchwhisky.net/malt/royal_lochnagar.htm
http://www.tastings.com/area51/merchants/1999_07/scotch.html
^^^^^^
^^^
---------------------
83 - Royal Lochnagar 12 Year Old Single Highland Malt Scotch Whisky, Scotland $38/750 ml. MARKETED BY: Schieffelin and Somerset Co., 2 Park Avenue / 17th Floor, NY, US, 10016. Telephone: 212-251-8337. Fax: 212-251-8383.
----------------------
Bob Shaw in Phx,AZ Are Humans Smarter than Yeast?
OK, but for us to stand by your charts then we need to see them.
Here are a couple for you to look at.
First, this is the plot of long term oil prices (3-5 year) from 1990-2005:
Are you telling us that the growth at the end of this chart is merely a blip on an otherwise flat and boring strainght line? Do you think there may be some other dealers out there that have a more pessimistic view of the future than you? Can you match the total amount of money that is tied up in those future prices?
Here's another graph. It's the Hubbert Linearisation of the Yibal field production:
Are you sure that the major oil fields around the world that supply almost 10% of our daily oil are not at the same place that Yibal was at in 1998? With Ghawar at 78% of it's URR, this sort of collapse looks like a distinct possibility to me.
Good luck with your investments. But I hope your eggs are in several baskets!
All the technicians and technical traders have been dead wrong about oil prices. Hell even the fundamentalists have been wrong when they paid too much attention to the inventory numbers. Only the traders who are in tune with peak oil, like T. Boone Pickens, have been right.
The charts don't know crap. Oil will not be in the high 50's by mid November. The high seventies or eighties are far more likely.
Darwinian - I would not argue with charts, but I would argue with the interpretation of the charts... "a Peak shrouded in mist" indeed.
What charts would these be? To me this graph from Stuart is particularly compelling.
The two previous production declines were preceded by price decreases. Now there is every incentive in the world for producers to produce more if they had the capacity to do so.
It looks to me like current Oil prices have destroyed around 2-3 mbd of demand that would have existed at $30 per barrel. SA promised to bring around 1 mbd online by now but instead their oil output is decreasing.
It looks pretty ominous to me. You may well lose a fair bit on money on your low bet.
You people have me all wrong. I think Mathew Simmons is a genius. And I think he'll go down in history as having really blown the whistle on this thing, as well as Collin Campbell and the others. They've done a real service. And i'm probably one of the few traders who would say this.
My point is that, until now at least, oil is still, "just another commodity." Your oil price chart is a good example, DuncanK. Superimpose a copper price chart, an aluminum price chart, a gold price chart, or just about any other commodity for that matter over the same time period and you'll see that they've all moved in tandem. But are we approaching peak copper? Are we approaching peak gold?
Five or six years ago, a new commodities bull market began. This bull market will probably last 15 to 20 years. All (or most, at least) commodities will move consistantly higher over this period, with periodic sharp pullbacks. However, we are not reaching "peaks" for most of these commodities. They are simply in a bull market and, thus, prices will tend to increase.
Mathew Simmons states that, "the idea that oil is just another commidity is an absurd fantasy of self-aggrandizing traders!" That's fine, but up until August of 2006 at least, including oil's big gains of the last 4 or 5 years, including the, "peaking" of oil in 2005, or the "plateauing" of oil production over the last year or so according to Stuart's charts, oil has behaved EXACTLY like, "just another commodity." Commodities of all kinds have moved up pretty much in lock step. So, while peak oil arguments are, from my point of view, impossible to ignore, we have not yet reached that moment when oil stops acting like, "just another commodity."
Between now and mid november, copper will decline, alluminum will decline, gold will decline, and, yes, oil will decline right along with them. That's the way I read things anyway. We are about to experience one of the, "periodic sharp pullbacks" typical of all bull markets. I have seen NOTHING so far that indicates that oil is acting as anything other than, "just another commodity."
Unlike most traders, I think at some point it will.
Makes sense. This is your field. We'll see what happens.
BTW, I just saw a headline on Yahoo News, "Rice Signals Possible Lebanon Compromise." I didn't read the article, but I can already guess what the compromise is: Israel gets half of Lebanon, the Lebanese get to keep the other half.
Glad to see your postings, and glad to see you give credit to Hubbert, Simmons, and others.
I agree with your assessment that all commodities are in a long bull market upswing, but their higher prices are energetically driven in excess of normal demand--a supplier's market.
Consider the energy inputs to mine metals. For example: in the olden days, the first gold miners easily retrieved large nuggets by hand from the stream outside Sutter's Mill in California. Not so now when the typical mining equation is applying gobs and gobs of energy to process tons and tons of rocks/Oz. of gold. Same for most other metals as ore quality has declined over the years. It is only natural to take the easy pickings first.
So not only metals are affected, but food, water, electricity, and virtually anything else that requires significant energetic inputs. When nearly everyone lived on a farm: pork bellies were just a short walk away. Now 99% of Americans have no idea just how committed a pig is to our morning breakfast, but we spend vast sums of money and energy to bring the bacon home.
In short, just as nature intended: a cheetah has to run like hell to catch a gazelle.
The further the population grows, and energy scarcity of all kinds continues: the required $ per [energy per capita] grows ever larger forcing the cheetah to run ever harder and longer to try and catch the gazelle [the other commodities]. 6.5 billion others are chasing the same dream too. Many are unfortunately coming up empty after the exhausting chase. That is why I believe fossils fuels are not just another commodity. When the cheetah is expending more energy than the harvest provides--game over. Such is life in the detritus driven extrasomatic ecosystem-- some detritovores win, but others lose.
Now I will grant you that there is probably some speculative excess going on in the commodities market, but it will be extremely difficult to determine the required degree of the periodic pricing pullbacks to purge this excess. Fat and happy, but slow cheetahs are generally killed by lions--again just as nature intended. But a fossil fuels pullback under $50/barrel by mid-Nov. would seem to require the demand destruction of a lot of obese cheetahs-- and they are very hard to catch nowadays, especially blazing down the freeway to work in their SUVs munching down on bacon and egg burritos.
Bob Shaw in Phx,AZ Are Humans Smarter than Yeast?
In the beginning, the park began with 2400 gazelles and just one cheetah. Unfortunately, the gazelles don't seem to breed but the cheetahs do. The cheetah started to chase gazelles and eat them. Obviously, it started with chasing the old, sick and obese gazelles. One result of the availability of large quantities of food was that the cheetah population grew.
Right now, the gazelle population is down to 1200, and the cheetah population is up to 6.6 and growing. The estimated amount of gazelles killed every year is 30. According to the statistics, there is still enough food for the cheetahs for 40 years (1200/30=40). But there is a problem. The remaining gazelles are ever harder to catch. It is even possible that some will cost more energy then they will provide.
Breeding???
The only way I see the cost of all of the items you list above going down is if the value of what they are traded for , US$$, increases.
The only way the value of the US$ increases is with continued increases in Fed interest rates in combination with a decline in M3.
Given the state of the US's finances and the growth of future obligations currently unbudgeted, do you think it is likely the Fed will continue raising interest rates and enter a long period of money supply discipline?
I'm not arguing with you but trying to flesh out what I think is very important macro question.
Regards
What you suggest is politically unpalatable. It won't happen. The Fed HAS to inflate. They have no choice. When you spend future $$$ now, the only hope is to minimize those obligations in the future through productivity growth and/or inflation.
With the productivity growth of the last 100 years being largely attributable to energy growth, and future energy growth unlikely, that leaves us with inflation.
I don't discount a recession/depression causing deflation, but Bernanke himself has espoused the mataphorical dropping of cash from helicopters.
Got gold?
Garth
Gold is up 18% since Bernanke took over. The market doesn't seem to be showing a lot of faith in Bernanke's inflation fighting abilities.
What's M3 running at lately?
Too embarrassing, I guess.
Like I said, I'd like to hear more from you. It's just that you're charging pretty hard off the mark here.
What exactly are you trying to say? Take more than a few sentences to elaborate. I don't want any credentials. Not necessary. Just tell me your favorite book(s)- the morethe better. What is the best book to read about oil? Let us get to know you.
We like charts. Show us some. That would be cool.
But we like crystal-balls better.
But that is a tough question - "Why don't you own the world?" Real philosophical-like. Hope I'm not messing with your game.
If I had a chart with real predictive power, I would be a billionaire by now. But I don't and I'm not, and I suspect neither is SelfAggrandizedTrader.
Now, this is anything but the first commodities bull market and anything but the first equities bear market, so how have these types of markets behaved in the past? Well, in a long term bull market, such as the current commodities bull market, we tend to see generally rising prices accompanied by periodic sharp pullbacks. The pullbacks tend to last several months. Another thing to keep in mind, contrary to popular belief, during sharp equity downturns, commodities (even gold) tend to move down in tandem. In other words, if equities are set to continue the current phase of their bear market, with heavy selling in September and October (or earlier), commodities will inevitably follow them down. If you look at the Nasdaq crash of 2000-2001, in many cases, commodities, especially gold, performed even worse during this period. There was no safe haven rush to gold.
Speaking of safe havens, the rush will be into treasuries. Whether the Fed will raise interest rates again or not is irrelevent. They've already raised them too far and soon enough will be lowering them again. The rush into treasuries will cause a continued increase in the value of the dollar versus other currencies (haven't read that in the MSM, have you?). Home prices, which, of course, are ridiculous, will finally begin their inevitable decline, now that inventories of unsold homes have risen to record levels. All of this will be extremely deflationary and recessionary. One can't overemphasize the impact a falling real estate market (which dwarfs the equities market), and a rising treasuries market (which also dwarfs the equities market) will have on stock prices.
The pullback in equities, which began several months ago, will soon accelerate. Commodities have yet to follow, which only means that when they do, the declines will be even more abrupt, since they will have to fall a greater distance in a shorter amount of time. Short selling by energy and other commodities executives is extremely high right now. Think they know something we don't? The only people buying are the least informed. More money has poured into energy funds in the last few years than in the previous twenty. The insiders are rarely wrong and the uninformed masses rarely make money in the stock market.
All of this is merely my opinion and, no, i'm not a billionaire.
- a collapsing US equity market
- a collapsing US housing market
- and a declining Federal funds rate
will cause the world to rush to the US Treasury market and give us a strengthening dollar?and the resultant dollar strength will be a drag on commodity prices.
It will be interesting in any event.
I appreciate your thoughts and hope I did not mischaracterize them in my summary.
Regards
Here is a link to an interesting article on copper: http://www.nwanews.com/adg/Business/149207/
As this article describes, copper has behaved just like oil for the last few years. In other words, there has been a massive run up in the price of copper due to rising demand and a leveling off of supply. Have we reached peak copper? Or is the supply plateau the result of a lack of investment due to the low prices in the decade of the 90's?
and the price rise of some commodities is hastened by supply/demand fundamentals you mention.
Time will tell.
I've done a little research on this subject through my investigations on long term Uranium prospects. Copper exists at an average abundance of 55 PPM in the Earth's crust. In total this amounts to 1000 trillion tonnes. To date we've mined around 400 million tonnes of Copper in total. This is less than 1 millionth of the total available.
Compare this to Oil where we've used appproximately half of our total endourment. Clearly something quite different. If KSA really could have ramped production this year I'd believe a 2010 peak.
My bet is that traders representing Real Customers will snap up any softness in the market and stuff it into strategic reserves.
Well time will tell.
And i'm not just talking about the price chart, which in both cases shows a sharp increase.
I'm also talking about Stuart's supply chart. You could make a very similar chart for copper supply which would also show a plateau. Yet, as you point out, this won't be a final plateau for copper, I haven't met anyone who thinks that it will, soon copper supply will begin to increase again and reach new heights.
The reason I find Simmons' comment about, "self-aggrandizing traders" so interesting is that, until now, while the supply chart seems to indicate a plateau, oil HAS NOT behaved any differently from any other commodity. Other commodities also show sharply increasing prices, other commodities also show plateaus in supply, and these other commodities are NOT PEAKING.
Some might read into this that oil isn't peaking either. As long as oil continues to behave, "just like another commodity," it's hard for me to conclude that we've reached a peak. When will we begin to see the divergence between oil and other commodities that Simmons implies? It hasn't happened yet.
I think we will see the divergence as an increasing percentage of the market realizes there is a supply constraint associated with oil that other commodities lack.
If copper is $x per pound now and oil doubles in price, do you seriously think copper can stay at $x per pound?
Energy is different than all other commodities because everything else depends on energy. Think back on your high school physics. No work can be done without energy. If the cost of energy rises, then the cost of everything rises in some relationship to energy because the cost of the work necessary rises directly to the cost of the energy. (I refer to the physical work, i.e. the energy necessary to manipulate matter to achieve the desired end state.)
I assert that the commodity Mark has got Oil wrong.
Some hypothesize this, but IANAFG...
This is kind of like Bertrand Russells parable about the turkey who got fed by the farmer every day. The turkey therefore came to the conclusion that the farmer showing up meant food.
That worked out fine until the day the farmer came by with an axe.
Even Bertrand Russell would admit that the pig was right 99 times out of a hundred.
I'll take a pattern over a theory any day.
With Peak Energy comes Peak Matter - so say good bye to your paper funny money and say hello to tangibles and hyperinflation (not this year, but later, after this brief corretion to signal the start of The New Greatest Depression).
Recommended reading: The Penniless Billionaires.
If I were not convinced that we are past the peak of world oil production, I would be advising everyone to sell energy stocks and energy assets. However, I think that the craziness has only begun. If Matt Simmons is right about oil prices--and I think that he is--in 2010, a 17 BOPD oil well will be generating about one million dollars per year in net cash flow.
(1) Chesapeake Energy paid the DFW Airport $10,000 per acre and a quarter royalty for an oil and gas lease covering 18,000 acres, in the Barnett Shale Play.
(2) From the 8/4/06 WSJ: "As Oil Prices Rise, Investors Pour Into Risky Energy Plays"
Excerpt:
Barry Kostiner traded electricity and natural gas for eight years on Wall Street. Last fall, he reinvented himself--as a Texas Oilman.
With no assets beyond plans to buy oil and gas fields, he set up shop as Platinum Energy Resources, Inc. He had never worked in the oil industry or managed a company. Yet he carried out an initial public offering of stock and within two months persuaded several New York hedge funds to buy a large chunk of the shares, raising $115 million in all.
I suspect the oil and commodities will behavior during this Grandest of Bull Markets to "rhyme" with the commodities bull market (gold in particular) of the 1970's.
When I see things like the examples you gave above, or a recent Money.com article titled, "Why Oil Will Never Go Below $60 Again," or the Chicago Tribune piece everyone was talking about a few days ago, it makes me want to run for the exits.
The media is beginning to give us the big flashing, "Sell Energy!" signal (in the form of overly positive articles telling us to, "buy energy!") just like they gave us the big flashing, "Sell Tech!" signal (in the form of overly positive articles telling us to , "buy tech!"). As far as investing is concerned, the media is always wrong. They say buy when they should be saying sell, they say sell when they should be saying buy. Doing the exact opposite of what the media says is one of the best ways to make money.
Another comparison, during the last two years of the 90's, people plowed more money into technology shares than in the previous twenty combined. The same thing has happened with energy within the last two years. And these are the least informed investors. The insiders are selling.
I know your focus isn't on investing, it's on peak oil. And when I read Mathew Simmons' book, or much of what is written on TOD, it's hard for me to argue. It all seems very well thought out and very convincing. The problem is, during the late 90's, people had a lot of very well thought out and very convincing arguments in favor of the, "new technology paradigm." And we all know how that ended. It turned out to be, "groupthink" at its worst.
I find myself wondering if the, "new energy paradigm" isn't just another mass exercise in groupthink, or if, as they always say, "this time it really is different."
During the height of the tech bubble, most people argued that returning to 200 day averages was a thing of the past, but tech stocks eventually returned to their 200 day averages and then some. People are now arguing that oil prices will never return to their 200 day averages, from here on out its just up, up, up, but I think oil will return to its 200 day average and then some.
$57, mid november, even if oil production peaked in December 2005.
What blew me away about the Chesapeake story was the bonus. I think that the record for any lease I have taken in my little corner of the oil patch was $100 per acre. (Parenthetical comment for anyone interested in directly investing in US oil and gas ventures; for 99.9% of you, my advice is don't do it. Buy stock instead.)
I realize that the most dangerous words in the world are "It's different this time," but--risking the wrath of the gods--worldwide Peak Oil is different. IMO, the big problem that we are going to face this year is a net export crisis, as exports are squeezed from two directions, by rising consumption in the exporting countries and by falling production. Seven of the top ten net oil exporters are showing lower production so far this year versus December--led by Saudi Arabia and Russia.
Going forward, IMO, true capital is going to be measured in terms of BTU's. The Fed can inflate the money supply from here to the moon, but that will not create a single BTU of energy.
http://www.energybulletin.net/news.php?author=jeffrey+brown&keywords=&cat=0&action=searc h
In other words during the run up of the last 3 or 4 years, an oil price chart looks just like a copper price chart, looks just like an aluminum price chart, looks just like a gold price chart, looks just like a corn price chart. All commodities have risen in tandem.
Also, a supply price chart for oil, with its production plateau, looks very similar to a supply price chart for copper, even though copper is not peaking.
Given the fact that oil has risen in tandem with other commodities, and that other non-peaking commodities show similar production charts to oil, I feel reasonably comfortable predicting that oil will also decline along with other commodities.
Doesn't the fact that oil is still behaving pretty much, "just like another commodity" strike you, especially if, as many people seem to believe, production has already peaked? Are the markets really that ignorant?
Consider Texas in 1972. We were at peak production--King of the oil world. In 1967, during the 1967 Arab/Israeli War, the Arabs tried an embargo--which failed because Texas flooded the market.
From 1972 to 1980, oil prices went up by 1,000%.
Texas responded with the biggest drilling boom in state history, and by 1982 we had increased the number of producing wells by 14%.
What was the supply response?
Production fell by about 30% by 1982.
The oil price spike from 1972 to 1980 was temporary, because there was a falloff in demand and an increase in supply.
If Texas were the sole source of crude oil for the world, for every four gallons of gasoline that we bought in 1972, we would not be bidding against each other for one gallon today.
My point is that Saudi Arabia and the world are now where Texas and the Lower 48 were at in the early Seventies. In other words, we are not going to see a conventional supply response. The question is how fast alternative and unconventional sources of liquid fuels can be brought on line. IMO, they will only serve to slow the rate of decline of total liquids production. For example, the current EIA data show that total Canadian crude + condensate production is down 11% since December.
The basic premise of your question is that there is always a supply response to a price spike. Our models suggest that is not true when conventional oil producing regions peak in the vicinity of 50% of Qt (URR).
http://www.energybulletin.net/18904.html
Middle East at a crossroads
August 4, 2006
by Richard Heinberg
Excerpt:
At the ASPO conference a well-connected industry insider who wishes not to be directly quoted told me that his own sources inside Saudi Arabia insist that production from Ghawar is now down to less than three million barrels per day, and that the Saudis are maintaining total production at only slowly dwindling levels by producing other fields at maximum rates. This, if true, would be a bombshell: most estimates give production from Ghawar at 5.5 Mb/d.
But is it really credible to think that Saudi Arabia could make up that enormous emount of oil (2.5 million barrels, more than almost any other country on earth produces) by pumping their other fields flat out?
I didn't get that impression by reading Twilight.
What do you think?
That's what is great about archives. And this nonsense has been going on for about six years.
That is indeed what is great about archives....anyone can go back and read your old posts to get a feel for just how much nonsense you spout.
<especially if, as many people seem to believe, production has already peaked? Are the markets really that ignorant?>
>
Do that many people that actively trade oil really believe we have reached a production peak?
I figure most traders are applying the commodities paradigm that has always worked well for them, as price rises, supply increases, which brings down price.
IMHO, If an increasing percentage of people that trade oil begin doing so with the belief that we are at a production peak ,,the price will signal it quickly.
Now specifically, you wrote:
I've been thinking about this. The markets as a rule tend to believe what companies tell them. When BHP-Billiton says, "we plan to increase copper production by 10% next year". They generally deliver. Furthermore their copper reserves are subject to independent audits etc.
The situation with Saudi Arabia is that every time in the past they've said "we will increase Oil Production", they have. However markets do not have access to independently audited Oil reserves of SA. This time they haven't been able to increase production and we still have no independently audited estimates of their reserves.
In addition there is no slack in the system. China continues to grow at 10% per annum. It's Oil demand growth is now greater than that of US.
Yes. The markets depend on Human Intelligence and most humans do not yet accept Peak Oil - this is our current Popular Delusion and it is reflected in the current Madness of Crowds
Trader - remember that the markets did not start trading Futures for Oil until 1983... well AFTER the oil shocks of the previous decade.
Sometimes Sap has to be smacked upside the head a few times before he wakes up. So much for the power of poliTICS etc.
The idea that oil spot price is tied to the physical commodity is also highly dubious. Enough to note that brent crude contract comprises 60% of the spot price formula. The same crude that constitutes less than 1% of the global supply. What's being traded in London (ICE) is "paper" oil, and if you don't think there's a speculative squeeze, just check out the price action for 2005/6 - volume and open interest (long bet) were at the all time high.
I also think it's misleading that people equate depletion of oil reserves with the impending energy crises. More energy in the U.S and elsewhere is generated through burning coal, natural gas and nuclear, and when oil becomes less economical it's likely the combination of these sources will pick up the slack. I hope no one suggests we're running out of coal (for electricity) So what does Peak Oil say? When oil reaches a certain price it will be cheaper to power our cars with natural gas or electricity from the grid?
As the serial recessions/Depression continues, it will be easier for people decrease material consumption but it will be far more difficult for people to decrease consumption of Energy.
I haven't read Simmon's book yet and am not familiar with his reasoning in this case - I'll have to look into it.
Thanks for putting this graph up regularly. But looking at the EIA raw figures, it looks like supply continues to outstrip demand. Do you have a corresponding graph for demand? I'd also like to understand why stocks don't seem to have risen in line with the surplus of supply over demand.
See http://www.eia.doe.gov/emeu/ipsr/t11a.xls
I would rather believe a George Bush speech on how the US is winning in Iraq.
Does any have an idea what the real figures are?
Also, what other fairy stories are burried in the EIA figures?
Hmm there seems to be a lot of holes in the story but Pemex is claiming that Cantrell decline will be reversed or slowed.
And that they can make up production.
http://today.reuters.com/news/articleinvesting.aspx?type=bondsNews&storyID=2006-08-04T000212Z_01 _N03388608_RTRIDST_0_ENERGY-MEXICO-UPDATE-3.XML&pageNumber=0&imageid=&cap=&sz=13& ;WTModLoc=InvArt-C1-ArticlePage3
So are we going to keep the plateau one more year ?
My opinion is way to many things would have to go right and nothing wrong for Pemex to pull this off.
So far Cantrell collapse looks like the front runner for pushing us past peak.
Comments ?
Thxs for posting this-- it is quite interesting. PEMEX is basically predicting that they can hold off cumulative depletion as their Cantarell big boy tanks, at least for a few more years [A big if]. Obviously, it will take big bucks and some luck. I wish I was more of a financial expert so I could analyze Pemex's finances in detail to tell you more about their realistic chances. Perhaps someone else with this expertise will jump in.
Bob Shaw in Phx,Az Are Humans Smarter than Yeast?
World supply is down about 1% in that frame, because Russia, Azerbaijan and Chad/Equatorial Guinea/Sudan between them only make up half of the supply lost from KSA, Nigeria, UK/Norway and US.
And what was before then, then?