IEA Supply Creeping Up
Posted by Stuart Staniford on July 27, 2006 - 2:40am
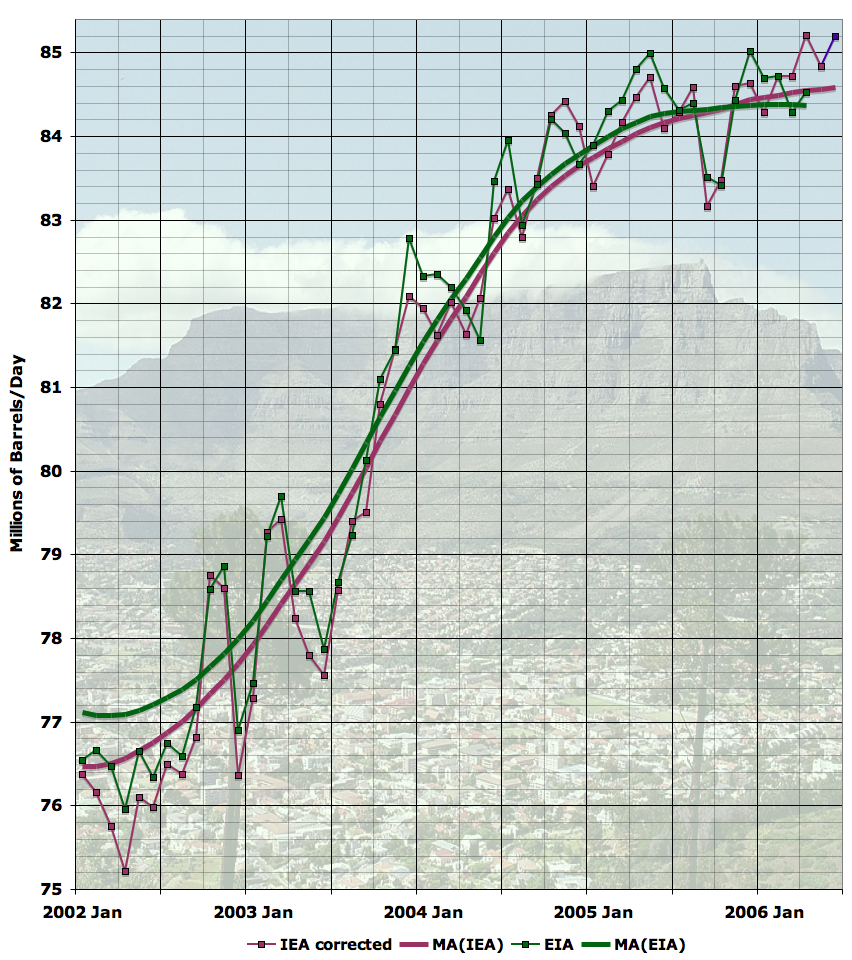
World oil supply in June gained 315 kb/d from May to average 85.2 mb/d. This was 715 kb/d higher than June 2005, with OECD production down by 620 kb/d, OPEC total oil supply up 225 kb/d, and non-OECD plus other supplies running 1.1 mb/d higher versus year-ago levels. Month-on-month gains in June came from the US GOM, Canada, Russia, Azerbaijan, China and Sudan, while North Sea maintenance trimmed European supply by 175 kb/d. OPEC crude supply was 200 kb/d higher than in May, largely due to renewed exports from northern Iraq.So a good month, they think. Also, in response to a suggestion from Freddy Hutter, I have reworked my methodology for taking the data from OMR's. Instead of extracting it from the summary the following month, I am now taking it from the Table 3 figure, three months after (or the last data given if not yet available). That has sharpened the sense of disagreement with the EIA. As you can see in the graph above, what the EIA sees as a clear plateau is to the IEA just a (sharp) slowdown in growth but not an actual flattening. IEA used to be significantly more pessimistic than EIA, but that gap steadily closed and has now crossed.
We can see the issue more sharply in this new graph, which shows the year-on-year percentage change in the recursed moving average for each data source:
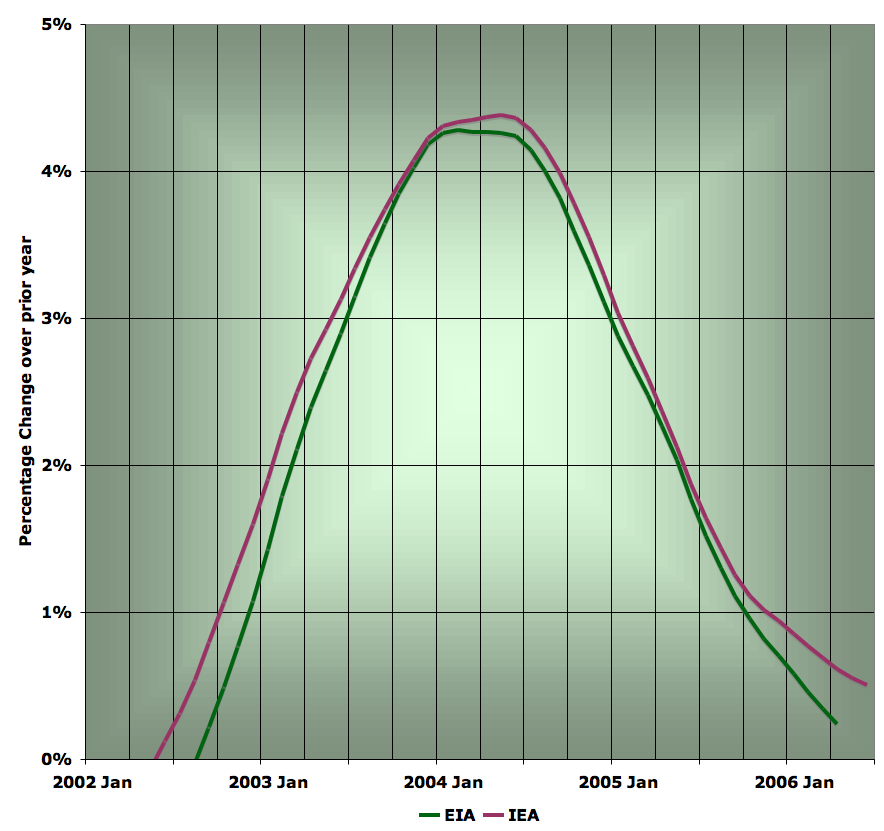
As you can see, the EIA line looks like it's headed determinedly to zero (ie moving averaged supply being dead flat for a year), while the IEA line is expressing an interest in perhaps flattening out to a small positive value (ie some small growth in supply). The IEA has seen faster growth at all points during these last four years - presumably this discrepancy cannot continue forever.
It will be interesting to see if the EIA, with their May initial estimate due in a few days, starts to confirm the high numbers the IEA is estimating for 2006 Q2. Of course, it's also worth bearing in mind that the picture could change in a hurry as we go into the active hurricane season, or if events in the Middle East continue to worsen and begin to affect oil production there more seriously.
On hurricanes, it's worth noting that so far this year we've only had tropical storm Alberto. By this point last year we'd had TS Arlene, TS Bret, H Cindy, H Dennis, H Emily, TS Franklin, and TS Gert. So a much slower start to the season. However, in 2004 there were no named storms by this date.
One other interesting point from the IEA OMR:
The biggest single change compared to last month’s Report is the inclusion of biofuel supply estimates for countries other than Brazil, the USA and Germany (for which a combined 500 kb/d-plus is already included in the OMR). Analysis undertaken for the MTOMR highlights global supply of ethanol and biodiesel, net of US/Brazil, rising from 22 kb/d in 2000 to 74 kb/d in 2004, 118 kb/d in 2005 and 154 kb/d in 2006. This includes estimated ethanol volumes by 2006 of 10 kb/d or more each in China, the EU, Thailand, India and Colombia. Global biodiesel supply rises from 15 kb/d in 2000 to 40 kb/d in 2004, 72 kb/d in 2005 and 84 kb/d in 2006. Production is centred in Germany (40 kb/d) and in France and the USA (with around 10 kb/d each).Biofuels seem to to be the component of the "alternative" fuels that can respond most rapidly to current high price incentives since the facilities are small and easier to capitalize, permit, and build quickly than, say, oil sands upgraders or CTL facilities. However, competition for land with ever increasing food demand will presumably limit the growth of biofuels at some point.
For those unfamiliar with this line of posts, please check the plateau background to get a better understanding.
Contact
- Content: editors at theoildrum dot com
- Tech support: support at theoildrum dot com
License

This work is licensed under a Creative Commons Attribution-Share Alike 3.0 United States License.
It seems to be going up a bit, even with these very high prices.
The other day, you suggested that hurricanes could not explain the plateau, but from your post today, I feel that you changed your mind a little bit. Is that fair to day?
How about the following explanation for the plateau:
- High prices cause demand to reduce
- Everybody not in the PO debate says that there is at least a 10$ offset for supply worries on the price
- With a short term elasticity of about 0.3, that would be about a demand reduction of 0.3*10/70, about 4-5%.
I know nobody wants to talk like this, but what do you say?At the ASPO-5 meeting there was a presentation by Andrew McKillop, in which he advanced the notion that the supply and demand numbers have been doctored. Mr Luca Barillo, an oil trader, concurred, during his presentation, as did one mutual fund manager in the audience with whom I took up this issue privately.
The claim is that increase of over 4 million barrels per day during 2003-2004 is the result of readjustment of the numbers, as the original numbers at the time did not reflect this large of an increase. Thus if the 2004 and 2005 numbers have been increased after the fact, then the increase during the latter part of 2005 and the first half of 2006 would appear slower than what is actually happening.
McKillop estimates that the increase in demand is around 2.4%or about 2 Mb/d, rather than the 1.3-1.7 percent traditionally assumed. Where does this extra come from? I talked with McKillop and our guess is that it comes from condensate and natural gas liquids, owing to the many natural gas projects which have been started.
From all we read in the papers, it certainly does not seem that demand slowed down over the last 12 months.
best, Seppo Korpela
P.S. My first post to Oil Drum
and welcome to TOD.
At ASPO-5 the Luca, the oil trader, mentioned that an increasingly non-commercial speculative component is now at play in the oil market, which is clear to those who keep a watch on the commercial and non-commercial parts of futures.
Colin Campbell stressed that the year when peak is reached, is immaterial, and we should be concentrating on how we cope after the peak. Jeremy Leggett also gave a great talk and said that we cannot afford to burn all the hydrocarbons, for that might trigger a runaway global warming.
Thanks for the welcome. I do not plan to post very often, as I am working to get my house into a shape which will withstand a cold winter without natural gas.
best, Seppo Korpela
Looking back, supply exceeded demand by 18 million barrels, during the first quarter, so stocks should have risen by that much. OECD stocks rose by 13 million barrels. In fact, supply has exceeded demand for every quarter in table 1, except the 1st quarter of 2005, even in the hurricane hit 3rd and 4th quarters. In 2005 overall, supply exceeded demand by 0.8 mbpd. So stocks should have risen by 292 million barrels. OECD stocks were only 79 million barrels higher at the end of that period.
It doesn't give me much confidence that these figures have any validity. With supply exceeding demand comfortably in the last quarter, prices should have fallen, possibly even with geopolitical factors. Indeed, given the oversupply for over a year, shouldn't prices be way down on their highs?
Americans show no signs of curtailing their appetite for gasoline. What many predicted was World War III has already faded to the point where everybody except Anderson Cooper(CNN) and Fox News have packed their bags and left the comfort of Beirut and Northern Israel.
The Levant
What happened guys? Oil is trading kind of low, given the circumstances. Everybody adjusting to a probable increase in supplies?
I wanna know. What happened to Bird Flu? What happened to Iran's nuclear program? What happened to Iraq? What happened to the Big-Dig? Is hot weather and reality-shows the answer to all our problems concerning what we should pay attention to?
They decided to have World War III, but no-one showed up? Why does that sound familiar?
Meanwhile, I've been reading about Rousseau, Catherine, and the Revolution in Iran.
We know we've hit peak when: our 13-month average drops by an average of 2% or more per month for twelve consecutive months.
I like that one, I'm already using that. Awaiting your counterproposal.
I don't think it will be easy to set criteria in advance. Eg, we might have ME oil shocks coming up before too long -- I'm not sure how long the Arab countries are going to stand for our resupplying Israel with the bombs used to maim the children that keep showing up on Arab TV every night -- and how will we distinguish the shock from the underlying trend? Or a housing crash led recession next year - we'll have to look at prices in an attempt to guesstimate how much of the supply change is due to falling demand, and how much to supply constraints.
I totally and completely take your caveats as legitimate. I'm proposing my measure in lieu of other factors, which I am confident enough to say won't be that important.
However, I am revising proposal. Point taken.
But give me some guidance. Should I go to 1.75 or to 2.25?
As a community, we are going to need to take the lead here. I propose this as our offensive strategy.
Lord Browne on Fox tonight (on Cavuto's show). Catch that? Seen BP ads lately? Did you catch subtleties in later parts of interview. HE DOESN'T CARE. And he knows the truth. He speaks the truth. He just doesn't care. It's so obvious. What am I missing? Oil CEO often asks this question, rarely getting an answer - WTF am I missing!
We need to take the offensive.
The definition is two consecutive years of 3% declines in production. In retrospect that may have been two strict - we could see something that historians would eventually recognize as a peak without seeing these kinds of declines until much later. Or it could be too weak - we could have a severe two-year recession/depression and have such declines, before bouncing back to higher production than ever. It's tough to come up with a clear definition. Like the fall of the roman empire, it's something that can really only be declared in hindsight.
See the claim at http://www.ideosphere.com/fx-bin/Claim?claim=pkyr20 . Trading prices predict a peak (as defined above) in 2010. (That is, 2011 production will be 3% less than 2010, and 2012 will be 3% less than 2011.)
(http://www.newsfutures.com/pdf/Does_money_matter.pdf provides evidence that play-money prediction markets can be as accurate as real-money ones.)
But now every nation is producing flat out, except perhaps for Nigeria and a few barrels in Iraq. But the point is a drop in production right now would be caused almost entirely by depletion, not by political reasons.
That is the difference Freddy.
Halfin, please take note of the following graph:
This is the month by month oil production for the lower 48 US from 1969 to 1973 (2 years pre-peak to 2 years post-peak). Note that it is very noisy. Note that it is very hard to distinguish the peak in there.
Now, here is another view for you to consider of the same 5 years. This makes it even more obvious how hard it is to spot peak on a month-by-month basis, which is why I call BS on Freddy Hutter's crowing about any single month's change. Actually seeing peak will only be possible by looking backwards. Any crowing now, either way, is just a guess.
Note that the YELLOW data set in the second graph is the peak YEAR but that the prior year actually had months above any of the peak year months.
Here's the CSV data for those five years using month-by-month production (in thousands of barrels) in case anyone wants to copy and paste just those 5 years. This data came from the EIA.
Year,Jan,Feb,Mar,Apr,May,Jun,Jul,Aug,Sep,Oct,Nov,Dec
1969,275528,249984,280705,277140,290036,288935,288145,281077,278850,285603,280380,295368
1970,293818,267960,294748,287730,295213,280770,285274,296360,295590,310403,301320,308264
1971,299305,272412,302808,293070,298995,288120,293121,291741,274050,284022,274170,282100
1972,282534,270744,293322,285390,298034,285660,294376,293973,285240,293930,282780,289385
1973,284454,263066,287430,278757,287134,276418,285731,284225,271959,285940,274829,280960
That is not to say that we are not in for more price shocks. I am almost convinced that the fear component is gone. But it has not been replaced by what i have called the depletion realization component. It's good ol'e supply and demand. A reflection of recently unprecedented 4.9% global real growth.
Note that the recent crude + condensate declines and the total liquids very slow growth corresponded to record high nominal oil prices.
This higher price = less oil pattern is precisely the same pattern that we saw in the Lower 48, at the same stage of depletion that the world is at now, based on the HL method.
The danger in all this is that others can accuse PO'ers of chicken littleism. It just gives them more reason to ignore the problem and do nothing since there are those who've been saying PO is now forever. There are even websites all over the net that still haven't bothered to update and are still reporting 2000 or 2003 as the all time peak!
Of course, the time to act is NOW regardless of when the actual peak occurs.
Well, if I see a bit farther than the next man, it's because I stand on the shoulders of giants. Or something like that. :-)
In all seriousness, let me reiterate my position. I do believe we will continue to creep production up for just a few more years. I think we have a pretty good shot at 90 million barrels a day by 2010. But I believe it is highly probable that we will peak within 10 years, meaning that we need to be taking very quick action on this issue. We need a sense of urgency, and I am afraid that if production is creeping higher, people won't be nearly as concerned. What we have at the moment is what I call "Peak Lite", which is increasing production that still can't keep up with demand. This has many characteristics of a true production peak, and will continue to result in very volatile energy prices.
Cheers,
RR
In the big picture I could give a rats ass whether it is this year or 4 yrs from now. Being prepared sooner is by far better than later. Telling people it will be OK is not getting us to where we need to go.
It will be your kids, relatives, freinds, what not, that are going to look you in the eye and say "you knew this could happen and with all your education had the forsight to sit around and argue over a couple of years on the time line". Come on man, get with the program.
So far westexas's preparation suggestions are the best. They look 1) reasonable 2)logical 3) within the zone of personal influence. We should prepare for the worst and hope for the best.
(ass chewing over with)
You sound a bit delusional to me, so let me spell out my position. I am no Peak Oil denier. It is coming. We must try to prepare ASAP. But it is pretty difficult to see out for more than 2-3 years. That's why there is so much disagreement over the timing of the peak.
Why does it matter, you ask? Because the more often we say "The sky is falling", only to later acknowledge "OK, not yet, but the sky WILL fall", the more credibility we lose. Look at Deffeyes. People point to him and all of his failed predictions, and then think Peak Oilers are wackos. We need fewer wackos, and more rational heads. The rational heads need to acknowledge that saying "Peak is now", only to later admit "Oops, not yet" will chip away credibility with the public. And the public is who you have to win over.
A better dialogue with the public is: 1. Peak oil is coming, in the not too distant future. 2. The exact timing is unknown, but many (most?) experts believe that it will occur within 10 years. 3. The Hirsch report says that we need to begin preparations 20 years in advance, so we are almost certainly behind in our preparations. 4. Failure to prepare will result in incredibly volatile energy prices, and has the potential for devastating consequences to society.
Incidentally, I am not suggesting that Stuart has been guilty of saying "Peak is now." I think he has added the proper caveats, and said "maybe" now. But a lot of people here do emphatically say "Peak is now." You have to consider loss of credibility - particularly with public perception - when you do this.
Cheers,
RR
I have no regrets about that statement at this time :-)
For instance, if the housing bubble (which Robert Schiller and The Economist both say is the largest financial bubble in human history) bursts, popping the larger debt bubbles, it is quite possible for demand to shrink by enough to cause an retroactive "peak" while dropping oil prices back to levels where it is uneconomic to pursue alternatives (like tar sands). A prolonged, deep recession could easily mean cheap oil prices and reduced production until the eventual recovery meets up with the downside of Hubbert's curve.
Conversely, political troubles in the middle east could send production plummetting, in which case "peak" would be reached immediately. Such an energy crisis would probably pop the bubbles and produce the results mentioned above.
In either of these cases, which are very possible (check out Prudent Bear.com), then our hair pulling and bickering will seem rather irrelevant.
I think your right that some other economic or social factor will come into play to disrupt the economy and lessen demand significantly. This will cause a demand drop followed by either a real or simply for demand reasons drop in supply.
But I am firmly conviced todays advanced recovery methods are not going to increase yields significanly from fields but result in massive depleation rates as you get cascading failures in the fields. Cantrell and Ghawar being the poster child for this effect.
So depletion will kick in and hard soon after the false or non geologic peak. Sort of out of the frying pan and into the fire effect.
This stair step of demand desctruion leveling of rising prices till we crash agian will probably continue for the next 10-15 years.
A minor point regarding Deffeyes. IMO, his prediction, in his second book that the world would hit the 50% of Qt mark in late 2005 (based on crude + condensate) was consistent with his first book, where he put the peak between 2004 and 2008 (if memory serves).
Between the two books, he made an observation that we probably peaked in 2000, based on the production declines in 2001 and 2002. However, this was an observation and not a prediction.
http://www.forbes.com/business/2006/07/27/oil-natural-gas_cz_mag092_0727shell.html
Shell Shocked
Christopher Helman 07.27.06, 3:00 PM ET
Excerpt:
In physical terms Shell is weak. Over the past three years it has replaced only 38% of the oil it has pumped. It is desperately searching for new pools of crude while trying to make up for their scarcity by shifting its focus toward natural gas. Gas is plentiful but hard to move--hence, in most cases, much less valuable as it comes out of the ground. Shell has suffered disarray in giant projects in Nigeria and on Russia's Sakhalin Island, and pricey delays in developing several prospects, including South Mars.
All oil companies confront the fact that petroleum is getting hard to find in politically stable parts of the globe. But Shell is in more of a crisis than the others because of a problem of its own doing: For years it exaggerated the size of its reserves. In January 2004 it confessed to the problem, eventually slicing 4.5 billion barrels of oil-and-gas equivalents off proved reserves, which now stand at 11.5 billion barrels. Counting only crude oil, reserves are down from 6.6 billion barrels in January 2003 to 4.6 billion now. This is more than a bookkeeping matter. Shell's production of oil has been dwindling at a rate of 7% a year.
Estimating reserves is as much art--or politics--as science. Shell has been in Nigeria for 50 years, and there's a lot of oil there. But how much can it get its hands on? Some of its Nigerian fields had leases set to expire before the company could possibly recover the oil it claimed as proved reserves. And relations with the host government are not good. The company's enemies in that country accuse it of destroying the environment, bribing officials, arming security forces and working behind the scenes to silence anti-Shell protesters. The company says it is a responsible corporate citizen and respects human rights.
Question: why is so much weight given to CW reserve estimates, when the HL method--at least for large producing regions--has been proven to be so much more accurate?
The Lower 48, North Sea and Russia all fit the HL model.
Mexico, Saudi Arabia and the world (crude + condensate) are now showing production declines, consistent with the HL model.
Following is an excerpt from an Amazon.com review of "Hubbert's Peak," published in 2001. Note that his updated work, in his second book, put 50% of Qt mark right in the middle of his original range of 2004-2008.
From Amazon:
"In Hubbert's Peak, Deffeyes writes with good humor about the oil business, but he delivers a sobering message: the 100-year petroleum era is nearly over. Global oil production will peak sometime between 2004 and 2008, and the world's production of crude oil "will fall, never to rise again." If Deffeyes is right--and if nothing is done to reduce the increasing global thirst for oil--energy prices will soar and economies will be plunged into recession as they desperately search for alternatives."
all the best.
We missed the 1998 Peak and six since...
Just as there has never been a hotter global year than 1998, it's always next year; and the public and media is tuning out...
Even if oil does not peak for quite a while, there are signs that oil production growth cannot keep pace with demand growth. That means higher oil prices going forward. Or maybe your quibble is that by being alarmist the idea of peak oil becomes discredited. I guess I can agree about that one. But people should definitely be made aware that a problem exists, and probably will exist even in the most optimistic scenarios, simply due to demand growth from China, etc.
The conventional wisdom when he published was that Saudi Arabia has unlimited oil, and the party can go on indefinitely. That illusion is rapidly dissipating, and, as we see from S.A. production figures, it increasingly looks like S.A. could well be in decline.
If Saudi Arabia is in decline, then global decline is not far behind.
Given that this is certainly the most important event in modern history, it is utterly foolhardy not to call the alarm. And that alarm has already borne fruit, as we see from China's frantic purchases of all the oil reserves it can lay it's hands on.
In fact, one could point to this growing realization for the rapid unravelling of the global economy and the equally rapid rise in mercantilism, led by Bush and his Iraqi misadventure.
Moreover, Stuart's chart is "believed to be all liquids" which apparently includes "renewable" bio-fuels, which is not even petroleum. That tends to skew the numbers more optimistically. So it seems to me that any discussion of Peak Oil based on published data is virtually impossible to have in anything like a Hubbertian sense.
There have been geopolitical upsets in the past (Iranian Revolution, Iran/Iraq War, Gulf War 1) which kept a significant amount of oil off the market. During these situations Saudi Arabia, as swing-producer, was able to flood the market rather quickly and return the situation to normal - although this did not mean that there weren't price spikes during the duration of those crises. This time though no one is in a position to act as swing producer, and that is the difference, which is why the "stubbornly" high prices today are not the result of geopolitical problems, but rather because of the economics of oil at or near the peak.
Since then Aramco's Alqahtani has announced that they have brought this rate forward to 2010 and a new target of 11-mbd by 2008.
Nigeria: production is currently reduced by 500kpd from prior levels and could easily be another 1 - 2 mbpd beyond what the prior high water mark was if there were no hositilities to hold back development.
I was being conservative in saying that from a geological perspective production in Iraq and Nigeria could be 2 - 4 mbpd higher.
Oily "ceo" seems to know where the price of Oil "SHOULD" be under the "Given Circumstances" ... and apparently the oil price is Not where Oily THINKS it should be so that proves ... hmm, what does that prove Oily ??
"What many predicted was World War III has already faded to the point where everybody except Anderson Cooper(CNN) and Fox News have packed their bags "
Oily uses Television coverage to determine the intensity and importance of the war in Lebanon...
"What happened to Iran's nuclear program? What happened to Iraq?"
Apparently Oily "ceo" has not seen coverage of these issues on TV lately and has not picked up a newspaper in some time. Guess what Oily, just because CNN hasn't told you more about them lately doesn't mean either problem has gone away.
"Is hot weather and reality-shows the answer to all our problems"
Reading your post, it does look like TV is YOUR answer.
Be patient and Stay Tuned Oily "ceo" - CNN will eventually get around to answering your questions about Iran and Iraq and WWIII, etc.
Iran, Opec's second-largest producer, is expected to pump 4 million bpd in July, about the same as in June, as it shifts unsold barrels of mainly heavy crude.
"Iran SEEMS TO BE GETTRING RID OF ITS OIL IN STORAGE, so they are well up on previous months," Gerber said.
In an estimate last month, Gerber put Iranian output during June at 3.8 million bpd.
Does this mean that Iran is producing 3.8 million a day yet selling 4 million a day due to selling 200k a day out of storage?
Two points about this. First, this inflates artificially the production numbers. My second point is more of a question, why is Iran selling oil out of storage?
I guess Iraq's kind of the swing producer these days ...
Thxs again for your work. Ok Freddy Hutter, does this fit Skrebowski's Megaprojects bottom-up analysis--are we on schedule to increase net world supply roughly 2 million bpd each year?
Megaprojects update excerpt:
------------------
To establish future production levels we can devise a simple equation:
Future production levels in year n = Current production levels + gross new capacity from new projects to year n - gross natural decline to year n + capacity gains from normal field operations to year n.
For example if Saudi is producing 9.5 million b/d in mid 2006 how much will it be producing in mid 2010?
Adding 9.5 million b/d to the gross new capacity of 3 million b/d gives 12.5 million b/d. However, natural depletion has removed 0.6 x 4 = 2.4 million b/d giving a net capacity of 10.1 million b/d.
The unknown is how much of that annual 0.6 million b/d of depletion can be offset by the normal field work (infill drilling, workovers, debottlenecking etc). If it can all be offset Saudi production could rise by 3 million b/d while if none of it can be offset Saudi production would only rise by 600,000 b/d (3.0-2.4). In addition we don't know if natural decline rates are stable or accelerating. Our only public window into the balance of these opposing trends is current production rates. If a country's production rate is less than would be expected by adding new capacity to existing flows, then either the anticipated new flows are not fully materialising, or normal fieldwork is not offsetting natural decline rates.
------------------------
Just a guess on my part, but if Iraqi oil exports were removed: no upswing, but a continuation of the plateau. According to this link: the Iraqi exports of 2 million barrels/day just dropped to 1.6 million because the northern pipelines were damaged again.
Bob Shaw in Phx,Az Are Humans Smarter than Yeast?
Thxs for responding. Ok, so far so good. Chris Skrebowski admits to the limitation of his method:
"In addition we don't know if natural decline rates are stable or accelerating. Our only public window into the balance of these opposing trends is current production rates. If a country's production rate is less than would be expected by adding new capacity to existing flows, then either the anticipated new flows are not fully materialising, or normal fieldwork is not offsetting natural decline rates."
This goal of accurately gauging this rate of decline is a big problem, not only for Chris's realtime monthly tracking, but also how it distorts the HL model as DuncanK's Sudia modeling illustrates. The Extreme Production Measures [EPM] discussed in a earlier thread threatens to throw everyone off-track if Yibal-like decline rates start kicking in.
So repeating again from an earlier post: is there any way to break out oilfield extraction percentages of EPM extraction versus regular extraction to guesstimate how much peakshift and depletion rate distortion has been induced into the natural Hubbert Curve for a field?
So this seems like a big 'geologic' hurdle we need to overcome to more accurately assess the global oil situation.
The next one seems to be 'logistical': Chris's project time-derating system of about 20% or two months. If one accepts the Law of Diminishing Returns, the closer we actually get to the real Peak: the time delayed derating factor should be increasing by porportionately larger amounts. I think we are seeing evidence of this already as the shortages of labor, rigs, and necessary infrastructure building is hampering oilfield project deadlines already. This adjustment might then more accurately reflect the ever-increasing efforts to overcome the ever-decreasing ERoEI of bringing oil to the end-user and how high EPM depletion rates creates positive feedback that will be increasingly difficult to overcome.
If we could somehow fully account for these effects then maybe the peak arrives sooner and declines faster than Chris Skrebowski currently predicts.
Bob Shaw in Phx,Az Are Humans Smarter than Yeast?
To say oil peaks before 2010 insinuates that BP have overestimated URR twofold. That's just not plausible with all the scrutiny that URR has been subjected to over the past.
I wonder if BPs internal URR projections look solely at price or also at energy (they probably have estimates of X billion barrels recoverable if oil is >$100, Y billion barrels recoverable (at profit) above $150, etc)
To base ones opinions on URR also is not perfect. Net URR would be a better metric, though of course its quite difficult to figure.
URR would presumably include all that Iraqi oil, which can cheaply be produced IF there is stability. If Iraq goes into major and extended civil war, then what we considered part of URR is stranded.
Now tell me again why current URR estimates can't be wrong. Tell me and watch me laugh in your face, because the IOCs and NOCs have been wrong in the past and will be wrong again.
"Liquids production of 2,701 kbd (thousands of barrels per day) was 233 kbd higher.
Higher production from projects in West Africa and increased volumes in Abu Dhabi
were partly offset by mature field decline, entitlement effects and divestment impacts.
Excluding entitlement and divestment effects, liquids production increased by 14%[2Q06 v 2Q05]."
ExxonMobil, 2Q06 Results Announcement, 27 July 2006
Please encourage Freddy to continue his efforts, instead of laughing in his face. His analysis is valuable to our discussion. Obviously, the weaknesses of bottom-up and top-down analysis have already been discussed-- we as a group need to help develop some new statistical model that can more accurately incorporate the weaknesses inherent in both.
I like TODer TheLastSasquatch's idea of somehow doing a ERoEI analysis and its effect on future global flowrates. This is just a guess, but it might show that the eventual decline of Nigerian light, sweet may have a greater effect on future cumulative flowrates than Cantarell depletion due to the differences in their 'crude ERoEI' and the total required embedded energy in their respective infrastructures to get a reasonable projection of worldwide URR.
Bob Shaw in Phx,Az Are Humans Smarter than Yeast?
http://www.peakoil.nl/images/chris_skrebowsky_aspo5.pps.file
It states peak by 2008, but peak could be this winter.
It seems that he sent ALL his slides, even the ones he did not present (ie. past work or work in progress). The presentation which corresponds to his latest public statements appears to be in the first half of the slides and ends with a sign off half way thru and then a couple of blank slides and there is a lot(20+ slides) which are more disorganized, and this is where you find the 2008 peak info.
Interesting, its like a peek (hehe) into his mind.
==========It's all about population!
Peter.
Case in point for quarterlies: Jan/Feb/Mar of 2006 have been ever increasing in the revisions and attained highs of 84.19/84.72/84.72. That should yield a quarterly of 84.54-mbd. But the July 12th Tables shows 85.12-mbd 'cuz of subsequent upside revisions. And sometimes the quarterlies go down, not up. I am hoping that this can be accomodated into your Moving Avg. I will sometimes change the monthlies to reflect it by changing the values to 3 times the Quarterly. In the case above, i would use 84.54 for each of Jan/Feb/Mar.
Myself, i use the IEA data only on the "past" consumption part of my Scenarios Graph. But after all i've said it's not due to the Q's ... it's the annuals. For the Q's are also only revised so many times. You have to catch the revisions on the old stuff by watching the annual revisions. And by my post this morn, u saw evidence of 2003/2004/2005 being amended by a high of 0.4-mbd (2005) ... one of the largest i've witnessed. And really screws up one's year-over-year assumptions at this later juncture. It too can be accomodated in moving averages by some arbitrary but insightful manipulation.
It was this type of later trend analysis that crystalized the effect of speculation in the marketplace by watching the changes in stock builds long after it happened. Unfortunately, being honest about these later revisions can illustrate that judgement of certain occurences in the past were based on faulty data. And force re-evalutations.
I'd like to see the numbers from each agency for Conventional Oil (Petroleum). This "All Liquids" is a very loose definition to me.
I thought that EIA was publishing numbers for Conventional, but that's not the case. Here's what they're talking about:
I wonder what "other liquids" exactly means. Does it include CTL? And GTL?
The only measure of what is really happening in the oil patch, is crude + condensate. Everyone would do well to ignore the ethanol, biodiesel or whatever input because that is just a fudge factor.
So Lads, if you really want to know what is happening, just build graphs using crude + condensate. That will give you the true trend.
I agree. I suggest that we define "oil" as substances which refiners buy to convert into refined petroleum products.
According to the recent LA Times story, Mexico's oil production has been falling for three months--coincidentally when Mexico hit the 50% of Qt mark, based on Khebab's plot.
Petrologistics said that Saudi oil production will probably be below 9 mbpd this month, down about 5% since December--conincidentally when Saudi Arabia hit the same (HL) point at which Texas started declining.
World crude + condensate production is down about 1% since December--coincidentally when the world hit the 50% of Qt mark, based on Deffeyes' work.
Notice a pattern?
However, what continues to baffle me is that people are seriously suggesting rising oil production when the four largest producing oil fields are almost certainly all declining.
I am reminded of the Tim Allen Movie, "The Santa Clause," where he kept asking "What happens if I fall off the roof?" No one would answer.
Every time that I bring up the four oil fields point to the "Oil production will grow crowd," (OPWGC) they invariably refuse to answer, claim no knowledge of the subject or change the subject altogether--this happened most recently at the Peak Oil debate on PBS.
We know that the world's second largest oil field is not declining--it's crashing.
We can make a pretty informed guess that world's largest producing field is doing something between declining and crashing.
But the fact that the world's largest two producing fields--representing 10% of recent crude + condensate production--are almost certianly declining is met by the OPWGC with a pretty good imitation of "See no evil; hear no evil; speak no evil."
Folks, this is big news. A drop of below 9 mb/d would likely mean that Saudi could no longer claim that it is just holding back oil because of no buyers. It means that they are declining and declining pretty fast. Their desperate new drilling program is just not holding back the decline.
The next shoe to drop will be the Kuwaiti "official" announcement of its reserves. The new opposition party, which was swept into power in the last election, has promised to publish the actual true numbers "within days".
http://www.easybourse.com/Website/dynamic/News.php?NewsID=25440&lang=fra&NewsRubrique=2
The cornucopians like Hutter are using the republican's big lie technique of repeating misinformation in order to prevent action.
Because we know oil is finite, the time to act is not when Hutter decides that the seven sisters have made enough money, but immediately in order to use the cheap energy we do have in order to rationally guided the power down.
I suggest you heed your own advice if you expect the rest of us to treat you decently. And don't play ignorant. Or if you really are that dense, go read your own posting history to understand why people don't like you. You are the asshole, Freddy. You can stop being one any time you choose.
I was one of the first to call Freddy an asshole. I take all credit for setting the tone. I now retract that point of view, and wish others would as well.
One of the main problems, in my view, previously was that Freddy posted very infrequently. In fact, evidence that this irked many others as well can be seen in posts months ago.
This is no longer the case. Freddy posts quite regularly now and responds to his critics in numerous comments and responses. This is all I can ask for. Debate him.
Debate him. Try to get the attention you get from Freddy, from smekhovo or even Alpha Monkey. You won't. These guys can't handle any criticism. Though, I will submit it is because they have nothing important to say.
In fact, the only person I can think of who gets as much criticism and actually responds is Bob Shaw. Bob is superb at countering. Most run away. Freddy doesn't run away. He also doesn't call you an asshole on a regular basis, but has to put up with it from several people whenever he opens his mouth - they don't even read what he writes. Give him another chance. What would be sad is if he made some of us here look like fools. I'd like to avoid that. Pay closer attention to the subtleties of what he says.
I don't expect you to agree with me. That's OK. I'm just glad you read what I had to say.
We know world natural gas has not yet peaked and probably will not peak for another decade, possibly two decades. Therefore counting propane and butane is not part of the peak oil game.
Crude + Condensate is what we are counting and I will bet you my next months social secuerity check that June 06 will not top December 05.
Propane, butane, ethanol, biodiesel, methanol are not included in crude + condensate and have nothing to do with Deffeyes prediction, or my caculations into peak oil.
I believe it's a mistake to ignore any production of economically relevant liquid fuel.
Hypothetically, if I create a solar device that converts sunlight directly into premium unleaded, should I ignore that in my analysis?
After all, it is just plain common sense that ethanol and biodiesel are not fossil fuels!
It's not the output, but the input that matters.
Could you just link me to that EIA data on Conventional + Condensate? I fail to find it, I doubt it exists.
But it's also the more important number. Nobody cares, at the consumer level, where the liquid fuel (e.g., gasoline) product comes from. I believe that it is important to consider all commercially relevant sources of liquid fuels, otherwise we're merely debating a purely academic issue.
Prices can be high for a variety of reasons. Any increase in demand will drive prices higher (China, India) as will any increased risk of supply problems (Iran, hurricanes). Increased reliance on more expensive forms of oil is only one of many possible sources for prices increases.
Ok IHS also, but you have to pay a lot of €$€$€$€ for it, O&GJ costs 50$/year.
The data from EIA has been discussed previously here at TOD, but has I quoted above it's close to those 'All Liquids' definitions from IEA and BP.
Cheers.
Lads: see this oil drum story
Can you please confirm to the folks above that EIA does not publish data on Conventional Oil?
If peak postponers are right I guess we can expect petrol prices to drop any day now.
So while there is an element of double counting, in the case of sugar derived ethanol it is less than 10%.
To echo comments above, the Crude + Condensate number is the one to watch if you are interested in understanding petroleum supply dynamics. However, from a consumer perspective, useable energy is what matters, be it ethanol, electricity or whatever moves their wheels.
http://en.wikipedia.org/wiki/2006_Atlantic_hurricane_season
Here is a message board post from a hurricane board I lurk on:
http://members.boardhost.com/hurricanecity/msg/1153536125.html
There was also commentary that this year's tornado season has been extremely light as well. Apparently global warming does not automatically lead to worsening storms every year. That's what the climatologists have said all along, but their message got drowned out by the alarmists last year. And no, this year's heat wave is not caused by global warming either. There have been plenty of heat waves in the past. The influence of global warming is subtle and no single event can be blamed on it.
I think I will bet that the insurance companies know more about this than I do, and they are raising their rates or fleeing the business.
Eventually the heat built up now will be released.
I suspect a Cat 4-5 hurricane in December.
Basically its not going anywhere and when conditions are favorable we will have our hurricanes this year and strong ones it just its starting to look like it will probably be later in the season. The number of hurricanes is related to variable local conditions its the strength thats related to global warming. I think you will find that from now on out when condition are favorable for hurrican formation we will get Cat 4-5 hurricanes.
That heat won't just sit there, it will be disapated. It takes a series of just right metrological conditions for a hurricane to form. Warm water is just one of them.
If that happens, shouldn't the rational PO investor try to finesse the resulting short-term futures correction by immediately taking profits on his /her oil-based positions?
And indeed, market prices reflect this uncertainty. Jim Hamilton used options to calculate the 95% confidence interval for oil prices a few years out, and the range was from $15 to $250! The truth is that we really have very little knowledge about whether demand will outpace supply or vice versa over the next few years.
http://www.econbrowser.com/archives/2006/02/oil_at_1530_a_b.html
In this case, if we believe in Stuart's methodology and that methodology suddenly moves its projected peak out three or four years, then we might rationally choose to act on that information (take profits) before that info is generally arbitraged.
Of course, there's no guarantee that we would make money on our decision to sell now. But it seems to me that doing so might be a reasonable play given the relative probabilities of outcomes if we strongly believe our (temporarily) privileged information to be sound.
I used my garden hose and a nozzle for some very inefficient but highly effective hydraulic drilling.
Efficiency never has impressed me much.
Now effectiveness . . . . Effectiveness is a "whole 'nother breed of animal."
"EIA issued a Federal Register notice announcing its plan to discontinue the collection of data on Forms EIA-182, Domestic Crude Oil First Purchase Report, and EIA-856, Monthly Foreign Crude Oil Acquisition Report, after the July 2006 data collection."
http://www.eia.doe.gov/oil_gas/petroleum/data_publications/petroleum_marketing_monthly/pmm.html
The figures are not that accurate, so why argue as if they were. If the figures are even 1% accurate I would be amazed - that kind of accuracy is unknown in world data even if many of the sources didn't have reason to lie. That's about to 850,000 barrels a day or twice the month-by-month standard deviation.
The EIA has made an attempt to estimate the sampling error (see http://tonto.eia.doe.gov/FTPROOT/petroleum/art0310.pdf ) but they can do almost nothing about straight out lies. Since many of these figures come from countries which do not allow independent audits, and who have every incentive to hide bad news from their own populace, let alone the rest of the world.
I have pointed out before that Venuzuala one its own seems to have production figures of between 2.1 and 3.3 million barrels a day, according to the source. Arguing exactly when the peak will be is like trying to estimate angels on the head of a pin - at the bottom pointless No pun intended.
BTW. Remember also that Peak Oil is not a football team with us cheering on the sideline. It matters and an early Peak is actually very bad news, unless you are insane and your name is Max.