EIA reports on April
Posted by Stuart Staniford on July 5, 2006 - 12:16am
The EIA has reported in for April, and find themselves in almost perfect agreement with the IEA (84.53mbpd, versus 84.56mbpd).
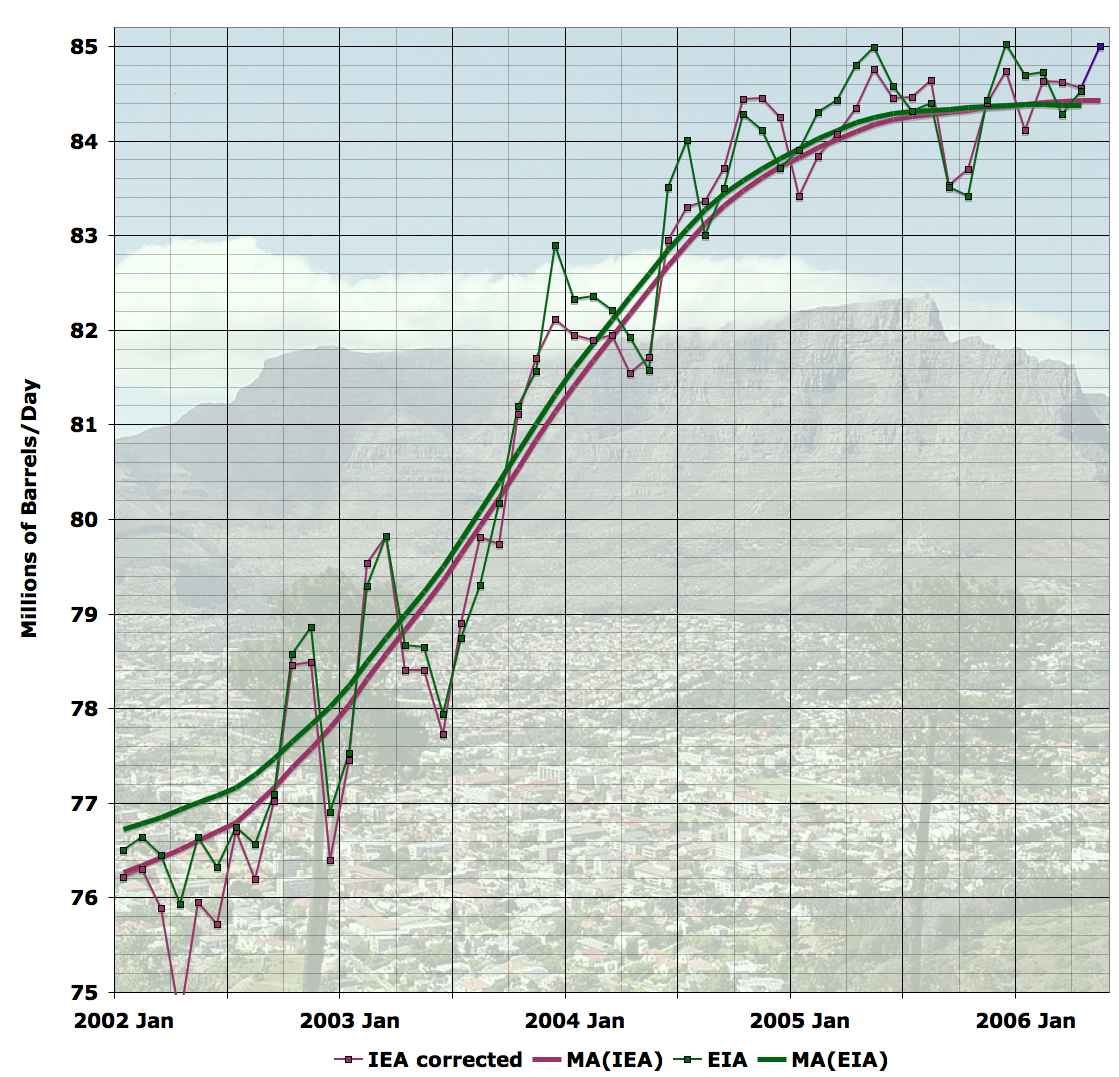
In my quest for the perfect plateau graph, I made the above which performs the same recursed 13 month centered moving average that we've been doing for a while. The innovation is to do it separately for both EIA and IEA (instead of on the average of them). I combine that with the monthly data for both EIA and the IEA corrected, with just the latest data point from the IEA raw line (which is shown in purple). It's really worth a click to get the full-size version.
I think this reveals an interesting fact: historically the IEA have been a shade more pessimistic than the EIA, but they have been reversing roles over the last couple of years.
Anyway - plateau continues, not much news. April is not a contender for highest month, but nor is it particularly low.
To give us a little more to talk about, I've been investigating some OPEC countries a little more. I started making a series of plots for individual countries that show both the EIA and JODI estimates of production, together with the Baker Hughes rig counts for each country. This is in the interests of distinguishing the "official line" on the OPEC plateau - which is more or less that OPEC has lots of oil, but isn't making the investment to produce it, and the "geological peak oil" theory that OPEC is peaking and could not produce more oil despite efforts to do so.
The truth may well be a hybrid of both theories. Let's start with Saudi Arabia:
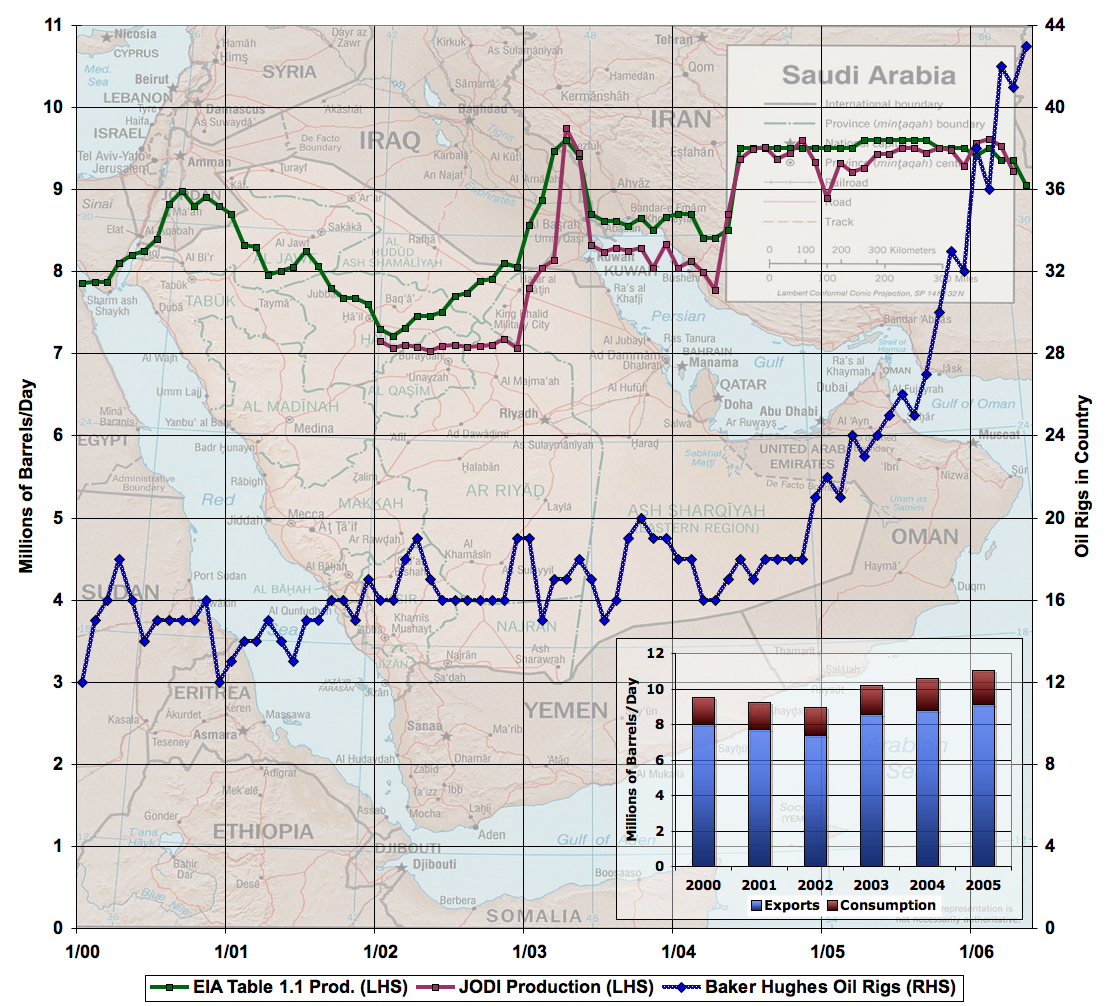
In all these graphs, the EIA (green) and JODI (plum) production curves refer to the left hand scale, while the blue curve is the oil rig count on the right hand scale.
As has been much discussed lately (both here, and over at Econbrowser), Saudi production has begun declining, after a long period of being flat. Both JODI and the EIA agree on this point. The Saudis claim they've cut back deliberately due to lack of demand. However, that oil rig count just keeps skyrocketing, so I think we'll keep wondering.
Next up is Iran:
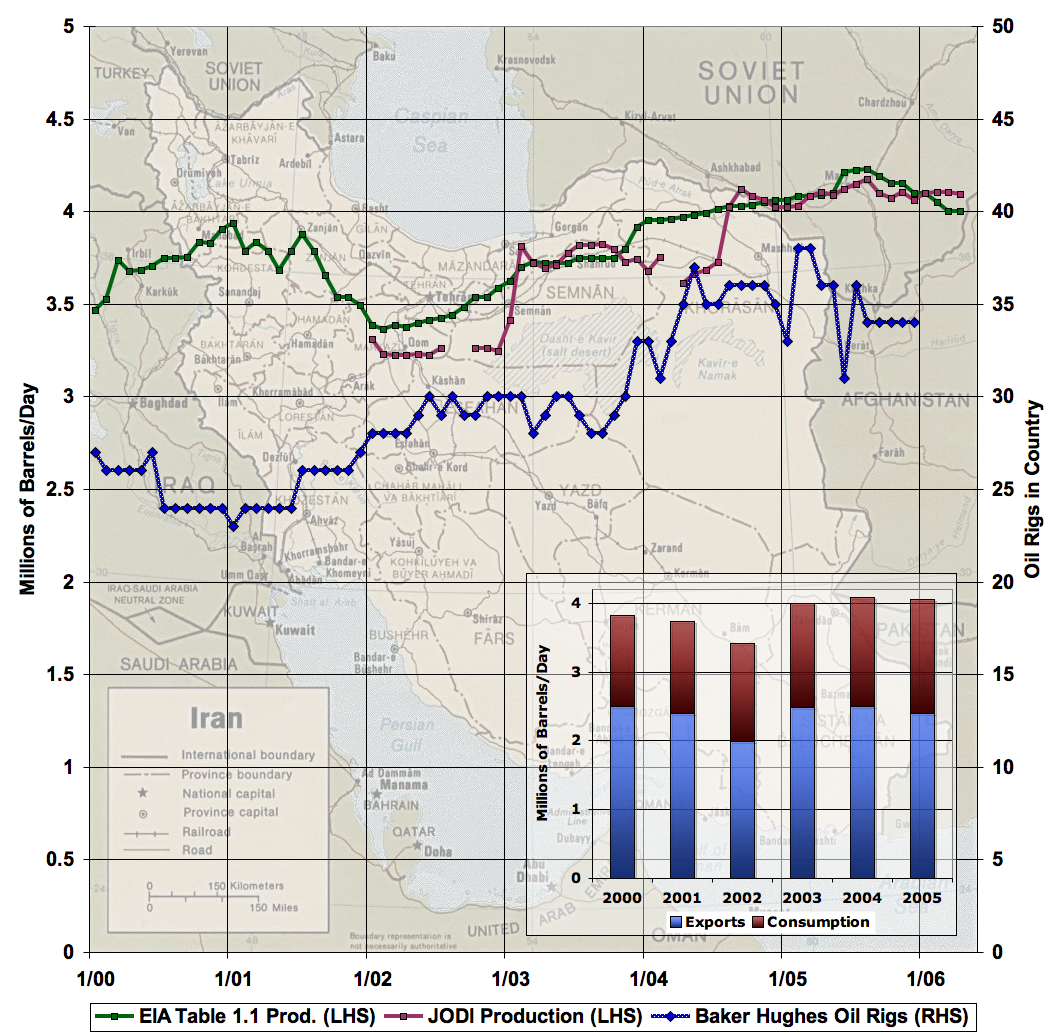
As you can see, production is also declining in Iran, though the EIA sees this as a more significant trend than the JODI. However, the rig count response is not nearly as pronounced as in Saudi Arabia. Rig count was increasing from 2001-2004, but seems to have been fairly flat for the last couple of years. Possibly the geopolitical instability is affecting anyone's willingness to send rigs there, or maybe the Iranian's just aren't in that much of a rush (preferring to build nuclear power plants?).

Kuwait's production has also been flat lately. Rig count fell dramatically to almost nothing in 2003, but then recovered and for the last couple of years has been flat at about the level of 2000. There is no sign of a herculean effort to increase oil production.
Next comes Iraq:
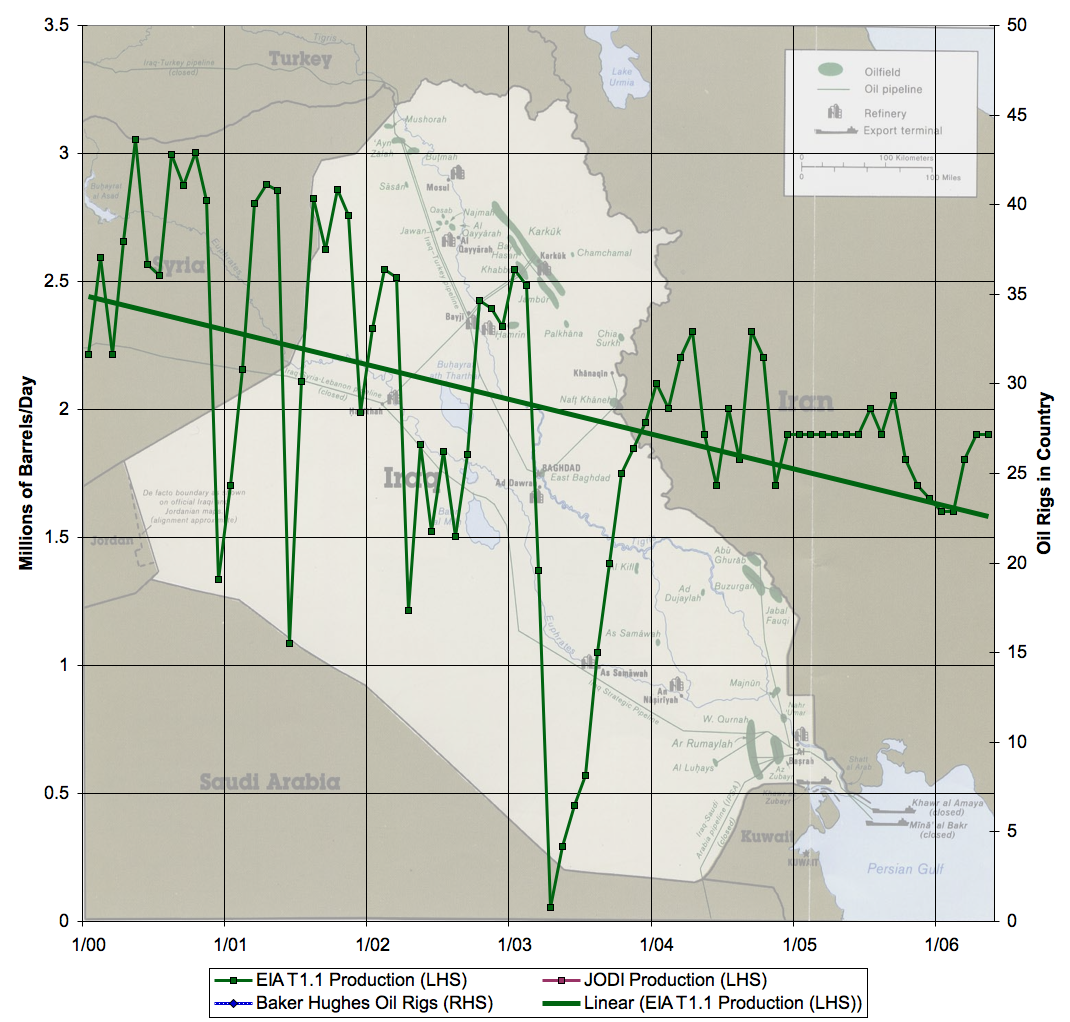
Unfortunately, neither JODI or Baker Hughes have any data for Iraq. The EIA show a general slide in production that extends from the Saddam era through the occupation (the straight line is a fit to all the data in the graph). However, the last few months have had a bit of a recovery. Obviously, the future path of production is all dependent on the politico-military situation - there's lots of undeveloped reserves if the country ever becomes stable enough to develop them.
We conclude with the most mysterious chart: Venezuala.
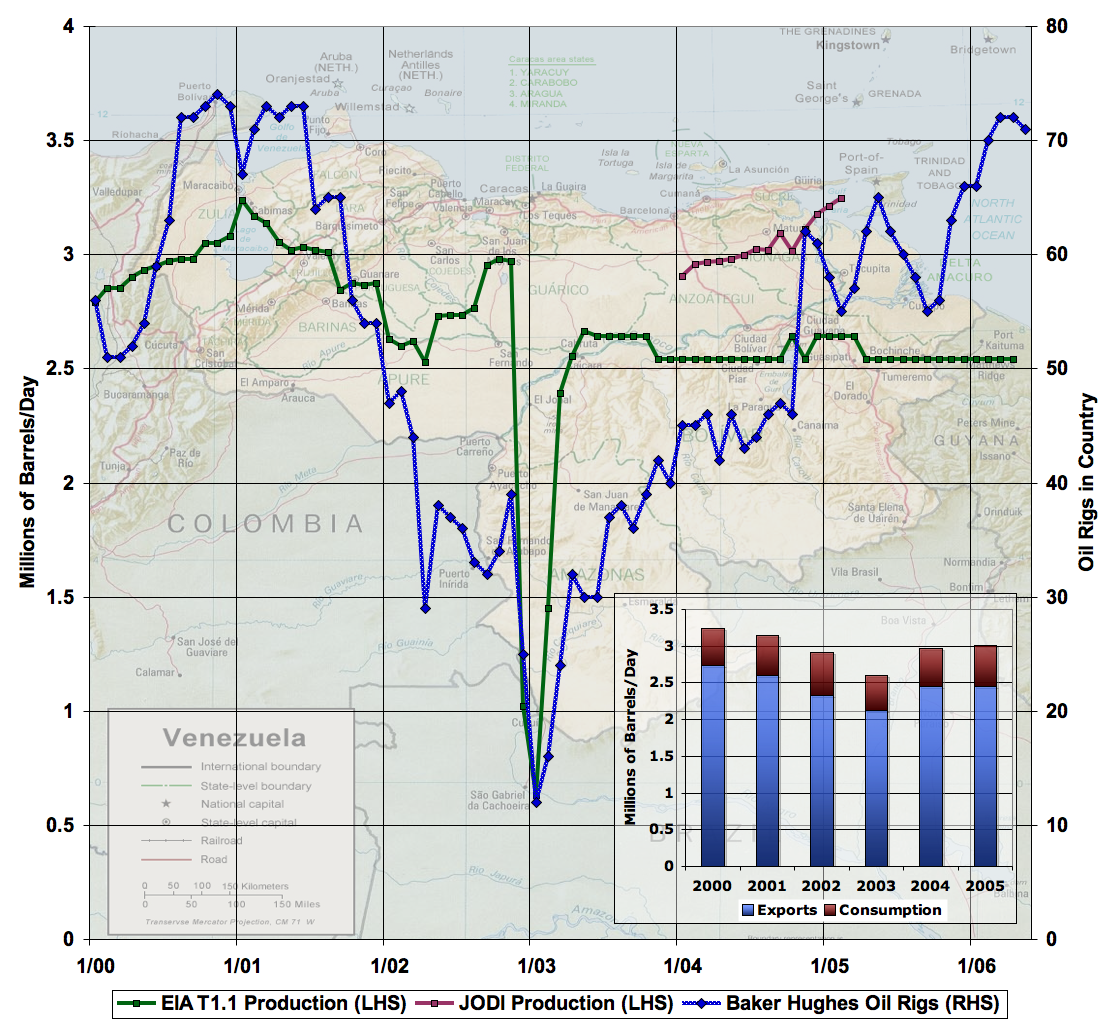
Several fascinating facts emerge. Production was declining for about 18 months prior to the attempted coup, and this was closely associated with a decline in rig count (which fell precipitously at the coup). What was the rig owner's thought process? Since then, rig count has been climbing and has recovered to the 2000 value. According to the EIA, this has only led to flat production. However, the JODI has a short sequence of data that paints a radically different picture - much higher, and climbing, production.
What's going on here? I nominate Dave to investigate.
Contact
- Content: editors at theoildrum dot com
- Tech support: support at theoildrum dot com
License

This work is licensed under a Creative Commons Attribution-Share Alike 3.0 United States License.
Is there anyway to find out what really happening in SA ?
The symptoms look like a peak from the outside.
Plenty of Americans work for Aramco in sensitive places this should not be a mystery.
My bet is water break through on the "bottle brush wells" in Ghawar.
Something is for sure going on and its been known for a while.
First, allow me to again commend Stuart on the great statistical work, but we are spoiled to that here, aren't we? :-)
To your question memmel,
"Is there anyway to find out what really happening in SA ?",
Of all the things my contact with the "peak aware" and "peak concerned" community has taught me, this is one of the most fundamental, and one of the least known by the general public: There really is NO WAY to know what is going on in Saudi Arabia, or most of the other OPEC nations. The Mexican oil industry is almost as secretive. Matthew Simmons once made the comparison of running 70 miles per hour in your car without a fuel gauge. Everything looks great and your having a big ole' time till all of a sudden.....what happened? You sputter to a stop with no warning. Here's the real rub: You don't even know if you ran out! It could be a fuel filter stopped up or an ignition or computer problem, or...you may be out of gas! You cannot even know how to diagnose the problem with no visibility!
Most of the folks here know from my prior posts that I am an optimistic type by the standards of the "peak" aware/"peak" concerned type. But I find the absolute lack of useful information from the biggest oil producers, who are some of the U.S. markets biggest suppliers, to be discomforting and foreboding beyond easy words.
The lack of information even if there is no lack of oil should be seen as a potentially nation threatening emergency in and of itself and treated as such by our government, business, and civil defense authorities in cities, states, and towns, and viewed that way by our individual citizens.
This is something we CAN DO now, and with no immediate breakthrough in technology. We must:
*Lobby the world every day in every way for energy supply and productioon transparency. Outside auditing is considered a hallmark of modern respectable business and finance around the world. We should make sure the OPEC organization KNOWS that without outside auditing and transparency, we consider them niether modern nor respectable. Likewise, Venezuala (an OPEC member) and Mexico. The Europeans, Japanese, Koreans and Chinese should be lobbied to join this cause. They have as much or more at stake as we do.
*Strategic planning. We should work to increase the strategic storage AT ALL LEVELS of crude oil, gasoline and Diesel, LPG, and Natural gas. Even using tax relief and incentives should be considered to get business, states, counties, and local communities to stretch their storage capacitiy out to the maiximum sensible amount. Storing out of season fuel (nat gas and LPG in the summer) should be studied, and put into place if it can be done in a way that does not threaten market stability. This should be done in phased and planned intervals, and NOT as a panic hoarding strategy. But having enough storage to assure the ability to ride through unique weather abnormalities, or to assist in the event of a sudden short duration political/terrorist/transportation event is not hoarding, but just good planning. Remember, we have NO VISIBILITY forward. That is not the fault of the buyer, but of the suppiers.
*Fuel diversity. There is now no excuse not to diversify fossil fuel supply to critical services and agencies. At least part of the fleets of ambulance, police cars, utility service trucks, telephone service trucks, postal delivery and private delivery vehicles, should be on a "secondary" or even third fuel, different from the "mainstream" or primary gasoline or Diesel fuel of the fleet at large. CNG and LPG are idea candidates, along with a mix of gasolne, hybrid, and Diesel vehicles. As PHEV (Plug Hybrid Electric Vehicles) become usable, they should not be dismissed, as it even brings the electric grid into the mix, but that may still be a few years down the road. This way, in the event of emergency, at least some of the fleet may be able to remain functional, since the odds of losing access to all of the above types of fuel is not nearly as likely as the risk of losing just one "mono" fuel.
Again, on site storage where possible should be considered. LPG can be stored in very large tanks, and a "Fuel CO-OP" of, for example, telephone service and electric utility firms could jointly arrange with the LPG distributer in the area to provide a tank on lease, and share out the cost. Similiar arrangements could be made by emergency services of cities and counties, hospitals, etc. Other such arrangements would be made with nat gas companies, and possibly even Diesel or gasoline distributers, to stretch out forward planning and visibility.
This is no joke. I say again, that we should all be deeply concerned and troubled, immediate peak or not, about the absolute blindness we are operating in.
The public should know that this is a serious threat to public and national health and safety. (Who will do a public information campaign? Tag line: "Do you know how much of our oil Saudi Arabia is producing? Niether do we."
I speak for myself here, but it is this absolute forward blindness that scares me more in the very short term than the potential of immediate peak. Peak may happen soon, it may have already happened, it may be a couple of decades off. We really just don't know. The absolute blindness we live with on energy supply information WE KNOW has already happened years ago, and stays with us daily.
Roger Conner known to you as ThatsItImout
It would be great if SA cared about being viewed as modern and respectable :-) They do as they wish. That the cartel exists at all is evidence that consumer countries have no real options of pressure avaliable against the producers, short of invasion.
Agreed. I am all for auditing, but not at the expense of the '3 Days of the Condor' Scenario. I hope the TOD leaders will participate in the following:
--------------
Announcement. President Vladimir Putin will hold an Internet conference on July 6
30/06/06: Both the Yandex and BBC sites offer users the chance not only to put new questions but also to vote for questions already proposed. During the conference, Mr Putin will answer the questions selected by Yandex and the BBC through votes on the Internet.
----------------
Official website of the upcoming G8 Conference:
http://en.g8russia.ru/
I would like to ask Putin if he believes: that our genes are not are friends, that Overshoot is rampant, and that ASPO's Protocols and voluntary pop. controls is the best path forward.
Bob Shaw in Phx,AZ Are Humans Smarter than Yeast?
Vintermann,
I have to agree with your central point in it's main thrust, but we should be willing to use what leverage we do have (and again, we agree, it's not nearly as much as we need to get them to open up easily). For example, weapons and technology sales. We could begin to make noise that our Senate and House were looking less and less favorably on selling to a nation that was so secretive with it's dear "buddies" (us)....of course, the weakness there is Saudi political PAC money which would mean most of our Senators and Congressmen would be calling the Saudi's assuring them not to worry, all was well, we still loved them!
Your right, it's an uphill climb....:-(
We should still keep the pressure up though, and still plan for emergency....since we have no visibility, we have to assume it (meaning sudden unexpected oil shocks) can happen at ANY moment, and not sham the American people into complacency with this delusional appearance of "statistical" knowledge and predictability. It does not exist.
Roger Conner known to you as ThatsItImout
The symptoms look like a peak from the outside."
Let's look at how Saudi Arabia responded to supply disruptions in 1973 versus 2005
As I have previously noted, based on Khebab's HL work, Saudi Arabia (the current swing producer) in 2005 was at about the same stage of depletion at which Texas (the prior swing producer), in 1972, started its so far terminal decline in production.
During the 1973 Arab Oil Embargo, Texas had started declining. Note that the "Embargo" lasted for 60 days or so. In fact, if you look at Saudi oil production during this time period, they showed rising oil production. The reason that oil prices went up by about 1,000% from 1973 to 1980 was because of temporary supply/demand imbalances--the embargo was just a trigger.
It's instructive to compare the Saudi production response in the Seventies to their hurricane response last year. From 1970 to 1973, Saudi oil production went up by about 100%: http://www.eia.doe.gov/emeu/ipsr/supply.html
Last year, after the hurricanes hit, the Saudis were unable to increase their production, and Saudi oil production started showing a decline, which required (as far as I know) the largest ever coordinated release of emergency petroleum reserves.
It appears that releases of emergency reserves represent the new source of "swing production." Also, note that the rig count explosion on Stuart's excellent graph really kicked off in early 2005.
To summarize: (1) Saudi Arabia, based on the HL method, is at about the same point at which Texas started its decline; (2) Saudi Arabia in 2005, like Texas in 1973, was unable to respond to a supply disruption and (3) Saudi Arabia, just like Texas in the Seventies, has embarked on a very aggressive drilling program.
(After increasing the number of producing wells in Texas by 14%, from 1972 to 1982, the Texas oil industry succeeded in slowing the decline in production to only about 30% from 1972 to 1982.)
BTW, note that the EIA data continue to show that world crude + condensate production is down about 1% since December, while (light/sweet) oil prices are up close to 25%.
(click on the image to make it bigger)
The circled points are projections for 2006
Otherwise, at least it appears to be a good first-order predictor of price.
in case of Saudi Arabia, prices and rig counts are correlated but I believe it's a coincidence. Your second interpretation is probably the most probable.
I think you found a winner of a graph there. The relationship is jaw-dropping IMO.
If the number of stripper wells in the USA could be plotted over time we might see the same thing, especially recently.
Terrific info--Big thxs for pumping out all these graphs and other info for discussion.
Any possible idea what the undeveloped Iraqi reserves add up to? Equivalent to one Ghawar, or more like an ANWR?
Bob Shaw in Phx,AZ Are Humans Smarter than Yeast?
Thxs for responding. That is what is great about TOD--> some members have excellent people connections, or are able to attend the crucial conferences, then ask questions.
Bob Shaw in Phx,AZ Are Humans Smarter than Yeast?
This link appears to be a pretty good assessment of Iraqi oil potential, but it is a little dated [2003]:
http://www.brookings.edu/views/op-ed/fellows/luft20030512.htm
The most recent news basically invites Big Oil to develop what they want inside Iraq:
http://money.cnn.com/2006/07/04/news/international/iraq_deals.reut/
-------------
Iraq plans to invite international oil companies to help develop its giant oilfields before the end of this year, Oil Minister Hussain al-Shahristani told Reuters on Tuesday.
"These are major projects, giant oilfields," Shahristani said in an interview on his arrival in Kuwait.
Iraq, home to the world's third biggest oil reserves which are estimated at 115 billion barrels, needs up to $20 billion in foreign investment to boost production.
--------------
My guess is if Big Oil can really get the ball rolling soon--the plateau will continue-- delayed too much, and it will just be bump on the downslope. Hopefully, the TOD experts can weigh in with better analysis and details.
Bob Shaw in Phx,Az Are Humans Smarter than Yeast?
I live in Perth also - do you know if the event on the 22 July is in Perth? It seems that it is in Canberra.
I won't be able to make the thing on Friday however do you know if it is going to be taped?
(FINSIA), Sydney 10-11th (including the Senate committee) and an international conference in Hobart (14th July), then perhaps Canberra, Monday 17th July. See www.Finsia.edu.au under events
Questions: How far back does data go for all these countries? Whenever I use Yahoo Finance I always like to go from the zoomed in 6 month graph to the "max" historical limit...
These graphs are fascinating to look at--but now I'm really drooling to see some graphs going way back... I guess there would be some discontinuities in some (or a lot) of the data though...
http://www.aph.gov.au/Senate/committee/rrat_ctte/oil_supply/submissions/sub135b.pdf (340kb)
Our govt department (ABARE) uses IEA and EIA figures and you can see the phallic-shape of the 'predicter's droop' over the past 6 years compared to the actual rise in the oil price. :)
In trying to get the bottom of the Saudi mind bender I have returned to Matt Simmons book and re-read the chapters on Ghawar, Abqaiq, Berri, Safaniya et al., but focussing on Ghawar. This provides some possible reservoir engineering and production engineering insight to what may be going on.
Simmons points out that the massive central portion of Ghawar (Uthmaniyah) has poor reservoir properties, in particular low permeability and lacks the natural water drive of the prolific northern part of the field. Simmons suggests that Uthmaniyah has been used in the past to boost production at time of need but doing so results in rapid drop in reservoir pressure. As reservoir pressure approaches bubble point, production must be stopped to allow pressure to rebuild over a period of years as fluids (oil and water) bleed back into the produced zones. So if Uthmaniyah has been producing over the past two to three years, the time to rest the resrervoir may have arrived.
One of Simmons favourite themes is the water production problems in Ghawar and other fields. Production fluid handling systems will have a finite volume and as the proportion of water to oil is increasing with time then an essential consequence of this is falling oil production. This problem may be greatly exacerbated if multi-lateral horizontal producers begin to water out.
This may provide a clue about the neutral impact of all those new wells that have been drilled. If new production wells have a high water cut when they come on stream they may not impact overall production - which will be limited by the total fluid handling capability of their processing infrastructure. In other words, an old watery well gets swapped for a new watery well. The only way therefore, for the Saudis to boost production would be to geratly expand the infrastructure - and this would take many years and billions of $ to do.
Finally, can you explain the large discrepancy between the bp and EIA data for Saudi? The other countries seem more or less to be in line, but for Saudi, bp quote around 11 million bopd and the EIA around 9.5 million bopd for 2005.
Cry Wolf
January 9,400
February 9,500
March 9,350
April 9,350
This seems at variance with your graph, which seems to show April production at slightly over 9 million barrels/day (say 9,040.000).
Anyway, the rig count number is one way to quantify how hard they are trying, in effect - are there any other variables that would be similar?
Also, is this data available for Mexico?
(Note the use of the indefinite use of the term "one." One = someone besides me!)
The situation was different, when the Lower-48 production peaked in 1971, it was cheaper to import oil than overdrilling.
No matter how much currency manipulation, hedge-funding, shady inventory reporting, political spinning, etc occurs, it all boils down to harvesting energy to do work.
The former activities may obscure the reality of the later for awhile, but in the end it comes down to a population that has evolved to be "specialists" on a few finite energy resources. "Specialists" in the world do not do as well as "generalists" when the resources or the environment the "specialists" rely on changes.
Case in point, look at monarch butterflies (young feed only on milkweed plants) vs. cockroaches.
"It is not the strongest of the species that survive, nor the most intelligent, but the one most responsive to change." -Charles Darwin
P.S. I am not a Social Darwinist, but I do believe the ideas of Darwin pertain to humans at the genetic and eventually the population-level.
Oil is finite, but solar energy is not (well, as a practical matter: it will last several billion years, and that's long enough).
Now, their is an alternative solution to the monarch's dilemma. If there were a mutation within some populations of monarch larvae that allowed them to survive on different plant leaves without the mutation killing the larvae, this mutation could multiple within the species and save them from their "specialization".
When milkweed is plentiful, it's OK to for the species to base their entire reproductive success on it. It even allowed them build highly complex migration and nesting behaviors. Take that resource away from them and perhaps the only way the species will survive in any great numbers is to change into "generalists." They will be forced to adapt to the changing environment or die out looking for milkweed plants.
So, these environments are being eliminated over the range of the monarch butterfly.
Plants in general are not finite, but plant species may be due to habitat depletion.
Humans didn't specialize in fossil fuels through genetic adaptations.
We switched from wood to coal, and from coal to oil, and we can switch to renewables, especially wind and solar.
Will it be easy? No. Should we, in TOD, do the world a service by getting the word out on the need to get the switch started? Yes. Is there a risk that the transition will be very painful? Yes. Is there any reason to think the switch is impossible? Absolutely not.
If you rely too much on one food (fuel) resource; if you build too much complexity based upon that resource; you lead yourself open to disaster if that resource dwindles.
Humans have built what they have built in this modern world because of the highly energy-dense supply of fossil fuels. We can switch to other fuels and we know how to do this, but not at a scale that will maintain the current complexity we now enjoy.
There are examples of what can happen to us all around in this world. To think we are not governed by the laws of nature (biology, geology, physics, etc.) is insane. Yet, this is what I see in the global press and governments. Some would think that humans can escape or are above these natural laws and unfortunately, in the end, we can't and we aren't.
This is what I am trying to convey.
Yeah, I agree, we've become a bit over-dependent on oil.
"We can switch to other fuels and we know how to do this, but not at a scale that will maintain the current complexity we now enjoy."
Now this I can't agree with. What makes you think solar can't replace oil? The world uses the equivalent of 4.5 terawatts of electricity, on average. The sun sends 100,000 terawatts, on average.
I think you are being a little naive to think we can replace all the current uses of fossil fuels with solar energy.
Like we build anything else. Our energy economy is awfully large, and we currently invest hundreds of billions of dollars in it. That investment just needs to be redirected. Currently PV is labor intensive, and therefore somewhat more expensive than fossil fuels in most places, but that's changing fast - check out Nanosolar.com.
" What fuel goes into the materials to build solar panels?"
Solar has an E-ROI of between 7:1 to 30:1, depending on technology (http://www.nrel.gov/docs/fy04osti/35489.pdf). Most input energy is process heat, which is either electrical, or gas. If it's electrical it will be cheap electricity at night, much of it nuclear, and if it's gas then the actual E-ROI is actually tripled, because gas BTU's are equivalent to 3 electrical BTU's.
http://www.renewableenergyaccess.com/rea/news/story?id=45347
Note that a factory which will produce about 500MW of capacity per year runs with only 100 staff. Wind has a E-ROI of 35:1 to 65:1.
BTW...nice to have you back Sailorman. You bring much levity to the fold.
Freddy, you've got to promise me something. Never cite an IEA number until you know the revision. How about that, OK? If you do that, I'll stop the omphalos gazing.
While it is true that there have been some downward revisions of IEA estimates, theirs is the first to market and a great indicator. One-third of their supplemental revisions have been upward in the past twelve months.
Thanks.
I have been looking at the OMRs, and not found the numbers FH has quoted. For example, The March OMR showed Feb at 84.6, and this was revised very slightly to 84.62 in the April report (not a signif difference). I find no further revisions for Feb, and although the differences from what I find and what he notes are small, I'm just wondering what I'm missing.
The key point is that at least three--and almost certainly all four--of the four largest producing oil fields in the world are declining.
Assuming that Ghawar is declining, the single largest source of light sweet crude is declining, and we know that the world's largest source of heavy, sour crude, Cantarell, is declining.
We have seen the same pattern over and over again--we find the big fields first. Once a region crosses about the vicinity of the 50% of Qt mark, the smaller fields that we subsequently find can't make up for the declines in production from the old large oil fields.
The North Sea, as predicted by the HL method, is the most recent region to cross the 50% of Qt mark and to definitely start declining.
In his latest book, Deffeyes predicted that world would cross the (crude + condensate) 50% of Qt mark in late 2005. The EIA continues to show a 1% decline in world crude + condensate production since December.
Dave? concur?
Cheech
As I have mentioned before, even 33 years of declining production isn't enough to silence some cornucopians--who are still talking about significantly increasing Texas oil production--through, drumroll please, the use of "better technology."
What, fewer than 100 rigs working in Kuwait, Iran, and
Saudi Arabia, which together have perhaps 1/3rd of the world's remaining conventional oil?
We have more than 1500 rigs in North America.
Who really knows about the Middle East, but one hundred rigs does not sound like a major push to expand production.
It's notable that Iran has been able to expand production with a few dozen rigs, and that Kuwait can hold sorta steady with a dozen.
The problem is rig count has gone up a lot production stays flat and as you note both Iran and Kuwait seem to get decent returns with a low rig count. Thats whats alarming.
We should be seeing a decent bump in production agian compare
to Kuawait.
And as noted in another post at some point if your watering out drilling new wells does no real good because you don't have the water separation facilities. I'm starting to understand the deep concern with water cut.
This makes me even more concerned since basically you eventaully are simply shutting down the well or you go from a low water cut to a large water cut or a shutdown well. Which means I guess you have to drill a new one ?
Sorry I don't understand how the life cycle of these multi-branch wells work. But it seems that if you decide to leave the well producing you go from a low water cut to a very high water cut the moment all branches water out but its still worthwhile to produce.
On the other hand, I am becoming more and more distrustful of some EIA numbers because I think, based on their most recent 2006 outlook as reported and critiqued by Stuart, that the agency may be politicized. If you add the JODI/BP number to the EIA total, I believe you will hit the magical 85/mbd mark.
But there are more mysteries to contemplate. Leanan on today's drumbeat tells us about higher Russian production figures for June. Yet these OPEC numbers Stuart cites (excluding Venezuela and Iraq) are not moving. Everybody else, the Russians included, are pumping flat out. Al Naimi says he has heavy crude sitting around in tankers that have no destination. Total world production remains in the mid-84/mbd range (EIA) yet Chinese demand is surging and they are depending more and more on Angola deepwater production.
Adding all this up, and being of course an astute analyst at TOD, my conclusion is
But my gut feeling is that the answer to this mysterious stuff lies in 1) the peak of light sweet crude and 2) a glut of heavy oil because of 3) a lack of refining capacity for the latter. If Cantarell (heavy, sour) is indeed tanking, then those Saudi boats will have somewhere to go. But the Saudis are not standing still though the rig count is up and the production flat. They are going into the refined product business. It is not often noted here that they have a large domestic consumption
850/mbd of Saudi domestic consumption. That's a lot. Also, look at this (older) graph.What's the spread right now? Somebody will know. I vaguely recall some saying about somebody's son riding a camel....
It seems to me that the Russian government and Russian oil companies have some very powerful motivations for reporting higher production numbers, which makes one wonder how sustainable the reported production increases are, but time will tell. I would also note that a lot of people are selling Russian assets, from BP to Marathon, to the Russian government itself, via the Rosneft IPO.
An excerpt from the article on Russian oil production:
"Russian oil reserves are also becoming depleted and the country needs to tap major new deposits in new areas such as East Siberia to support growth.
"State oil firm Rosneft, which controls the former key production unit of YUKOS, Yugansk, continued to show the best annual growth rates as its output rose by 7.4 percent versus June 2005.
"But its month-on-month growth of 0.3 percent versus May 2006 was only about a half of the rates seen in the past months.
"Rosneft has ramped up production as it is preparing to sell up to $11 billion worth of its stock in London and Moscow in Russia's largest ever IPO in July.
"Russia's top oil producer LUKOIL (LKOH.RTS: Quote, Profile, Research) also added 5.2 percent on its annual rates. Its June production also rose by 2.0 percent versus May 2006 due to bigger output at its Siberian Urai unit, the data showed.
"LUKOIL had no immediate comment on the month-on-month rise, which was exceptionally strong, given that Urai's production was flat or grew only modestly in past years.
"It seems that LUKOIL has added Marathon's (MRO.N: Quote, Profile, Research) production to Urai's figures. So the organic growth should be much smaller at around 0.5 percent," said Vladislav Metnyov from Troika Dialog brokerage."
Those thinking it looks scary might have already reached this conclusion - takes me longer.
Dunno it took me 3 seconds to go Oh Shiiit.
Now I'm scrambling to find out what happens when these multi completion horizontal wells water out so far no info. But commen sense says they basically remove all the oil in a area basically goin strait to stripper wells. I'm becoming increasingly concerned that in areas where this type of well is used we will see spectacular production drops.
See
http://www.energybulletin.net/1560.html
Those are the choices. Your guess is as good as mine. I mean, c'mon -- why is Iran planning on rationing gasoline? Yeah, I know, imports, subsidies, lack of refining capacity, growing internal demand.
Now, will somebody tell me the real reason? They certainly ought to be able to pay for it. This move will be very unpopular and you can only scapegoat the Great Satin so many times to keep everybody on track.
Regarding Iran, they haven't kept the peaking of their oil a secret at all. Dr. Samsam Bakhtiari, one of peak oil's most vocal champions, is an employee of the National Iranian Oil Company. In fact, Dave, if you want to look at a "real reason" for Iran's campaign to reduce it's gasoline consumption, why not think in terms of peak oil. It would only be consistent with what they have been saying regarding the peaking of their oil output.
One thing that might be interesting to see is a plot of average US gasoline price (per gallon) on a separate axis over the world oil production curve that you've depicted.
US fuel prices have been steadily ratcheting up since Jan 2002, even as world oil production increased from 76.5 mbd to 84.5 mbd.
Talk about ominous...
-best,
Wolf
Those rig count numbers provide a good opportunity from some strategic wild-ass guessing. What percentage of those rigs will discover recoverable crude? What will be the distribution of the sizes of those recoverable fields? What is the estimate on the amount of time it will take to bring these new resources to market?
One could add plot these additional resources against expected decline and increases in demand to see how they balance out. What rosy conditions would be needed for SA to bring enough crude to market from these new holes in the near to medium term to either keep the current plateau going or increase output?
"Fort Worth's New Noisy Neighbors: Gas Derricks
Sitting atop a massive natural gas supply, the city is issuing permits for wells in residential areas. Some folks know the drill all too well."
http://www.latimes.com/news/nationworld/nation/la-na-drill5jul05,0,6334374.story?coll=la-home-headli nes
For example; the Venezuela graph on Stuarts current post. JODI states circa 2.9 mbpd at 01/04, while EIA estimate around 2.3 mbpd.
Another example; Here is another graph from Stuart, observe for example EIA and IEA numbers on January 2004 - quite a difference.
Does anyone here know how the data is actually collected? If they were simply collected from the production companies, then one would expect less difference, right?
Building all these rigs uses energy and using them uses even more. When we get to an EROEI of 1 for oil wells then we really are stuffed!
We (Crisis Energética and AEREN) have translated our own Peak Oil Primer to English:
The Oil Peak and the World (pdf file, 2,5MB).
We would be very grateful to hear your opinion about this document, its contents, the translation (is there something that sounds strange), etc.
We intend to print some copies and we would be bringing some of them to ASPO in Pisa, so I would like to hear your opinion before that.
Many thanks and sorry for the off topic!!!
Speaking of new threads, how about you and I square off on a Tainter vs. Diamond view of collapse. I know you're a Tainter fan (as am I), but IMO Diamond knows more, documents better, is smarter, writes better, and is less dogmatic.
Sounds like fun to me! We can each have a few days to prepare our arrows . . .