Pessimists at EIA strike back
Posted by Stuart Staniford on June 7, 2006 - 11:28pm
The EIA's International Petroleum Monthly came out on Monday, but I was out of town so didn't get to updating the plateau graphs until tonight (I build them in part out of the EIA's table 1.4, and in part from the IEA's monthly Oil Market Reports). You'll recall that last time the IEA's optimism about March, and even more heady optimism about April, was causing the moving average graph to lean up a little in the plateau.
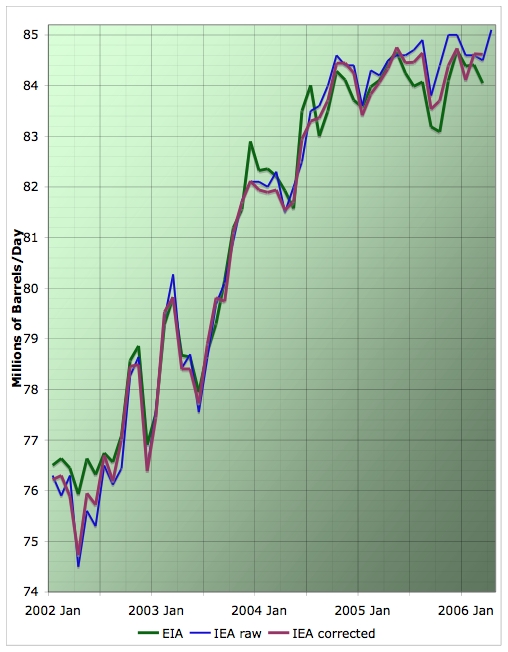
Average daily oil production, by month, from various estimates. Click to enlarge. Believed to be all liquids. Graph is not zero-scaled. Source: IEA, and EIA. The IEA raw line is what they initially state each month. The IEA corrected line is calculated from the month-on-month production change quoted the following month.
The EIA is less excited about March - only around 84.0mbpd, down 400kbpd from February. This also casts doubt on the IEA's April figure, I think, but we'll see in a few days.
Here's the graph of the average of the two with moving averages. It has flattened a shade in light of the latest data point.
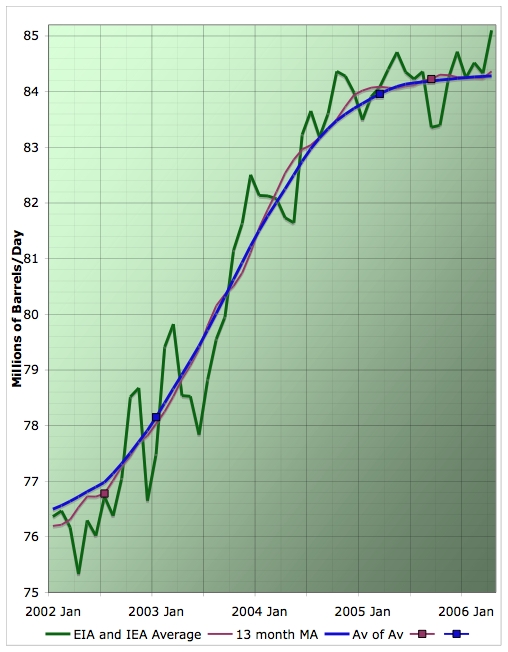
Average daily oil production, by month, averaged from estimates by the EIA and IEA, together with 13 month centered moving average, and recursed moving average of the moving average. The last data point in the monthly data is from the IEA's preliminary estimate alone, and the moving average windows are reduced at the graph edges to only include the data that exists. The squares represent the last point on the correspondingly covered curve where the entire window has full data. Believed to be all liquids. Graph is not zero-scaled. Click to enlarge. Source: IEA, and EIA.
I also draw your attention to this interesting piece at Econbrowser, where Professor Hamilton joins those of us wondering why the Saudi's are claiming they can't find customers so they have to throttle back production when prices have not gone down.
Past coverage relevant to the plateau:
- May IEA Oil Market Report
- OPEC Declines and the World Plateau
- Plateau Continues, Aided by Outages
- Plateau Update
- Cigar Now?
- Missing Barrels
- Close, but no cigar
- November Statistics Updates
- IEA Monthly Report for December
- Refining the Plateau
- Can Acts of God and Bush Explain the Plateau?
- November IEA global production
- Happy Peak Oil Day?
- Where Supply Increases Come From
“Most people spend more time and energy going around problems than in trying to solve them.”
—Henry Ford
Contact
- Content: editors at theoildrum dot com
- Tech support: support at theoildrum dot com
License

This work is licensed under a Creative Commons Attribution-Share Alike 3.0 United States License.
Thanks again.
as for the IEA latest month spike, look at it this way - you were right up until last month where you made the adjustment as an experiment - if it appears wrong to all 3 people who've seen the graph so far (I'm the third), then it is probably better to go back to what had been your SOP when no one was confused by the latest month - whew! - you get my drift? capice?
Just thought you might want to fix this.
can this be right? SA peaked 20+years ago?
Then in the following years production increases from the North Sea and from Africa put Saudi Arabia again on the role of "swing" producer. After 2000 they had periods of poduction as low as 6 MBD.
"the world peaks when SA peaks."
so SA peaked in 1980, then have we already peaked and have been in decline for 26 yrs?
Remmember that a country's production profile can have several peaks. The term 'peak' usually refers to the highest of those peaks.
For instance, the US all-time peak was in 1970, but a new peak was experienced when Prudoe Bay came on stream, this time somewhat lower than the first.
Two peaks:
1980 - 10,21 MBD
2004 - 10,58 MBD
- 2,948 mbpd (from 2,018 mbpd in 1949)
- 3,452 mbpd (from 2,437 mbpd in 1960)
The long term Texas decline rate has been about 4.1% per year, after peaking in 1972. Interesting that the admitted Saudi decline is 5% year over year. It's possible that Saudi production may have been falling for a while, but they decided that they couldn't keep depleting their storage.I'm no expert, but that sure does look like a Plateau...
-C.
If SA is peaking their remaining reserves are likely lower than those of Russia.
By the way this month ASPO's newsletter reassesses SA.
- 1.9% decline
- flat for 20 years before decline sets in at 3%
Really? Plateau for 20 years? Wow...we should be so lucky-C.
Thxs for all the graphs being posted. If one assumes the current SA plateau is due to lots of superstraw tech in numerous small fields/geopockets, along with continued enhancement of the normal secondary and tertiary water-drive tech in the big, old fields: is there anyway to statistically calculate when this plateau will end, and then extrapolate the final SA 'geologic' depletion rate, the overriding assumption being that they are pumping flatout as much as possible to maximize IMMEDIATE economic funds?
Or is it statistically more likely that a 'logistic' plateau/depletion control regimen is being imposed by the Saudis to maximize FUTURE economic returns? In other words, they are going gangbusters to get the infrastructure installed now, but purposely choking back production to retain 'swing producer' pricing privileges over possibly Russia and other countries? Every rig being used in SA is one less that can be used elsewhere; the idea being the less oil the other countries can bring to the market, the more pricing power is retained by the Saudi Princes.
The ideal situation for the Saudis/OPEC would be if they possessed sufficient combined economic/geologic clout to outbid everybody for rigs and other infrastructure, even if the equipment was just parked and not used. By having 'First Mover Status' of fully developing the complete extent of their low-cost extraction system: they can thereby force higher costs to other oil producers and increased profits for themselves while continuing to plateau-choke production for as long as possible.
This strategy should work as long as the Saudis can produce oil vastly cheaper/barrel than any other oil producers. Of course, when ultimate geologic depletion rears its ugly head, this strategy will be much harder to deploy as the extraction price delta/barrel narrows to other producers, but by already having the infrastructure in early and already paid for: the profits will accrue faster to the Saudis.
Bob Shaw in Phx,AZ Are Humans Smarter than Yeast?
Since 1982 that has occurred often, even with decreases year on year (1999, 2002). The thing is crude prices have never been like today during the last 20 years. I don't think anyone is restraining from pumping.
Can deepwater and heavy oil come on stream in time to delay the coming decline?
http://www.energybulletin.net/16902.html
Published on 8 Jun 2006 by Falls Church News-Press. Archived on 8 Jun 2006.
The peak oil crisis: one year in review
by Tom Whipple
Excerpts:
For most of the last year, Saudi oil production has been steady at 9.5 million barrels a day at a time when world oil prices and presumably demand has increased. Recently a firm of "tanker trackers" announced that it looked to them as if Saudi production had dropped to around 9.1 million barrels a day in April and May. The number for April has been confirmed by the Saudis who claims they simply can't find buyers for their oil.
It may be perfectly true that the Saudis can't find a market for some of their oil. A lot of it is difficult to refine and a growing share of the world's oil consumers simply can't afford the going rate these days, even as the richer countries continue to grow nicely. A number of outside analysts are saying that it is just about time for Saudi production to go into decline, perhaps catastrophically. In a year or so, we should know who is right.
It is gospel that when an exporting country goes into depletion they will keep supplying the domestic market first so that their exports will drop much faster than their total production. Moreover, we are starting to hear talk about cutting back on exports just to save it for another day. The message of rapidly rising prices is that an exporter can earn growing revenues and keep more of his oil safely in the ground too, simply by slowing exports. The only obstacles to deliberately slowing exports are long term contracts, other trade relationships, security guarantees, and the fear that they could end up like Baghdad .
So what does the past year tell us? First of all, world oil production has moved up very little. While new wells and new oil fields continue to be drilled, this increased production has been largely offset by hurricane damage, insurgencies, and general oil depletion. The year of peak oil production will be determined by the balance of how fast the drillers can open increasingly more expensive and difficult to drill wells vs. mother nature, insurgents bent on closing down production, and increasing rates of world oil field depletion.
The US and other industrialized countries, most of which are, or soon will be, major importers, are facing the double whammy of rapidly reducing supplies of oil available for import. In the meantime, and for the moment, the worldwide demand for oil, even in the US , continues to increase.
The crash of the Saudi stock market took small investors by surprise. Just curious--do you think that the Saudi insiders knew something that the general population didn't know? I think that the Saudi market is down by 90% or so.
http://www.ameinfo.com/86438.html
Saudi stock market crash a cause for concern
May 20, 2006
Excerpt:
The ruin of hundreds of thousands of small shareholders in the Saudi stock market crash is a worrying development. It is financial catastrophe for those involved, and is already impacting on consumer spending. But the authorities now need to tread carefully to minimize the total economic effect of the crash.
there's little doubt its coming back down hard.
"It was, for example, not uncommon for an investor swept up in the market euphoria to sell all his assets, including his home, car and to borrow from his wife and friends, and then obtain a loan for the same amount from his bank with the collateral as security. Thus a 50% market decline wiped out these assets entirely once the loan was called in."
While its tempting to link everything to peak oil, it's easy to stretch the point.
Granted, just because "B" follows "A" doesn't mean that "B" is related to "A." However, consider the chain of events:
"A"--Saudi stock market drops by 90% of so.
"B"--Saudi oil minister admits that Saudi oil production is down by 5% year over year (which would have been known by Saudi insiders, but not by the small investors).
This article from AlJazeera quotes one saudi web site comment:
"The stock market is creating a rupture in society that will not be easily fixed. We are a people heading for poverty. What do we imagine our situation will be when this boom is over?"
All they need now is for news of a collapse in their oil production and their society will implode.
Excerpt:
"The government and its Capital Markets Authority (CMA) have blamed the crash on wealthy, sophisticated speculators who drove prices to record levels over the past year, then pulled out of the market when the CMA tried to impose order.
"Before, the media raved about teachers and pupils skipping class to track their stock options and mind their portfolios.
"Now, they relate tales of bankruptcy, reclaimed houses and heart attacks in trading rooms."
I doubt that the House of Saud can cling to power for many more years, and if they fall the consequences for international oil supply could be dire. I would expect the US to attempt to intervene at some point in order to secure supplies, but I doubt if intervention would be successful in achieving that goal. More likely it would make a bad situation worse as expensively as possible, as is happening in Iraq.
The fall in emerging markets can be seen as a 'contagion' similar to the 'Asian contagion' of 1998. IMO it is already spreading from the perifery to the centre, hence the recent fall in western markets (the next phase of the bear market that began in 2000 with the dotcom crash). Western investors (especially those who used their homes as ATMs) could soon find themselves in the same position as the Saudis, which could lead to political upheaval in western countries as well. This is why I think it possible (not likely, but possible) that the current American administration may not finish its term.
The House of Saud was installed in charge of the country by Britain after WWI, specifically because it would need foreign support to stay in power (the British govt did this all over the Middle East). After WWII, the US took over from Britain as the imperial overlord in the region and the guarantor of the tenure of, amongst other regimes, the House of Saud.
Because of this, the Saudi government will be cactus in the event of a serious economic crisis. Hold on tight for the Islamic Republic of Arabia.
The official name of Jordan is "The Hashemite Kingdom of Jordan." Arabia could well have been Hashemite Arabia, if Abdul Aziz Ibn Saud had not defeated Sharif Husayn, the great grandfather of present king of Jordan, Abdullah, in 1925. But I agree that once the House of Saud is toppled, it will not be replaced by another dynasty but an Islamic republic.
http://www.sharelynx.com/papers/Souk-al-Manakh.php
When there are folks around with tons of money and time on their hands, these games happen.
The EIA's Short Term Energy Report, which came out Tuesday:
http://www.eia.doe.gov/emeu/steo/pub/
It does not give estimates for the whole world but they do for OPEC (Table 3a). Their estimates for OPEC for April and May, are even more pessimistic than their estimate for March:
http://www.eia.doe.gov/emeu/steo/pub/3atab.html
NEW YORK -(Dow Jones)- The U.S. Energy Administration revised downward its count of Saudi Arabian crude oil production in April and estimates the Organization of Petroleum Exporting Countries produced 29.335 million barrels a day in May.
The revision by the EIA, the statistical and analysis wing of the Department of Energy, comes one day after the disclosure of a decrease in Saudi Arabian oil output in The Wall Street Journal. In an interview, Saudi Oil Minister Ali Naimi said the world's No. 1 oil producer pumped 9.1 million b/d in April. Last month, the EIA said Saudi Arabia produced 9.6 million b/d in April.
In this month's Short-Term Energy Outlook, the EIA said Saudi Arabia produced 9.2 million b/d in both April and May. The April cut to estimates for Saudi Arabia accounted for the downward revisions to April estimates for OPEC with and without Iraq.
Years ago I had a car with a fuel indicator that often was "offline," leaving much for gross calculation and the imagination, and every once and again it would wake up and check in. Having had several early childhood experiences of a parent running out of gas and being 'left behind' as they went to get gas, and then similar experiences as an adult, I suspect there a primal fear of not know ing what's in the tank. This seems to be what the "doomers" - Kunstler, Savinar & Co., tap into. So Stuart's monthly reports, irrespective of how dire, provide a perverse solace.
But production is only one piece of the puzzle, and I recommend checking Khebab's weekly inventory reports and graphs at www.graphoilogy.blogspot.com.
Our government apparently prefers to just stumble and bumble from one crisis to another. Last month we were "addicted" to oil -- this month we apparently our addicted to worrying about gay marriage and flag burning. We obviously would prefer to just lets events shape our month to month behavior without a long term plan with set goals which recognize peak oil and global warming.
When will we get tired of being jerked around by the Saudis? When will we get tired of their games and when will we get tired of guessing what the hell is going on in the oil market?
We can get more control over our destiny by setting a tax on oil that makes high prices permanent. Let the Saudis and others do what they wish as we set on a clear path to alternatives to all this oil. I guess we would rather rant about high prices and how we are going to get them down.
If we knew what was left in the tank, would the tank still be finite as we presume it was before we knew what was left in the tank?
If we knew what was left in the tank, would that save us? Would we suddenly spring into action?
When should we spring into action? When we find out the size of the tank?
Presumably the tank is finite. Presumably acting earlier would be better than later. Why in Buddha's sweet name is this lack of knowledge being used to heap scorn on people who are genuinely trying to wake up the people? Why are people who, I presume, acknowledge the RATHER SIMPLE PHYSICS OF A CONTAINER so damned down on those who would have us prepare as soon as possible rather than later?
So, to use an analogy, we are traveling into the desert. We know there are few water sources out there -- at least not enough to sustain the many people in our party of intrepid explorers. The water we have is scattered in various containers, carried by many different people. We know it is running out. One voice among a few is telling the people they will run out of water and boy will there be problems when that happens. The alpha male control freaks pooh-pooh these "doomers." They say, "They are just using our uncertainty about the situation for their own gain. Let's keep going on this trail."
WHAT FREAKING GAIN?
SAVING AS MANY PEOPLE AS POSSIBLE?
Are you people telling me that should we find out the exact content of earth's fuel tank we will then have infinite oil?
Why is the thinking on this forum so badly damaged?
It is our task to convince them that the tank will run out. And long before it is empty market forces will start to increase the price of oil untill most can't afford it anymore.
<The negative comments about doomers>. I'm sorry but this doesn't look rosy to me, if it does to you then I need to know what you are drinking so I can buy some for recreational purposes. This reminds me so much of Ross Perot and the giant sucking sound - right noise - wrong country(s).
Look at what westexas and kehbab(sp?) post. It doesn't get anymore real than that. Are they promoting thier own books here? I haven't seen that. If thier posts don't scare the shit out of you then I don't know what will.
The world as we know it will change- permanently - it just depends on when and how much suffering will take place. Disagreements to this I find very ammusing (DelusionaL?).
To you anti-doomers. I want you to make me a list of things in your house or activities that you do that do not depend on energy? The correct answer is nothing - food is energy too and your very life is energy consuming no?- Now they want to make your food into fuel to run my car. So tell me then when fuel costs make everything you do more expensive what will you cut down on? And the people whos job it was to provide that item or activity what will they cut back on...and so on and so on. Fuel costs are going to grind the US economy- what the result(s) be? Does this look rosy to you? Tell me why this won't happen "I'm all ears" (RP). I wish it was clear what was going to happen economically here in the US.
You can keep trashing the doomers if it makes you feel somewhat better. I hope for something between the doomers and "keep driving" however "keep driving" looks very slim to me. If we prepare for the doomer side I think that we will come out of this better than if we sit on our collective asses waiting for the statistics.
Severe recession IF we are lucky and start changing NOW !! But a severe recession, or even depression is NOT the end of the world.
MASSIVE human suffering ? Yep !
But that is what I live with everyday here and do the best that I can to help in large & small ways.
I love the society that I am in now, that is the one thing that has improved.
So basically, I am happy and fulfilled amidst the ruin.
While I think you're a bit harsh on the "thinking on this forum", your analogy is excellent - the dispersed nature of the finite resource we're utterly reliant on meaning no one has a clear view of the total supply. Yet the impulse to push on into dangerous territory is strong. Sure, if our supply runs low, we can dig up water-laden roots (biofuels) but those are limited, and we might need the plants themselves for food, so our two greatest needs are in competition. We can condense the morning dew (solar), but that is of course very limited, and cannot itself support the travelling party we've become. Sure, there are doubtless a few hidden trickles (geothermal) but those as well are few and limited in scope. We may find an oasis (fusion) but they're as often as not mirages. And yet, as you say, the groups 'leaders' urge us forward and quell dissent. Thanks for the excellent imagery.
Soon, if the trend continues, we will have to declare the IEA figures no longer an honest contribution to the debate, but a PR fabrication of "Madame Claude" Mandil.
Your pleasure is his business.
For a while, you published a graph to "keep Halfin off my back," but this went all the way back to 1860, which wasn't very useful (IMHO). Although Halfin requested or made a criticism that led to this graph, he never wanted a graph back to the beginning of time. I urge you to publish a graph that goes back about 25-40 years (you pick the timeframe) in conjunction with your 2002-present graph, maybe even in place of it. Such a graph would show that local maxima and plateaus are not unique and have happened several times in the relatively recent past. The present plateau may or may not be the global peak but it must be put into context.
I assume that you have a busy life and are probably not looking for more things to do. I also know that I am (or any other member is) free to contribute such a graph as I am requesting. But I submit that it is your responsibility to do this as one of the editors of this web site, as someone who has developed a great deal of credibility on the subject, and as someone who values objectivity and "permeability to evidence," as you put it so well.
Kind regards.
It's certainly true that local maxima and platueus are not unique; however, IMO declines at or past the 50% of Qt mark are much more significant than declines before the 50% of Qt mark. For example, both Texas and Saudi Arabia showed sizable declines prior to the 50% of Qt mark. However, the decline that counted in Texas was the one after the 50% mark. Mathematically, Saudi Arabia is just past the same point at which Texas production started a permament decline.
In the Khebab & Brown Texas/Lower 48 paper, you can see 21 years of Texas/Lower 48 production compared to 11 years of Saudi Arabia/world production.
Calorie, all other plateaus and reductions in world oil production in the recent past were caused by EVENTS. There was tha Arab Oil Embargo, followed by the Iraq-Iran war. Then there was the collapse of the Soviet Union. And lastly there was the closing of the taps by OPEC in response to the oil glut in the late 1990's and the subsequent opeaning of those taps early in this decade.
This plateau is no different except that the EVENT that is causing it is the peak in world oil production.
Maybe one way to increase transparency without increasing Stuart's work load would be to
I'm tired of having this discussion every month, but I also don't want to put the same old stale information in a post every month. How about this: next time, I'll discuss this contextual history thoroughly, and then in all future plateau posts, there will be a prominent link in large font bold text to that context post. Then can we all agree that anyone who asks about it in future gets told to RTFM if they haven't already done so?
You do link to the data each month. Thank you for doing so, and I apologize for my oversight. I went back to your post and found the raw data under a highlighted link in the first sentence. This data goes back to 1970.
Your idea to make what amounts to a FAQ on the context of the plateau posts is terrific. Making a link to this FAQ a permanent and prominent part of your plateau posts is also a terrific idea.
Explaining, perhaps again (after all, what are FAQs for?), your decision to present data in your monthly chart only from 2002 should be a part of this FAQ.
In making empirical projections, sir, old information is never stale. MK Hubbert's analyses used production date going back decades, did they not?
I can understand why some might say that it is a disservice to your audience to limit your very prominent monthly graph to data only since 2002. Reasonable people might even conclude that to do so is disengenous.
If this is "just another plateau", then why has the market reacted differently to this one?
There have been other geo-political factors during the last 16 years that affected spot prices, but this is the first time that a sustained uptick in the long-term prices has occurred during that time.
If you were a speculator who did not know much about the Oil Industry, would you go long? Or is the next month spot-price likely to be driven by those with less information?
If these long-term prices are driven by people who have more in-depth knowledge of where global Oil Production is heading, then you could say that this collective wisdom is pointing to a bleak future. These are probably the Richard Rainwaters and the T. Boone Pickens types who know a lot more than your average trader.
Anybody got any thoughts on this?
This has saved them over $1 billion.
The Financial VP who argued for this strategy took advantage of a unique employee incentive program at Southwest. Make or save the company a billion dollars and you get to be President !
Note that I was careful not to argue that this is just another plateau. What I said was that the current plateau may or may not be the global peak, but that it must be put into context, meaning shown along with previous local maxima and plateaus. Why? Because I don't believe it is a foregone conclusion that the current plateau is the global peak; I believe that there is considerable uncertainty about that point. Yet the smoothed 2002-to-present graph shows what sure looks like the left-hand side of a bell curve that will soon peak and start declining.
I do remember that price graph from the contango thread and I found it to be a compelling piece of the puzzle. Another graph which I found even more compelling overlaid the price of oil with production. In that graph a drop in price always preceded a flattening or drop in production, except for the current situation, in which a flattening in production has been accompanied by a price rise. That graph was posted originally by Oil CEO and cited by Stuart here.
There has clearly been demand destruction in poorer countries; production would have to be significantly higher than it is now for prices to be at the former 25/b plateau.
What I've found is that when you "zoom-out," the significance of the revisions and "EIA vs.IEA" question dissappear. Besides, history will take the long-term, zoomed-out version anyway.
I'm going to go one step further, at the risk of getting my head bitten off, but I think the two most dissinterested people in the world regarding these numbers are Stuart and myself. I speak only for myself. The longer you stare at these numbers, the more you think they are crap. That may be a psychological problem. I'll only take advice from Stuart on this matter.
This last paragraph is typical of the ones I usually delete. I'll just leave it there. Like by accident.
As I was saying to Westexas, I've got a wee bit of analysis on the numbers that I'm going to throw out there soon, that are not in graph format. I'm still working on how to present the numbers.
Since SA is much farther along the HL decline line that the world is overall, SA serves as an excellent early warning of the world peak. Note that the Energy Bulletin text was written well prior to the Saudis admitting to a 5% year over year decline in production.
It's interesting that some of the most prominent industry proponents of Peak Oil, like Rainwater & Pickens, are coming from Texas. They have seen frantic post-peak drilling programs have no discernible impact on production levels.
You will note that I have been crystal clear in expressing my opinions, based on mathematical modeling, regarding Peak Oil. My question is precisely what point are you trying to make? That short term numbers are meaningless? That the peak is years to decades away? How about the same type of clarity that I have provided?
http://www.energybulletin.net/16459.html
Excerpt:
"In summary, based on the HL method and based on our historical models, we believe that Saudi Arabia and the world are now on the verge of irreversible declines in conventional oil production. While there will be massive efforts directed toward unconventional sources of oil, we predict that unconventional sources of oil will only serve to slow and not reverse the decline in total world oil production."
Not sure who you are addressing that to, but assuming it's me, here goes. My point is that intellectual honesty and good science requires one not to ignore or deemphasize data that undermines a "desired outcome" (or to overemphasize data that supports such an outcome). A "desired outcome" could be, for example, a theory that, for various reasons, one desires to be true.
For example, back in early April, you wrote
Stuart pointed out that you were ignoring refined product imports and only using data from one point in time. I would argue that this overemphasized data that bolstered your case (four week average down 4% year over year) and deemphasized data that did not support your case (counting increasing refined product imports, and using longer time periods for comparison).
Let's update the data. From the EIA table U.S. Total Crude Oil and Petroleum Products Net Imports, in the 22 weeks of 2006, we have had net imports of 274,156 kb compared to 266,754 kb in the first 22 weeks of 2005. This is a 2.8% increase year-to-date. This most certainly does not bolster your net-export-decline theory. Not surprisingly, you have shifted your argument in recent weeks to "we are currently winning the bidding war."
Note that I am not saying that I disagree with your theory; furthermore, I have a great deal of respect for you for being "crystal clear in expressing your opinions," as well as for your general level of activity in this field. But now that your theory is out there, I am looking for intellectual rigor when you cite evidence to support it. Believe me, it will help in your inevitable debate with Michael Lynch, or if you really hit the big time, Daniel Yergin.
First, I was responding to Oil CEO.
Second, in regard to the import question, I did start referencing total petroleum imports. In regard to peaks, we measure the decline from recent highs. Texas peaked in 1972 but the 1973 production was 6.3% higher than the 1971 production. I suppose that in 1973 you would have been criticizing anyone who asserted that Texas production had peaked? After all, 1973 Texas production has higher than 1971.
The March/April anomaly that I was pointing out was that we had falling petroleum imports combined with rising oil prices. The only thing that made sense to me was that we were in the early stages of a bidding war for remaining net export capacity.
Since the March/April decline, total petroleum imports have rebounded--after we bid the price of oil up by 15% to 25%--but that has also coincided with widespread reports of energy shortages and energy riots in poorer countries. Do you think there might be a connection here?
As anyone knows who has signed on more than one time, I have been beating the oil drum so to speak regarding the net oil export question. I predicted, and I still predict, that 2006 will the year when we see severe problems with net export capacity.
Since I started predicting a problem with net oil export capacity, guess what? Saudis have now admitted to a 5% decline in oil production year over year.
We've got 22 weeks of reported total petroleum imports for 2006. Let's look at the four week running average of total petroleum imports for these 22 weeks versus 12/30/05, and let's look at a comparable time period last year versus 12/31/04.
Relative to 12/31/04, 19 of the 22 weeks in 2005 showed higher imports than the four week running average ending on 12/31/04.
Relative to 12/30/5, two of the 22 weeks in 2006 showed higher imports than the four week running average ending on 12/30/05.
Notice a pattern here, especially in light of Saudi Arabia's admission?
Good points. I hope to answer some of these questions later on tonight once I have the data in a form to present.
Of late, I've felt the discussion here about the numbers tells us more than the numbers themselves.
One small example that I want to throw out there before I forget. This is somewhat related. Recently, there has been talk of Russia being past 50% depletion with many important fields being as much as 90% depleted. But look at actual recent Russian production numbers. They've been growing.
At my request, Khebab did some mathematical modeling on this subject. Using only production data through 1984, he used the HL method to predict post-1984 cumulative production. Through 2004, actual post-1984 cumulative Russian production was 95% of what the HL method predicted that it would be. As Russia has gotten closer to the predicted cumulative production, their rate of increase has slowed dramatically.
The same excercise for the Lower 48 showed that post-1970 cumulative Lower 48 production was 99% of what the HL method predicted that it woud be.
The HL method predicted, especially based on the Texas historical model, that Saudi Arabia should start declining.
But I'd like to look at another "trouble spot", Nigeria. This producer is important for two reasons. First, just about everything they have is light sweet crude and second, the market price has been affected by the ongoing rebellion down there.
That said, I just can't make any sense of the production numbers coming out of there. Here's what the EIA has for December 2005 through March 2006.
Then we find here that
Here's some information about the deepwater field Erha.OK, here's my confusion. A look at the EIA historical data reveals that 2.695 is the highwater mark for Nigeria. We can infer from the article cited above that April/May production got down as low as about 2.250/mbd. This is only off 0.445/mbd from the December 2005 all time high. Yet the article says that 0.550/mbd has been shut in since February. This is not reflected in the EIA's March figure and is not consistent with my inferred figures for April and May. In fact, this data shows that production during these months was down about 18% from the February number and 17% from the December number. Standardly, the market reports state that Nigerian production is off about 25%. Using the standard 0.550/mbd number shut-in number cited above, May production should have been 1.860/mpd, about 23% off the February number.
So, comparing to February, what is it? 18%? -- or 23%? As you can see, there is a lot of noise in this data and transparency is virtually nil. Ironically, we've probably got better data for Saudi Arabia than we do for Nigeria. And this makes me wonder generally about the numbers for all of the other producers including my previous story about Venezuela.
Norway May Oil Output Dn to 2.38M B/D
May output was up 158,000 b/d from April production at 2.222 million b/d.
They may also be limiting their production because they can not find a buyer :P