| A Net Energy Parable: Why is ERoEI Important? | The Oil Drum: Net Energy | The Energy Return of Nuclear Power (EROI on the Web-Part 4) |
Unconventional Oil: Tar Sands and Shale Oil - EROI on the Web, Part 3 of 6
Posted by nate hagens on April 15, 2008 - 11:00am in The Oil Drum: Net Energy
This is third in a series of six guest posts by Professor Charles Hall of the SUNY College of Environmental Science and Forestry describing the energy statistic, "EROI" for various fuels. As has been discussed often on this site, net energy analysis is a vitally important concept - just as we primarily care about our take home pay which is our salary minus the taxes, we should care about our 'take home' energy, which is what is left after energy costs have been accounted for. As important as it is, this measure is not easy to quantify, as: a)data is almost always measured in $ as opposed to energy terms, b) parsing non-energy inputs (and outputs) into energy terms is difficult, and c) analysis boundaries (including environmental impacts) are very disparate. As such, there is not (has not yet been) a consistent formula for EROI applied to all energy studies that has led to policymakers and analysts speaking the same language in useful ways. The lead paper in this months Royal Academy of Sweden's journal AMBIO will be about such an EROI framework, and we will link to it when it comes online.
Professor Hall has been working in this area for over 30 years. Below are net energy analysis from Hall's group on the unconventional oil sources from tar sands and oil shaletwo resources that theoretically are enormous in energy scale, but practically are limited by flow rates, costs, and externalities. Just how limited is the subject of todays two-part informative post is below the fold. Remember, any specific numerical help via referenced literature, personal experience or knowledge to better inform Dr. Hall and his students would be appreciated.
Previous articles/commentary from this series:
At $100 Oil, What Can the Scientist Say to the Investor?
Why EROI Matters (Part 1 of 5)
EROI Post -A Response from Charlie Hall
EROI Part 2 of 5 - Provisional Results, Conventional Oil, Natural Gas
APPENDIX D TAR SANDS/OIL SANDS
M.C. Herweyer, A. Gupta
Definition
Oil sands, also called tar sands, consist of bitumen mixed with sand. Bitumen or “very heavy” oil is composed of carbon rich, hydrogen poor, long chain molecules and is in a semi-solid or solid form. It has not been “cooked properly” by geological processes to yield the lighter fractions we call oil. It is familiar to modern humans as the black constituent of asphalt used for roads and shingles. Generally its API (a gravity or density scale developed by American Petroleum Industry) gravity is less than 10 API, and its viscosity is so high that it does not flow naturally (higher than 10,000 cPo) (Briggs 1988). As a comparison, conventional crude oil has an API gravity of about 30-40, and a viscosity of 5 cPo. The product produced by mining and processing tar sands is usually called syncrude (Syncrude is also the name of a company that produces the product).
Distribution and history of use
Bitumen is found more or less wherever petroleum is found, although by far the largest deposits are as tar sands. About 81% of the extractable oil sands of the world are found in Canada (AEUB, 2003). Venezuela also has large resources but it is heavier, of much lower quality and very difficult to extract. The ancient Mesopotamians used bitumen or asphalt as an adhesive in activities from sticking arrowheads on shafts to architecture, although its use was always limited. The oil sand history started with the development of oil sand separation in the 1920s by Dr. Karl Clark. In 1936 Max Ball developed a way to produce diesel oil from it. The actual commercial production started in 1963 when the Sun oil company – later Suncor – started the construction of the first commercial oil sand production plant. The first barrel of commercial production by open pit mining was produced in 1967 (Syncrude 2006). The more complicated in situ techniques started their production of sand oil in 1985. After the rise of crude oil prices in 2003, investments in oil sands production tripled over the years and it has become a booming business.
Technology
The oil sands can be extracted in two ways: open-pit mining for oil sands located on or just below the surface, and in situ recovery for oil sands located underground. About 80 percent of the oil sands are located deeper then 70-80m below surface and some large proportion can be extracted but only via in situ techniques (Mawdsley et al. 2005). The remaining 20% can be extracted by open-pit mining techniques. After the excavation or drilling, bitumen is extracted from the remaining mixture of sand and water. About two tons of tar sands are required to produce one barrel (roughly 1/8 of a ton) of oil. The next phase is either to use hydrogen to upgrade the bitumen to 30o API syncrude, which has a quality comparable to conventional crude oil, or to blend it with higher quality diluents such as conventional oil. Both these products can be refined at existing refineries. An important issue is the degree to which natural gas is required either for process heat or for upgrading the quality and reducing the viscosity of the bitumen.
Surface mining
The only operational Canadian open-pit mining process which excavates the oil sands is the truck and shovel technique. After excavating, the extracted material is treated ex situ (above ground), first in a separation plant and then in an “upgrader” plant. The first step in the ex situ treatment cycle is the sizing process, where the biggest pieces are broken into smaller ones by a crusher. Then the bitumen is separated from the water, sands (quartz), and clays by a water-based conditioning and flotation process (Schramm et al. 2001).
Underground mining
There are four main in situ techniques that can be used for extracting oil sands located deeper than 70–80m below surface. The most common techniques are Cold Heavy Oil Production on Site (CHOPS) and Steam Assistance Gravity Drainage (SAGD). The Cyclic Steam Stimulation (CSS) method was developed and used, but recently proved to be inefficient. The fourth technique, the Toe-to-Heel Air Injection (THAITM) is in a late stage of development and is thought to be efficient and productive. Finally, a pilot project under the name “Orion” run by Petrobank will probably start to produce in 2008. (Petrobank, 2004; NEB, 2006)
The CHOPS process does not filter out the sands at the production wells, but instead pumps the sand fraction up along with the bitumen and water. It is commonly used for extra-heavy oil production but not as much in the production of oil sand (for later separation) because the oil sand bitumen is too viscous to pump using CHOPS.
The SAGD technique uses two horizontal wells. Steam is injected in the upper well to heat the oil sands and lower the viscosity of the bitumen, and the lower well is for pumping out the bitumen. Light crude oils or natural gas are used as solvents to capture the condensates in the steam gas. This process is called Vapor Recovery Extraction (VAPEX) and the Solvent Aided Process (SAP) (Conti et al. 2006, Mawdsley et al. 2005).
The CSS technique uses either one horizontal or one vertical drill to inject steam into the oil sand-field to pump the fluidized bitumen. The cycle starts by pumping in the steam in the steam injection phase and then heating up the viscous bitumen in the soak phase, which takes three to four weeks. Finally, the fluidized bitumen can be pumped up in the production phase. Once this cycle is completed the process starts all over again at a new site.
The THAI-TM technique is a combustion process which uses a vertical air injection well and a horizontal production well. A fraction of the bitumen in place is burned with the inserted air so that the remaining bitumen will warm up and attain a lower viscosity (Mawdsley et al. 2005). The fluidized bitumen then flows down to a collecting pool and is extracted by the production well.
Another method which can be used in combination with one of the above mentioned techniques is the Pressure Pulse Flow Enhanced Technique (PPT). This is not an extraction technique, but one that stimulates extraction. PPT is based on the discovery that large amplitude and low frequency wave energy will enhance flow rates in porous matter (Dusseault 2002).
The next conversion step to obtain syncrude is called upgrading, which typically consists of two steps. The primary upgrading is based largely on “coking” and “catalytic” (hydro) processes by a coker and/or an ebullated bed hydro process. The primary process will crack the larger bitumen into lighter products, but the process will leave a significant amount of sulfur and nitrogen compounds in the lighter products and a secondary process is needed. The secondary upgrading process is based on hydro processing by one or more hydro processing units (Alberta Chamber of Resources 2004). After going through these processes the API gravity is about 30o API. About 1.16 barrels of bitumen and 28 cubic meters of natural gas are necessary to produce 1 barrel of syncrude by this method. Both mining and InSitu operations also use large volumes of water for their extraction process. Between 2 and 4.5 volume units of water are used for the extraction of one volume unit bitumen (National Energy Board 2006). There have been some proposals for the use of nuclear power to provide process heat.
Resource base
According to the Alberta Energy and Utilities Board (AEUB 2003) the initial volume of crude bitumen in place is about 1.7 trillion barrels, which is the total for Canada. About 11% or 175 billion barrels are thought economically available for extraction (National Energy Board 2006), but according to Syncrude (Syncrude 2006), the recoverable fraction could rise up to 315 million barrels with advanced techniques.
Currently 36 different oil sand projects are either already operating or under development in Canada. The smallest production is coming from the projects Great Divide and Halfway Creek, which are run by Connacher and ValueCreation, respectively. Their production capacity is about 10 thousand barrels of bitumen per day (kbb/d) and they both apply InSitu recovery technique. The Horizon mine has the largest production capacity with about 500 kbb/d and is run by the Canadian National Resources Limited (CNRL).
Many of these operations use InSitu techniques despite the fact that open pit mines are easier to initiate. There are three principal reasons to use InSitu:
1: Only 20% can be extracted by an open pit technique, because the rest of the resources are located deeper then 70 meters below surface (too much over-burden).
2: The economic costs of InSitu are marginally cheaper than the open-pit mining. Because the most optimal mining locations are already in use, InSitu will be cheaper for new investments.
3: After the InSitu excavation the product is mainly bitumen (with some fractions of water and aerosols left in), while the excavation product from surface mining is mainly sand with about 10% bitumen. External sand/bitumen separation is necessary, and this is a difficult and expensive process.
The production volume of the oil sands is expected to grow steadily. The production in 2005 was almost 1 million barrels of bitumen per day (Herweyer, 2007). In 2020 the production is expected to be 4.9 million bb/d if there are no major problems such as environmental restraints on production. Despite the fact that only 20% of the total oil sand resources can be extracted by the mining technique, the ratio of mining to InSitu recovery is about 50/50. This is expected to stay approximately equal until 2020 (Herweyer, 2007). Even at 5 million barrels per day or about 1.5 billion barrels per year (representing about 25 percent of current US use) the 175 billion barrels of reserves would last for at least 100 years. The limiting factors, if any, are likely to be not the tar sands but the associated hydrogen, water requirements and environmental impacts. It is likely to be a rate limited, rather than a resource limited, process for some time. A factor that is rarely mentioned is that about half of the increased production is necessary to compensate for the decline of existing conventional wells which were recently the dominant source of oil in Canada.
EROI
Methodology
The issue of EROI is different from most other fuels because the energy source for the process is from the resource itself and it has no other alternative economic uses. This is different from “diverting” energy either from society (e.g. to mine coal or grow a biomass fuel) or from a situation where the energy could be immediately used by society (natural gas used at a petroleum well to run a pump vs being piped to society). The oil sand EROI is calculated by the following formula, although only direct and indirect input energies tend to be used by most analysts:
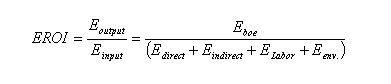
Where: Eoutput = Eboe = Energy content of one barrel of oil equivalent (6164 MJ)
Einput = Total energy input (MJ/boe)
Edirect = Direct energy demand (only the energy flows) (MJ/boe)
Eindirect = Indirect energy demand (e.g. energy to make capital equipment) (MJ/boe)
ELabor = Labor energy demand (Includes labor and maintenance) (MJ/boe)
Eenv. = Environmental energy demand (Kyoto protocol, others) (MJ/boe)
In this case the energy output is relatively simple to calculate as it is equivalent to the energy content of one barrel of crude oil. The energy input, however, is more complicated. We determined the energy content of the different processes involved within the research boundary (extraction, separation and upgrading) separately by a “bottom-up” accounting framework approach. The direct energy is efficiency corrected (i.e. primary electricity is multiplied by three) and calculated in MJ. It is not calculated back to all primary energy used e.g. if diesel was used in the process, the energetic extraction, refinery, and transportation cost of that fuel is not calculated. Rather only the energy content of diesel is used as a parameter. Thus the EROI numbers we generate are conservative (i.e. higher than if more comprehensive boundaries are used).
We determined the indirect, labor, and environmental components of the EROI, used in sensitivity analysis, by calculating the total dollar costs per barrel for each of these sectors (see Figure 2) per boe and then multiplied by the energy value per USD2006. Indirect energy includes capital costs per boe (corrected for the capital recovery factor). Labor includes only the direct labor and maintenance per boe. Environment costs include the CO2 emission trading cost per boe (from the Kyoto protocol) as an indicator for the GHG emission costs, and anassumed socio-environmental costs for the impacts to the direct surroundings.
Results
By our admittedly incomplete calculations the EROI depends mostly upon the direct energy used and which alone suggests an EROI of about 5.8:1(Figure 1). Including indirect energy decreases the EROI to about 5.2:1, and adding in labor and environmental costs have little effect. A comparison with the limited other data out there indicates that our analysis generates a somewhat higher EROI than others (Table 1). Nevertheless it appears that tar sands mining yields a significantly positive EROI.
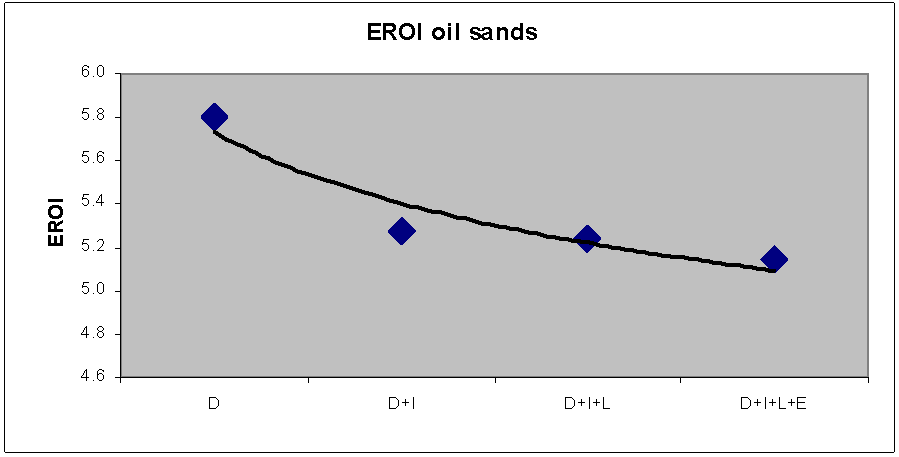
Figure 1: EROI for oil sand production. D represents only the direct energy flows, I represents Indirect energy flows, L represents Labor energy demand, and E represents the Environmental energy demand.
Click to Enlarge.

Table 1: Other Analyses of Oil Sands EROI
Click to Enlarge.
Economics
The average production cost of one barrel of syncrude from the oil sand resources in Canada was approximately 32 USD in the year 2006. The mining process costs about 16 USD2006/barrel of oil equivalent (boe). The InSitu SAGD extraction costs about 14 USD2006/boe, and the upgrading process to syncrude costs about 16.5 USD2006/boe. Figure 2 shows the break down of the total costs that were incorporated in the EROI calculations above (Herweyer 2007). Mining costs appear to be decreasing according to some reports in early 2008.
Syncrude has approximately the same quality as conventional crude oil, and is therefore competitive. So long as the conventional crude oil price stays above 31.5 USD2006/boe (excluding profits) it is profitable to extract oil sands. The conventional crude oil prices in 2006 were 56 and in 2007 as much as $80 USD/boe (BP 2006). However at the same time the price of diesel, natural gas, steel and so forth used in generating the syncrude were increasing. Nevertheless it appears that tar sands will be a competitive source of oil for the indefinite future.
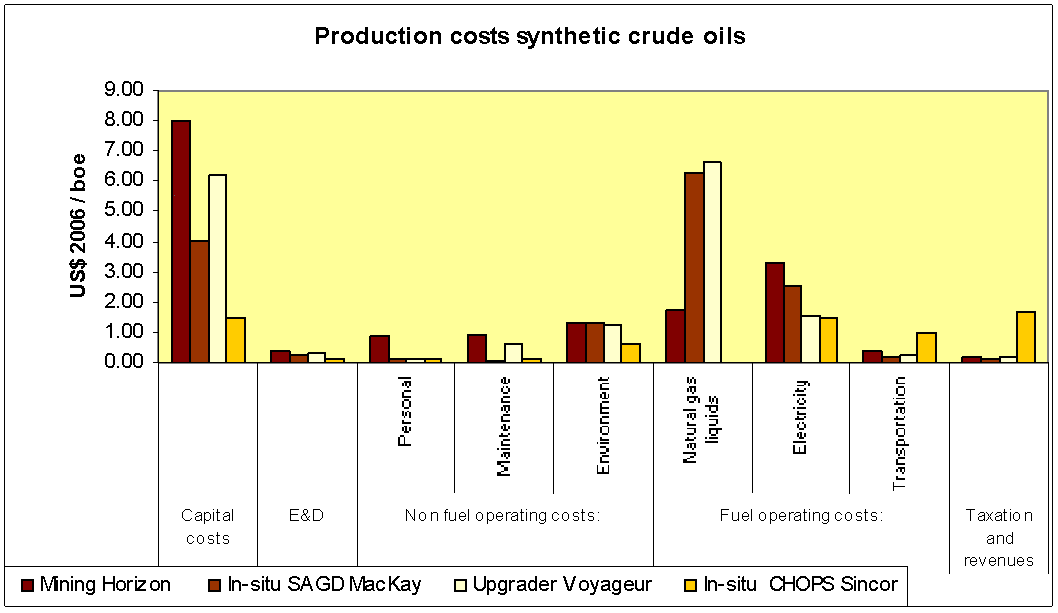
Figure 2: A break down of the production costs of a case study about synthetic crude oils. Note that the mining, InSitu SAGD, and the Upgrader processes are located in Canada and based on Oil Sands, and the InSitu CHOPS is located in Venezuela and is based on Extra-Heavy Oil. The total cost is roughly 32 dollars per barrel of syncrude.
Click to Enlarge.
Capital costs and natural gas liquids are the most monetary cost-intensive inputs of the production of oil sands (see Figure 1). Both these products are also considered very energy-intensive. Therefore the production cost of oil sands is closely related to the costs of energy.
The Alberta oil sands tax regime is such that it makes it very appealing for investors to put their money into oil sands business. The attractiveness in the fiscal regime is that until all original capital (plus a return) is recovered, only a production royalty of 1% of revenue is required. After the original capital is earned back by oil sand recovery, a royalty of 25% of net operating income is required. The tax regime is such that essentially no income tax has to be paid until all capital costs are recovered (TD Securities 2004).
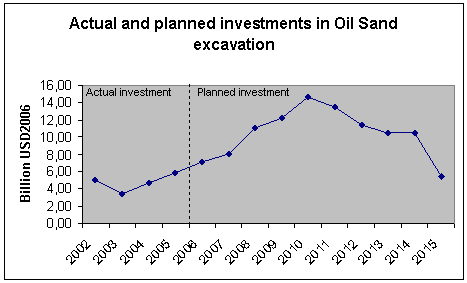
Figure 3: Actual and planned investments in Oil Sand Excavation projects. (Source: NEB, 2006)
Click to Enlarge.
Socio/Environmental aspects
Canada has an open market based economy with favorable conditions for oil sands investments, so that production volume can increase rapidly.
In 2002 Canada agreed to reduce their greenhouse gas emissions (GHG) emissions by 6% compared to their 1990 emissions in the Annex I period of the Kyoto protocol (2008 – 2012). By 2004, however, the GHG emissions had already risen by 28% above 1990 levels (Commission Environmental and Sustainable. 2006). In 2006, Canada declared it could not meet their Kyoto targets and even considered removing policies designed to meet the targets.
The oil sand industry is one of the major GHG emitters in Canada and the entire process approximately doubles to triples the amount of CO2 released per barrel of petroleum used compared to conventional extraction. The mining process emits about 35 kg CO2 equivalent/barrel, and the upgrading process 45 kg CO2 equivalent/barrel, and the SAGD process 55 kg CO2 equivalent/barrel, (Bramley et al. 2005). In the business as usual scenario for the GHG emissions per barrel of bitumen, the total oil sand GHG emissions until 2020 are as follows: (Herweyer 2007).

Greenhouse gas emissions from Candian Oil Sands
Click to Enlarge.
According to the National Energy Board (2006), natural gas use will increase from 0.7 billion cubic feet per day in 2005 to 2.1 billion cubic feet per day in 2015. Although Canada has natural gas resources, this enormous rise in natural gas demand will be difficult to meet. The current capacity of the natural gas infrastructure and production will not be sufficient to keep up with these rises and might present a problem. In addition, the natural gas prices are coupled to the crude oil prices, and so they have risen as well. There is also the large issue of where the natural gas will come from – Exxon is now saying they may not be able to build the necessary MacKenzie pipeline unless they receive significant monetary help from the government.
Both mining and in situ operations use large volumes of water for their extraction process, between 2 and 4.5 volume units of water is used for the extraction of one volume unit bitumen (National Energy Board 2006). Currently the mining operations are licensed to divert 370 million cubic meters (equivalent to 2.3 million barrels) of fresh water per year from the Athabasca river. The planned mining projects will push the cumulative diversion with 529 million cubic meter (3.3 million barrels) per year (Alberta Environment 2006). Almost all process water ends up in tailing ponds.
Besides the fresh water diversions, the mining operations have a direct effect on the ground water level. Mining pits are excavated up till 70-80m below ground level, which is often below natural ground water levels as well. To prevent water flowing into the mining pit, the groundwater has to be controlled by pumping it up. As a result, the groundwater level of the surroundings is lowered, and the flows are disturbed.
In Canada the most common in situ technique is SAGD, which uses steam to extract the bitumen. This process requires a large amount of water. Although most in situ projects try to reduce fresh water use by mixing with saline groundwater, and recycling about 90 to 95% of the used water, the amount of diverted fresh water is relatively high. In 2004 the in situ projects used 5 million cubic meters (31.5 million barrels) of fresh water, and this will grow to 13 million cubic meters (81 million barrels) in 2015 (National Energy Board 2006).
The gaps that the mining pits leave behind are of such an extent that you can see them clearly in satellite pictures from space. The surface sizes disrupted are enormous.
The decline in unemployment, the increase in prosperity, and the independency in liquid energy supply are positive (economical) social effects, although they are also associated with the familiar issues of boom towns associated with alcohol and sometimes family disruptions.
CONCLUSION
In conclusion, tar sands are an economically and energetically viable, although hardly ideal, approach to maintaining liquid fuel supplies. The most severe problem is probably their local and global environmental impact, and they are already impacting Canadian CO2 releases significantly. But the tar sands are unlikely to make a large impact on overall supply of liquid fuels because their supply is likely to be rate, rather than total resource limited. If the maximum rate were to grow to about 2 billion barrels a year this would approximately meet Canada’s demand and could leave relatively little for export if Canada’s production of conventional oil continues to decline. Achieving even this rate of production from tar sands is uncertain because of growing concerns about environmental impacts downstream and insufficient hydrogen and water.
References
Alberta Chamber of Resources, Oil sands technology roadmap; unlocking the potential, Edmonton, Canada, 2004
Alberta Energy Utilities Board (AEUB), Alberta´s reserves 2003 and Supply-Demand outlook 2003 – 2013, Calgary, 2003.
Brandt, Adam R. 2007. Converting Green River oil shales to liquid fuels: with the Albert Taciuk processor: energy inputs and greenhouse gas emissions. Working Paper Energy and Resources Group, Univ. California Berkeley.
British Petroleum, BP statistical Review of World Energy June 2006.
Briggs, P., Development of heavy oil reservoirs, Journal of petroleum technology, 1988
DOE. 2006. Office of Petroleum Reserves – Strategic Unconventional Fuels. Fact Sheet: Energy Efficiency of Strategic Unconventional Resources.
Dusseault, CHOPS; Cold Heavy Oil Production with Sand in the Canadian heavy oil industry, Alberta department of energy, Waterlo, Canada, 2002.
Günther, F. 2008. EROI.
Heinberg, R. 2003. The end of the oil age. Earth Island Journal, Fall 2003 Vol. 18, No. 3.
Herweyer, 2007. Independent analysis.
Homer-Dixon, T. 2006. The End of Ingenuity. The New York Times, Published: November 29, 2006, Toronto.
Kymlicka, W. 2006. Panarchy and dystopia. Toronto Globe and Mail, November 11, 2006.
Legislative Peak Oil and Natural Gas Caucus. 2007. Peak Oil Production and the Implications to the State of Connecticut: Report to Legislative Leaders and the Governor. Representative T. Backer, Senator B. Duff et al. December 2007.
Mawdsley et all, The oil sands of Canada, Equity Research Canada, Ramond James, 2005
National Energy Board, Canada’s Oil Sands: Opportunities and Challenges to 2015, Calgary, 2006.
Petrobank, White sands, 2004
http://www.petrobank.com/webdocs/whitesands/thai_media_hotabout_mar04.pdf
Schramm, LL., et all, The Influence of Interfacial Tension in the Hot Water Process for Recovering Bitumen From the Athabasca Oil Sands, Petroleum society, Calgary, 2001
TD Securities, Overview of Canada’s oil sands, 2004
Sereno, M. 2007. Peak Oil: Putting Teeth into Sustainability or Mother Nature Bats Last. Cognitive Science, University of California, San Diego. (original talk, November 2004 most recent update, September 2007).
Swenson, R. 2005. Net Energy Next Energy. ASPO-USA.
Syncrude website 2006.
TD Securities, Overview of Canada’s oil sands, 2004.
APPENDIX E. Shale oil
Oil Shale: Potential, EROI and Social and Environmental Impacts.
Gupta, A.K., M.C. Herweyer, and C.A.S. Hall, SUNY-ESF, Syracuse NY.
Definition
Oil Shales are sedimentary rocks containing a high proportion of organic matter, called kerogen, which can be converted to synthetic oil or gas by industrial processing (WEC 2007). According to the Encyclopedia of Energy (Cleveland 2004), oil shale is defined as fine grained sedimentary rocks containing organic matter (kerogen) that yield abundant amounts of oil and gas upon destructive distillation. Although various definitions of oil shale exist, one usual factor is that the kerogen can conceivably be converted into fuel economically, which implies a yield greater than some threshold value, usually in the range of 100-125 l/Mg (1 bbl = 159 L;1 Mg = 1 metric ton rock ) (Burnham 2003). Oil shale recovery is a more difficult process in general than is tar sand recovery because the kerogen bonds more closely to the surrounding substrate.
History
For the U.S., the deposits of oil shale were first studied in detail by the USGS in the early 1900’s, after which the government established the Naval Petroleum and Oil Shale Reserves in 1912 that for much of the 20th century served as a contingency source of fuel for the nation’s military. Thus oil shale was originally envisioned as a way to provide a reserve supply of oil to fuel U.S. naval vessels (WEC 2007). Its development had always been on a small scale, but the project that was to represent the greatest development of the shale deposits began immediately after World War II in 1946 when the U.S. Bureau of Mines established the Anvils Point oil shale demonstration project in Colorado (Ibid). However, the project ended after it was deemed uneconomical since processing plants had been small and the cost of production high (Ibid).
The most recent attempt at recovering oil from oil shales occurred in response to the Arab Oil Embargo in 1974. Congress responded with a Proposal for Northwest Colorado to be declared a ‘‘National Sacrifice Area,” including an Energy Mobilization Board with power to override federal, state and local environmental and land use laws (Committee on Resources 2005). This board never materialized. However, President Jimmy Carter did get Congress to establish the Synfuels Corp. with $15 Billion in price guarantees and incentives (Ibid). The goal for synthetic fuels was an industry that would convert coal, tar sands, and oil shale to liquid fuels at two million barrels per day by 1992, the majority of which would come from Western oil shale (Ibid). Costs were at an average of $2 billion (1980 USD) for each 50,000 BPD (barrels per day) plant (Ibid). In the end, the oil shale industry collapsed; specifically, due to the huge volumes of material that needed to be removed and processed, the drop in world petroleum prices with which it competed, and the lack of a consistent national vision for the development of the resource that could focus private capital investment (Ibid; Hirsch, Bezdek, and Wendling 2005; US DOE ONPOSR 2004). Congress then shut down virtually all oil shale research programs, despite recommendations from many sources that research and development activities continue. In 1991, the Unocal operation in Colorado was the last major oil shale project to suspend operations (Cleveland 2004). For many, the argument about energy was “let the market decide.”
Similarly, production from oil shale deposits in South-Eastern Australia began in the 1860’s; coming to an end in the early 1950’s when government funding ceased (WEC 2007). However, due to a modern exploration program at the Stuart Deposit, it was announced in May 2001 that the first shipment of over 40,000 barrels (5,800 tonnes) of medium shale oil had been made to the south-east Asian fuel oil market (Ibid). That project is currently suspended (Hirsch, Bezdek, and Wendling 2005), and major long-standing shale oil production operations in Estonia, Scotland, Sweden, Canada and China are either gone or dwindling due to high costs relative to petroleum crude oil (Burnham 2003; Cleveland 2004).
Technology
Kerogen is extracted from oil shale in a process called ”retorting” which requires heating of the rock to about 900 degrees Fahrenheit. Two generic methods of retorting have been developed which are given here verbatim from the Committee on Resources (2005):
In situ (ICP): This method leaves the rock in place and injects a heat source that releases the oil from the kerogen. The shale oil then flows to a well and is pumped to the surface. The source of the heat is a technical issue still open to research and testing. The only active pilot project in the U.S., owned by Shell Oil, is using down hole electric resistance heaters, but optional technologies involve steam, microwaves, and fire.
Surface retorting: This technology depends upon mined ore for a feedstock. The ore can be either surface mined or mined underground. The ore is brought to a surface facility, crushed and placed into a retort. The shale oil is removed and the spent shale sent for disposal. The shale oil is upgraded by the addition of hydrogen and then is refined conventionally to produce finished products. Several different retort designs have been constructed and tested in the United States as a part of earlier development efforts.
Oil-Tech (OT) currently operates a small capacity, commercial retort in eastern Utah. Their retort has a capacity to process 1 ton of oil shale per hour. On average, one ton of oil shale will produce one barrel of shale oil. The proprietary retort produces 30 degree API gravity oil with a pour point of 53 degrees Fahrenheit (Ibid). After approximately 6 hours of operation, there is sufficient spent shale to enable co-generation so that every 60 minutes approximately 41 tons of 2,500 degree Fahrenheit spent shale is produced – representing a large amount of embodied heat energy potentially useful for other tasks (Ibid).
Also, an experimental “hydroretort” has been designed to operate under a hydrogen atmosphere at higher pressures which increases yields for some oil shale deposits by 200% or more compared to the Fischer assay (a standard laboratory method of determining the quantity of synthetic oil that a sample of crushed oil shale will produce) (Cleveland 2004). However, from an environmental point of view, in terms of topography alteration, water consumption, and greenhouse gas emissions, and despite the significant research and development work conducted 20 to 30 years ago, the industry has not yet reached a consensus on the best technology to use (Committee on Resources 2005).
Finally the Ratheon Company, which had invented microwave ovens, has put forth a plan to use microwaves in situ to cause the oil to flow from rocks in which they are found and into collecting basins. It is not known at this time whether this will work in the field but early results are promising.
Resource base
Oil shale exists worldwide and occurs in nearly 100 major deposits in 27 countries (US DOE ONPOSR 2004), including in Australia, Brazil, Canada, China, Estonia, France, Russia, Scotland, South Africa, Spain, Sweden and the USA (Table 1). However, despite periodic predictions that shale oil would soon be needed to replace diminishing crude oil supplies, shale oil production has actually dropped threefold since 1980 (Figure 1; Burnham 2003).

Table 1. Reserves and distribution data on oil shales (from Jiang Han and Cui 2007)
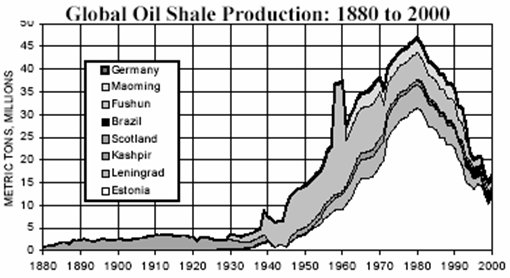
Figure 1.Global oil shale production 1880-2000. (from Cleveland 2004).
As can be seen in the case for U.S., there is a large difference in the quality of the oil shale from place to place (Figure 2). On the high end, commercial grade oil shale from the Green River Formation in Colorado assays at about 0.83 U.S. barrel of oil per short ton of rock (Cleveland 2004). Most other oil shales give lower yields.
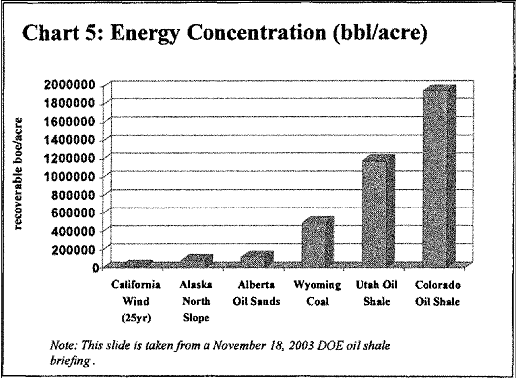
Figure 2. Energy concentration, in barrels per acre thermal equivalents, for various Western fuels. (from Committee on Resources 2005)
In the U.S., shale oil resources might be almost as large as the world’s remaining conventional oil resources (US DOE ONPOSR. 2004). However, although it is enormous, the main issue is how rapidly this resource can be brought online, especially given water, environmental, and infrastructure constraints. One estimate is that U.S. domestic production of 2 million bbl/day could be possible by 2020 if a new generation of oil shale projects is realized by 2011 (Ibid). However, due to the existence of sensitive Federal lands in the region, such as national parks and forests, oil shale development may be heavily regulated for air emissions, which could constrain the size of the industry and its development (Ibid). A critical issue is the availability of sufficient water, as production and refining of the oil shale is extremely water-dependant. In most areas and schemes a lot of water would have to be pumped uphill significant distances.
Another issue is the capital and the time required to construct facilities. Investment decisions are typically made with 10-year internal rate-of-return calculations, while the resource base supports a physical life of 40 years or more, and so large government subsidies may be needed if capital is to be raised quickly (Ibid). Currently, Shell hopes that first generation commercial start up will occur early in the next decade; however, it will take many years beyond that for the product stream to reach steady state production and profitability (Ibid). Encouragement might be taken by the continued increase in the price of conventional oil, or discouragement from the fact that many huge investments have been made in the past with little oil to show for it, then or now.
EROI
Reported EROIs (energy return on investments) are generally in the range of 1.5:1 to 4:1, with a few extreme values between 7:1 and 13:1. The main difference between oil sands and oil shale is that the oil sands are particles of sand, surrounded by a microscopic layer of water that is itself surrounded by heavy bitumen (thick oil). Separating the oil from the oil sands is much easier because of this water layer, since the oil is ‘‘suspended’’ in the water/sand layer and not directly stuck on or in the sand as is the case for oil shale. This makes oil shale much more energy intensive to separate (Ibid). As such, shale oil production - whether through surface retorting or ICP - is more energy-intensive than conventional oil production or from tar sands, and even enhanced recovery from oil fields. In fact, upstream energy consumption per unit of final fuel delivered is roughly 1.75-2.75 times that of conventional petroleum production (Brandt 2007). Tar sands and oil shales seem to be in the same “EROI ballpark”.
Shell reports that in their ICP in situ process they consume 1 Btu for every 3 Btu’s of energy produced, corresponding to an EROI of 3:1 (Ibid). However, if the energy input is electricity and the output oil this would imply a quality-corrected EROI of close to unity. On the other hand the utilization of natural gas produced during the ICP in-situ process doubles the energy efficiency to 6 Btu of energy produced for each Btu consumed corresponding to an EROI of 6:1. In addition shale oils are a special case, like tar sands, where a large proportion of the energy can be generated from the resource itself (Ibid).
For the mining and retort process, the net energy return (NER) is very low if total energy inputs are counted (NER < 1.5) (Brandt 2006, 2007). In a more recent study, Brandt concludes that the EROI for shale oil production using an ATP retort (a method reported to have the highest conversion efficiency – 88%) is somewhere between 1.9 and 2.5 (2007). However, based on a study in Kentucky USA, if some of the measurable environmental costs associated with shale oil production are included, the EROI drops another 3-9% (Lind and Mitsch 1981). Furthermore, Cleveland concludes that the EROI for shale oil ranges above and below the break even point, depending on assumptions regarding location, resource quality, and technology characterization (2005). The use of microwaves, an old technology with new enthusiasts behind it, supposedly would generate higher EROIs but there have been studies of this yet in actually field conditions.
Meta-analysis of Oil Shale EROI Studies
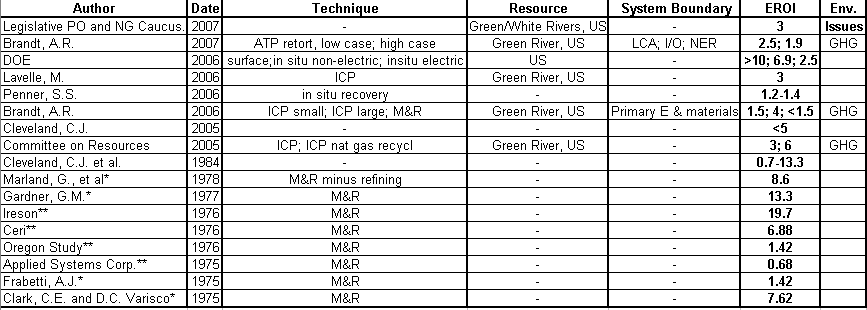
* Citation available in accompanying bibliography
** Taken from: Hall, C.A.S., C.J. Cleveland, and R. Kaufmann. 1986. Energy and Resource Quality: The Ecology of the Economic Process. John Wiley & Sons, Inc. 1986: p221-228.
Click to Enlarge.
Socioeconomics
The useful oil that is obtained from retorting oil shale is synthetic crude which, like petroleum crude oil, requires refining to produce transportation fuels, heating oil, asphalt, and other petrochemicals. It can also be burned directly as a low-grade fuel for use in electric power plants, or in the manufacture of cement (Cleveland 2004).
The economics of shale oil production are largely dependent on the methods used. For example, cost per barrel of oil production/retorting is $8 USD when utilizing purchased electrical heat. However, it decreases to $4 USD per barrel when using cogenerated heat. This cost considers only retorting and does not consider mining. Mining costs range from $6-22 USD per ton depending on the development stage of the mine and the type of equipment utilized. Accordingly, OT’s technology and processes can produce one barrel of shale oil at approximately $9.60 USD per barrel in the best case scenario and approximately $30 USD per barrel in the worst case scenario (Ibid). The calorific value of oil shale is very low - 8.8 MJ/kg if compared to other fuels (18–30 MJ/kg for coal, 19 MJ/kg for wood and 45 MJ/kg for light crude) (Talve and Riipulk 2001). The energy content of the final product however is similar to crude oil. A problem that is obvious from the data is that shale oil is always waiting for oil to reach a given price level at which point it will become economic. But as that price is reached and surpassed (even over time by a factor of ten) it remains uncompetitive because the cost of the extraction and processing has increased (Hall et al. 1986). The problem here as with many other alternatives to what we do today, is that as the price of oil (or fossil fuels more generally increases so does the price of everything made directly or indirectly with oil, which is essentially everything from steel to chemicals to water to labor.
In the U.S., a large-scale commercial oil shale operation could have a significant impact on any nearby communities, the extent of which depends on the existing infrastructures and many other factors. As such, in a case where shale oil development overlaps an area with increasing tourism and recreation opportunities and an expanding urban population, on top of this existing network of energy development and changing land uses it is likely to put much more pressure on an already fragile ecosystem and public temperament (Committee on Resources 2005). An important issue is that most oil shales exist in areas very far from any infrastructure (housing, water, schools and so on) so that either very large daily transportation would be needed or whole new towns would need to be constructed.
At one time the prospects for oil shale in Australia seemed rather bright, and in the same issue (March 1998) of Scientific American that published the important paper “The end of cheap oil” by Colin Campbell and Jean Laherrere they also published, almost as an antidote, the optimistic "Mining for oil" by Richard George, head of the Suncor Corporation. George wanted to apply the Canadian tar sands technique, operational at that time, to oil shale. He wrote “a whole new oil shale industry could develop in Australia over the next decade. So as production from conventional oil fields dwindles, oil shale and oil sand reserves may well become a major source of energy in the century to come. According to Laherrere (personal communication) “It is obvious that George combines in the same article thinking on ‘oil sands’ and ‘oil shales.’ Although both are commonly mined and need to be heated in giant drums, they have completely different origin and expulsion. Bitumen (oil sands) are mainly degraded oil fields, as the end of the process before being completely eroded while oil shales are immature source-rock where oil has not yet been generated. They require pyrolysis at over 500°C to generate oil: there is no way that you can do it in a washing machine as Clark did it in 1920 for oil sands where you need only temperature well below 100°C. The economics are also quite different. It should be stated that there are very different birds! And although Suncor spent $150 M to build the retorting plant in Australia they dropped the plant and wrote off their investment after failing to get a steady phase 1 production level of 4000 b/d. Their Australian partners were bankrupted, and the project has been idle since 2004! Mining oil shale is recognized as a poor project now and the goal is in situ pyrolisis by heating the source material with electric heaters while freezing the material around the material being heated to prevent the polluted water to leave. But Shell will not decide before 2012 if they will build a commercial pilot. The USDOE is forecasting no oil shale production before 2030.”
Environment
At present, the environmental impacts of shale oil production seem large. Oil shale is usually mined and so there are surface impacts; however, the Shell ICP process may be able to reduce surface impacts by up to a factor of ten (US DOE ONPOSR. 2004). Production is water intensive, which is an important limited resource in the dry U.S. regions with large oil shale deposits (Committee on Resources 2005; Veil and Puder 2006). It is thought to require 1 or 2 barrels of water for every barrel of oil produced, where two-thirds of that water is dedicated to human resources, supporting people and infrastructure around production (Committee on Resources 2005; US DOE ONPOSR. 2004).
The retorting processes are energy-intensive and there are also combustion emissions in areas where the air is currently very clean (Ibid). The mining or in situ technologies also disturb the local water tables. In the case of the in situ technology, the spent shale in place may contain toxins that need to be kept away from ground water; however, Shell has developed a “freeze wall” (maintained with in situ freezers running on electricity) designed to isolate the process from local ground water (Ibid). In the case of surface retorting, the spent shale, processing water, and other byproducts must be disposed of in a safe manner.
The spent shale represents a particular problem because it takes up considerably more volume than the original rock, up to 30% more (US DOE ONPOSR. 2004), and therefore affords a greater opportunity for infiltration by both precipitation and groundwater (Veil and Pruder 2006). How to achieve disposal on a massive scale has not been defined (Committee on Resources 2005). Furthermore, in the case of the Colorado River watershed, salinity is a major concern and eliminating it is one of the key goals of the Bureau of Reclamation, however, oil shale production would contribute to increased salinity (Veil and Pruder 2006).
Assuming fossil fuels are used to provide the energy input for shale oil production, the net greenhouse gas impact of developing oil shale resources can also be assumed to be substantially higher than the per-unit impact of conventional oil production. Brandt found that the Shell ICP production process has GHG emissions that are similar to those from tar sands production in Alberta; and that the mining and retorting process has emissions significantly in excess of synthetic fuels produced from coal and over 4 times the emissions from conventional oil (Table 2).

Table 2(from Brandt 2007).
Click to Enlarge.
According to Brandt, if shale oil is produced, refined, and combusted at a rate equal to 10% of 2005 U.S. gasoline consumption the full-fuel cycle emissions increase relative to conventional oil would be about 45 million tons of carbon to between 68 and 74 million tons of carbon (2007). Furthermore, it has been found that Estonian oil shale extraction causes surface subsidence when mining activities cease which leads to the formation of bogs, rendering agricultural areas unusable, and the death of forests (Talve and Riipulk 2001). Other concerns include sulfur-gas emissions, high CO2 release per barrel of oil for modified in-situ processing, disturbance of topography, water consumption, and degradation of ground-water quality due to mobilization of organics and inorganics in the spent shale. Such environmental concerns played a major role in the death of the U.S. federal oil shale research program in 1994 (Burnham 2003).
CONCLUSION
In conclusion, although shale oils represent a huge potential resource they have a history of “always a bridesmaid and never a bride” because as prices for oil increase the prices for extracting shale oil have increased as well. This history represents the very real problems of generating a useful product from the resource. The main problems include the distance of the shale from both the water and labor needed to extract it, the large environmental impact compared to conventional oil and the relatively low EROI . In addition, with both shale and tar sands there is some disagreement whether the in situ should be charged as an energy opportunity cost, (in the same sense that bagasse could be in sugar cane ethanol). Ultimately, the question is, if conventional oil becomes very scarce whether a resource such as shale oil will be developed regardless of cost.
References
Brandt, A.R. 2006. Net energy and greenhouse gas emissions analysis of synthetic crude oil produced from Green River oil shale. Energy and Resources Group Working Paper, University of California, Berkeley: August 2006.
Brandt., A.R. 2007. Converting Green River oil shale to liquid fuels with the Alberta Taciuk Processor: energy inputs and greenhouse gas emissions: working paper. Energy and Resources Group, University of California, Berkeley: June 1, 2007.
Burnham, A.K. 2003. Slow radio-frequency processing of large oil shale volumes to produce petroleum-like Shale oil. Lawrence Livermore National Laboratory, Livermore, CA: August 20, 2003.
Cleveland, C.J. ed. 2004. Encyclopedia of Energy: Me-Pe, vol.4. Elsevier Academic Press, Elsevier Inc., California, 2004: p739-752.
Cleveland, C.J. 2005. Net energy from the extraction of oil and gas in the United States. Energy, 30:769-782.
Cleveland, C.J., Costanza, R., Hall, C.A.S., Kaufmann, R. 1984. Energy and the U.S. economy: A biophysical perspective. Science, New Series, Vol. 225, No. 4665 (Aug. 31, 1984), 890-897
Committee on Resources, U.S. House of Representatives. 2005. The vast North American resource potential of Oil shale, oil sands, and heavy oils, Part 1 and 2: Oversight hearings before the Subcommittee on Energy and Mineral Resources of the Committee on Resources U.S. House of Representatives One Hundred Ninth Congress, First Session, June 23, 2005 and June 30, 2005. Serial No. 109-22. U.S. Government Printing Office: Washington, 2005.
DOE. 2006. Office of Petroleum Reserves – Strategic Unconventional Fuels. Fact sheet: Energy efficiency of strategic unconventional resources.
Farrell, A.E., and A.R. Brandt. 2006. Risks of the oil transition. Environ. Res. Lett. 1 (October–December 2006).
Hall, C.A.S., C.J. Cleveland, and R. Kaufmann. 1986. Energy and Resource Quality: The Ecology of the Economic Process. John Wiley & Sons, Inc. 1986: p221-228.
Hirsch, R.L., R. Bezdek, and R. Wendling. 2005. Peaking of world oil production: Impacts, mitigation, and Risk management.
Jiang, X.M., X.X. Han, and Z.G. Cui. 2007. New technology for the comprehensive utilization of Chinese oil shale resources. Energy 32 (2007) 772–777.
Lavelle, M. The oil rush. U.S. News and World Report, April 2006.
Laherrère J.H. 2005. Review on Oil Shale data. September 2007. www.hubbertpeak.com/laherrere/OilShaleReview200509.pdf
Legislative Peak Oil and Natural Gas Caucus. 2007. Peak oil production and the implications to the State of Connecticut: Report to Legislative Leaders and the Governor. Representative T. Backer, Senator B. Duff et al. December 2007.
Lind, C.G. and W.J. Mitsch. 1981. A net energy analysis including environmental cost of oil shale development in Kentucky. In W.J. Mitsch, R.W. Bosserman, and J.M. Klopatek (Eds.), Energy and Ecological Modelling. Elsevier Scientific, Amsterdam, p689-696.
Penner, S.S. 2006. Abiogenic or biogenic petroleum. Center for Energy Research, Department of Mechanical and Aerospace Engineering, University of California San Diego.
Talve, S., and V. Riipulk. 2001. An inventory analysis of oil shale energy produced on a small thermal power plant. Journal of Cleaner Production 9: 233–242.
US DOE ONPOSR. 2004. Strategic Significance of America’s Oil Shale, Vols I and II. March 2004.
Veil, J.A., and M.G. Puder. 2006. Potential ground water and surface water impacts from oil shale and oil sands energy-productions operations. Ground Water Protection Council, Oklahoma City, OK: October 2006.
WEC. 2007. Survey of Energy Sources: Oil Shale. World Energy Council:
Contact
- theoildrumeroi at gmail dot com
Personnel
Archives
- October 2010 (1)
- September 2010 (1)
- August 2010 (1)
- July 2010 (1)
- June 2010 (1)
- April 2010 (1)
- March 2010 (2)
- January 2010 (1)
- July 2009 (1)
- June 2009 (1)
- May 2009 (2)
- April 2009 (1)
- March 2009 (1)
- February 2009 (1)
- January 2009 (2)
- December 2008 (1)
- November 2008 (1)
License

This work is licensed under a Creative Commons Attribution-Share Alike 3.0 United States License.
At a couple of points, hydrogen was mentioned as limiting resource for InSitu tar sands processing; which techniques use hydrogen gas, or was this meant to refer to the hydrogen content of the bitumen?
Its used for hydrogenation which is capping the ends of broken carbon chains. The primary source is methane.
http://members.aol.com/profchm/Petroref.html
http://en.wikipedia.org/wiki/Steam_reforming
After contemplating synthesized crude oil ("syncrude") from kerogenous dolomitic limestone ("oil shale") since 1968, I believe the shortest and most appropriate conclusion I have reached is: "Halitosis is better than no breath at all."
Except perhaps to the people and ecosystems around you that have had more naturally successful dental plans....
"Halitosis is better than no breath at all."
This is an example of the logical fallacy "False Dilemma"; no breath assumes death if the action isn't taken (which is false), and halitosis is a term that simply suggests harmless unpleasantness, downplaying the real harm from climate disruption, pollution, and resource depletion.
Perhaps a more appropriate, though much less succinct, metaphor may be;
"Using tar sands and oil shale as energy sources while ignoring climate disruption, air pollution, water pollution, resource depletion, and conservation measures is like pissing in the wind."
Or better yet:
"Clean teeth trump halitosis any day."
Canadian Natural Gas Realities.
Natural Resources Canada last week published the December 2007 production numbers (and the February wells completed data). In 2007, production of marketable natural gas dropped by 2.4% from 2006, and is down by 6% from its 2002 peak. The number of well completed in 2007 was down by 22% from the 2005 peak and the trend is accelerating. For the months Nov 2007 to Feb 2008 compared to the same period one year earlier, the number of well completions dropped by more than 33%.
People following this issue will note that the recently announced drilling incentives from the Alberta government apply exclusively to deep natural gas drilling. I think this suggests that industry and gov't officials know that the 'shallow' gas plays which have accounted for so much new production in recent years is about done.
I wouldn't count on tar sands production ever making 2 billion barrels per year.
http://www2.nrcan.gc.ca/es/erb/prb/english/View.asp?x=449
Canada has had several new natural gas finds that seem to more than double the 57 trillion cf of reserves previously recorded. Plus some of the oilsand methods are burning some of the oilsands to get the rest flowing (THAI/Capris)
http://www.journalofcommerce.com/article/id27093
Bruce power has applied to build 4 nuclear reactors in Alberta (4000MW)
First power could be 2017.
http://www.bloomberg.com/apps/news?pid=20601082&sid=akvrYI_jxuEY&refer=c...
April 8 (Bloomberg) -- Apache Corp., the U.S. oil and natural-gas company that has almost a quarter of its reserves in Canada, said three shale gas wells began production in British Columbia in the western part of the country.
The company said its stake in Ootla, about 60 miles from Fort Nelson in northeastern British Columbia, may hold 9 trillion to 16 trillion cubic feet of gas. Horizontal wells test flowed at rates of 8.8 million cubic feet, 6.1 million cubic feet and 5.3 million cubic feet of gas a day
This natural gas plus the Montney find in BC (50-80 trillion cf) and the Horn River basin.
http://nextbigfuture.com/2008/04/some-natural-gas-and-oil-plays.html
BC makes it easier to exploit natural gas
http://www.theglobeandmail.com/servlet/story/LAC.20080409.RGAS09/TPStory...
Quebec also has a large natural gas find. The Utica Shale based on some of the Canadian-based research on the play to date the size of the resource is being estimated between 24 and 30 trillion cubic feet of natural gas.
http://www.financialpost.com/trading_desk/energy/story.html?id=436678
http://www.fool.com/investing/general/2008/04/08/the-holy-grail-of-gas-p...
This shale is deep, making drilling more expensive. Second, year-round drilling in northern Canada is precluded by weather conditions, so the pace of development can never be as furious as that seen in the Barnett. These are just two reasons to help explain why EOG is only modeling a 20% after-tax rate of return in the Montney play
Wake me up when the data shows an annual increase in marketable Canadian natural gas production.
Now I lay me down for a long, long sleep.
A small FYI. I believe Shlumberger(SLB) recently bought the rights to the Raytheon developed Microwave technology. SLB has given no indication of what it plans to do with it or when.
The Schlumberger microwave story can be found in Oilweek here:
http://www.oilweek.com/news.asp?ID=13789
And in the International Herald Tribune Here:
http://www.iht.com/articles/ap/2008/01/22/america/NA-FIN-US-Oil-From-Sha...
From Oilweek:
Ron Patterson
We are at the point of eating the bark off the trees. Woe betide us.
What's worse, as we desperately struggle to sustain the unsustainable (our present way of life), we have to climb farther and farther up the tree to get the bark.
What's the value of the tree we are denuding? How does one include this in the EROI calculations?
At some point this desperate and futile struggle will collapse because of ever rising costs, and then we will be left with that which we have not yet destroyed, the water, the soil, the forests, etc. How much will be left?
That's the limitation of EROI. It seems to improve on dollar ROI in dealing directly with the resource. But it still does not properly account for the destruction of resources that are of essentially infinite value (depending, of course, on how much value one assigns to future human existence).
You're right davebygolly. I don't place much value on the continued existence of any one species - especially one whose census number already so grossly exceeds K. But I do value ecosystem integrity & biodiversity. Both Nate & Dr. Hall have promised to address the issue of how they would go about valuing diversity & ecosystem services but I'm skeptical about them being able to do so in any but an incomplete & arbitrary manner. I'm waiting to see what they have to say in this regard. Good post!
The Canadian government publishes data that seems to allow a primitive EROI calculation for the entire energy sector.
i.e. They estimate the total energy production in petajoules and in addition estimate the energy consumed by energy producers. There are reports for 2001 to 2006. The 2001 report contains a data point for 1990.
However, for the years we have, despite the fact that the tar sands have come on strong in recent years, EROI (by this measure) is not falling.In fact, it was 12 in 1990 and 13 in 2006.Thoughts, anybody?
Source:
Most recent data:
http://www.statcan.ca/Daily/English/071220/d071220a.htm
Older data:
http://www.statcan.ca/bsolc/english/bsolc?catno=57-003-XWE
Well, my initial general thought is that as energy surplus declines, we will borrow what we can to maintain it from the poor (rising inequality) and the environment (higher externalities). Certainly neither 'straight' EROI, nor conventional economics accounts for environmental externalities, though the market is starting to in a small (misguided) way with carbon credits.
The other thing off the top of my head is that the canadian numbers have to be quality adjusted - if the main energy input is now electricity, but it used to be something of lower quality, then quality adjusted EROI (in the primitive form you illustrate) could be declining.
Also, its possible that what your chart might show is the 'cannabilization' of the in situ resource that is 'free'. The recent rise in EROI since 2004 seems to coincide with the scaling of tar sands. If a good % of the tar sands themselves are used as energy to process different tar sands to an end product, I doubt the NEB is counting that as an energy input.
Also - remember that energy surplus is EROI x Scale - so if total energy is declining, even with higher EROI you have smaller societal energy surplus (not sure if thats the case here)
Finally, the above chart doesn't tell us much about fixed vs marginal energy investments. Its possible in some of those missing data points that very large energy expenditures were made in energy infrastructure, and that we now have higher EROI because we are predominantly using built infrastructure as opposed to energy intensive new structures, to harvest the oil/NG, etc. We don't know though (but I suppose could back into that...)
The in situ resource here isn't very usable in unprocessed form! Or even semi-processed form. But I don't know the process well, so can't rule it out.
In this case total energy is definitely rising:
Starting in 2005, Statistics Canada began breaking down producer consumption by energy type. However, we don't yet have the full report for 2006, so there are no other numbers to compare with that breakdown. (For 2005, nat gas is definitely a big input).
I'm not expecting this measure of EROI to rise much in the near term. However, I do think that the rise at the end of this series could have something to do with a response by producers to high energy prices. i.e. Energy producers are becoming more energy conscious!
Over time, regardless of what is happening to the quality of the underlying resource and capital and equipment costs, it's likely they learn ways of improving their means of processing the sands. That could be expected to partially offset other pressures on EROI.
One thing for sure, I'll be watching these reports carefully as the years go by.
They don't yet include data on most forms of alternative energy production. Hopefully that gets added soon.
Did you arrive at these results through dividing the "Production" figure by "Producer Consumption" numbers?
If so, then I wonder if the technote 5 on table 11 (http://www.statcan.ca/english/freepub/57-003-XIE/2005000/technote5.htm) would apply:
So, from the table labeled "Energy Supply and Demand" one would have to add to "Producer Consumption" some share from the "Industrial" entry (as "Industrial" would include mining per the notes.)
In other words, "Producer Consumption" doesn't include strictly mining consumption (or likely transportion consumption) either.
No?
Yup.
Regarding technote 5 for table 11....
Remember that not all crude produced is classed as energy. If it's used in plastics production, lubricants etc, it's a product of mining and energy used to produce it is counted as such, not as consumption by an energy producer.
So, what happens, for instance, when hydrogen from nat gas is used to upgrade heavy oil which is then used for non-energy applications? I think this section deals with those cases as well as the case where the oil ends up being used as energy.
That's why it can be counted as either producer consumption or attributed to mining (not both).
But, I'm no expert.
Unfortunately the definitions as given aren't provided with enough detail or examples to clarify what is really meant by "producer consumption" or "industrial", etc.
This is the problem of accrual. E.g., if a company has to transport personnel to a job site, does the energy expended to accomplish this get put into "producer consumption" or "transportation"?
If such details are not tractable, perhaps it is better to accept that EROEI analyses are best thought of as qualitative indicators rather than the energy equivalent of accounting.
It may be possible to substantially improve the EROI on tar sands by the use of nuclear energy instead of gas dependent on the following assumption:
That the EROI of nuclear energy itself is in fact high, nearer to the estimates of around 93:1 some give, rather than the very low estimates that Professor Hall has used elsewhere, which are likely based on the heavily disputed Storm-Smith figures.
A couple of remarks here: it would seem more sensible to use nuclear in any case rather than premium NG to heat the earth to make the oil flow regardless of EROI considerations, but of course this would not mean that the oil did not need hydrogenating, which in practise means natural gas at the moment, as more advanced reactors high temperature would be needed to produce hydrogen.
The other environmental impacts of oil sands would remain high.
Perhaps I am misguided, but it would seem to me that using a high quality energy source to obtain an incredibly inefficient and low quality energy source is pretty illogical. Wouldn't that uranium be better suited towards offsetting increasingly expensive natural gas and oil fired generation?
I agree that this process would likely increase the EROI, but 93:1 seems a high figure seeing most of the figures I have seen have been at least 60% lower.
Also nuclear power aside, using tars sand energy to get tarsands energy seems in all cases to be a pointless process from a logical point of view. Hardly ever it seems is the short term economic view the logical view, however, the long term economic view always seems to match up. I say this process is illogical due to the low EROI of the tar sands and oil shale. The initial energy investment is much higher than the conventional means which translates to a 6-8 times high Co2 contribution along with water pollution and use.
20:1 oil and gas Cleveland et. al 1984, Hall et al 1986
3:01 above article
10 units of energy
0.5 * 20 =10 oil and gas
& assuming your using tar sands energy to create tar sands
(10/3) * 3 = 10 Tar Sands
(10/3)/0.5 =6.67 times larger initial investment
therefore,
at least 6.67 times more carbon emissions from tar sands processing, likely more because tar sands are "dirtier."
The ultimate goal of this entire process is to find fuel for transportation, and I believe resources would be put to much better use in the form of electrified transportation and reduction's in demand. John Maynard Keynes always said, what does it matter, "In the long run were all dead", then again Keynes was a bit fruity and had no children.
No, they're not interchangable. Tar sands aren't an energy source as much as a fuel source, and natural gas/oil fired generation is capable of peak production while nuclear is mostly a baseload supply.
A sixty percent lower figure for EROI of nuclear power than the 93:1 I quoted would still give a pretty acceptable EROI for tar sands, whereas very low estimates of the order of 7:1 which some use based apparently on Storm-Smith would be a lot more doubtful.
I don't put much faith in exact EROI figures anyway, as you tend to pretty much be comparing apples and oranges, and trying to find out how many bananas that equals, in this case the value of using nuclear energy to extract tar sands depends on how much you value liquid fuels as against electric power.
I feel that in any case gas is not to be wasted, and feel that uranium for nuclear energy is a much more abundant resource, in contrast to some people who say that it will be very limited, but perhaps it should be noted that many of those who try to make this argument are in any case against the use of nuclear power and would not wish to utilise whatever resources we have.
Well if you have a nuclear reactor then hydrolysis by electrical or thermal means probably works. However if your generating hydrogen from water then you just as well use C02 to make methane -> GTL I'm simplifying but you really don't need the reduced carbon. Limestone or air extraction of C02 probably works well. Ammonia based economy makes even more sense. The nuclear->hydrogen economy does not make sense but nuclear->hydrogen -> methane | ammonia is a lot more practical. If you go the methane route than butanol etc are probably sensible.
I think you could easily end up 20-10:1 with a bit of work.
Big waste of electricity IMHO but technically EROI positive.
In my opinion however the real problem is that we can't afford to replace and maintain our road infrastructure with the sources. And at least in the US the amount of deferred maintenance is mind boggling.
The bridge collapse in Minnesota is the tip of the iceberg. Roads generally need serious maintenance every 15 years or so. Assuming we are now skipping even the work we used to do I estimate that probably 50% of our current road network if not more will be unusable within 15-20 years. In general this will be because of a degraded road bed coupled with damaged bridges. As the bridges become unsafe large sections of road bed are no longer usable.
Look at Canada since we are talking about tar sands.
http://www.pppcouncil.ca/issues_infraDeficit.asp
In my opinion the EROI calculations are not taking into account that we are letting our current infrastructure rot. Its not clear its sustainable even with cheap oil.
So assuming that the oil/gas industry also should pay for all the roads needed if their products are consumed for transportation. I.e the EROI has to be large enough to cover the other half of transportation costs roads. I don't think its positive.
And last but not least I don't agree with the EROI estimates for workers in the oil industry. Look at it this way the same worker working in the renewable energy industry makes a longer term positive addition to the economy. This missed EROI if you will is not small.
This opportunity lost is probably hard to measure but it seems large to me. Another way to look at it is mining the tar sands to build wind/solar and other renewable efficient infrastructure is fundamentally different from sending it to the US to burn in a SUV.
By not including a sensible use or future into EROI calculations it seems your missing the real loss.
As always, Memmel, you make excellent points. I agree with you (and another poster IIRC on an earlier thread) that the energy cost of end use systems has to be accounted for in some manner, especially when comparing energy alternatives (i.e. liquid fuel or solid fuel, electricity and so on).
You are also absolutely right to raise the matter of the opportunity costs associated with the labour employed in the process. All those Newfoundlanders and Maritimers staffing the tar sands operations would be much better deployed improving building energy efficiency, working in an expanded pelletized-biomass industry, building district cogeneration plants to burn the pellets, laying electrified rail systems, and the list goes on.
I was really commenting mainly on the Canadians' plans to use nuclear power rather than natural gas to extract the oil, which would seem to me far preferable so as to economise on NG.
I very much doubt that anyone will be using the oil extracted to power SUVs, as I am amongst those who think, based on the knowledgeable contributions of many here, that conventional oil production will decline precipitously, and that tar sands and other unconventional sources are in no position to replace more than a small fraction of this.
In those circumstances liquid fuels are hard to replace for uses such as heavy machinery - cars and so on are easier, as battery technology is better placed to power them, but the very heavy power needs of some machinery make this a priority use.
In any case the environmental degradation imposed by tar sands extraction is severe, and certainly I would personally be very opposed to doing more than extract enough oil for vital needs, which in any case seems to be it's realistic capacity.
In this context EROI is less important, and in any case you put your finger on an important problem with EROI calculations, establishing boundary conditions - should roads be included in the EROI for liquid fuels?
In this case, since I would argue that in any case not much is likely to be used for road transport, save perhaps for some trucks, probably not, but this serves to highlight the kind of reason why I deeply distrust EROI calculations - you can pretty much generate whatever figures you want, depending on the boundary conditions you set and what you fancy.
In general terms though, it is pretty clear that burning natural gas to extract tar sands is a deeply problematic process, both form the point of view of the other uses possible for this premium fuel and pretty low EROI however you figure it.
I learned a lot from your post! Thanks!
It seems like with oil shale, a wider boundary on inputs may be needed to capture the true costs / energy inputs - and the feasibility of doing this kind of development.
If water is not available, one needs to figure out how much it would cost to build a pipeline from the nearest suitable source (hopefully not as far away as Lake Superior), and to pump the necessary water uphill the required distance.
If roads would need to be built to the area and then maintained, this is a cost. If there is substantially more shale after extraction than before, some plan to deal this, together with its costs, should be included.
If electricity is used in the process, one needs to think about how an adequate electricity supply will be developed for the region, if electrical capacity is not sufficient to support expansion of the type needed. It this requires the building of a nuclear plant, then this, together with the water needs of the nuclear plant needs to be considered.
I know these are mostly outside of the boundaries of your usual EROI analyses, but anyone seriously considering large-scale oil shale developments will want to think about the particulars required for all of this to happen. Given the low EROI you are showing for oil shale, my guess is that when these wider boundaries are considered, there will be no way that the process will make economic sense.
Gail, I will throw in with the "some of you" that 'who cares' refers to downthread and say that regarding oil shale at least, you have nailed it with this - there will be no way that the process will make economic sense. To say nothing of ecological sense. Basically, the way I see oil shale is that it is the unfinished geologic formation of petroleum, and we think we are going to come along with our cookers and finish the last few million years of the process. Not.
Great post, I've been trying to find good info on oil sands/shale for a while, and kept coming up short.
What I'd like to know is how much progress has been made in increasing the efficency of oil sands as of late. Between using larger trucks, larger cookers, etc, if they've shown any significant improvement (though I'm well aware that any improvement is a drop in the bucket compared to the damage they do).
Also, If you could compare this to coal liqifaction, that would be great.
There was an article by Dr. Walter Youngquist in the Hubbert Center Newsletter http://hubbert.mines.edu issue 98-4. Youngquist also discussed so called oil shale and other energy sources in the first edition of GeoDestinies. I met Dr. Youngquist at the Houston ASPO meeting. At that time he was finishing the 2nd Edition. I have an order for the 2nd Ed. at Amazon and will post a note when it is delivered.-----------------------------------------------------------------------
I note the reference to Dr. S.S. Penner who has discussed the possibility of abiotic oil. Dr Penner has frequently lectured on energy at at the yearly DDP (Doctors for Disaster Preparedness) meeting. He is scheduled to speak at the July 11-13, 2008 meeting in Mesa AZ. This is a pro-nuclear and somewhat cornucopian group
So I see that some of you profess the belief that CTL, Oil sands, Oil Shale is all useless and won't do anything.
Now tell me-
Are you directly paying any money for these developments?
Are you taking any risk in developing this technology/ infrastructure?
Do you really care about the environment- or you just want to see all the people in the world who are not members of your cult die?
Do you think the earth cares (or can even care) about what exists on it's surface?
Do you think living on the earth as hunter-gathers is the only possible destiny for a self-aware life form?
I will write more later. Why don't you read some history and understand the limits of the predictive powers of so called "experts" in each age. While you are at it why not go back even further in the past to the earth before humans. Could you have predicted any of the important events that occurred and which species survived/ became extinct?
Not directly, but thru taxes & environmental costs, I'm indirectly subsidizing development of this crud against my will.
We all are. We're risking extinction due to the consequences of global warming & environmental degradation by developing resources better left in the ground.
I really care about the environment. Since I'm not a member of any cult, by your reasoning this must mean that I would like to see all the people in the world die. But since the choice dichotomy you offer aren't the only options, what I might want to see & what I expect to see aren't necessarily the same. All species eventually become extinct. There's nothing special about Anthropus ecocidus in this regard. Human extinction probably won't occur during my lifetime (if I was younger I wouldn't be so sure). What happens after I die won't concern me.
Some believe that "Gaia" is self-aware. Personally, I think that such belief is superstitious. On the other hand, I really don't know. I'm agnostic about this.
It's the only sustainable option, or would have been. It probably isn't a viable option any longer. The biosphere is too degraded to support a viable breeding population of the cannibal ape leading a gatherer-scavenger lifestyle.
Many things that happen are wildly improbable until they do happen, at which time their probability of occurance attains unity. During mass extinction pulses, the probability of extinction increases with elevated trophic level & increased body size. Other than these generalities, extinction is pretty random.
ok
1) sure - Canada exports the final product of the tar sands to the US - it goes into the stream of oil products, I am a US consumer, therefore I pay $ for these developments
2) as a resident of this planet and more specifically North America, I share the risks to a certain extent - if this process adds to global warming, pollution of groundwater depletion of freshwater and diversion of irreplaceable resources into a product with dubious return on investment, then yes, I share the risks
3) LOL - outside of your nasty polemical phrasing (like a right-wing "think" tank's phrasing in a poll)
yes, I really care
yes, I have made huge strides in reducing my footprint
as far as I can tell, right-wing politics is far more of a "cult" (especially in terms of belief in the face of overwhelming evidence) than a desire to not destroy and despoil the only planet I (can) live on
your equating of protection of the environment with a cult that wants people to die is a sick nasty joke - when you give us "more later" we can discuss your deprogramming from the right-wing talk radio shows...
4) of course the earth doesn't care - which means I have to - I don't subscribe to any sort of supernatural belief system so I don't think ANYTHING cares - except humans, and we are so busy f-ing up the place that most don't have the inclination to care either - which explains how we can continue to f the place up so much - even a very dumb animal knows better than to sh*t in their own den - yet we are doing that very thing with our environmental damage and rapacious practices with energy and other limited products of the earth
5) of course not - we can all (maybe) live like the Amish - if we're lucky...
- it would be really nice to not have to have everybody (who survives) return to a lower-level of subsistence and complexity, but with 5 billion or so extra people over carrying capacity (pre-fossil fuels) - not sure we get much choice in this
I've read loads and loads of history - and guess what? Malthus was right, Limits of Growth was right, Hubbert was right, and my guess is Jared Diamond and Joseph Tainter are right - which means at least a significant portion of the human population is in serious trouble - even if you can rid the planet of selfish environmentalists who want everybody else to die, you will probably have trouble keeping this level of complexity going
"Could you have predicted any of the important events that occurred and which species survived/ became extinct?" - sure, given my brain and access to modern science, I think if I was witnessing an incredibly rapid rise in temps or C02 or the oceans or an ice age hitting or a comet about to smash into us or volcanos breaking out all over etc. etc. etc. - I would have a very good chance of predicting exactly the sequence of events that were coming...
but of course, your hypothetical is rather silly and anti-scientific anyway - and you sure seem to have a lot of axes to grind...
so rather than ask us a bunch of nastily phrased questions - why don't you lay out a scenario where in the absence of environmental "cult" members and awful-at-prediction scientists, you have a plan for keeping 6-9 billion people fed and housed and drinking water with declining resources of nearly every major energy source we use, with declining water sources, declining access to cheap and plentiful fertilizers, declining sources of cheap metals etc.
I'm all ears for your solutions to all these problems....
"Are you directly paying any money for these developments?"
Not directly, no - but then, only shareholders in the companies are. Indirectly, yes. I pay taxes, and the fossil fuel industry receives very large subsidies across the West.
"Are you taking any risk in developing this technology/ infrastructure?"
Not personally, no. But as a citizen in a community, there are all sorts of risks - environmental, climate change, the risk of money being wasted, etc.
"Do you really care about the environment- or you just want to see all the people in the world who are not members of your cult die?"
I'm not in a cult. Are you?
From this point on you're just trolling. For some reason that's allowed here, and the proper response isn't, so I'd best stop.
Way back in late 2004, when I was publishing energy strategy articles at EnergyPulse.net, one Dan Kish (Daniel Kish
>Senior Advisor to the Chairman
>Chairman Richard Pombo
>House Committee on Resources
>U.S. House of Representatives)
responded to one of my articles with the message that shale oil would solve our problems. We then exchanged several messages as I tried to give him a more holistic analysis of the issue. Part of my message to him dealt with the Shell Oil Eroei figure, initially 6:1, and then during congressional testimony by one Mr. Mut of Shell in 2004, corrected to 3.5:1. Part of my response was:
snip A colleague of mine had the opportunity to question Shell further and found that the 3.5:1 quoted by Mut as the yield from primary energy in the fuel to generate electricity to the energy in the light oil and gas produced was for a 60% efficient combined cycle gas plant, and did not include the energy needed for the screen wall freezing. For a typical coal plant, including the freezing, the energetic yield would be little more than 1:1, excluding all of the embedded energy, as I said in our earlier exchange. Snip
I suspect that the above estimate of EROEI is optimistic.
I find the application of EROI to tar sands less onerous than it's application to electricity and ethanol for example.
The inputs and outputs are similar i.e. oil. So that eliminates the error of leaving out price. Likewise utility of the oil input is about the same as the oil output. Renew-ability is not an issue since tar sand oil is no more renewable than regular oil; it is only the scale and manner of recovery that are different. They are both finite resources. Locality is not an issue since tar sand production is mostly confined to Canada. No one is saying that the EROI of Canadian tar sands applies to the whole world because it is about the only place where oil is being produced in this manner.
The environmental impact of tar sand oil production is a valid factor omitted by EROI. I have been leaving out environmental impacts when I criticize EROI for ignoring price, utility, renew-ability and locality. I stand corrected and will include environmental impact in the future.
Thus the major EROI logic errors generally associated with the simple minded wholesale application of the concept are avoided in this case. Still, the sin of omission of environmental impact is a big logic error of EROI. But one can not make an omelet without breaking eggs. Perhaps if the eggs are broken in a remote place like Northern Alberta, it is less evil environmentally. After all that is how solid waste is usually disposed of: take it to a remote place, dump it and cover it up.
Best approach for using oil shale: Side step the EROI issue.
Burn it straight out of the ground, like low-grade coal, to generate electricity. This is being done today in Estonia, China, Israel, and Germany. Use the electricity to drive EVs.
Tar sands and oil shale are also a very large, long-term source of feedstock for plastics etc. EROI doesn't matter if you are using the hydrocarbon for materials instead of fuel.
So you care because
1] you pay taxes, but so do others who want their version of a good life. It just happens that there are many more of them than you. I think it has something to do with living in a democratic republic. Even though we currently have people like 'shrub' (the village idiot) at the helm, I think it is still better than living in many other systems.
2] You probably guessed that I am not a republican from 1]. Having said that I refuse to believe in fairy tales like AGW. GW- sure, it happens. It has happened before, much like GC (global cooling). I do not think humans were around during the carboniferous, jurassic, cretaceous, paleocene, eocene (the climate was much warmer then) or during much colder periods like the Pleistocene.
My problems with current models of climate are very fundamental. Unmanipulated climate models are horrible at reproducing the global climate of the last 50 years. If you cannot reproduce what happened in the last 50 years without lots of questionable mathematical manipulations, I think you cannot predict the future. There are also the issues of not factoring in stuff like clouds, temperature gradients + movements + temperature dependent gas solubility in the oceans. Even worse is the BS that increased evaporation will not lead to increased precipitation.
I prefer to look at at what happened the last couple of times the climate warmed in human history. Funny thing- most people had better lives in that weather. And malaria was a problem in england even during the little ice age- what did oliver cromwell die of? It is insecticides and better public sanitation that eradicated malaria from the 1st world. Have you checked how many states in the US had endemic malaria when the CDC was formed? Why? AGW?
I can go on and on about this.. but lets go to 3]
3]I think that many environmentalists are just a newer incarnation of control freaks. For reasons that are not very logical today, more than a few humans want to control or hurt others around them. While that might have been good when we lived in small tribes, it is certainly bad for everyone else today.
The right wants to control your happiness and the left want to control your livelihood- and I personally think that they can both go to hell. Maybe minding your own business might not be such a bad idea. I see AGW, Peak oil, rapture etc as doomsday cults. They start with a ok idea, but blow it out of proportions till it becomes a dogma, and every bit of evidence supporting it is praised and every bit of evidence opposing it is heresy and lies (from the "devil"). And yes.. then there is the need for evangelism- accept the word of "whoever" and start thinking like us or you will be cast in "hell" along with the "sinners/ unbelievers".
Don't you think there is anything common between christianity (rapture), islam (mahdi, 13th immam), AGW (climatic apocalypse), Peak oil (energy/ social apocalypse)- All are fairly similar doomsday cults. You are all waiting for the apocalypse, aren't you?
4] If the earth is not 'alive' and we cannot see the future, then why are we worrying about it. The best we can do is try to do what we think is profitable for us a species and hope for the best. Unless you have any better ideas.
5] Why should development be sustainable according to what we know today. What about people who used wood before coal. Or those who used coal before oil. If they had acted in a "sustainable" manner according to their knowledge base we would not been around. If you think that is a good thing, by all means. It just might be the case that most people may not agree with you.
Who knows what will happen a hundred years from now? None of us have an accurate crystal ball, but I would not dismiss stuff just because I thought it was unlikely- either way.
6]If you believe in Malthus, Jevon, Ehrlich, Simon or anyone of you "gods" and "angels" who alone can know the truth, that is your choice. What you do not seem to get is that these people are either misanthropic or profiteers. Oh.. and they have failed in the past- so they are not infalliable. But if you think that it is acceptable- go ahead, just remember that others may not drink the kool-aid.
7]If you think there is only type or class of predictable outcomes to any scenario in a complex system, I have a bridge to sell you. But isn't this the same "confidence in your delusion" you accuse the "deniers" of.
You are lumping together too many different strands of thinking.
About the only thing most here have in common is that they feel that the Hubbert hypothesis is correct and that fossil fuels are in limited supply, specifically because they are formed from biological sources under particular and limited conditions.
Otherwise people here are pretty diverse.
There is indeed a large element of people who feel that collapse is inevitable, and some also feel that it is not only energy that causes that but what they think is the likely exhaustion and pollution of other resources.
Some hold that is is in any case wrong to want this society to continue, and that we should be moving to some sort of society where we consume less and are more independent.
Others feel precisely the opposite, and that what we are experiencing is a degree of challenge as fossil fuel resources run out, but that there are ample technological means to counter that, and that all that we need is to apply them.
There are countless other sub-threads, those who favour a renewables-only future, those who feel that we must make use also of nuclear power, those who think that food should mainly or only be produced locally, and those who feel that with minor adaptions present agricultural practices will work.
You have in fact missed the main point of this forum, which is not as you allege primarily faith based, but the reverse, as many on this forum give sound and credible numbers based analysis of why oil and possibly natural gas is likely to be in short supply before very long - and in contrast the guys like CERA and the IEA do not give real information on where all the oil and gas they say will will burn is to come from, and so those who think that we will be in good supply for many many years are the ones with the faith-based positions, it appears.
You should address any critique of doomers and those with apocalytic views directly to the people concerned, as such attitudes are far from universal here.
To “DaveMart” - excellent post, I could not have said it any better.
.
To “who cares” - About the crystal ball, Oil is now over a $100./barrel.
Read what I wrote several years ago and give me your explanation.
http://www.angelfire.com/in/Gilbert1/tt.html
.
DaveMart gave a good general retort; I would like to take a more specific tack:
I have never seen such a long post say absolutely nothing. Virtually every point you made is logically flawed.
Citation? Relevence?
Taxes are only paid in democracies? Did someone claim they wanted to prevent others from having their "good life?"
I can't believe adults still try to use this ridiculous and discredited line. It is utterly illogical: humans didn't exist then, so they can't affect climate now? Ridiculous on its face. The claim has never been the only cause of climate change is human intervention, so why do you allude that is the case? The observation is that human actions are accentuationg climate changes, not that they are the sole cause.
You do not understand modeling. Any model is, by definition, a manipulation of data. The entire process is a creation of the human mind. Another logically ridiculous comment.
When was the last time humans lived in temps 5 or 6C above current temps? It has never happened. Temps roughly equal to now have existed in human times, but no higher. Some have argued temps have been as much as a degree higher than current averages, but those claims have not been generally accepted and are not considered anywhere near proven. Even if true, there is a huge difference between 1 dgree higher and 5/6 degrees higher. Believe me, you don't want to be here if and/or when that happens.
#3: You said nothing. You ranted about your biases towards others.
Taking "Save the Earth" literally (there *is* a tiny fraction of humans who may actually believe the Earth is alive) simply shows you to be intentionally twisting the obvious and intended message: Don't pollute and/or alter the ecology of the planet foolishly and in such a way that may risk our survival.
This is elementary school stuff you are producing.
Survival. You are talking about a period in time when we had not overshot the carrying capacity of the planet. You are saying to the people in the life raft: Eat all you want! Drink all you want! We did that yesterday and didn't run out, so today will be no different! Besides, Joe Schmoe will undoubtedly invent a motor that runs on sea water out of the cups and utnsils we have and get us home in no time!
And? Are you trying to say disgreement should lead to inaction? Or are you simply assuming you and those who think as you do are infallible? Taht the minority is never right?
Exactly! This goes both ways. But, with regard to AGW, all the evidence supports doing something to mitigate the various disasters heading our way. I know of no evidence that suggests otherwise. A simple risk analysis makes this obvious. With regard to PO, it is the same. There is no solid evidence that BAU is an intelligent choice.
Surely you jest!! You didn't write #3 above?
Citations?
Said the lemonaid addict to the KoolAid drinker.
Only one type of predictable (possible) outcomes? Probability and opinion are not the same. One can look at all the possible outcomes and then make an assessment about what is probable. This is not denial of all possibilities. Again, your logic fails.
You are a hypocrite. Whether you realize that or not, I do not know. If not, then you are in denial/delusional. Now that your rant is done, I hope you will think twice about posting your flames here and will, instead, post positions supported by research/logic.
Cheers
It's about time TOD FINALLY decided to discuss Unconventional Oil (in the shadow of the Peak).
It's ridiculous to continue to compare unconventional oil with conventional oil.
In 1928 the Germans started building CTL plants
with production peaking at 45 million barrels 16 years later.
EROEI didn't bring down the Third Reich.
At best CTL produces 2.3 barrels of liquid fuel per ton of coal(there is about 4 boe in a ton of typical bituminous coal). So if 100 billion tons of coal in Montana were converted to liquid fuel it would produce 230 billion barrels of oil(Saudi Arabia size resource).
If 1000 SCF of natural gas is required for a barrel of syncrude, and we can make 10000 SCF from a ton of coal(lignite) by coal gasification then 200 billion barrels of bitumen/syncrude can be made from 20 billion tons of coal which is about the same amount of coal(URR) in British Columbia.
The Shell process makes 3 boe of shale oil for every 1 boe of electricity, so at 33% efficiency that's 1 boe of fossil fuel(coal)per 1 boe of shale oil. Since a ton of bituminous coal has 4 boe of energy in it, 100 billion tons of Montana coal would produce 400 billion barrels of shale oil. The ATP(Alberta Taiuck Process)is more thermally efficient than Shell's electric heaters.
This shows that North America's total unconventional oil resource could technically provide as much oil as the Middle East--600 billion barrels of oil and that unconventional oil makes a lot more sense than CTL which is only 2.3 x 120 billion tons=276 billion barrels.
The amount of CO2 that would be generated by unconventional oil would be about 700 billion tons of C02--the US releases about 7 billion tons per year. If we produced 6 billion barrels of unconventional oil per year we would produce about 7 billion tons of CO2. So to produce about 83% of US annual consumption
we would increase from 7 billion tons of CO2 to 12 billion more tons of CO2 per year.
The main reason why unconventional oil isn't being developed quickly is that it would double CO2 emissions.
Hmmm... where to begin...
Do you have any evidence for this, or is it a conjecture? Note that the US neither taxes nor prohibits (even indirectly) the production of CO2, and Canada has all but formally given up on meeting their Kyoto targets (indeed, they are going in the wrong direction.)
Rather, as pointed out by economists over and over, substitution is a choice made. Why substitute traditional crude oil with unconventional, as long as traditional crude oil (and NGPL, etc.) can fill the need?
Has not the choice to not develop significantly the unconventional sources merely been the result of economics (i.e., traditional oil has been so cheap)?
This is not at all clear... perhaps you would be willing to clarify? You seem to be leaving out process losses, which would be different among the various processes.
All unconventional energy programs(hydro, nuclear,etc.) are the result of massive government support efforts. In fact ANY large program relies on government in the initial stages(something the freemarket idiots don't get--eg the Panama Canal). The German CTL program was started under Stresemann in 1928, but got its boost from Hitler who ordered that the coal mine shareholders should bear the costs, to be repaid by the State.
The fact is CO2 is a political problem, so the development of these fossil fuel resources (or even coal fired electricity)
is unlikely to get the political support necessary for such a program.
In China where everything comes from the State, CTL(and DME-ertsatz LPG) is getting very big as is oil shale at Fushun.
Using Hall's math, oil shale from Shell's electric heater method
requires 1 boe of electricity to make 3 boe of shale oil. Using coal fired electricity plants at a thermal efficiency of 33% you
get 3 boe of coal to make 3 boe of shale oil or 1:1. A ton of subbituminous coal from Montana(reserves estimated at 100 billion tons) contains between 8000 and 11000 btus per pound so I use 22 million btus per ton. A barrel of oil equivalent is 5.5 million btus so 4 barrels of oil comes from 1 ton of coal.
Montana has 100 billion tons of coal so Colorado oil shales have
400 billion barrels of oil. These are all rough figures but then there's coal in Wyoming, Utah, etc.
This is basically an order of magnitude estimate for current.
It would be FAR more efficient to use heat from a nuclear reactor at 80% efficency? to make hot gas and pipe that directly into insitu deposits than use electricity and would generate less CO2.
So we can produce lots of oil with a very large government program for another 100 years. But is it worth it?
Thanks, good post.
That has got me thinking.
I guess eventually the FF's will get sent into the biosphere, the question is over what period.
Probably the major determinant will be economic.
I doubt our conscience or concern for future generations will play a significant role.
An excellent article - I mean that quite literally, it excels, stands out above many of the articles around here. It's thorough, logical, well-researched, and most importantly clear.
I'd like to have seen a table giving the various energy and fossil fuel inputs for the calculation, if only to see what the biggest inputs are. After all, as DaveMart says in pushing his pet nuclear, in principle everything could be electrified so that the only fossil fuel inputs are for the hydrogen - but if that's (say) 80% of the total, and all the trucks and water boiling is the other 20%, that's a very different outlook than the reverse, for a fossil-fuel-constrained, or CO2 emissions-constrained future.
Kiashu, I am pretty dubious about oil sands anyway in view of their enormous environmental damage, and nothing I said should be construed as advocacy.
I was seeking to comment on the two alternatives to heat the soil, the present way using NG, which seems to me to be a waste of a premium fuel, and the second way which is proposed in Canada by using nuclear power.
AFAIK there are few other alternatives on offer, certainly not renewables such as solar power at that latitude.
Since I don't feel that uranium resources are in short supply if we absolutely must produce oil from tar sands then that would seem to me the better alternative.
The main thrust of my comment though was to draw attention to the very different EROI picture that would result from these two options - even if you feel that nuclear has a low EROI itself, it would certainly be different at least.
I also specifically commented that closing the loop by producing the additional hydrogen needed by other means than using NG would take some doing.
EDIT: I did not take account of the possibility of using microwaves which presumably would also affect EROI as others have commented and I have not been following it closely - great if it works, presumably!
Great Post. Thanks
I have a general question regarding the EROI of conventional oil production. In one of the previous articles in this series Prof Hall suggested the EROI for oil AND gas production was ~35 in 1999 and steadily declining since then. A quick google revealed this paper http://sef.umd.edu/files/Hall_SEF06.pdf (PDF WARNING) Slide 26 shows that Global oil extraction EROI has dropped from about 80 in 2000 to about 60 in 2005 (calculated with $-based EROI). Linear trends (with a big quetion mark) show the EROI reaching break-even between 2015 and 2025.
Let's say the EROI of current global oil extraction is 50 and we extract 85 mb/d.
The Energy invested into this operation (the denominator) should be Gross Energy = Invested Energy * EROI, Invested Energy = GrossE/EROI = 85/50 = 1.7 mboe/d
Now let's say that global oil extraction is dropping and reaches 10:1 (conservative compared to trends) in 2015. by this time oil extraction has peaked and has declined to 75 mb/d (roughly in line with forecasts)
In 2015 the Energy Invested = 75/10 = 7.5 mboe/d
If this is the case, (and my sums are correct) then Energy Invested has gone up by (7.5/1.7 *100 -100) +340% in 7 years!
I guess what that looks like in the real world is a massive expansion in drilling and well injection but yielding less.
But. Wouldn't there be logistic bottlenecks to a +340% expansion in effort? If so, wouldn't 2015 extraction have to be much lower than 75 m/d?
It seems that either: $-based EROI has some problems, OR the EROI is not declining linearly and will level off above 10, OR we'll be extracting much less than 75 mb/d in 2015, OR somehow a massive expansion will be accomadated, OR something else
comments?
your example is generally correct which is why Ive been arguing for years now that Peak Availability (which factors in energy costs, export availability, lower BTU alternatives +greater negative externalities (hard to measure)) should replace the 'date of Peak All Liquids' as a date of meaning. We are all (most of us) arguing about the wrong details. (and of course, even pinning down Peak Availability, which I believe is past, is only worthwhile in dictating how much time we have to make dramatic structural changes)
Also note - the main energy inputs into oil and gas extraction is natural gas and electricity, not oil - so its not exactly a one for one accounting - we will be using more and more nat gas as EROI of oil declines.
Hi,
yousay
-what percentage of that 32 USD can be attributed to the cost of Oil and Gas at the current $ prices?
Regards, Nick.
Good 'receding horizons' question. I doubt Prof Hall has the answer because the 2007/8 data that he used to write this paper so far only has been released through 2006.
But anecdotally one would think those inputs are much higher now
The doomer trolls come again
"ccpo", I think you are an idiot, a pompous one but an idiot nonetheless- remember "idiot" not "stupid". Many people here seem to think that spouting buzzwords, and pretending to talk science qualifies you to have a hotline to reality. PS- I do have a PhD in a hard science and perform computer simulations- for a living.
so let's analyze your scientific? mumbo-jumbo.
1]//Citation? Relevence?//
Ah, the old trick of people who pretend to argue science. There is however the problem of "what people say" and "what they do". There is also the problem of what is publicly reported as opposed to what is known.
Citation- ask 100 people you semi-know (not on the street or acquaintances) whether they will cut their oil consumption if they do not have to. You might be surprised that they don't really care about anything except themselves. Of course you can find a scientist who can game the system to produce any results you want.
2] //Taxes are only paid in democracies? Did someone claim they wanted to prevent others from having their "good life?"//
Yes, taxes by definition are semi-voluntary. If you are not represented they are not taxes but government protection money. You do not have to explicitly say that "you want to do x", actions/ hints speak louder than words.
3]//I can't believe adults still try to use this ridiculous and discredited line. .. blah .. blah..The observation is that human actions are accentuationg climate changes, not that they are the sole cause.//
Causation is different from correlation. Example - reducing LDL or increasing LDL in humans by drugs other than statins is not associated with a measurable reduction in the risk of atherosclerois and heart attacks- however physicians still spout the old crap about LDL and HDL. It seems that whatever increases the risk of heart attacks also causes dyslipidemia.
Similarly what you percieve as correlated might not be correlated for the reasons you think. Example a warmer earth might have more food and more people and more human activity. So is human activity causing GW or vice versa.
4]//You do not understand modeling. Any model is, by definition, a manipulation of data. The entire process is a creation of the human mind. Another logically ridiculous comment. #3: You said nothing. You ranted about your biases towards others.//
HAHAHAHA.......nHAHAHA.. Seriously.. I know the difference between processing data honestly (and true to your original assumptions) and fudging numbers (introducing terms + 'made to order' constants + "corrections") to show what you want. OK. I actually get paid for modeling and analyzing data (static databases and dynamic systems).
If you have to game the model so much.. maybe the model is faulty and should be rebuilt from scratch.
5]//When was the last time humans lived in temps 5 or 6C above current temps? It has never happened... blah.. blah..Even if true, there is a huge difference between 1 degree higher and 5/6 degrees higher. Believe me, you don't want to be here if and/or when that happens.//
I think you might want to look at the ~ 3000 yr period from about 4k BC to 1k BC. I think modern human civilization started then.. Why? Could it be the climate was more predictable, warmer, wetter and generally better for people. Do you think the plague in the 1340s was just coincident with the end of the medieval warm period in europe? And funny thing- the last small epidemics of plague also disappeared when the cooling stopped and started to reverse itself.
If you do not read the various sources of history and analyze them to see common patterns and known + novel correlations, that is your problem.
6]// Taking "Save the Earth" literally (there *is* a tiny fraction of humans who may actually believe the Earth is alive) simply shows.. blah.. blah..This is elementary school stuff you are producing.//
The question is how much the ecosystem is necessary for human survival. Probably more than we know but less than what we protect. The important question is- should people try to make decisions based on what they can measure or should imprison their minds because of the "monsters in the closet".
7]//Survival. You are talking about a period in time when we had not overshot the carrying capacity of the planet. .. blah.. blah..Besides, Joe Schmoe will undoubtedly invent a motor that runs on sea water out of the cups and utnsils we have and get us home in no time!//
And you know about the carrying capacity of the planet because- you have a hotline to your version of god? or you are infalliable? or your models factor in everything than exits- as opposed to models gamed to show what you want others to believe. Don't the mormons know about the carrying capacity of the heavens? Dogma is religion not science.
Ya.. and read some history and think about iron instead of copper/ bronze, phonetic instead of pictographic writing systems, decimal systems instead of other archaic number systems, using coal instead of wood, mineral oil instead of whale oil, Haber-Bosch instead of chilean saltpeter, Fischer-Tropsch instead of drilling for oil, Off shore oil drilling etc. I could go on and on..
What about Ghawar- did we know that such a formation could exist when it was discovered? What was the "scientific consensus" back then?
8]//And? Are you trying to say disagreement should lead to inaction? Or are you simply assuming you and those who think as you do are infallible? Taht the minority is never right?//
What you are suggesting is closer to inaction or mal-action. All I am saying that we must develop non-conventional oil + nuclear + wind + solar. Doing so + rebuilding infrastructure would create more jobs. If you create more jobs + decent lifestyle, there is both a motivation and opportunity for more people (with more diverse views) to solve problems and improve the world- as far as humans are concerned.
9] //Exactly! This goes both ways. But, with regard to AGW, all the evidence supports doing something to mitigate the various disasters heading our way. .. blah.. blah There is no solid evidence that BAU is an intelligent choice.Surely you jest!! You didn't write #3 above?//
Which evidence? Do you really think that government funded science has any purpose other than creating jobs for scientists? Honesty in publicly funded science has left the building since the 1970s- it occasionally visits its old haunts but does not reside there.
The useful and innovative research that comes out of our current model of funding is actually an unwanted byproduct. Most scientist would rather beat the dead horse than admit that it is dead- and yes I have seen that more than I would like to admit.
The difference between a real scientist and most of the ones today can be summed up this way. Real scientists are always aware that they could be very wrong, and are open to admitting it if they see enough real evidence. That and they have perspective when analyzing data.
10] //Citations?//
Oh.. F off.. Malthus (how did he make his living + fame + motivations), Jevon (same), Ehrlich (same + wanting non-whites and undesirable whites dead), Simon (profit by market manipulation?), Kunstler (same + money/fame). Look at their actions, not their words.
11] //Said the lemonaid addict to the KoolAid drinker//
Drinking kool-aid means having blind faith and exhibiting almost absolute certainty. I do not do either, only believe in trying to see what works best- for me.
12] //Only one type of predictable (possible) outcomes? Probability and opinion are not the same. One can look at all the possible outcomes and then make an assessment about what is probable. This is not denial of all possibilities. Again, your logic fails.//
But you assessment of outcome and confidence in your analysis is based on what you know- not what exists or is possible. Just what you think- that is all. That is why prophecies have a tendency of not being true.
13] //You are a hypocrite. Whether you realize that or not, I do not know. If not, then you are in denial/delusional. Now that your rant is done, I hope you will think twice about posting your flames here and will, instead, post positions supported by research/logic.??
Hypocrisy- means saying one thing and believing/ doing another. It applies much better to those who would like make prophecies (or otherwise influence public policy)and hope that they result in dieoffs and other suffer and make some profit.
Delusional- living in a unreal world. Kinda like believing all the non-whites will just disappear from the face of the earth and "we" will win and live on forever. The world has changed a lot in the last 50 years and you will find that out soon- if you are not already seeing it.
or Believing that innovation is possible only if whites do it. Seriously- you are confusing socio-economical +legal systems for race. Once any other civilization copies enough of your socio-economic+ legal systems, they can do the same things or better.
Perhaps. But also a requirement of discussions on this forum. From the reader guidelines,
"logical reasoning" is somewhat subjective; but "supporting evidence" is pretty clear. That there exists contrary evidence does not matter; you just have to provide some supporting evidence, that is not just be making stuff up.
who cares goes on,
We'll be interested to hear which academic institution, company or government department you work for, and references to any papers you've published.
If you're going to use your degree to say, "me smart, you no can argue with me" then it's only fair for you to prove it. There's that "supporting evidence" again. I mean, anyone can say they have a PhD, who can prove them wrong? So the onus of proof must be on the claimant.
Also, if you as a climate change etc denier have peer-reviewed articles discussing the details of this, it'll be of great interest to us. Since science is never settled, and is an ongoing process of research, refinement, refutation and discussion, any fresh information or perspective on things is most useful.
Unless you're just making it up?
To "who cares" PLEASE NOTE
When you make a reply to someone, use the "REPLY" link at the bottom of the comment you are replying.
Do not use the new thread link.
.
It would be benefitial if you would put your email contact information in your profile area, so that people can reply to your off topic comments without having to post useless information. Off topic comments are usually useless information to many readers.
.
Good post who cares. I disagree with you on most specifics but you do bring up some pertinent issues. The status quo with its narrow focus needs shaken up in here & the points you make serve that useful purpose, if only by virtue of requiring thot to refute them.
I have modeled Milankovitch cycles both as additive sine waves & as terms of a Taylor series approximation. I have also played around with adding Dansgaard-Oeschger events to the model. Current climatic warming simply does not accord with the trends, neither in terms of direction or (especially) amplitude. Something besides orbital forcing is going on. What with humans pumping massive amounts of high heat capacity gasses into the atmosphere, the most likely hypothesis is that on-going climatic warming is anthropogenic.
Thanks Nate for this very helpful contribution, which comes just in time as I was struggling with finding the EROIs of several fuel types.
Sadly, as far as I understand now this important parameter seems to be hard to determine. So maybe it is safest to state a range of EROIs?
What I do not understand is if you make a difference between EROI and NER (whereas wikipedia takes both as synonyms).
You wrote:
"Reported EROIs (energy return on investments) are generally in the range of 1.5:1 to 4:1, with a few extreme values between 7:1 and 13:1."
and
"For the mining and retort process, the net energy return (NER) is very low if total energy inputs are counted (NER < 1.5) (Brandt 2006, 2007)...EROI for shale oil ranges above and below the break even point"
These "NER"-values are much lower than the "EROI" values. Is this due to a different definition?
EROI is a ratio and is Energy Out / Energy In.
Net energy is EROI - 1
So if the EROI of corn ethanol is 1.2:1, then the net energy is .2
Net energy return is how much you have in 'profit' per unit of energy investment. EROI is just the ratio of output to input.