Why EROI Matters (Part 1 of 6)
Posted by nate hagens on April 1, 2008 - 11:04am
This is the first of a six part series of guest posts by Professor Charles Hall of the SUNY College of Environmental Science and Forestry and his students and collaborative researchers. Professor Hall previously posted on TOD, "At $100 Oil, What Can the Scientist Say to the Investor?"Professor Hall has endeavored to update and improve the state of net energy analysis as he believes (as do I), that future energy policy decisions should at least be guided, if not directly steered using biophysical principles. The opinions on the importance of net energy analysis as a tool for addressing our looming energy crisis are quite disparate, but without some science grounded in physical principles, we are left to rely on the market. The unfolding international credit crisis highlights the dangers of relying on strictly fiat monetary measures for biophysical planning – credit and debt can be created with no underlying physical foundation.
This first post is composed of 2 pieces. First is an introduction and an explanation by Dr Hall why EROI analysis is important. The second part lays out a request to theoildrum.com readership for helping contribute to this net energy data effort. This post will be followed every Tuesday in April with Dr. Halls students preliminary analysis on four energy sectors: 1)conventional fossil fuels, 2) Nuclear fuels 3) solar fuels and 4)geologic sources. Please try and help Dr. Hall with this meta-analysis with suggestions, criticism, and sourced comments. This first post has no data, so there will be an opportunity for readers to discuss any theoretical issues regarding EROI and net energy analysis before starting into the actual numbers next week.
Why EROI matters
By Charles Hall
State University of New York
College of Environmental Science and Forestry
Syracuse New York
Making investment decisions
Society usually makes its economic decisions, at least those not predicated by personal greed at the expense of others or strictly political considerations, on economic analysis and most explicitly via either non government market decisions or governmentally-administered cost-benefit analysis. Probably most decisions are made by people in the financial markets who seek to gain the best economic return on their economic investment. Probably most of these people believe that their own best judgments, while of course subject to the vagaries of the market, are the best way that we can prepare for the future. There is an implicit assumption, probably believed by most market analysts, that if they (collectively) make good financial decisions, based on market information, market projections and good hunches, then we collectively (i.e. society) will make the best investments possible. Although there are certainly good rationales that such analyses make considerable sense, in many cases it is not so clear to me that they are an effective guide to the future of energy supplies. This is because 1) few understand the degree to which most technologies today are principally a means of subsidizing whatever it is we do with still-cheap petroleum 2) today’s price signals are unlikely to be especially influenced by future conditions when today’s most abundant and cheapest fuels are likely to be much less available, for either geological (depletion) or political reasons 3) current prices of energy in the U.S. are greatly influenced by various subsidies 4) there is painfully little transfer of information from the (rather limited) scientific community that has examined the large picture of energy to the financial communities. We propose to improve the information flow on these issues from the scientific community to the general financial community as well as to the policy world more generally.
Why peak oil matters
Our society is overwhelmingly dependent upon oil, which supplied about 40 percent of US energy use in 2007, and natural gas, which supplied another 25 or so percent. Global values are similar. It has also been dependent upon their growth in supply to support additional economic growth, even with some efficiency improvements. As of this writing there is considerable concern about whether “peak oil” (meaning the point for a region, a nation or the world at which oil production no longer increases year by year but enters a plateau or decline) has occurred for the world or might soon. If this is true then the “end of cheap oil” might be, or might soon be, upon us. Natural gas might not be too far behind, especially in North America. Because of the critical importance of this petroleum for essentially everything we do economically there are major concerns as to what the financial implications might be. A thoughtful although possibly extreme view of the implications of peak oil on the American Economy has been presented by Gail Tverberg at: http://www.theoildrum.com/node/3382#more . An assumption of some who examine this issue is that since all that we do economically in the US is based on cheap oil and gas then the absence of that cheap oil and gas will have enormous economic implications. Do conventional economics and conventional economic models and tools work only when it was possible to readily expand the petroleum supply? There is a strong view held by myself and others (see references at end) that because our main economic concepts were derived during a period of our expanding ability to do everything – i.e. that more or less regardless of policy we were able to pump more oil out of the ground readily to implement whatever we were trying to do, that conventional economic approaches may have much less relevance during times of contracting supplies. In other words, are finances beholden to the laws of physics? I think yes. Thus the question becomes: can we supplement or improve upon our ability to do economics and financial analysis by using procedures that focus more on the energy available (or not) to undertake the activity in question? I next attempt to make that case.
Predicting energy supplies and the importance of EROI
There are many, notably those associated with TheOilDrum and the Association for the Study of Peak Oil (ASPO), who believe that they can predict the amount of oil and gas that will be available in the future. This can be readily gleaned from their web sites. The news is not good, especially over the next few decades. Other, different views are available of course, both from the US Energy Information Agency and Cambridge Energy Research Associates, but even their probably inflated estimates would only extend the time until peak, not cause it to disappear. In addition their predictions seem to have lost a lot of credibility due to the recent analysis of Morton, who showed that all of their price predictions in the past 8 years have failed miserably.
Most economists are not too concerned about peak oil (if they think about it at all) because they believe that markets will generate substitutes from which markets will choose. But today’s markets often give very misleading signals about the potential of various fuels. The boom and bust of ethanol is an obvious example. I have been working on this issue for 40 years and have no idea what might be an adequate qualitative and quantitative substitute for petroleum except possibly and with enormous difficulty something based on electricity.
One potentially useful alternative or supplement to conventional economic analysis is net energy analysis, which is the analysis of how much energy is required to make a unit of the energy in question. Net energy is sometimes called energy surplus, energy balance, or, as I prefer, energy return on investment (EROI) (Hall 1972, Hall and Cleveland 1981, Cleveland et al.1985, Hall, Cleveland and Kaufmann 1986). Its advocates, including me, believe that net energy analysis offers the possibility of a very useful approach for looking at the advantages and disadvantages of a given fuel and offers the possibility of looking into the future in a way that markets seem unable to do. Its advocates also believe that in time real market prices must approximately reflect comprehensive EROIs, at least if corrections for quality are made and subsidies removed. Thus can we make market decisions based on biophysical, rather than market, economic analysis? At a minimum I believe that biophysical analysis can add a great deal of insight to traditional market analysis.
The current literature on net energy analysis, such as it is, tends to be mostly about whether a given project is or is not a net surplus, that is whether there is a gain or a loss in energy from e.g. making ethanol from corn (see June 23, 2006 issue of Science Magazine for a fairly thorough discussion of this issue). The general criteria used by much of the current debate is focused on the “energy break even” issue, that is whether the energy returned as fuel is greater than the energy invested in growing or otherwise obtaining it. If so then the general argument seems to be that the fuel or project “should be done”, and if not then it should not. Obviously this issue is clearest when one might be discussing whether the fuel requires more energy for its production than is delivered in the product, a claim held by several of the participants (most notably Pimentel and Patzek 2005 discussed in the above issue of Science) in the current debate about corn-derived ethanol. Others (summarized in e.g. Farrell et al., 2006) argue that ethanol from corn has a clear energy surplus, with from 1.2 to 1.6 units of energy delivered for each unit invested. Further aspects of this argument center around whether one should include co-products (such as residual animal feed), the quality of the fuels used and produced (liquid – presumably more valuable -- vs. solid and gaseous, for example) and whether or not to consider the energy required to compensate for environmental impacts in the future e.g. for the significant soil erosion occasioned by corn production. Such arguments are likely to be much more important in the future as other relatively low quality fuels are increasingly considered or developed to replace oil and gas, both of which are likely to be more expensive and probably less available in the not so distant future. If, of course, the alternatives require much oil and or gas for their production, which is usually the case, then an increase in the price of petroleum will not necessarily make the alternatives cheap and more available as a fuel. And, as we have seen, the use of biomass fuels an have enormous and generally adverse ripple effects though the world’s food and environmental systems that were completely unpredicted by narrow market analysis.
Why EROI matters—what information can it give about the future
I believe that EROI can give the investor or the publics a great deal of information that markets cannot. These are summarized below:
1) Markets can give you information only about the cost of exploiting a fuel, which usually today has nothing to do with making or even necessarily finding it in the future. Case in point is petroleum: today globally we find only one barrel for each 4 or 5 that we extract, so that we are basically pumping out known reservoirs. Hence we are not paying, assuming that we could, the cost of finding the replacement or of making some substitute. We are just emptying our tanks. Time trends and predictions of EROI can give you a much better insight into what the costs relative to the gains are likely to be in the future.
2) Nevertheless energy investments on the whole probably cannot fail to give the investor a profit. If costs go up, so will prices. If depletion of high quality fuels occurs whatever energy is left is likely to be worth more. Society as it has existed for 100 years simply cannot operate without energy, probably more or less as much as it can get. But while the investor might be satisfied the general economy will suffer, and indeed that is beginning to happen. I believe that even the sub-prime mess is about increasing oil prices increasingly removing once-discretionary income that had allowed the speculation.
3) Essentially all information that we have indicates that the EROI for our major fuels (solar may be an exception) are declining over time, so that in the future society will be having to invest much more money and energy into getting the necessary fuel to run the economy than we do now (e.g. Hall et al. in press). Thus we can tell investors that this is not a good time to invest in additional Caribbean hotels, new restaurants and so on. Both society and individual people will be spending far more of their income on just getting the energy to make the economy work, , resulting in a serious diminution of discretionary income and everything dependent upon it (e.g. Hall et al. in press, http://www.theoildrum.com/node/3412 )
4) EROI can be used to help evaluate which alternative fuels are likely to be the most viable economically in the future (See the “balloon” graph in the above post)). Those investors who had used EROI information to guide investments in the last few years avoided being burned in the corn-based ethanol boom and bust. Similarly, science can tell you now that we have not yet broken down cellulose on a commercial scale, and that to maintain the conditions where this has been done in the laboratory on a large scale is extremely difficult. So much for the present-day advocates of switchgrass and other cellulosic alcohol. Maybe we can do it, but should we bet the house on a maybe?
5) EROI can be combined with estimates of the total magnitude of resources to indicate which fuels are likely to be able to make significant additions to US energy resources. For example, rapeseed is an attractive potential for biodiesel but the entire area in which rapeseed can be grown with a significant net energy gain probably is not enough to make a substantial contribution to the US liquid fuels budget.
6) Environmental issues can be included in EROI analyses, allowing a more comprehensive analysis of EROI. For example if growing a biofuel causes soil erosion the energy cost of making fertilizer to restore the fertilizer can be readily factored in.
Thus there are many reasons that good energy and EROI analysis can help guide the policymakers, investors and interested members of the public.
Part II
REQUEST FOR HELP TO READERS OF THE OIL DRUM
I have been involved in attempting to examine the relation of energy costs and gains of various living creatures (e.g. migrating fish, trees growing at different places on a mountain) and of energy used by humans (e.g. petroleum, coal, nuclear, biomass) for most of my professional career, that is since 1968. Various publications on this issue are available at my website (http://www.esf.edu/efb/faculty/hall.htm). It is my opinion that such energy return on investment (EROI) analyses are critical for how we understand our future energy possibilities and also about how we should make investment decisions about energy now. For example, from the perspective of society (but not necessarily the individual investor) it might appear to make a lot of sense to invest in oil at the present time, when substantial amounts of oil might be forthcoming and prices are good, but if in fact what we are doing is simply accelerating the depletion of existing reserves, rather than finding new reserves, then the net effect is simply robbing tomorrow’s Paul to pay for today’s Peter. i.e. accelerating the negative effects of oil depletion at some future time. What we really need to do is to decide what might be optimum investments based on (for our purposes) the EROI for the present and as projected to the future.
EROI is of course not by itself a sufficient criterion to make decisions about which energy resources should or should not be developed, encouraged, subsidized or whatever, but it is an important criterion. Obviously if an energy resource requires more fuel, or nearly the same amount of fuel of a higher quality, to create as is gained from its development then that is probably by itself sufficient reason to recommend against its production. In addition, other things being equal, it makes sense to develop that fuel which has the highest EROI. Of course it is rare that other things are equal. The most important additional criteria is the potential magnitude of the resource. In the United States, for example, really high quality geothermal sites (such as the Geysers in California) are rare, although low quality sites, with much lower or essentially negative EROIs, are abundant. The second most important additional issue is probably environmental issues, and our analyses attempt to assess each of these. Other issues that might also need to be addressed include: availability of, and impact upon, labor, land requirements, financial issues and so on.
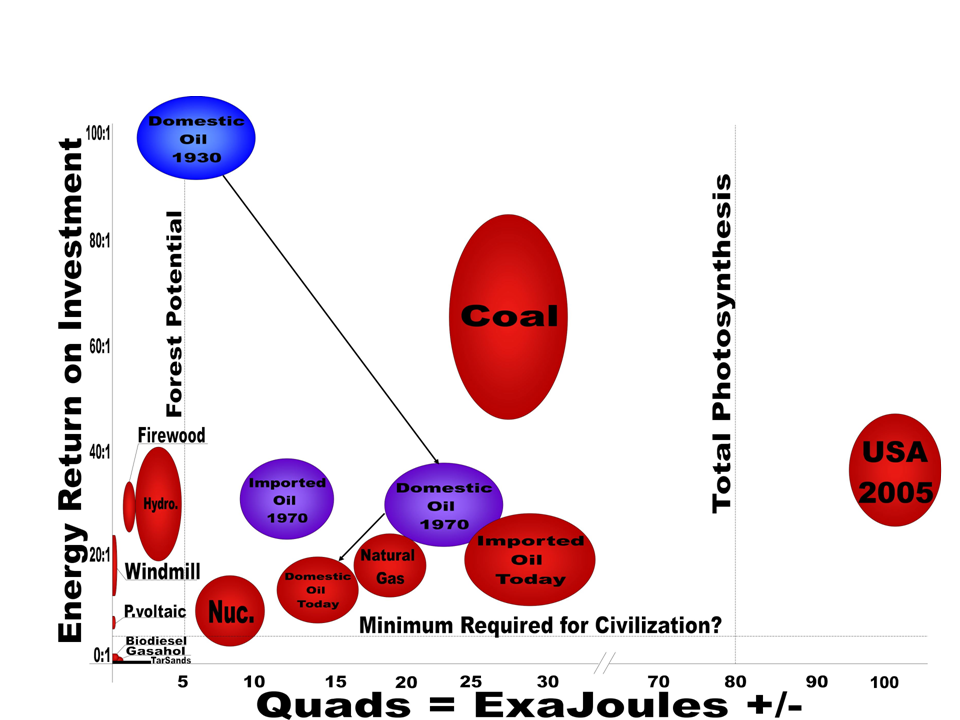
“Balloon graph” representing quality (y graph) and quantity (x graph) of the United States economy for various fuels at various times. Arrows connect fuels from various times (i.e. domestic oil in 1930, 1970, 2005), and the size of the “balloon” represents part of the uncertainty associated with EROI estimates.
(Source: US EIA, Cutler Cleveland and C. Hall’s own EROI work in preparation)Click to Enlarge.
The results of our long term and recent analyses have been published recently on TOD (http://www.theoildrum.com/node/3412) as “The balloon graph”, a graph indicating the quantity (amount used in the U.S. per year for various years) and quality (EROI) of the main and possible fuels used in the U.S. What we want to do next is to utilize the considerable experience of the readers of the oil drum to criticize and, especially, expand upon our recent efforts to summarize what is known about the EROI, potential magnitude and environmental impact of various fuels. If you are interested I have prepared a preliminary summary of what we were able to summarize about existing studies of these issues for many different fuels. This summary was prepared by a month long study of about a dozen Graduate and undergraduate students at my College (The College of Environmental Science and Forestry of The State University of New York –i.e. SUNY ESF) in May and June of 2007. While I felt that the study was fairly exhaustive our preliminary results have been criticized in various ways, especially from the perspective that “There must be more studies than you have found”. I agree, and seek your help in this endeavor. So we will present in TOD our summary in four sections in four successive postings of TOD and we seek your input. The rules of engagement are simple: if you know of additional studies that would reinforce or refute (or anything else) our basic analyses then post them to TOD. We seek especially objective results that are published in peer reviewed journals (the normal gold standard of science) and we seek to avoid self aggrandizing reports by interested parties –i.e. someone with something to sell -- or the opposite. We are also seeking actual measured analyses vs. hypothetical assessments of where the technology might be headed. We also would welcome the responder’s opinion of the piece put forth.
We are also attempting to develop at this time, independently, a more explicit protocol for deriving EROI and associated criteria. We recognize that a lot of the difference amongst different estimates for the same fuels at this time are definitional and especially relate to the boundaries used, an issue that we are attempting to deal with independently. An example of the confusion we face relates to the messages that came in to the earlier posting on TOD of our “balloon graph” where as one responder (mkwin) states that there was a new study indicating that the EROI of the Forsmark nuclear power in Europe was some 93 returned for one invested. But the next responder (Chris) stated that since the enriched fuel had been provided by France, where some 3 of 21 or so nuclear plants were required to enrich the fuel used by the 21 plants then the maximum EROI would be about 7 to 1, something, more in line with our own earlier conclusions. Or is it? So we will see how this goes, filter the responses and try to get a more substantive basis for our various EROI estimates from the results. So if you are interested in this issue read on.
The four sections that will be posted are: 1) conventional fossil fuels 2) Nuclear fuels 3) geological sources and 4) biomass fuels.
Literature
Campbell, C. and J. Laherrere.1998. The end of cheap oil. Scientific American (March): 78-83.
Cleveland, C. J. 2005. Net Energy from the Extraction of Oil and Gas in the United States. Energy: The International Journal 30(5): 769-782.
Cleveland C.J., Costanza, R., Hall C.A.S. & Kaufmann R.K. 1984. Energy and the US economy: A biophysical perspective. Science 225: 890 897.
Hall, C.A.S. 1972. Migration and metabolism in a temperate stream ecosystem. Ecology 53: 585-604.
Hall, C.A.S. and C.J. Cleveland. 1981. Petroleum drilling and production in the United States: Yield per effort and net energy analysis. Science 211: 576-579.
Hall C.A.S., Cleveland C.J., & Kaufmann R.K. 1986. Energy and Resource Quality: The Ecology of the Economic Process. New York: Wiley Interscience. (Reprinted 1992. Boulder: University Press of Colorado.)
Hall C.A.S. 1992. Economic development or developing economics? Pages 101 126 in Wali M, ed. Ecosystem Rehabilitation in Theory and Practice, Vol I. Policy Issues. The Hague, Netherlands: SPB Publishing.
Hall C.A.S. ed. 2000. Quantifying Sustainable Development: The Future of Tropical Economies. San Diego: Academic Press.
Hall, C.A.S. and J.Y. Ko. (2006). The myth of efficiency through market economics: A biophysical analysis of tropical economies, especially with respect to energy, forests and water. In LeClerc, G. and C. A. S. Hall. Making world development work: Scientific alternatives to neoclassical economic theory. University of New Mexico Press, Albuquerque
Hall, C.A.S., R. Powers and W. Schoenberg. (in press). Peak oil, EROI, investments and the economy in an uncertain future. Pp. xxx-xxx in Pimentel,
David. (ed). Renewable Energy Systems: Environmental and Energetic Issues
**Acknowledgements: I thank the Santa Barbara Family Foundation, the Interfaith Center on Corporate Responsibility, The Tamarind Foundation, Boston Common Asset Management, and ASPO USA for financial support for this research.
Contact
- Content: editors at theoildrum dot com
- Tech support: support at theoildrum dot com
License

This work is licensed under a Creative Commons Attribution-Share Alike 3.0 United States License.
Your reddit link to upmod this story can be found here: http://reddit.com/info/6e6mx/comments/
Thanks for your support.
The latest centrifuge for enriching uranium is 20 times more efficient as previous models
http://www.popularmechanics.com/science/extreme_machines/4257042.html?se...
Hum... The previous model was gaseous diffusion.
http://www.usec.com/Downloads/AmericanCentrifuge/KNS_02172008_SpinMaster...
Usually centifuges are expected to use 40 times less energy than diffusion and Paducah is kind of old so, aside from increased volume, this sounds like a step backwards. Time to ditch those shares maybe?
Chris
I do wonder. The generally proposed solution to all these problems here on TOD is to switchover the whole economy to zero EROI. See all the links to "limits to growth" etc.
So I wonder how one can think about this
1) clearly, we should not complain about "low" EROI if our solution involves (maximum) zero EROI or even negative EROI. Zero or negative EROI is obviously not a solution for "low or negative EROI" problems (ie. peak oil).
2) using as an assumption that there aren't any (reasonable) limits to growth (or at least none that will prevent the human race from advancing) *ever*
Personally I think I like option 2.
Huh?
No growth does not equal zero EROI. The latter would mean death. Even a 1:1 EROI (no net gain) would not support a steady-state economy. On the other hand, no finite energy source, even with 100:1 EROI, can support endless growth.
I see it here all the time: some people cannot disconnect the concepts of exponential growth and merely being alive. All biological organisms use energy, and thus require energy sources with EROI>1, and they all grow for a while as young individuals, and their populations fluctuate, but they all have zero long-term growth in any given finite environment. Like it or not, the planet it finite and our "economy" is a subsidiary of "the environment".
Maybe a helpful concept here is entropy. (Or maybe not...) basically, to maintain our current state of order, we need a net energy input, so EROI has to be greater than 1. Same goes for any biological system. Many people also seem to forget that that net energy input that allows us to exist and defy the second law of thermodynamics comes from one place only: the sun.
You're correct, except that we don't "defy" the 2nd Law. We extract free energy from sunlight down its gradient thru glucose to CO2, H2O & heat, according to the 2nd Law. All these proponents of EROEI analysis seem bound & determined to ignore the sun. Thank you for reminding them where the energy comes from.
for all practical purposes that lead to real or perceived darwinian fitness, energy comes from the ground (in concentrated ancient sunlight form), the biomass (somewhat concentrated old sunlight) and of course current sunlight. Under the Maximum Power Principle as evolved organisms we will grab as much power as we can (collectively). If the current sunlight isn't enough - no problem use the concentrated stuff. On human time scales, that stuff is all FREE (after subtracting energy and resources costs to get it)
Circa 1973 there were several articles in the business and scientific press on the hydrogen economy. One was in Scientific American titled The Hydrogen Economy. I believe that it was the January issue. If memory serves a major theme was that hydrogen could be produced using nuclear or solar energy and used for transportation. There were of course major problems which were discussed. I was more interested in a minor theme, the epithermal concentration of minerals. As I recall it was postulated that the earth was heated primarily by gravitational collapse with an additional input from radioactive sources. As the earth cooled minerals were concentrated by epithermal deposition as they precipitated under various degrees of heat and pressure. The resulting concentration of copper, silver etc. was essentially an enormous gift of low entropy. How does one account for this gift?
This debate that keeps coming up on the earth as a closed vs open system as it relates to net energy has its merits. We're certainly not going to be importing fuel from Mars, but the sun exports massive amounts of free energy to us every day, nearly all of which we waste. If we had electrical lines running from umpteen billion acres of solar panels running all our drilling rigs and electric cars, net energy would be a moot point. A similar argument is made by Huber and Mills in their thought provoking book "The Bottomless Well: The Twilight Of Fuel, The Virtue of Waste, And Why We Will Never Run Out Of Energy". Here they point out that energy does not get used up - it merely changes forms. We just need to get more chemically clever about capturing energy as it changes forms. This cleverness ultimately would be limited only by the 2nd Law of the earth's closed system, and not even by that if you consider the sun.
But it's also true that for all practical purposes, energy comes from the ground. We don't have umpteen billion acres of solar or the chemical cleverness Huber and Mills envision and won't anytime soon. But we certainly will be running up against all the net energy problems very soon.
Thomas Edison seemed to have a handle on all this way back in 1931. He said in a conversation with Henry Ford on the rush into oil:
My own impression is that the Solar Source of Earth's energy is mentioned with extreme frequency. Where have you been keeping yourself?
Nate, thanks for initiating this. Very important work. And as Alan might say, best hopes that this will help folks recognize that there are very real limits to growth and that we are bumping up against them. Perhaps you would post your very fine graph showing the net energy curve, and Euan's version of the net energy cliff as visual aids.
Thank you Charles for sharing your work.
I have a suggestion for your balloon graph to make it more understandable to a person not quite familiar with all the concepts and assertions. Create an "interactive" version in which the text either:
1) hyperlinks to additional pages that explain what each bubble represents (like for "Coal" it could tell if it is just US or worldwide data, tell if it it includes things like transportation and conversion to electricity, and perhaps include graphs showing how EROI has trended over time
or
2) pops up "mouseover" text that gives a very short summary of what the bubble represents
Personally I like #1, especially since you already allude to some changes in EROI over time and the auxiliary pages would be a good place to show that for all the energy bubbles.
The bubble graph is a powerful tool. Anything you can do to make it more easily understandable and user-friendly will go along way towards helping people get the message you are trying to communicate.
Greg in MO
I appreciate all of the research you have been doing in this area!
One question that bothers me is the vastly different price per Btu that different fossil fuels command. This is a graph, based on data from the 2008 Annual Energy Outlook (Early Release) of a history of prices, in 2006 dollars.
To maintain these differentials, it seems like we need to have very high EROI for coal and natural gas, relative to oil. Otherwise, the energy used for these sources must come from like sources (coal from coal, natural gas from natural gas).
I think that the fact that we are past "trough fossil fuel energy price" in 2006 dollars is important also. This would seem to say that the growing efficiencies of producing the fossil fuels have been cancelled out by other factors, like lower EROI. Electricity follows a similar pattern, with a smaller dip, since it is more a function of coal and nuclear.
These things are probably outside of what you plan to discuss, but if you have any insights, I would be interested in hearing them.
Perhaps the price discrepency can be summed up by the words 'immediate utility' and 'demand'.
If we started to turn coal into Petroleum I would expect the yellow line to rise up just as we have seen the price of corn rise...
Nick.
The combination of that price per BTU chart and the EROI bubble map above shows how desirable coal is as a major problem solver in peak oil. The coal circle stands apart from the other circles as a solution. It's really tragic that coal suffers the greenhouse problem so much more than the other solutions and points out the urgency of clean coal technology development.
If you look at how to guage the effect of declining EROI over the history of global oil production, you can get a sort of "EROI adjusted" Hubbert's peak. It does make a difference from the first half of production to the second half. And then we are adding all the oil substitutes, so many of which are of worthless or minimal net energy levels. If you lump them into the declining EROI for conventional oil, you get a diagram I posted here about a week ago. Many of the things we are putting into that zone between conventional oil and total liquids are contributing to the net energy curve, but far too many of them aren't pushing the curve out much at all.
Considering the net energy cliff implications we are coming up against in a few short years, it's imperative that we get this oil/EROI thing figured out soon.
As a first question, Gail, is the price of coal/btu shown here, the price of thermal coal delivered to the electrical generating plant, or the price of coal delivered to my yard from where I can haul it and dump it down a chute, from where to refill my furnace I can shovel it every few hours once I've gotten the fire going?
I wonder if the price per btu of natural gas includes the effort of programming my thermostat and arranging for pre-approved payments at my bank?
I'm afraid it is whatever EIA says it is. I haven't investigated the details. Given the low cost for coal, I would think that the costs are before delivery costs are added. Delivery costs would be high for coal, because it needs to be transported by rail / barge / truck. This may explain some of the difference between it and the other fossil fuels.
I looked at Jon Friese's graph down thread. The NG prices from the EIA are definitely the wellhead prices. If, as Jon says, delivery costs approximately double the NG cost, that may explain a big piece of the difference. It would be much better to use data including delivery costs. Delivery costs would also add something to oil, but not as much.
Not to mention that, with respect to transportation, the coal is not useful until it is converted into electricity or liquid and then actually inserted in the gas tank or used to recharge the batteries. The true cost of coal is a function of the ultimate use and the price per btu as an end product is much higher than the raw cost of coal, say, delivered to a coal fired electric plant.
I would've thot that Black Mesa coal I see people selling by the sack or pickup load along the roadsides around here would be pretty useful in the stove. Guess I'll just stick with wood, then...
if it takes 5 btus of coal or natgas or nuclear to make one BTU of transportation fuel on a wholesale basis, the wholesale price of each should be the basis of comparison. the cost of a barrel of crude from tar sands is the same as th cost of a barrel of oil from the north sea. the eroi of the latter might be very high vs. the former, while the absolute returns of the former are much higher due to cost inputs.
the price per BTU at the point where one energy is converted to another the only relevant price. so we should consider the price to suncor of natgas and coal delivered to their tar sands projects in ft. mcmurry -- low EROI but very strong ROI.
seems to me EROI analysis is ignoring the utility function expressed int he wholesale BTU price.
These price differences underline the issue of "energy quality" which must be addressed to get EROI straight. Per-BTU is not the most useful measure. E.g., electricity is certainly of higher quality than coal. But sometimes quality seems unclear, or not possible to delineate on one axis. E.g., how would you compare electricity and oil? Given the use of oil for transportation, and the _current_ unsuitability of electricity for the same purpose, is oil of "higher quality"?
One important detail in the above price chart: the pause in the price rise of NG in the last couple of years. Especially given the peaking of NG in North America. (And I assume that chart depicts prices in the USA.) I believe that that dip in NG price is a result of the shutting down of fertilizer and plastics factories in response to the preceding rise of NG prices - these industries have moved to places with still-abundant NG, such as Trinidad or Qatar. The resulting "glut" of NG supply in the USA (relative to demand) is temporary: as demand from other uses grows and catches up with declining supply, expect the price curves of NG and oil to again correlate. One indication that NG prices are artificially low right now is the fact that in parts of the US it is now cheaper to heat with electricity (using plain resistive radiators) than to use oil or propane for heat. If this situation lasts, it would shift more of the heating load onto electricity, causing more demand for NG, and eventually increasing the price of NG - above a per-BTU parity level, since power stations are much less efficient than good non-electric home heating devices.
Regarding NG price, I think a couple of warm winters may have helped the cost trend also.
Another reason that I expect the price of NG will need to increase is to encourage the production of tight gas/shale gas. These tend to be higher cost, probably due to lower EROI. If we really need the NG for heat and electric, it seems like the cost relativity to oil is likely to increase.
Dear Prof. Hall,
perhaps another 'balloon' could be added to your diagram -an 'Energy Efficiency' balloon. This would reflect the amount of Energy that could be saved by things like replacing tungsten light bulbs, better insulation, etc. I think McKinsey has published some studies on how big the energy savings could be. I assume this 'efficiency bubble' would counteract overall EROI decline.
Regards, Nick.
Nick, you make an excellent point.
If we measure EROEI at the production end, we should also have a statistic for work done per unit of energy at the consuming end.
Compare the amount of fuel consumed for example to 50 move miles per hour on level ground with a 2500 pound vehicle in say 1970 to today.
Or the energy consumption of operating a television set for one in 1970 to today, or the energy consumption to maintain X tempeture in a refrigerator of X square feet. Work done for energy consumed.
I think people would be amazed at the difference over 30 years.
RC
Thats a very important issue, but one separate from the supply side. You are talking about demand changes via conservation and/or efficiency which is different from the fundamental energy qualities/characteristics of a fuel. HOW you use it after you've spent the energy to get it.
True, but it seems impossible to speculate on the effects of decreasing supply without considering the demand side. One has to take both together to comment on potential impacts. Since our systems our highly inefficient, I believe that the demand side could fall significantly while energy supply falls, keeping our standard of living in balance for the immediate future. For example, with the advent of global networks, air travel hasn't been needed by most for over twenty years now. In reality, the Haves will continue to abuse the resources and the Have Nots will continue to increase in suffering so I am just rambling.
Hmmm... since EROEI has been falling since 19XX, it could be proved that it has an effect on our standard of living and then speculation based solely on the supply side would be okay.
I think the Professor Hall's analysis is awesome and love that bubble graph.
Well we have had a tremendous amount of wealth concentration at the high end since the 1970's this concentration effect alone can keep the standard of living of the wealthy increasing even as the standard falls for the rest.
On the lower end we have been blowing a credit bubble since the 1960's and moved to two income families and overall oil has been cheap. So the low end even as its been drained has managed to keep extending itself by adding wage earning power via first women going to work then making higher wages and via credit.
Also in general we have increased the educational level with a lot more college degrees again increasing the average wage. And finally rebuilding from WWII/Communism is just now coming to a end with the world producing evenly in a pattern similar to the 1920's. This is the first time since the 1920's that we have had most of the globes economies working. This growth in china/Russia etc have fed the older economies esp financial/banking.
And of course technology has advanced allowing excellent efficiency gains where it makes economic sense.
So despite the peaking of average energy usage we have had a lot of trends that have allowed the GDP to keep growing outside of efficiency gains which can continue a lot ending in effectiveness. For the US in particular the move to a dual income pretty much peaked in effectiveness over the last ten years. Now the need to have two wage earners who's jobs may prevent both moving close to work results in flat are negative income gains.
In any case we have had a lot of other trends taking place which in my opinion have masked the effect of peak energy for some time. You would have to look at the lifestyles of the working poor to see if they are better off now than say in the 1970's but at least in the US racism played a big role in the earning power of the poor until recently. I'm not saying its gone but its difficult to split out increases in earning power as racism receded from a underlying drop/flat result because of peak energy consumption.
In closing too many factors are at play in the US to get a clear signal and Japan/Europe where devastated by war etc. Actually about the only place you might easily look could be say Egypt but they don't really have technology? I find it hard to think of a place that not suffered other issues which swamped the underlying energy trend.
Maybe Sweden could be used as a baseline Norway is out because of the oil. Sweden and Finland might be one of a handful of technically advanced countries that down have significant other effects.
Interesting for Finland on a energy basis they are flat.
http://earthtrends.wri.org/pdf_library/country_profiles/ene_cou_246.pdf
Here is the percapita GDP I'm certain its not inflation adjusted.
http://earthtrends.wri.org/pdf_library/country_profiles/ene_cou_246.pdf
Its increased from 10,00 in 1980 to 30,000 USD per person.
Adjust for inflation they have been flat to decreasing over time.
This is a fantastic paper with a different view point and Finland fares well.
http://www.scribd.com/doc/100405/Usable-Productivity-Growth-in-the-Unite...
I urge you to read it. So it depends. However in general we have not seen blazing growth once you do a few adjustments. If the paper had say included adding the two wage earner effect over the time period and growth to parity in wages coupled with increased eduction rates neither of which are long term stable I'd say the most of these would be zero.
If you then do a quality of life metric with the assumption that you could live comfortably on a single wage and the second wage earner was optional or a lifestyle choice i.e one could choose to say home and raise kids go to school etc. then its decidedly negative.
The energy return of insulation is very dependent on on the type of insulation. Blown in cellulose made from recycled paper has a very high EROEI. Fiberglass on the other hand may be a net energy loser. Manufacturing fiberglass is very energy intensive. An argument was made that installing more than 3 inches would use more natural gas than the amount saved over the next 20 years. These figures though were based on 1970s technology.
Consider this example. Before any insulation was installed a house used 100 units of fuel. After installing a layer of insulation use dropped to 50 units resulting in a net of 50 units. Then a second layer of equal thickness was added and fuel use was cut in half again. This second layer though only saved 25 units of fuel. Additional layers each save smaller and smaller amounts of fuel until the amount of fuel used manufacturing the insulation exceeds the amount of fuel saved. In a time of shrinking fuel supply the question of best use of what remains becomes more and more significant.
Um...France has 58 reactors (59 if you include the FBR Phenix) not 21. Also the reactors used for enrichment are smaller than the fleet average and only 75% of the uranium enriched is used in France's reactors, the rest being exported.
It's also disingenuous to characterise nuclear's EROEI by only considering energy intensive diffusion enrichment, when it comprises only 40% of enrichment capacity today and will fall to 0% within the decade.
We are also attempting to develop at this time, independently, a more explicit protocol for deriving EROI and associated criteria. We recognize that a lot of the difference amongst different estimates for the same fuels at this time are definitional and especially relate to the boundaries used, an issue that we are attempting to deal with independently. An example of the confusion we face relates to the messages that came in to the earlier posting on TOD of our “balloon graph” where as one responder (mkwin) states that there was a new study indicating that the EROI of the Forsmark nuclear power in Europe was some 93 returned for one invested. But the next responder (Chris) stated that since the enriched fuel had been provided by France, where some 3 of 21 or so nuclear plants were required to enrich the fuel used by the 21 plants then the maximum EROI would be about 7 to 1, something, more in line with our own earlier conclusions. Or is it? So we will see how this goes, filter the responses and try to get a more substantive basis for our various EROI estimates from the results. So if you are interested in this issue read on. - Charles Hall
So far advocates of the EROI approach have demonstrated nothing but their own incompetence. Aside from getting off on the wrong foot by not checking his facts, Charles Hall demonstrates a deeper problem with the EROI approach. Suppose Hall counted French reactors correctly, what would that tell us? It tells us that the French use a very inefficient uranium enrichment technology, but very little about the potential efficiency of the nuclear power. A number of Western European countries rely on a uranium enrichment technology that is 50 time more efficient than the French technology, but the Canadian's build a reactor that is so efficient that they do not need to enrich uranium at all. Which technology do we index for our EROI of nuclear power?
Does it make any sense at all to talk about the EROI of Lemhi Pass Thorium? Thorium Energy, Inc., has stated:
"the Company’s claims are significant mining veins, which contain 600,000 tons of proven thorium oxide reserves. Various estimates indicate additional probable reserves of as much as 1.8 million tons or more of thorium oxide contained within these claims."
"In fact, vein deposits of thorite (ThSiO 4), such as those that occur in the area of the Lemhi Pass, present the highest grade thorium, mineral, and are believed to contain approximately 25 to 63 percent thorium oxide (ThO 2) per ton of raw ore. Thus one ton of thorium ore could potentially yield as much as 500-1,200 lbs. of high grade thorium oxide (ThO 2), as compared with less than one percent of raw Uranium ore that is typically utilizable."
http://www.thoriumenergy.com/index.php?option=com_content&task=view&id=1...
A ton of thorium can produce up to a GW of electricity a year.
A comment on my blog noted:
"Consider the implications of the Lemhi-Pass Thorium finds of 25%-63% Th oxide content."
"At 25% the reactor needs mining of 4 tons/year. This can be easily accomplished by 4 guys with shovels and a pickup in a day. "
"TO PRODUCE 1 GWyear."
"Probably the best EROEI of any technology ever."
What is the significance of EROI here? Why would it matter?
EROI X Scale = Energy surplus.
Is thorium and all the non-energy inputs scalable?
What about the cost to build new plants that require fossil fuel based processes to build?
What are the environmental issues with mining/using thorium?
Can the scaling of nuclear/electricity based transportation happen fast enough to overcome global (geological/political) depletion of high EROI liquid fuels? (e.g. can we build a new high energy gain system while the old high energy gain system is in decay?)
(I don't have the answers to any of these questions but they all would need to be considered)
EROI X Scale = Energy surplus.
Is thorium and all the non-energy inputs scalable?
What about the cost to build new plants that require fossil fuel based processes to build?
What are the environmental issues with mining/using thorium?
Can the scaling of nuclear/electricity based transportation happen fast enough to overcome global (geological/political) depletion of high EROI liquid fuels? (e.g. can we build a new high energy gain system while the old high energy gain system is in decay?)
(I don't have the answers to any of these questions but they all would need to be considered) - Nate Hagens
Nate, You must be joking. There are well documented studies of the energy input in reactors. Dr. Ralph Moir has studies the cost of electrical production from a thorium fuel reactor. Go here (http://www.geocities.com/rmoir2003/2mlt_slt.htm)
and down load "Cost of electricity from Molten Salt Reactors (MSR),"
(The MSBR design he studied is put of date.)
You ask, "What are the environmental issues with mining/using thorium?"
Quick answer, probably far less than with uranium based nuclear power, because the fuel comes out of the ground at much higher levels of concentration, and thorium based reactors can produces electricity at much greater efficiency, than current uranium based nuclear power technology.
"Can the scaling of nuclear/electricity based transportation happen fast enough to overcome global (geological/political) depletion of high EROI liquid fuels?" Quick answer: That depends on political and economic decisions. We can if the decisions are made to make the resources input a priority. A little fear increases decision makers intelligence markedly. Of course a lot of fear makes everyone stupid.
No. I wasn't joking. I don't know much about nuclear, though one of Charlies pieces is an EROI analysis of nuclear which will be up in 2 weeks. I'd prefer to defer the nuclear EROI discussion to there but a quick, stupid question:
If thorium is the cats meow, why aren't smart, self-interested individuals and groups rushing like mad to scale thorium reactors for profit and glory?
If thorium is the cats meow, why aren't smart, self-interested individuals and groups rushing like mad to scale thorium reactors for profit and glory? - Nate Hagens
Does the name Conrad Windham ring any bells?
http://www.touchbriefings.com/pdf/2980/windham.pdf
Jack Lifton has been writing about thorium for investors during the past couple of years.
In a advisory which he dated February 22, 2007, http://www.resourceinvestor.com/pebble.asp?relid=29249
Lifton wrote:
"Look at the U.S. Geological Survey (USGS) documentation on thorium, but, be aware, that it is out of date. The current USGS material shows the U.S. with less than 200,000 tonnes of thorium reserves. In fact a new company, so far private, Thorium Energy, Inc. told me that the unpublished results of a new study commissioned by it from the USGS that show that TE’s Lemhi Pass property in Idaho has 600,000 tonnes of thorium reserves by itself. This if proved out would give the U.S. the largest reserves of thorium in the world, and would in fact be more than 1/3 of the world’s known thorium."
Lifton added:
"Thorium Power, Inc. has told me that they already have the technology to “switch over” from uranium to thorium more than 60% of the reactors in use today in the world."
"They said that a switched over or built from the ground up thorium powered reactor has for the “blanket” a total of three times the life of a uranium powered reactor. This would mean that the savings during the first fuel cycles will pay for the changeover in the case of a “retrofit.” The core can be used to burn fissionable grade plutonium to non weapons grade material while the blanket will be made from thorium and uranium-233, not 238, so that no weapons grade plutonium-239 can be produced in the reactor."
In another advisory dated February 27, 2008,
http://www.resourceinvestor.com/pebble.asp?relid=40784
Lifton discussed a paper by Richard Reed, a consultant with Idaho Engineering & Geology, Inc, and Dr. Virginia Gillerman of The Idaho Geological Survey, that had been presented the day before at the annual meeting of the Society for Mining, Metallurgy, and Exploration. The title of the Reed and Gillerman paper was “Thorium and Rare Earths in the Lemhi Pass Region.”
Lifton reported that USGS thorium specialist "Mr. James Hedrick was in fact the moderator of the special session of the SME where Reed and Gillerman presented their current results. Mr. Hedrick has stated that the credibility of the work by Reed and Gillerman and the extent of the deposits mapped by them will cause the USGS to re-evaluate both their thorium and rare earth mineral commodity surveys, and that later in the year the figures for the reserves and resources of both the US, and the world, for thorium and the rare earths will be revised to take into account the very large amounts of both which are now proved to be present in the Lemhi Pass region."
Lifton demonstrated his intelligence by referring to my blog "Nuclear Green" for a further background to his advisory.
On February 28, 2008, Lifton added more details from the Society for Mining, Metallurgy, and Exploration's annual meeting.
http://www.resourceinvestor.com/pebble.asp?relid=40858
Lofton commented:
"The disconnect between the usual conservatism of professional geology and the hype of commercial promotion, usually downplayed, or ignored, at ‘investment conferences,’ was much in evidence at this meeting. Ironically, it was the businessmen who were sceptical, and the professionals who were excited."
As to why "smart, self-interested individuals and groups rushing like mad to scale thorium reactors for profit and glory? " I for one am. are there any other "smart, self-interested individuals" reading my words?
While I don't have a reference for this, apparently U233 from thorium is always contaminated by U232, which is quite radioactive. This would increase handling expenses. Of course, if the Th is transmuted and "burned" in place, it would cease to be a issue.
Actually U232 is no problem in a reactor where radioactivity is the order of the day. U232 is a problem fore anyone who wants to turn U233 into an atomic weapon.
Well it didn't take McCrab and Barton long to pop out of the woodwork. Where's Dezakin?
I'm glad you fellows are here. I am using a chunk of nuclear sourced electricity at this very moment. Candu stuff at that. Looking at my electricity bill, I note that 'Debt retirement charge/Reglement de la dette' is still biting into my bank account. As it turns out this 'tax' is a gift of the old Ontario Hydro's nuclear build program of the last century.
When do I stop paying?
When do I stop paying? - toilforoil
Probably not for a long time, those new Ontario nuks have got to be paid for. But if it is any comfort, you may be paying a little less taxes for health insurance, since Ontario doctors are convinced that a shift away from coal fired plants will lower healthcare expenses.
Oh, I'm not paying for new nukes. I and millions others are paying for the old nukes. It is, afterall, called debt retirement, at least in English. You nukees keep telling us that your product has a magnificient return on energy invested, and yet after buying in, we pay and pay and pay.
As for the costs of health care, I recommend less stress, more walking, less gadgets, less eating, less phamaceuticals, more laughing, less cows, pigs and chickens, more brocolli...and especially more self-knowledge.
Don't worry toilforoil, there are at least two factors that mitigate your fission-based electric cost. One is the general increase in fuel costs. Since nuclear fuel contributes a small fraction of its electric rate, unlike fossil fuel costs for their electric rates, your rates should trend favorably compared to those unfortunates without fission-based electric. Another is that wizard Bernanke is casting his hyperinflation spell on the dollar, and probably the Loonie too, so we Yanks are effectively retiring that tiresome debt as a bonus. Now you can't say that we never did anything for you! :-)
BTW, there is a rather large charge that does not appear on your power bill, but that you are paying along with everyone else. Air pollution with GHG is reducing health and increasing mortality now, and will continue to do so for centuries, if you accept AGW, which I do.
It's his turn to fondle the fuel rod.....lucky bastard!
He didn't even consider CANDUs that can run on natural uranium without enrichment. They usually don't though, because enriched uranium has higher burn-up.(i.e. the lower EROI enriched uranium makes more financial sense)
Also depending on how you define your system boundaries you'll get different EROI. Consider for instance if you had oil that you want to extract, but can only extract it if you burn over half the oil in place in situ.
If you consider this energy to be part of the system you clearly get an EROI <1, but society as whole can still gain usable energy from extracting this oil as the energy you spent wasn't spendable in any other way. If you don't consider it to be part of the system you get an EROI that could be far in excess of unity, but that doesn't accurately reflect how dirty your extraction method was nor that a lot of the oil in place was burnt.
He didn't even consider CANDUs that can run on natural uranium without enrichment. They usually don't though, because enriched uranium has higher burn-up.(i.e. the lower EROI enriched uranium makes more financial sense) - Soylent
I didn't need to for the direction of my argument which was to point to problems with the EROI concepts. In fact, CANDU reactors can recycle "spent fuel," from American LWR, and generate electricity from it. At the moment enriched uranium is artificially cheap, due to the post cold war effort to burn up cold war atomic bombs.
The part I have emphasised is false. Every CANDU and CANDU clone to date has run on unenriched UO2 and nothing but.
The speaker may be confused by talk of the Advanced CANDU (ACR). It is specified to burn slightly enriched uranium, and thereby be able to run with a smaller heavy water inventory. No ACR has yet been built.
(Last year a CANDU started up in Romania and a clone in India.)
Boron: A Better Energy Carrier than Hydrogen?
Dr. Hall (and Nate)
I totally agree that EROI needs to be positive. But how positive is debatable. The key in my mind is how much consumption needs to be met?
Analyzing fossil fuel use in the developed world in order to find a large supply of high EROI energy to replace it, is the wrong approach.
It is like taking a conventional house in the U.S. (an inefficient energy hog) attempting to put up solar cells and wind turbines to meet demand, and saying that renewable energy is not viable. The key is to redesign the house to use passive solar, replace appliances and reduce the peak energy demand to a level that can be met by renewable and then install the correct mix of renewables for that site. Small change in lifestyle huge reduction in energy consumption that can now be met with a "poor" EROI energy source
Your approach is correct to find all renewable sources that are EROI positive. But this search can't be confused with comparison to current fossil fuels use, IMHO.
A lot of food is not grown in a positive EROI way today, but we do it anyway. We do it because it is economically advantageous for someone to do it that way, not because it is the most energy efficient way to grow food. I am convinced that most fossil fuel use is this way. We have created systems that are inherently energy inefficient because there is/was an economic advantage to use that approach. The alternatives were driven out of our society decades ago with the easy access to energy.
A different manufacturing approach would have been/will be used in the future when energy is scarcer. These different approaches should have large impact on the calculation of EROI because the same energy is likely to be gotten out but much less or a very different kind of energy put in.
I am in no way disputing your authority in this field. I am raising the possibility that we haven't made much gain on EROI since the 1970's because we deliberately turned our backs on this approach because our economic approach rewarded it. The whole system is designed (rigged?) towards a poor EROI in order to consume lots of energy.
The Second Law ensures that EROI will always be negative. Calculations that give a positive EROI simply ignore certain inputs. Which inputs to ignore is an arbitrary decision. This arbitrariness is why EROI is not a very useful metric, contrary to the views of these authors.
This is false.
A) EROI is a ratio so can't be negative (minor quibble), but more importantly
B) we care about energy to do work. If there is a pool of oil in my backyard that can be sucked out with little energetic effort, the loss due to second law still leaves a HUGE positive energy gain that can be later used in various special ways. Your comment is only correct if you measure it on a time scale of hundreds of millions of years which is irrelevant to modern civilizations usage of oil.
C)I agree EROI ignores certain inputs, specifically non-energy inputs like water, soil erosion, GHGs, etc. But it does not ignore energy inputs (except very narrow bounded studies or ones that are incorrect)
What metric would you prefer?
If you've been following my posts you will see that I take the long view.
You simply ignore all the starshine that went into biofuels, fossil fuels, even fissile isotopes. You can speed, steal, even kill... but you can't break the 2nd Law.
"... but you can't break the 2nd Law." But the 2nd law applies only to closed systems. In open systems the 2nd law can easily be bent: the evolution of complex ordered systems such as life being the primary example.
You can ignore factors that do not have a significant impact on your calculation, it's done all the time and works quite well, Newton's laws being a good example. All "laws" are in fact approximations of one sort of another.
So far as we know, the universe is a closed system. It amazes me how cavalierly you EROI fans simply ignore the sun.
pedantic quibble: It is logically unknowable whether or not our universe is a closed system. A perfectly closed system would not allow exchange of information across system 'boundaries'.
In practical terms, the Earth is an open system. Like you say, we get lots of energy from old Sol. Other considerations apply, as far as the viability of humankind goes.
"... how cavalierly you EROI fans simply ignore the sun." Consideration of the sun's energy input (thermodynamic, electrical, and gravitational) to Earthbound computations of EROI has nothing to do with cavalier attitudes but with problem scoping. At the macro (human)level, the sun's energy can get considered a constant and "free" energy source.
What are the costs in term of planetary homeorrhetic mechanisms of extracting massive amounts of reduced carbon from the crust? I'm more concerned with these costs or "usages" of oil than I am about "modern civilization's useage of oil." What are the biogeochemical considerations that go into the EROI calculations? Are they insignificant? Are they the overriding considerations, or should be? Or are they simply ignored? AGW informs us that these considerations aren't insignificant. By what metric do you quantify these considerations? Perhaps they operate over tectonic timescales. Does this make them "irrelevant"? How do you know? Fact is that you, nor anyone else, knows how to evaluate these input/output, cost/benefit considerations. You arbitrarily decide to ignore factors you don't understand or consider irrelevant to your own interests. If you think outside the mindset predicated by human economics you see how meaningless these EROI analyses are, from the perspective of the planet. And it's that perspective some of us care about the most.
Actually, I've written a mathematical framework for net energy analysis to account for specifically these non-energy inputs that society 'values' which is the headline paper in this months AMBIO- (Royal Academy of Sweden).I'll post a link later this week. But its not for me to decide what society values - my coauthor and I just came up with a theoretical framework so that everybody speaks the same language.
Cool. Will be interesting reading when you post the link.
p.s. Though we tried, we were unable to find a place for the term 'homeorrhetic' in our paper.
Biogeochemical feedback mechanisms tend to be homeorrhetic rather than homeostatic. That is, they track a dynamic rather than a static set point. This is due to orbital forcing, the ratio of carbonate vs silicate rock being subducted at any given time, gradual decline of radiogenic heat over time, etc. Sorry for the jargon.
"If you think outside the mindset predicated by human economics you see how meaningless these EROI analyses are, from the perspective of the planet. And it's that perspective some of us care about the most."
I guess this means that you're on George Bush's party line to god. Or do you have some other means of discerning the perspective of the planet? Oh, I see, you think outside the mindset...and you get to the perspective of the planet. Wow. Transcendentally transported.
As I read Professor Hall's first installment, I noted the cautionary tone in which he made his contention that EROI analysis provides guidance of use to policy makers.
Thanks Professor Hall, looks like you have a winner series here! One question on your statement:
few understand the degree to which most technologies today are principally a means of subsidizing whatever it is we do with still-cheap petroleum
Could the word subsidizing be replaced with the word leveraging? (might help in communicating with the financial Boyz?)
Efficiency in the use of petroleum has increased while there has been a decrease in net energy from petroleum. If efficiency remains a constant while net energy were to merely decrease at a constant rate the net effective energy would decrease at an exponential rate. Is this what is implied in your statement above?
I think that you'll find that the financial boyz have had enough of leveraging and that they are now very keen on subsidizing, especially of their lifestyle by taxpayers,
Peter.
Heh! Peter, you cynic you, where is your trust in the avarice of ones fellow sharptrader? Anyway the Boyz in the back room will be lucky, after the financial dust settles, if there is a single taxpayer left to buy them even a dinner a la tube steak.
"There is a strong view held by myself and others (see references at end) that because our main economic concepts were derived during a period of our expanding ability to do everything – i.e. that more or less regardless of policy we were able to pump more oil out of the ground readily to implement whatever we were trying to do, that conventional economic approaches may have much less relevance during times of contracting supplies."
This is a very insightful point. Consider the "main economic concept" emphasizing the value of specialization. In the early days of the industrial era Adam Smith argued the advantages of specialization with his famous example of pin production. It is almost heretical today to contest the 'truthfulness' of Smith's contention. For many, Smith revealed a universal, timeless truth.
Yet, as Georgescu-Roegen wrote, "The craftsman of the Middle Ages, for instance, had to know how to perform all the tasks required by the elementary process of his trade, otherwise, he would have had to remain idle part of the time and share with others the revenue accruing to labor. Under such conditions, specialization was uneconomical." (Georgescu-Roegen, 1971, pp 236-237)
Georgescu-Roegen argues convincingly that specialization in the factory production process is uneconomical under conditions characterised by low intensity of demand. Idle tools and idle workers still impose costs, but generate no goods or services (and little demand).
If the coal had run out in 1800, would Adam Smith be invoked today?
How Low can EROI Go?
Not to 1:1. Look at this graph of natural gas prices. The well head price is much lower than the delivered price. Looking at the 1990 numbers, you can see that most of the cost was in distribution. By 2008 that had reversed and most of the cost was at the well head but only by a little.
So finding the EROI at the well head is just the first step in calculating the EROI for a fuel source. The distribution cost would at least double the energy inputs.
cool chart - looks like winter of 05/06 retailers made a killing.
Hurricane Katrina.
They made good revenue but were they able to collect? Not in Minneapolis.
They have managed to collect most of that by now, but prices are heading back up (as per your last article).
http://www.startribune.com/business/11227141.html
http://www.startribune.com/local/12448316.html
It makes me worried about the long term viability of these distribution companies.
Yup, distribution, installation, infrastructure, etc are all very relevant. Which is why we see such huge discrepancies between the claimed EROI, and energy payback period, for PV panels, based on energy used in the factory to manufacture them, vs. the real-world installed cost of a PV system, including freight, labor, mounting hardware, cables, inverter, etc. The latter often comes up with a payback period of 20 years or more, vs. several months to 4 years at the factory level.
Which brings up a general issue: what can we, and what can't we, learn about EROI from economic costs. Obviously one should not mix costs from disparate times with very different energy prices. E.g., a PV panel may "pay back" well if the price of electricity rises over time, but that's comparing apples (cost of energy to install the system, at current prices) with oranges (value of electricity provided some years later, at higher prices). Also need to be alert to hidden subsidies (e.g. tax credits fo solar power, or for ethanol). Sometimes the subsidies may get too convoluted to figure out. But on the other hand energy-only analyses may miss important components (such as the labor to install the PV panels), or get bogged down in arguments over the "correct" scope.
I've heard that Dr. Hall believes that an energy source with an EROI of less than about 4:1 is not useful for human society. (See the horizontal line in the bubble chart.) I'd love to hear how he came up with that assessment. In particular, it hints that there are societal (economic?) costs that are necessarily left out of the EROI analysis but impact the usefulness of the energy source nevertheless.
It sounds as though Prof. Hall wants to do another numbers and data filled analysis of a simple minded application of EROEI that ignores logic and market prices and what they mean. This is futile in my opinion. As I have posted many times EROEI is full of logic errors and limited by deeming price and renew-ability as irrelevant. EROEI is only valid when comparing like and like as in two oil wells where inputs and outputs vary. It is also valid in comparing like and like over time as to show that EROEI is declining for oil over time.
Numbers have rules for use which are almost second nature to many of us. Logic also has rules which it appears are not so obvious to even college professors. Those who are enthralled with data seem to discount the rules of logic for some reason. To them if the numbers add up, the conclusion is valid. They know that 2 + 2 = 4 so then they jump to the conclusion that 2 apples + 2 oranges = 4 fruit. In doing this, they do not seem to understand that 4 fruit does not tell us anything about whether apples or oranges are superior. Now suppose we subtract 2 apples from 4 fruit. What is the answer? Some would say 2 oranges, but that is obvious only because we were discussing apples and oranges. 4 fruit in and of itself does not tell us much. Perhaps 4 fruit - 2 apples = 2 tangerines or 2 pineapples, we do not know.
This is the problem when comparing unlike and unlike. The numbers may make sense but the logic does not. The whole point of comparison is to find things that are sufficiently similar so as to deduce another similarity. When unlike and unlike are compared as with oil and ethanol, no valid conclusions can be reached because they are not sufficiently alike. The main difference is that ethanol is renewable and oil is not. In the case of electricity from fossil fuels, EROEI is again meaningless because of comparing unlike and unlike. Electricity production is valid because of it's utility compared to the fossil fuel inputs even though EROEI far below one.
Ignoring price is the other major logic error of EROEI. Price matters, especially in calculating EROEI for a locality such as the United States. There are at least 2 kinds of oil in the U.S.: domestically produced and imported. They each have very different EROEI because the imported oil has to be paid for. The price paid is obviously the energy content of the oil since the seller is not getting the economic gain of the oil. The buyer gets the economic gain from the oil. The buyer uses energy to do the refining, distribution and of course consumption. Thus imported oil has a negative EROEI for Americans. Because all but about 5mb/d of American's 20mb/d is imported, EROEI for oil in the U.S. must be negative.
Nonetheless oil is held up by the anti ethanol crowd as the standard which ethanol must meet. There is no logic to this. It is nonsense.
And so it is with all the unlike and unlike alternative fuels to which EROEI is misapplied and in which the relevancy of price is ignored.
There is no logic to this. It is nonsense.
Price is irrelevant. If I have to burn a barrel of oil to pump out a barrel of oil, it doesn't matter if oil is 10 cents a barrel or $1,000,000 a barrel. The whole exercise becomes a waste of time as no useable (net) energy is produced.
Antoinetta III
But, but... don't you see, domestic oil is free and it's only foreign oil that costs a thousand bucks so the eroei on mandated ethanol is really really something or other that's really really good for everybody involved, or something like that. And if you don't agree then you're nonsense. Everybody knows that, or this. OH you know what I mean.
2(x) + 2(x) = 4(x) <~~ I think this is what you're saying.
How do you price an ecosystem? How do you price beauty? This is the problem with EROEI analyses. This goes beyond ergs & BTUs. The destruction wrought on the biosphere - and perhaps upon the lithosphere itself - have to be factored in for any EROEI analysis to be meaningful. How do you quantify this? What if not everyone agrees with your pricing schedule? This whole line of reasoning (or lack thereof) is a waste of time.
Precisely!
EROEI is a totally amoral concept worthy of an economist. (There is nothing in classical economics to 'disprove' slavery, genocide, etc.)
Peak Oil should educate us in what we should do, not to seek to greedily maximize net energy, a single measure.
There is no categorical imperative to screw thy neighbor; the EROEI of burning dirty coal is far higher than scrubbing it therefore we should stop pollution controls.
If oil has an EROEI higher than wind would it justify a war to obtain oil?
Should nuclear be pursued based on EROEI regardless of dangers?
It's inexcusable at this point in human development to rely on an amoral and largely arbitrary yardstick to decide what we MUST do.
"at this point in human development"
What point is this?
There is actually a point in my point besides the point of the pointlessness of your post, but you probably want to brush up on your Niebuhr before tackling it.
In the meantime, both you and Darwinsong need to get a grip. Charles Hall is making an argument favouring the addition of an analytical tool to the policy/decision making process. Moreover, is there any reason to believe that he would not want the policy toolbox to provide the means to account for all aspects of the rise in entropy caused by human action?
Some people want to discredit EROI analysis because it kills their pet projects, like using land to grow corn to make into ethanol. That wouldn't be you, would it?
What YOU need to get a grip on is that for EROEI to be meaningful you (or Dr. Hall) would have to 1.) include ALL the inputs on the EI side and 2.) provide nonarbitrary pricing on intangibles. Since you're not willing to do 1. and CAN'T do 2., the entire exercise of EROEI analysis remains meaningless.
It certainly wouldn't be me. So long as hunger persists in the world, growing food for fuel is immoral. Period.
Nate:
I think EROI is an important concept to get across. Charles is correct that once EROI is sufficiently large it hardly matters, i.e. it is not a very important way to determine which of two projects with EROI of say 20 and 100 is better. But if the EROI are 1.4 and .7, then low EROI should be a red flag that more detailed analysis of why the number is so low should be performed.
On a different point, your point (2) claims that the subprime crisis is a consequence of peak oil. I think most economists would disagree with it. I'm not an economist, but I think the subprime meltdown was inevitable with/without PO. My concern is that some readers whom we need to reach might consider it to be an outrageous claim. I know that when I see an outrageous claim by an author, I usually stop reading, and may even mentally consign the author to the "crank, do not waste time on" list. For that reason I think you should not make that statement -or at least make it further down in the paper, and with sufficient caveats that an undesirable and unintended loss of skeptical readership is avoided.
Thanks. I edited Charlies submission for typos, etc. but did not change any content.e.g. that comment about subprime was his and I'll let him defend it.
However, without talking to him, let's consider how that could be true. Society is used to growth. Growth is measured by corporate profits. Growth needs available energy (unless there is commensurate increases in efficiency or conservation). Humans like to compete. We compete (in general) for what society tells us is the current metric of 'success'. Modern success is (in general) conspicuous consumption, which requires money. If there is a decline in overall energy surplus, people playing by the same rules can't make as much surplus 'money', so they look for ways to do so. The energy pie is only so big to get spread around through the system and the 'juice', though larger, isn't as concentrated as it used to be. So the most ambitious and brightest( emphasis on ambitious) among us, create financial products to replace the loss in energy gain, in an attempt to reach for the fences with little perceived risk. Once these gates opened, it was just time and human greed that naturally escalated to a point where the leverage was too much for the system to handle and here we are today - going through that unwinding.
In addition to borrowing from the poor, and from the environment, perhaps the leverage/subprime crisis was an attempt to borrow energy gain from the 'abstract' rules governing (heretofore) monetary/credit policy. We need energy gain, in the Tainteresque sense, to grow. Perhaps Charlie meant this was a driver of the mortgage fallout. This is my guess - but I'll ask him to elaborate.
I'm certainly in agreement that increasing energy prices are an economic/political strain. It is possible that the political necessity to claim the economy is doing well under our leadership was important in generating the lax financial regulation. I think this process is a little too indirect for many readers to swallow -at least without some explanation. The oil price run up has been so recent, mostly post housing bubble peak, that you could argue that it was too late to have been involved in the bad loans. It clearly is going to make the recovery far more problematic.
IMHO the main issue here is to tread carefully (at least at the first introduction) in introducing ideas which might seem outlandish to some of the audience. That doesn't mean you can ever convince them all. The worst violence is usually done by headline writers, who find an outlandish statement which is only barely supported by the paper to be an irrestable title.
Nate, let me tell you a few things. In general, the link between PO and current credit crisis is not clear, and I believe it to be completely wrong. Christians would also like to link it to the degeneration of christian values and other groups with other interests would also have their views, but they ain't necessarily true, they only think it is so because they are so focused on these issues they don't see anything else.
Credit crisis is principally a mismanagement on the US banks part, with corruption and irresponsibility. It also may have a link with the war, but even this isn't clear. Traditionally the government pays its debts, and the huge debt of the war will be paid in the future by americans (and by all the others while the dollar devaluates), so I don't think it is that relevant in the present (other than creating a concern that may have some psychological consequences in the economies).
Your rationale in linking PO with Credit Crisis could be a valid one, but it is really an overstretch. People don't "love" to consume energy more and more, they "love" to consume what has value to them. This is critical. You seem to have the confusion of the equation that energy equals money, but it ain't so. Even if you take that the economy as a whole is basically the production and consumption of goods using energy, you fail to recognise the sheer energetic density assymetry between the various desired goods. For instance, a hooker that costs 4000$ is not in any way comparable to a 40$ gasoline tank, from the density of oil that it contains! In fact, the gas tank is probably the densest good (in money terms) in oil energy that your 40$ may buy.
You also fail to recognise that the energy usage in the US has been growing the past decade for real, and not by "abstract rules governing". So even that is simply false.
As you see, the matter is not simple, and you're turning it into a very simplistic stuff, ignoring the fact that your readers are not children and can think by themselves. To try to turn every problem into PO is not healthy. It shows obsession and lack of objectivity.
um - It was Charlies statement - I am unsure what I believe regarding the linkages -still too many variables- I just posted what could POSSIBLY be an explanation, and I labeled it as such. For the record I believe net energy analysis is much more important as a macro tool than EROI is as a micro tool.
But thanks for the diagnosis...;-)
Unlinking oil and the credit crisis is not logical. First, since we know the planning for the invasion of Iraq began as soon as the administration got into office, and that they were discussing it in terms of oil from the very beginning, we must conclude oil was an important aspect. Greenspan even said so, despite his later caveat.
Second, we know administration officials were aware of the problem of supply because Cheney said so in 1999, because the PNAC wrote a document on it, and Mat Simmons advised the administration on the problems with supply from SA in 2000/01 or so.
Third, we know interest rates were kept low in part to help pay for the war.
Cheers
I disagree. The reference to sub-prime should stay.
It is indeed important to locate and examine all the structural faults in the dam below which we have built our houses, but it is equally, if not more, important to deal with the problem of rising water and the subsequent weight against the dam.
Or to put it another way, the popping of the poorly installed rivets is a real problem demanding the second mate's attention, but the underlying issue for the crew is that the submarine has lost power and is sinking, resulting in ever greater pressure against the hull. Now even the properly installed rivets will soon be of little value.
What is the EROEI on efficiency & conservation ?
The subway I rode every day to ASPO-Boston opened in 1897. Perhaps half of the original investment (the tunnel bore, parts of the stations) is still in service.
What is the observed EROEI (to date) on the back breaking work of those Irishmen ? What is the future EROEI ?
For the Green line subway has delivered energy efficient transportation for a century and likely has a century+ left to go. It has helped sustain Boston as a dense, walkable city and reduced (at least to a degree) suburban sprawl.
The "energy returned" is negawatts, less energy used than the alternatives.
The Swiss are drilling a 58 km tunnel underneath the Alps to provide a flat, nearly straight rail link between Zurich and Milan. The goal to to force all of the freight that now goes by trucks that labor over mountain passes onto (hydro) electric rail.
The basic infrastructure (rails, signals, ties) is being designed for a 100 year life. The tunnel bore will remain in use as long as there is civilization in Switzerland.
Someone adds insulation or new windows (hopefully both) to their home. Lifespan as long as the home is occupied. The EROEI ?
Negawatts assume that the energy to be saved will be there to be saved. If there is no natural gas one winter, then added insulation will save no energy that winter (it will retain a slightly warmer inside temperature late at night).
In summary, I have not yet seen (perhaps I missed it) that applies the EROEI to conservation, efficiency and negawatts.
Best Hopes for Expanded Theory,
Alan
Hi Alan,
It is my feeling that energy EROI is just the first stage in the analysis. The end stage is the good or service needed by the end user. Somewhere in between are the efficiency of the transport mechanism.
Dr. Hall did a study in 1979 that compared insulation to building a coal power plant.
Hall, 1979, "Efficiency of Energy Delivery Systems: 1 An Economic and Energy Analysis", Environmental Management, Vol3, No 6, pp 493-504
Actually,perhaps the first stage should be a determination as to whether the cost of conservation of energy is less than the cost of producing that energy. If the cost of conservation is less than the projected delivered kwh of the coal plant, then it should not be built regardless of the EROEI. EROEI should be a secondary analysis if it is indicated that bringing forth new supply is more cost effective than conservation.
Too often, plans are put in place to build new coal plants, for example, and then the analysis of need and the arguments pertaining thereto occur after the utility has gone for their approvals and permits.
This is because utilities generally have a narrow scope -- to provide produced power, when their scope should be expanded to also provide services in the form of investments for the homeowner or business to conserve power. They can sell negawatts in addition to megawatts.
Good points, as usual Alan.
Your mention of the Backbreaking labor of the Rail workers in Boston (They would insist that you call it the 'T', and not the 'Subway', lest they find themselves compelled to smack you with something carrying a RedSox logo on it.) - brings up an discount on EROEI that I sometimes puzzle on, which is Labor.
While Labor IS an investiture of energy, it is also a JOB for someone, and presumably can be as much of a benefit and a necessity for their physical well-being. Finally, of course, is simply that as living humans we are born with a storehouse of energy that is basically 'pre-contracted' to be spent in the pursuits of our life, making a living, extracting food and other energies from the world to make that happen. Not that 'storehouse' is meant literally, as if we already contained the energy our muscles and brains would be spending, but that the expenditure is already an 'presumed input' as the normal function of being alive.
Long way of getting around to the idea that the energy that is run through humans and spent in the creation and collection of other energy supplies is not the same as 'how many barrels it takes to lift a barrel to the wellhead'
I hope that makes sense.. I didn't get a very good ROI on this post, I fear..
Best,
Bob
.. which reminds me, is the Author using EROI interchangably with EROEI, or is this the Energy Return from a Dollar Invested?
There is 30 years of academic literature referring to the concept of EROI, though the strong consensus on TOD is that it should be changed to EROEI, so as not to be confused with monetary analysis.
So:
EROI =traditional, therefore 'correct'
EROEI=more practical and easier to explain
someone that writes academic papers on the subject maybe should suggest it be changed (among other things....;-)
I have agree with mcrab, I think you must have worked backwards from seven to estimate the number of reactors in France. I've been trying to get to a way to compare electricity generating sources at the toaster where the power is used. So, I look at electric energy returned on energy invested, so you need another factor of three. (3 enriching reactors*7*3=63) the actual number is 58. That you're working backwards came up with 21 is telling to the problem I'm attacking and mcrab has been in the lead advocating for using thermal units only. He has recently said that a comparison might be made between virtual thermal units applied to, say, wind so that the EROEI of a wind turbine might be multiplied by 3 to give a fair comparison with a nuclear power plant taking only its thermal output. In any case, a new measure, essentially (net energy/energy in) seems to handle transformations owing to conversion efficiency without too much difficulty. I'd appreciate your thoughts on this approach.
I see that you are not going to look at wind or solar in this series. I think that both are moving targets because they both have improving EOREI. For that reason, peer reviewed liturature is going to lag behind current best practices which will presumably be applied to the majority of solar power we use. You can use conference proceedings from authors who have a history of peer reviewed publication to get a sense of where things are at though. This paper
http://www.nrel.gov/pv/thin_film/docs/lce2006.pdf
found at this site:
http://www.nrel.gov/pv/thin_film/pn_techbased_esh.html
may be helpful going forward though the energy needed to purify silicon is dropping in addition to reduced materials use cited there. I note that in this paper, the electricity used to purify silicon is hydro and so is not properly counted against emissions. The mix of emissions from the connected grid should be used throughout I think. This is also the reason that especially European studies of carbon emissions from nuclear power give unrealistically low estimates. They say the fuel is enriched using nuclear power rather than grid power, but since electricity is fungible on the grid, this is an incorrect approach I think. The Australian study with the figure EROEI=93 isn't even wrong in some sense, just very confused.
Chris
mdsolar:
True enough, but replacing the three nuclear stations that power the Tricastin enrichment plant with a typical mix of sources from the French grid isn't greatly going to increase life-cycle CO2 as the French grid is 80% nuclear, 10% hydro. For other countries that enrich via centrifuge, the high EROEI associated with the use of this far less energy insensive technology guarantees low carbon emissions, even if you assume all inputted energy is in the form of coal.
I'm forced to agree, Chris. Adding the inputted hydro-electric energy directly to the thermal inputs is misleading, as is ignoring the uranium input to the life-cycle. However, as I calculated in the nuclear thread, correcting for these flaws reduces EROEI to 74 for a 80/20 centrifuge-diffusion mix. For 100% diffusion this would reduce to 26; for 100% centrifuge, increase to 140. So the Nuclearinfo EROEI is certainly in the right ball park, even with the methodological flaws in its calculation.
Thanks for carrying out those calculations. The thread is closed now. From what they say on that site, they assume the uranium is enriched in France so you'd want your low value (26) or 9.3 the way I express it as actual EROEI. We're not far from 7 I'd say. I'll try to see if there are things missing from the spreadsheet you link. It does not seem all that self-explanatory. As you note, the values you are getting are not in agreement with the studies listed by the WNA. Your suggested reasons, changing energy costs for enrichment or capacity factors don't seem like they would do it. There are some issues with the possiblity of longer plant lifetimes going forward. If nuclear power is built at anything above repacement level, the fuel is estimated to run out by then, so, formally, with double the nuclear capacity, one would want to spread construction and decommisioning and such over a shorter period, say 30 years rather than 60.
I would note that France shares electricity with the rest of Europe, so the proper grid mix to take is that of Europe, not just France.
Chris
Is there a proposal for a precise definition of EROI here?
As has been commented here before in other contexts, EROI has meaning related to the financial return-on-investment numbers only if you are comparing "like" with "like" - in particular, the time periods between investment and return must be well-defined and essentially the same, or normalized somehow, if you are comparing two different processes. In finance terms that's accomplished by reducing far-future returns with a "discount rate" - I'm not sure that even makes sense in the energy picture.
This is a very fundamental problem for energy investments when comparing different technologies, because the time-scales are so divergent. Solar PV panels and wind turbines, and to a slightly lesser extent nuclear power, have essentially all their fundamental energy costs in the form of up-front capital investment. There are similar capital investments associated with energy distribution and storage systems. How do you compare that up-front energy investment with a technology that is dominated by the energy cost of its fuel?
And then there are all sorts of boundary-of-system ambiguities in the definition I'd like to hear more about, though I think in principal they are not as much a practical problem as the inconsistent time-scale issue, when comparing different technologies with EROI.
This is a very fundamental problem for energy investments when comparing different technologies, because the time-scales are so divergent. Solar PV panels and wind turbines, and to a slightly lesser extent nuclear power, have essentially all their fundamental energy costs in the form of up-front capital investment. There are similar capital investments associated with energy distribution and storage systems. How do you compare that up-front energy investment with a technology that is dominated by the energy cost of its fuel? - apsmith
Very good question, In the case of nuclear power, relatively modest added investments will make fuel use 100 times more efficient. But fuel cost are insignificant compared to capitol costs. Yet we have it argued by David Fleming and "Storm-Smith," using sexed up EROI arguments, that fuel costs are about to make nuclear power too expensive. That anyone would take such arguments seriously makes the whole EROI highly suspect.
While I agree that net energy analysis can be a valuable tool, EROI defined as gross energy output over energy input is not an economic efficiency. An economic efficiency is the ratio of the net output of one type of product or resource to the net input of another product or resource. A given economic process can either produce net energy or consume net energy, but it cannot do both at the same time.
Here are two examples where using EROEI give incorrect results.
1. Suppose I could spend 10 units of energy insulating my house using insulation of type A, and as a result I save 100 units of energy over the life of the insulation. On the other hand I have the option of spending 20 units of energy on insulation of type B which will save me 200 units of energy (i.e. it has a higher R-value) over the same time period. Both investments have EROEI=10 but investment B is clearly twice as good as investment A. The error being made is the assumption that I can always spend as many units of energy as I like so that if I spend 20 units of energy in investment A, I will get the same benefit as I do by spending 20 units of investment B. But I cannot invest 20 units of energy in insulator A unless I have two houses to insulate.
The correct measure of economic quality in this case is the net energy savings per unit of service delivered (i.e. per square meter of heated interior space). This quantity can be expressed as the product of a parameter which I call the energy utilization rate µ (which equals the fraction of gross energy saving which is left over after the input energy is subtracted out) times the gross energy savings per square meter of heated space. The energy utilization rate µ (which equals [EROEI-1]/EROEI) is the same for both forms of insulation, but insulator A has twice the gross energy savings/m2 as insulator B.
2. Now consider the following fanciful example of energy production. Given a barrel of oil magician A can wave his magic wand and voila, half the barrel disappears and a whole new barrel appears. He waves his wand at the second barrel and half of its contents disappear and a complete new barrel appears. And so on ad infinitum. Magician B can wave his wand in the absence of any oil and voila a half full barrel appears. He can repeat this operation ad infinitum. As long as both magicians can cast their spells in the same amount of time they will match each other in net energy production. What matters is the net energy produced per wave of the wand or per magician hour if you prefer. This quantity can be expressed as the product of the energy utilization rate µ and of the gross energy output per magician hour. If you used EROEI to analyze this situation and concluded that because magician A only spends the energy required to wave his wand his economic quality is hundreds or thousands of time better than magician A who has a lowly EROEI of 2 you would reach the wrong conclusion.
If the two magicians were teleporting oil out of a finite reservoir rather than creating it ex nihilo, then magician B would have an important advantage over magician A; Over the life of the reservoir he would produce twice a much net energy (I am neglecting the energy spent waving the wand). This advantage is best expressed by the energy utilization rate which 0.5 for magician A and 1.0 for magician B.
An analysis of any energy production process will show that the only meaningful economic efficiencies that can be defined are the ratios of net energy produced to non-energy resources consumed. Of course the energy balance is important in determining these ratios. As the energy balance approaches zero (µ==>0) the resource intensity of energy extraction approaches infinity.
OK, so:
"If the two magicians were teleporting oil out of a finite reservoir rather than creating it ex nihilo, then magician B would have an important advantage over magician A; Over the life of the reservoir he would produce twice a much net energy (I am neglecting the energy spent waving the wand). This advantage is best expressed by the energy utilization rate which 0.5 for magician A and 1.0 for magician B."
Following then on Charle's Barton's point: if 1 ton of easily mined Thorium can produce 1 GW/Year, in a reactor that is probably 1/3 the cost of a "normal" light water reactor with a turbine that is lighter in design than a regular steam turbine...and can last 80 years or longer: would this not constitute a great number on a EROEI list?
Just on this. I am looking at, for 1 GW Year:
Coal: several thousand coal cars with thousands of tons of coal
Gas: several billion cubic feet of natural gas
LWR: 25 to 50 tons of uranium processed and enriched from several thousand tons of ore (depending on methods used for mining)
LFTR (Liquid Fluoride Thorium Reactors): 1 ton of thorium oxide mined by 4 guys with shovels, in one day, sometime between breakfast and lunch.
To fuel enough LFTRs to displace all coal plants in the US, SAME four guys, shoveling for 350 days, maybe working after lunch as well, but we'll consult the union work rule book on this one.
What is the point of this discussion again???
David
Great thinking, Roger. In fact, while your B producer has an infinite EROEI, your A producer only has 2 EROEI, and it doesn't matter a nickel if both would, for instance, produce at the same pace.
The other difference you mention, or the other thing we should worry about is the renewability / finitness of the energy we produce or extract. Clearly, comparing non-renewables with renewables have this issue. While oil may have had an EROEI of 100:1 and windmills only have at least 10:1, should this mean oil is better? Does it even matter? Even consider a machine that has 1000:1 EROEI and can fill all your means, but it has a problem: it takes the size of an entire city to place such a machine and it can only fuel a medium town. Should it be built?
The EROEI discussion is still lacking. Many years have passed since these discussions started and we are still in the schoolyard discussing the alphabet. Not helpful if your objective is to write a thesis, or in this case, make tough decisions.
Ugh. So many tangents, misunderstandings and misdirections. Fruit doesn't matter, efficiency doesn't matter (to directly addressing the EROEI issue at hand, that is) units don't even matter, and dollars, most of all, do not matter.
Back in say, 1930, when pretty much all we had to do was stick a straw in the sand and oil came gushing out, the EROEI was perhaps 100:1. Society got 99 barrels to party with, the oilmen used only 1 barrel in the acquisition process. Fast forward to the turn of the millennium. Oil under the sand is getting scarcer, so we're drilling in deep water and mining tar sands. Overall EROEI has dropped to maybe 15:1. Society gets 94 (rounded) barrels to party with, oilmen use 6 in the acquisition process. Not as good, but not so bad. Party goes on. Fast forward into the future not so far. EROEI drops to say, 5:1. Society get 83 to party with, oilmen use 17. Can you say running faster to stay in place? This is why EROEI matters. This is what it tells us at its simplest. THEN we need also consider other impacts - environmental, economic, etc... Oh, and as for comparing apples to oranges, or let's say ethanol to crude, EROEI shows quite clearly why we are not going to anywhere near 'ameliorate' peak oil by replacing crude at what once was 100:1 and is still perhaps better than 10:1, with 1.3:1 ethanol, if its EROEI is in fact that good. EROEI matters greatly, hugely, and all efforts - intended or not - to obfuscate this simple analysis are a tragic impediment to good decision making.
thank you - I was beginning to be embarrassed by the level of discussion and understanding on this one (except for a few)
Tangentially, I have a hypothesis:
I think 2-3 years ago when all this 'peak oil' stuff was new and real and novel and scary, the regulars of this site pored over every new tidbit of knowledge they could get their hands on (I know I did.). Now, even though we are 3 years closer to Peak, with no major effective policy changes undertaken, we should be MORE concerned and interested. But, as I outlined in my addiction post, we gradually become habituated to concepts we have passed the steep part of the learning curve on -so there are 3 camps of people regarding EROI - 1)those that understand its importance and differ around the edges, 2)those that reject its importance for various reasons (e.g. corn farmers), or 3)those people that just don't grasp it.
All 3 camps may be tired of EROI theory posts, because they haven't really learned anything 'new' or interesting lately that would cause them to change their camps. I'm sure once finance retreats from center stage again in favor of energy (this will not necessarily be a good thing), interest will accelerate again. 2 weeks ago Robert had an EROI summary post and the level of discussion there was excellent. I am hoping we could give Charlie et. al some valuable feedback on how to improve his work during these next 4 posts. This is the thread to discuss whether EROI is worthwhile or not and to what extent- next week we get into numerical details.
Then again - perhaps my hypothesis is bunk. In any case clifman, you summed up the way I see it pretty well. Thanks
we gradually become habituated to concepts we have passed the steep part of the learning curve on -so there are 3 camps of people regarding EROI - 1)those that understand its importance and differ around the edges, 2)those that reject its importance for various reasons (e.g. corn farmers), or 3)those people that just don't grasp it. - Nate Hagens
No camp for those who find the advocates of EROI conceptually confused, the cases studies inconsistent, and the value more than a little problematic? Only 1, 2, 0r 3? We are not dogmatic, are we?
that would be camp 2.
and on a scale of 1-10 of dogma, I would guess I'm about a 6 (of course there is the issue of self-deception). I am open-minded enough that I change my mind when presented with new facts. I know that EROI is no panacea, but its a step in the right direction and superior to market metrics. If the market accounted for non-energy externalities appropriately then it might have an edge over net energy analysis - right now neither successfully accounts for non-energy limiting variables but EROI accounts for physical properties so its superior. If you have something in mind that is better, please enlighten us.
that would be camp 2. - Nate Hagens
Nate, I am not a corn farmer. Your example suggest that camp 2 has vested interests, which I don't.
I just meant anyone that disagrees that EROI has merit.
But don't you have a vested interest in thorium? If EROI analysis was summarizable into a neat recommendation to policymakers to immediately subsidize and scale thorium reactors, I suspect you would be pretty favorably disposed towards its validity as an analysis tool?
Nate, There is a difference between a sentimental interest and a financial interest. I do not think that thorium reactors should rise or fall on the basis of a conceptually confused analysis.
Charles,
I disagree with your support for nukes, but I would be too embarrassed to rudely question your objectivity and suggest that you are somebody's 'tool'.
This seems standard operating procedure at TOD.
Let's hope Professor
Hall can explain his world-beating idea that is better than the Market.
Either EROEI is the greatest thing since sliced bread or it's...toast.
(Not to much pressure.)
:)
I would be too embarrassed to rudely question your objectivity and suggest that you are somebody's 'tool'. - majorian,
Nasty, nasty, nasty. Didn't your mother teach you manners? I am no ones tool, nor am I a fool.
Marjorian - it doesn't need to be the greatest thing since sliced bread. It just needs to help us define our assets so we have a better idea how we can structure our liabilities. It's not magic. There is gold in my backyard - I am sure of it. But intuitively (via some process similar to EROI), I automatically have decided not to invest tens of thousands of dollars to dig up tens of tons of earth to find minute particles of gold - I choose to put my energy and my dollars other places I can get a higher return, even though there is gold there. EROI same thing - isn't magic - but should keep us from making big mistakes that cost energy and time.
Charles - when you want to quote what another poster wrote, you put < blockqoute > some text from other person < / blockqoute > (but spell quote correctly) and it will show up in a grey box (also remove the spaces)
Nate, this was a rather bold statement you made and I look forward to the EROEI folks addressing it.
Your claim that you have gold in your backyard is (probably) completely false. Why not just give a confidence interval?--say there is a billion to one chance and then apply whatever Bayesian analysis you like as a regular economist would. Besides, there are no BTUs in gold so its EROEI is actually 0.
I also look forward to you proving that falling EROEI in energy production is causing the current economic problems and not something else such as surging worldwide demand
for the US consumer lifestyle.
Charles, I meant no offense (I was trying to be sympathetic).
majorian perhaps other words might have worked better. I hope to soon lay out a case for thorium based nuclear power that will put fears to rest for rational people.
Thanks, Nate and Dr. Hall;
I am in the camp that feels 'It's ALL about EROEI', but I want to make sure I've adequately answered the challenges to it that seem to have some meat on them.
The 'Energy Quality' argument is worth recognizing, while I don't agree with those who feel that it unhinges the whole EROEI calculation. I'd like to hear your take on this, though.
I don't know if it's the right term in this context, but the idea of oil's 'Fungibility' comes to mind around this topic. Natural Gas, Coal, Ethanol, Solar Heat and Electricity are NOT the same kinds of energy sources, either in form, availability, storability, pipability or cost.. but we have developed and probably CAN develop any number of ways to interchange them for many applications.. while such changovers of masses of infrastructure would come with their own energy costs as well, at least there are solutions available.
Thanks again.
Bob
Bob
OK - heres an example where EROI alone would not be helpful.
Imagine a society (not so dissimilar from our own) where we had 2 basic needs for fuel: Energy Type 1)transportation and Energy Type 2)heat, electricity and services. But virtually every good and input precursor in the world had to arrive to manufacturing centers and households using liquid fuels. Hypothetically, if we had NO liquid fuels at all, or at least a considerable shortage, it would not matter if the energy sources that provided energy Type 2 were extremely high - because the whole system grinds to a halt without enough Type 1 energy. In this situation, processing primary fuel sources (coal, nat gas, etc.) into Type 1 energy, even at sub-unity EROI might make sense (at least in the short run).
So using EROI analysis has 2 implicit but critical assumptions. a)that all non-energy inputs are scaled at same ratio as the EROI (which is obviously false in case of things like corn ethanol whose EROWI (energy return on water invested) is FAR poorer relative to oil than their straight EROIs and b)the assumption that fuel sectors of society are of equal importance, and 'fungible' as you say.
IF natural gas, water availability, soil depth, and environmental externalities were assumed away, then MAYBE corn ethanols very low energy return might make sense because liquid fuels are what we are in short supply of, compared to electricity and heat. But of course, they are not equal.
I posted this hypothetical graph in the post on The Implications of Biofuels for US Water Supplies"
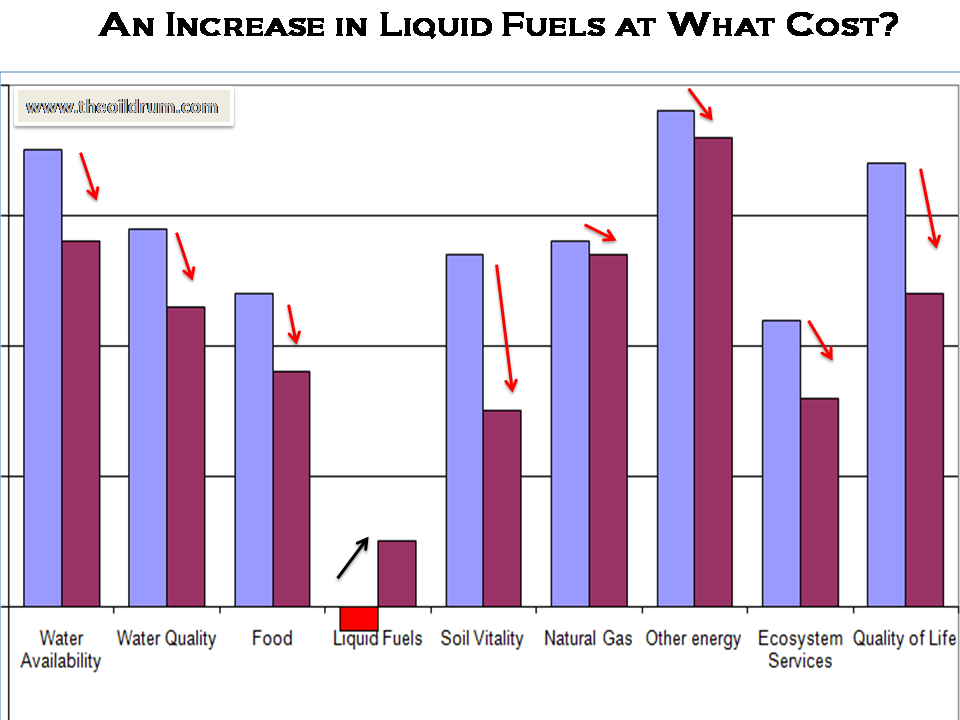
EROI would not (currently) accurately account for the examples above. As more limiting variables rear their ugly heads, we are going to head more and more towards multicriteria analysis, but still based on biophysical principles, with high quality energy (and water) needed before we can accomplish much.
In effect, what good is tons of electricity if we can't transport goods to where they are needed? Conversely, what good are liquid fuels if we can't turn the lights on and stay warm and use computers, etc? Currently electricity is by far the highest quality fuel and is over double the cost of gasoline per BTU - but I could envision that changing...
Shown differently, Gever et al (Beyond Oil) showed that if resources were pulled away from non-energy society in order to rapidly scale renewables, we would have a crash in consumer goods available - something similar happened in WWII, as people devoted resources to the war.
Nate,
Inverting this graph, one can see a triangle with height 70% and base 20 years which would be a equvivelent to a rectangle of height 100% and width 7 years. I would guess then that the energy payback time of the assumed technology is 7 years. Does that sound right? If so, then the technological assumptions are very pesemistic. One could strongly argue that manufacturing capacity might be diverted, as it was in WWII, and this would lead to reduced consumer goods availability, but making tanks and airplanes that are just going to get blown up is not the same thing as making something that produces energy. Once the payback time is over, the energy available has increased. Payback times of about a year should be anticipated for renewbales and so, in energy terms, the dip in the graph should only go down 10% rather than 70%. If we convert car factories to making turbines, we won't have new cars for a while, but not because there is no energy to make cars. In any case, car factories contribute more by making plug in hybrids. It is better to build new factories for turbine manufacture.
Chris
It's interesting that here we are considering methods, and the possible validity, of calculating EROEI for
alternative fuels and energies, considering that oil and gas were available in such vast quantities that
EROEI could be effectively ignored.
An analysis of EROEI(x) is performed to answer the basic question 'does x provide a worthwhile energy
gain?'. Another analysis could be Sustainability(x) or 'How Sustainable is x?' which would be the ratio of
the rates of consumption aginst replenishment. We currently consume 5 barrels of oil against 1 barrel
replenished, this is patently unsustainable, which has brought us our current ontology.
Alternative fuels and energies have such a low ERIOE compared to oil and gas that we find we must factor in
essentially non-energetic values in order to provide a more complete answer. In attempting to quantify
these values we may leave the arena of arithmetic and wander the by-ways of morality and perhaps even
faith. Is the same value assigned to water purity on your own farm as it is to a distant country? Morally -
Yes, in actual practice we see it's not.
Modern society is amazingly complex. So much so we could call it chaotic. The dynamic feedbacks humans
apply tend to stablise the networked systems giving the general illusion of order. Society is also fractal,
there is similarity at different scale and location. Modeling chaotic systems is an exercise in non-linear
math, but because of their nature they have very little predictive value and Yes(x) could easliy
become No(x) with a tiny parameter change.
I am not suggesting we don't attempt these calculations, of course we should. We need to consider the
non-energetic values and implications of large scale implementation too. It's vital we accommodate
appropriate factors and employ rigorous scientific methodologies with which to provide ourselves effective
and practical solutions.
There is nothing with the required flow volume or energy density to replace the utility of oil and gas. Whatever the alternatives are fuels for personal use will become prohibitively expensive and electricity an expensive luxury. Say adieu to cheap plastic products. Those of us still gainfully employed would do well adapting to a low power permaculture lifestyle.
Chaotic systems are determinant but are extremely dependent on initial conditions. Trouble is, we don't know what the initial conditions are. We only have a distribution of probabilities. Ellner & Turchin have explored nonlinear modeling of systems with stochastic initial conditions, in a series of papers in AmNat over the years. These papers make for interesting readings and bear out your assertion that such modeling has very little predictive value. This fact probably won't deter the proponents of EROI analysis from playing with their numbers, tho.
LoL Seems like you've already made up your mind. Why go into the details of something next week, or ever, that isn't worthwhile? The further this discussion goes on the more embarrassed I become by the level of understanding of those who favor EROEI analysis of bandaid remedies designed to maintain BAU. If there's anyone who doesn't understand EROI analysis it's those who don't understand, or who willfully disregard, all the inputs on the EI side. All continuation of this nonsense does is serve the interests of the status quo. All it is is fiddling while Rome burns. Okay, I'm thru with this thread. Have fun fiddling!
Why are you being so difficult. I posted an essay by a professor who I respect who asked theoildrum readers for feedback - as editor here I am trying to guide the discussion so when we are discussing nuclear 2 weeks hence that we don't get sidetracked about the actual validity of net energy analysis but can focus on nuclear. You are a new poster here (<2 weeks). You are clearly a bright fellow, but in the 20 or so comments you've made on this post and last fridays, you haven't agreed with a thing written.
Nate,
I read your posts when talking about the EROEI of wind and I had an epiphany.
I definitely believe that there is a lot of confusion about EROEI and I think it's perpetuated by talking about barrels of oil equivalent.
The best analogy I can come up with is farming.
It's like this:
We can plant corn and harvest it. Every year we eat a little more corn than we harvest. We are eating some of the seed corn. This is the concept of EROEI when we consider that we're using a barrel of oil to get barrels of oil.
OR
We can plant an apple tree and eat all the apples but keep the seeds. In a few years we have a whole backyard full of apple trees even though the EROEI of the planting is the same every year.
Have you ever eaten an apple from a tree grown from seed?
You do plan to contribute to this conversation, right?
This was CJWirth's argument, too.. though I haven't seen him around for a couple weeks.
I never heard an explanation for how electricity was so 'useless'. We now also have scrap electrical equipment from a century of industry and development. However misguided we may have been in that upsurge, it has left a LOT of material available that can be scavenged and reused for a more moderate and responsible electrical system.
I have to wonder at the blanket numbers that EROEI sometimes has assigned broadly to various technologies, when some, like 'very small scale windpower- built from scrap materials' (see www.otherpower.com or Hugh Piggott and www.scoraig.com ), such as the young African guy who built his family a wind-turbine from a scrapped bicycle and bits of spare wood will have not only a much higher 'Value' to the energy they are producing, but the inputs are personal labor (and 'food', that the laborer would be eating regardless of the work they are putting out..) - some sources will have a much higher return than the same general technology at a different scale, and playing a different role in it's society. Many might discount this as being such a 'micro-scale' source, but I would counter (of course) that this is a 'moderate-tech' solution that makes it available to simple citizens all around the world, using an abundance of post-industrial junk, built in 'spare-time'.. possibly more valuable a scrounge than biofuels from Jatropha!
"BandAid Remedies designed to maintain BAU".. Maybe it's 'Business at All', not 'As Usual' .. and hey, when you're bleeding, do you sneer at the idea of using 'bandaids'? If you forsee a thousand cuts in your near future, I would Highly recommend stocking up on these.
Bob
Interesting theory and I agree with your categories. So lacking better priors, 1/3 of the posters here get it, 1/3 get it but are intentionally trying to refute and confuse the discussion, and 1/3 actually don't grasp the concept.
It is mind boggling that over and over these comments go round and round as to whether EROI is an important consideration. I wonder if it just goes back to the difficulty some people have with the concept of energy. If you have studied physics and grasped it, the ability to do work (and convert it to different physical forms)is a tangible and measurable concept. If you have not, then it may not be.
edited: typo
Ok, how about we try to imagine for a moment a sustainable civilization where just for the sake of argument we have decided that it is not necessary to light up every room in our dwellings with hundreds of lumens of high wattage lighting. Instead we all wear stylish headgear after dark that incorporates super efficient brilliantly white, LED lights that are powered by our body movements through some kind of kinetic generator.
BTW, please note that I'm not suggesting in any way that this is a realistic scenario. I'm only saying that it might indeed be possible to imagine scenarios that are so far removed from our current ridiculously energy wasteful lifestyles as to make moot this argument about EROEI. Shouldn't we be more focused instead on finding out what kinds of useful sustainable models of civilization we can envision for ALL of the 6.5 billion plus and (still growing) poulation of humans?
Maybe we don't all have to end up wearing Stillsuits like the Fremen on Arrakis to survive but it seems like the entire argument about the importance and validity of EROEI here is based on everyone driving a Hummer and living in a McMansion. Hopefully a rather large number of people should be able to enjoy significant improvements over their current lifestyles if we start thinking of ways to live within our means.
I am well aware, for example, of the arguments against the possibility of corn ethanol to ameliorate in any significant way our dependance on oil. However that in no way diminished the usefulness of my 100% ethanol powered VW fox while commuting back and forth from Sao Paulo to Rio de Janeiro back in the early 1980's on the Rio Santos highway.
Which reminds me of a saying in Brazil, "Quem não tem cão caça com gato", roughly translated, "He who doesn't have a dog, goes hunting with his cat".
Possible proof/disproof of the core net energy claim:
If it's true that net energy is shrinking, and more energy is being allocated to energy production, we should see that reflected in Gross Domestic Product or some other econ statistics, no?
Ie, the percentage of the US economy occupied by the energy industry should be going steadily up from the 1950s, with a definite uptick after 1970, as we hit PO in the US.
Anybody have any numbers on this?
The declining EROEI is clearly shown in the number of NG wells drilled to attempt to just keep the NG supply from declining rapidly in North America.
Here are examples of how the statistics show the declining EROEI in the economy.
There is a chart that shows numbers of NG wells drilled each year keeps increasing , but the amount of gas found keeps getting smaller.
Our Natural Gas Treadmill
http://www.theoildrum.com/story/2006/11/8/6636/36918
Top oil firms spend more but get less crude
http://www.peakoil.com/article35784.html
I see that your profile is only a few hours old.
By the way, I see that you do not have any contact email in your profile.
When people do have contact email, I often just email directly.
That cuts down on the huge volume of listings for other people to read through.
Are you the Twist from the housing site ??
The thing about money and economics that is a Headtrip for me is the idea that money is a 'Symbolic form of Stored Energy', which can be converted from Human Labor, to Bread, to Grid Electricity, to AA Batteries, to Consulting Fees, to Luxury Yachts.
The numbers you are looking for may or may not be reflected in the 'Energy Sector' as you would expect to find it. People in Maine who can't afford their heating oil are taking cash to the gas station to buy a small can of Kero to get their house through the night, ultimately spending FAR more per joule (incl time and hassle, driving over, etc.) than that $1000 tank filling would have. We see people still driving the same miles per year, but what are they buying for groceries? Did they go to the Dentist? Finish that course of Antibiotics? How hefty is their creditline now? When will they get around to Shingling that roof or replacing the dying fridge (that runs all the time!) ??
Money can let a 'leaky house' hide it's losses in unusual corners.
Bob
Nate,
I would be one of those in camp #1.
I think maybe for a clear definition you might need different types of EROI's.
For instance their might be a EROI including ALL inputs for instance with oil.
Also this wouldn't work for a single energy source, and might be good for something like figuring out the minimum average EROI for society.
When trying to assess the effectiveness of alternatives I think you would have to convert all energy sources to that energy source. If your looking at solar you would have to treat all the input energy as if you got it from solar. then account for the minimum energy invested and see what the scaling up or down would be like to obtain the same amount of net energy. I would think system boundaries would disappear when you starting using EROI's averaged over the entire world. I don't know where you would get all this data and a lot of assumptions would have to made and I'm not sure how practical it would be. Also I have seen people saying that a EROI/time needs to included, which I suppose makes sense. I probably have no idea what I'm talking about, but where I screw up please correct me so I can learn more.
The energy used in all steel and materials and the transport energy used to get them their.
The energy for drilling and the transportation energy.
The export energy, more transportation.
refining energy
The energy cost to get the gasoline, diesel and all derivatives to the market filling station etc.
The energy the consumer has to use to get the energy.
Also all the cost of the energy infrastructure needed.
Include even labor energy of the actual people, may not be to relevant but for a thorough examination I think it should be included.
This would get you a mildly positive ratio I would think.
Now you would subtract the amount of net energy from the gain required for food, water and shelter.
So Output - Intput= net energy1 net energy1-net energy(agriculture, water and all necessities)= net energy Leisure( left for society to use for music, art and Disney land of course)
That would be a calculation for the EROI for luxury/leisure as you'd put net energy leisure/input which would should be a smaller ratio even a negative ratio (i.e less than 1) I think, not sure.
Anyway you might have Your Required Minimum EROI just having net energy necessities/input
then your leisure EROI
I think including anything with a more positive ratio would be rather pointless as it wouldn't fill the energy for necessities for society.
Those are just some idea's, Also I was wondering about the total decline in avergae net energy for society since it peaked in the 30's at around 100:1. I know thats the number for oil in the 30's but I mean to say avergae net energy for society. That has been declining due to the declining EROI of oil and gas since the 30's. I was trying to think of how their hasn't been any obvious signs of this in history. I was wondering if declining EROI has a relation to being an invisible hand behind inflation? Also I was thinking all that net energy gained since wasn't all used for fuel and burned away immediately, it's been turned into clothes, houses, furniture, cars and people?
I know I've been rambling, I'm a bit tired and sick, I just thought I'd put in my idea's/two cents. Excellent article by the way I love the stuff your doing. I am thinking of scrapping my whole MBA idea and going into something with ecology or ecological economics with my industrial engineering degree it's really interesting.
Thanks,
Crews
Nate, perhaps this is a good place to post your net energy graphic, and Euan's energy cliff one, to show why the decline from 100:1 to 10:1 has such an indiscernable impact societally, but after EROEI drops below 10:1, and especially below 7 or so to 1, all that's left is to shout "wheeeeeee!" on the way down.
A reader reminded me of this paper, now 34 years old, published in AMBIO, and maintained on Minnesotans for Sustainability site.
ENERGY, ECOLOGY, and ECONOMICS
Both my advisor (Bob Costanza) and Charlie Hall were students of Howard Odum. It all started then. (well, really with Alfred Lotka in the 1930s). Kind of boggles the mind that not a whole lot has happened since he wrote that paper - other than we've used about 800 billion more barrels of oil and have yet to change our consumption trajectory.
If I have time, I will ask the "minnesotans", if I can reprint that article here at TOD, in its entirety.
This is a great paper. Check out Point 6. It basically sums up my worries about the US economy. We specialized in fast growth (throw away culture) and now somehow must transition to a steady state. I just cannot see the US competing against much more efficient countries.
And it argues for a return to import substitution polices which the "Washington Consensus" discouraged for the past 3 decades.
It isn't true that more complex communities necessarily have higher productivities than simpler communities do. Some of the most productive biotic communities are virtual monocultures. A single species of palm dominates vast areas of lowland Amazonian rainforest and this community is among the most productive in the world. Ditto with kelp dominated marine communities. It isn't even necessarily true that more complex communities are more stable, altho this could be regarded as a general truism with exceptions. Ecology has matured since Odum wrote back in the '70s, and nature is now recognized as being a much more complex place than his allusions to "climax" communities and steady-state dynamics would imply. Disturbance frequently prevents communities from ever reaching a climax, and the species composition of so-called climax communities is largely a matter of chance. Nor can disturbed communities typically be reconstructed, even if all the species formerly interacting are available for reintroduction. The original sequence of introduction and seral stage progression mattered, and can't be precisely known or replicated. If people are going to be making decisions that impact the environment they should be well grounded in modern ecology & evolutionary biology.
haha,
from: above
http://www.mnforsustain.org/energy_ecology_economics_odum_ht_1973.htm
#2 of that article, I guess I'm not too much of an idiot after all.
makes perfect sense the declining eroei related to inflation..
Yeah, from the paranoid's fool worldview.
Not a whole lot has happened except that the science of ecology has come of age and such overly simplistic or just plain wrong concepts as the "climax," predictable & repeatable succession, and "steady-state" dynamics... have gone out the window.
I think this article on Net Energy is pretty much required reading for those new to EROI
http://www.eoearth.org/article/Ten_fundamental_principles_of_net_energy
Here is an introductory article on EROI from the same source.
http://www.eoearth.org/article/Energy_return_on_investment_%28EROI%29
John, that was posted on TOD 15 months ago. Interesting to see the comments back then.
That is a very good introduction, and also equivocal on the power of EROI. EROI doesn't account for quality (which can be density, transportability, intermittency, what is demanded from social infrastructure, etc.)
In the end, would we be better off counting how many BTUs we have in our bank account and what the principle is (solar)? Or counting how many dollars are in our central bank and government coffers? I wonder what % of people would vote for the latter....
Sorry, I should have linked the TOD version. That post was the one that sent me to read the journals, because Cleveland makes the critique that no one on the internet reads journals. He is right, but the paywall surrounding the Ivory Tower is expensive. (And it would have helped to know what articles were most worth reading). Still, his critique is valid, and it is totally great how you are slowly bringing us all up to speed!
On your rhetorical question, I would guess 100% if Norway is any example. They sold the oil. They didn't convert it into wind turbines and sell those instead. Sigh. Not even the far sighted Norwegians could escape neoclassical economics....
We just need to make every new nuclear power plant a fast breeder reactor. Plenty of fuel for nuclear trains and how about nuclear airplanes? Terrific EROI !
Roger, fast breeders are not the best way to generate new nuclear fuel. - Charles
Huh? My father worked on nuclear aviation. There are some serious drawbacks. This is just a last April 1st post?
Chris
I think some of you are being too hard on "New" Technologies. EX. MIT Professors to manufacture Solar Cell that's 27% More Efficient, but, no more costly:
http://thefraserdomain.typepad.com/energy
The problem with calculating EROI with "New" Technologies is that, before the ink's dry on your analysis, the numbers have changed.
This applies to Biofuels, and, Wind/Wave as well.
Cmon, Corn ethanol, theres approximately a million reasons now why it's a bad idea, and approximately no reasons why its good. You can push solar and wind, but drop the whole ethanol thing.
I've been a lurker here for a couple years, but this diary made me want to chime in. I am glad the concept of EROI is being vetted and that we are being offered the chance to discuss it. Unlike money, which is completely symbolized and regularized, energy "currency" is more of an agreement on a unit of measure across different physical systems. Along with the boundary problem and the scale problem, cited by some of the commenters here and in prior posts, the refinement of EROI to a point where it can be employed in planning, analysis and investment needs to be undertaken.
As a software programmer specializing in data cubes for accounting information which is then used to calculate ROI and the other financial ratios, and a developer of models backing business plans for many clients, I believe the standardization of an EROI methodology would advance the practice of energy conservation in ways similar to how ROI advances the practice of monetary conservation. It is the nature of a business enterprise to seek the highest ROI possible. As people all over the world attempt to build energy systems, a similar measure will help disperate enterprises seek the highest EROI.
However, several commenters in Nate's "camp 2" are rightly confused when we are not measuring an abstract quantity like money, but attempting to use a unit of measure (e.g., joules) the yield of which, from any given physical system and input to that system, will naturally vary. In addition, the ROI measure is based on the time scale of one year (the common unit of time measure in all accounting systems recognized by all taxing and financial authorities). Thus we need to examine what is different about our measuring system and deal with the variations that make a difference.
The boundary problem, similarly, for an enterprise is relatively simple: a legal entity to which money is remanded and from which money is required by other legal entities of similar defintion. In large multinational, diverse corporations, we can discern the boundary problem as well. Indeed, much of the wizardry of accountants is to define those boundaries, where allowed, such that the ROI reported to tax authorities is minimized while that reported to shareholders is maximized -- thus becoming an optimization problem solving simultaneous linear equations (being a programmer serving accountants and not an accountant myself, I can describe their work that way -- few accountants would describe the problem in this language).
We also have an example of the struggle over EROI discussions I have been following here in accounting. When we attempt to apply accounting methods to nations (particularly governments, who can create money through a central bank), we get into what Richard Hofstadler called "tangled hierarchies" -- and we get non-linear effects which linear systems such as those we can employ at the level of an individual enterprise cannot model. Many scholars of accounting have advocated applying accounting methods to whole societies, and most of them have done so to address environmental costs. Their work tends to look more like economic models than accounting ones, by the nature of the problem.
When I want to build a model of a new energy system, I have to set boundaries which will be meaningful to get anywhere with the modeling of how it will work and the analysis of how it does work when in operation. Similar to accounting at the enterprise level, which is near-linear, we can accumulate the "costs" (e.g., energy used to produce the materials, components, assemblies and processes to bring the system's physical components together up to the point of operation) and then amortize them over the expected life of the system (e.g., the point at which the system must be shut down and its physical components disposed).
When I want to build a model of a system of energy systems, I have to set boundaries to get anywhere as well -- but I must expect nonlinear effects will rule. One of the reasons so many alternative energy businesses have bitten the dust is because they attempt to rationalize a whole series of energy systems into and out of their business, all of which are beyond their control. The nonlinear effects of finding out hydrogen embrittles metal, glycerin from ethanol production cannot be easily disposed and a myriad other issues emerge from the chemistry and physics of the energy systems without regard to the economics of the market or the business saavy of the managers. These businesses require a mezzoecology to emerge to succeed. Without the right context, they will fail without regard to the readiness of the technology or the market. This artificial ecology of energy systems already exists. The tools we will need to employ to understand it and reconfigure it will derive more from economics than accounting, I suspect.
I also have an intuition we will need new mathematics for this problem, and possibly solve problems which economics cannot. Economic models break down the smaller the scale to which they are applied. Accounting models similarly break down the larger the scale to which they are applied. It may be that fractal geometry may be needed to fill the gap. We have artifical constraints in energy systems. Cars must be of a certain physical size or we cannot drive them on our roads or park them in our garages. Storage systems for home energy systems cannot be bigger than our yard or basement. That is, there is an interaction between the physical size and weight and heat output of new energy systems and the well-delineated size and space in which they must be deployed. This may lead to self-similarity at each level of scale. A battery the size of a house cannot be dissed because it won't fit on my property: I may need to form new coops or legal compacts with others in my neighborhood to store the energy I produce. As the petroleum mezzosystem contracts, the gaps it leaves may need different technologies which fit the "space" left at each tick of the time scale clock. Each price point crossed by oil prices may open such spaces because the declining price point of other systems "hits" at the same "moment" and society adopts those systems spontaneously and completely because they will be seeking something to fill the void.
The odds such crosslinks among moving price points will line up may be impossibly large -- or there may truly be an ecology of energy systems we, as a civilization, have not been forced to see before even though we have enacted such transitions many times in the past.
In any case, for now it may be useful to divide the problem thusly: EROI for specific energy systems which can be inventoried and whose components can be accounted for over time precisely; and Energy Productivity based on a Gross Energy Production measure for artificial energy ecologies at the mezzo and macro levels. It may be that the government investments, incentives and tariffs could be consolidated into a "central bank" concept and measures such as the "M" measures of money could be used to guide and control public policy in a way similar to the role of central banks in the modern international economy of today.
Having been through the PC software industry's rise and fall (small innovative startups absorbed into slow-moving, low-quality consolidations), I have been thinking a lot about the issues facing those of us wanting profitable businesses to emerge in this market able to lock in new mezzoeconomies in which alternative energy systems can flow into each other and create sustained, systemic changes in the energy balance of the society as a whole. A model which succeeds in accounting for what we can observe about each enterprise in the mezzoeconomy will not be the same model which succeeds at the level of the economy. In our analogy to money, accounting models are optimized for business enterprises, even those which consolidate their supply and demand chains; but economic models are optimized for the spread of successful enterprises throughout a society. EROI, as a measure, may not be suited for these latter problems. A corollary to GDP may be better for these scales.
That is, given an energy system with inputs xi and outputs yj, we will need a directed graph of edges among all nodes connecting the x's to y's which we can inventory and label and measure energy flux at each node over time before we can derive a measure like EROI. In addition, we need to agree the measure will be evaluated in regular time intervals of, say, a year and restated each such period for the life of the energy system. By applying this constraint, we can apply other concepts like future value and present value to compare successful, running energy systems. Note a business which has no transaction activity cannot be measured. Similarly, an energy system which does not convert energy in some application cannot be measured either. We can forecast what it would do, just as we forecast an ROI for a new business. But the real value of such a measure is in its application to a running system.
We face tough problems, and they may be unsurmountable. We should certainly respect the risk: that we cannot solve enough problems in time to retain our civilization in any semblance of what we would like it to be for our posterity. But nonlinearity cuts both ways: new order emerges as unexpectedly as new chaos. These technologies will not emerge across a nation as-a-whole. They will emerge in clusters of mezzoecologies, and those small, interactive ecologies will grow or die. Those which grow will eventually spread and displace other energy systems. The real test of any measure like EROI will be that we can apply it to these successful systems and those which tend to survive and expand best will have the highest measure value.
Petroleum has already shown us the power of a successful mezzoecology spreading to suppress thousands of other less successful mezzoecologies, at least for a time. But, since the resource is finite, as its mezzoecology fails others will be able to emerge which have been suppressed or never had the chance to compete. Anticipating which latent mezzosystems of energy conversion to useful work are emerging will seperate the leaders of this new energy era from the victims of it.
EROI attempts to measure the best chance of survival of any energy system in such a dynamic plenum of mezzoecologies. In the early 1970s, Stafford Beer and other cyberneticians laid the groundwork of these models, and I believe their work will be a part of the solution now. It takes thirty years for new discoveries to make it to commercial realization. We now have thousands of energy systems nearing the end of that initialization period, and only those which can interact and connect to each other will lock together into a successful system. We face a curious balance of the fractal mathematics of ecology, the calculus of economics and the algebra of accounting in this problem. It is very exciting.
Thank you for posing the problem so clearly and inviting us to tackle it together.
This is an interesting post, but the first paragraph is perhaps a little over the top. Conservation of energy inplies that energy transfoms are precisely quantifiable. This seems a little different from money which is countable but which has a different meaning in terms what it buys from day to day. The pounds of flour in a package remain the same but the price fluctuates. The Sun delivers 1000 W/m2 at the surface of the Earth at normal incidence with very little variation. The pounds in the package, the watts from the Sun, these are physical units with physical meaning whereas money is a convension to substitute for barter which has no meaning on its own. You could argue that it has emergent meaning, but even so, once separated from the underlying physical goods, that emergence will collapse. Energy, on the other hand, is part of the underlying physical reality.
Chris
An economist would reply that the marketplace will tend to favor energy sources with the highest EROEI, perhaps refining the analysis by including the fudge factor mentioned above for energy quality. The only important energy source we have with a negative EROEI or close to it is corn ethanol. This was not produced by market economics but by a government subsidy.
EROEI analysis can be extremely complex. Do you really think you can do a better job calculating the embedded fuel energy of everything including your employee's peanut butter sandwich and the paper his reports are written on, than you could do simply by comparing the price of the two products?
Howard Odum's text "Environment, Power and Society" employs concepts that cover this discussion. The sub title of the text is "The Hierarchy of Energy". As an ecologist he was led to compare ecosystems in terms of how they used energy. An intro to his ideas can be found at Die Off and employs the concept of emergy. I feel the concepts Odum developed will deal with the issues raised by the commentors. "Radical Simplicity" by J. Merkel also is an attempt to do comparative energy analysis. J. Salk wrote "The Survival of the Wisest", which gives a biological overview of what has to occur for the survival of our species. For fun reading try "Earth Abides" and watch "The Flight of the Phoenix". Solyent Green seems to apply and "Souls at Sea" starring Gary Cooper and George Raft fill out a metophoric trip. It is interesting that most of the correspondents seem to be engineers and the view that would help them most comes from ecologists.
Absolutely!
There! I agreed with someone, Nate. ;)
I agree with that statement too.
Let's quit and go have coffee...;-)
The problem is that we have overcomplicated the concept of applying EROEI specifically to oil. This leads us to conclude that we have a "declining EROEI" problem.
The issue at hand is that IF we are using ONLY barrels of oil to extract barrels of oil then we have a declining EROEI.
We are really saying "ability to produce oil is running out".
If we take this tack then logic leads us to conclude that when we get down to using one barrel of oil to pull out one barrel of oil it cannot be done.
The problem is when we start saying "barrels of oil equvalent", because not all energy IS equivalent. There are renewable non declining barrels of oil equivalent and non-renewable declining barrels of oil equivalent.
As soon, however, as we start using renewable sources of energy to pull out the barrel of oil it becomes possible to pull out a barrel of oil even if we have used MORE than a barrel of oil energy equivalent.
The obvious conclusion, however, is: why would we do such a thing?
At some point it will become more sensible to just leave the oil in the ground.
That point is rapidly approaching. Well to wheel energy efficiency of both fuel cell and electric battery driven transport is much greater than that of oil-driven transport thus at some point soon when we are forced to make the choice of extracting oil from energy produced from renewable sources we will conclude that it is better to just use the renewable energy directly.
While on the way down (burning up energy to get more harder to get energy) the compound interest effect of EROEI leads to diminishing returns.
When it no longer makes sense to use renewable energy to pull up oil, however at that point it becomes interesting because then the compound interest effect of EROEI comes into play in a positive sense. We build infrastructure which produces a positive return. The infrastructure unlike oil, is not burned up to get energy. It remains in place. Thus as long as we are not stupid enough to use every watt of power generated from the renewable sources we can feed some of it back into the loop.
Thus simple compound interest effects come into play.
For example:
If we leave 5% of the energy required to create the infrastructure for producing more infrastructure we get a doubling of the gross energy output in 16 years.
If we leave 10% for growth we get a doubling in 8 years.
If we leave 20% for growth we get a doubling in 4 years.
etc etc
So, people, the solution is to get building renewable infrastructure RIGHT NOW and as fast as we can. Breeder windmills.
Before I would accept EROI as a valid and useful construct, I have several things I would like to know.
A. Are all energy inputs measured by a single input measurement unit?
B. If the answer A. are there conversion formulas between different energy input units?
C. If the answer to C. is no, how is comparisons between energy inputs possible?
D. What constitutes the energy input of renewables? Does the total energy in sunlight constitute an energy input for PV or ST systems? Does thew total energy of moving air constitutes the energy input of a wind generator?
A further Question
Measuring energy inputs and outputs, and indeed accounting for their relationship would be a classic task for physics. Yet we find in EROI discussions virtually no reference to physics and scant quantifications. Why is that?
It is because the problem with EROI is not a numbers problem related to science or quantification. It is a logic problem. Numbers are abstract concepts that must be given the reality check of logic. Why? Because as soon as an abstract number is converter into a concrete substance in the real world it takes on the characters of the substance to which it is attached.
In my oft repeated example of the gold mine where only one pound of gold is produced for 10 pounds of iron used for structural supports and such, the Metal Return on Investment is only .1. It is nonsense to say that since the MROI is only .1 no gold should be produced. It is ambiguous whether that MROI is gold or iron or maybe some other form of metal such as silver. Metal does not exist in the real world. In reality metal has to take a form. Similarly numbers have to take a form in the real world to be useful. When they do they take of the characteristics of that form. A pound of metal may be a pound of gold, iron or what ever. A pound of metal may sound like a real substance but it only exists as an abstraction.
Similarly numbers only exist as an abstraction. Logic is required to control them and make sure their use is valid or they will be tortured, twisted and otherwise misused to prove what ever the argument of the moment is. This is an especially difficult problem with energy. Energy is also an abstract concept. A unit of energy does not exist is the real world. In reality a unit or units of energy must be converted to a form that is concrete. When this happens it takes on the characteristics of that form such as oil.
One the main characteristics of oil is its depletion and declining EROI when compared to past oil production. This is a valid use of EROI. However if the abstract concept of a unit energy put into the real world takes on the form of electricity, for example, it has a whole different set of characteristics. Electricity has very high utility and very low EROI when produced from oil. This is an invalid use of EROI since it is comparing unlike forms of energy. The low EROI is meaningless nonsense. A similar situation exists when ethanol is the form of a unit of energy. EROI when misapplied to unlike and unlike is nonsense or worse.
EROEI is valid only in tightly controlled comparisons involving like and like forms of energy. Energy in the abstract numerical sense does not exist any more than metal in the abstract numerical sense exists. When the numbers of energy units are converted into a real form they take on the characteristics of that form.
These characteristics are among others:
1. Price
2. Utility
3. Renew-ability
4. Locality
These are important in the real world and relevant. EROEI does not take any of them into account thereby deeming them irrelevant which they are not. EROEI is a fallacious concept with highly limited usefulness. It can be valid in like and like comparisons if tightly controlled. Otherwise it is nonsense.
x, You and I are operating along similar lines, but you are thinking in terms of economics, while I am thinking in terms of science. It seems to me that in order to be a valid concept about the relationship between energy inputs and outputs, energy has to be quantifiable. Hence we are talking about different ontological realms, each with its own order, and its own requirements for epistemological order. If we are talking about the physical relationship between energy input and output, then we should be doing physics, which is something that I and most of the participants in this discussion are not qualified to do. If we are talking about economic relationships, then qualifications for joining in the discussion are somewhat different, but I am sure that I do not mass muster.
Where I have something to add is in raising the question about what we are talking about, and why seemingly relevant fields of knowledge are being ignored in the discussion.
Finally, since EROI analysis appears to be something distinct from either energy as a construct of science (physics) or as an economic construct, it is not at all clear what the word "energy" means in these discussion. People here appear to believe that they know what they are talking about when the refer to EROI, but what is it that they are talking about? It would appear there are references to what goes in as oil and what comes out is the work done by oil and its byproducts. Surely oil is not energy, but exactly what is energy in the context of these discussions?
Charles,
Please allow me to comment.
First, you are correct that energy return on energy invested ought to be a physics concept and there is often confusion when an economist talks about peak oil.
Second: I have a bachelors in physics along with an MBA so I understand both ends of the deal.
EROEI is a useful concept but an impactful and wrong idea has been propagated. We have Jay Hansen and Duncan of Olduvai fame to thank for this.
I find it interesting that when talking about EROEI often many forms of energy have been merged into one and this has led to a great deal of confusion.
The poster who said that like has to be compared to like is partly right and this is where the confusion stems from.
Renewable Energy can not be compared to non renewable energy for a fundamental reason. I will not discuss that here, though but instead will underline the crucial factor that seems to be misunderstood in most discussions of EROEI on the internet.
Energy Return on Energy Investment, implies more than just inputs and outputs.
It implies an input (the principal), the return (principal plus or minus energy "interest") and finally, a time period.
We must understand all of these to get the true picture.
It is important, however, to realize that there is INTEREST in this formula because that allows to think of EROEI in it's correct sense.
For example an energy return of 1.2 (20% return on investment) with a CONSTANT principal always returns the 20%.
If the principal is declining, however, an eroei of 1.2 is returning less every year. This is what's happening with oil and indeed with any other similar process where you destroy the resource to create more.
In the case of renewable energy however, the princiapl (the energy producing infrastructure) is NOT BURNED but instead remains thus it follows that the total principal (the energy producing infrastructure) grows with time. In this case though we have a constant EROEI we have a compound increase in the gross energy producing base with time.
In this scenario it is crucial that demand is managed so that not all of the renewable energy is consumed. In this way we can avoid "too little too late".
So. Where we are now is that we have a window of opportunity to have a prosperous future or a future of energy poverty. It is our choice.
Hi Dan;
Sounds like a good description of it.. for those who want to understand it in economic terms.
Just to ask for a clarification, what do you mean by "it is crucial that demand is managed so that not all of the renewable energy is consumed" ? Was it a typo, where you meant the remaining access to our 'Non-renewable sources' that must be applied to a buildout of renewable infrastructure?
Surely, we won't be consuming all of the renewable energy, since it is renewed. In that, I was looking for a place to suggest to Charles Barton that in my understanding, that NO, the Solar Input does not get counted on the 'Input Column' of EROEI, since that is the freebie we are tapping. The inputs we are concerned with are the ones we have to provide ourselves. That barrel of oil that pulls up other oil is coming from OUR ACCOUNT, so to speak, since that barrel was pulled up from the fraction of a barrel in our account Last Week. Now, if we use some solar-electricity that we stored in our batteries in order to move a tracked PV array, THAT input counts in the input side of the EROEI formula, since it's our investment of energy already available for our use, and that's where we've committed it. I see this calc (EROEI) not as some pure, euclidean function, but simply as a very practical assessment of 'what's it cost us to access this amount of power?'
To those who suggest that EROEI allows us to ignore and dicount other factors, like environmental impact, I'd say humbug. EROEI is not a get out of jail free Card. It is one (Key) consideration among many in determining the validity of an energy source.
Best,
Bob
EDITED FOR CLARITY
Bob, So some energy inputs don't are counted while others do not. What about energy sources that are virtually free, for example Lemhi Pass Thorium? If 4 guys with shovels and a rented pick up can dig up enough thorium at Lemhi Pass to produce 1 GWs of electricity for a year, and there is enough thorium run the American energy economy for hundreds of years, what is the point of EROEI analysis?
From my perspective EROEI analysis is a dishonest trick used by anti-nuclear fanatics to "prove" that nuclear power cannot be sustained for thousands of years, or a totally unneeded exercise to prove the obvious. We get "Storm-Smith," and David Fleming paraded over and over on The Oil Drum, and are told how bad the EROEI of nuclear power is, even though nuclear fuel is extremely cheap, and obvious, inexpensive fuel resources go begging for want of a market.
If it is possible to sustain the American energy economy for thousands of years using nuclear power, isn't EROEI analysis a needless and worthless exercise?
On the other hand it might be far more worthwhile to index resource resource input per unit of energy output. We could very well face a future of abundant energy resources, but shortages of the resources needed to capture it. The capitol costs of new electrical power facilities have at least doubled during the last 5 years, and this is attributed to demand driven increases in the cost of resources, not increases in the price of energy. Resource intense power generation systems may be vulnerable to dramatic future increases in the cost of construction.
IF this is possible, an EROEI analysis will be necessary to prove that it is possible. Get to work.
Hi Charles;
I don't claim to know the EROEI of the different forms of Nuclear, while I do oppose it on other grounds (which I have shared here frequently, and so will avoid it today).
It's only a needless and worthless exercise if we really have 'ample, safe and reliable energy for the foreseeable future', and clearly there is SOME debate on that point.
As I said elsewhere, EROEI is not an endall argument for an energy source, while it's probably a good starting point to see if it's worth going any further. But dishonest? You've called out Storm/Smith, and if they used bad numbers, that doesn't make EROEI dishonest. If Nuclear can show it's numbers honestly, and then sustain them as the oil infrastructure sags around it, then great.. we'll just be left with it's other issues to worry about..
"The capitol costs of new electrical power facilities have at least doubled during the last 5 years, and this is attributed to demand driven increases in the cost of resources, not increases in the price of energy." - and what drives the cost of these resources? It's a vicious circle, and good luck trying to keep energy prices (over the last 5 years? come on..) separate from that. EVERYTHING will cost more, Nuclear, Concrete, PV, WonderBread, Asphalt, LeadAcid Batts.. we'd better spend it on things that will last and serve us well.
Bob
Bob, I am having several problems here. First who is Charles Hall? Is he not an echologist? He appears to be applying an echological model to resource resource economics, without empirical testing, and perhaps without an decent knowledge basis.
Hall's CV does not hint at a background that would allow him to make a broad judgements about energy resources.
http://www.esf.edu/EFB/hall/CV_Long06FebMar.pdf
The peer reviewed publications appear to be all related to echology.
I don't see any evidence of a background that would allow him to make judgements on energy resources. This is especially true in the case of nuclear energy, where few people understand the technological options, and even fewer are aware of the geological resources. Dr Hall appears to be a supporter of nuclear power, but his published statements do not hint that he is aware of the true extent of the nuclear fuel resources that are can be accessed without excessive energy costs.
I will pass on to you a study on EROEI of Nuclear power for what it is worth.
http://www.world-nuclear.org/info/inf11.html
My contention is that current nuclear technology is highly inefficient, relative to what nuclear fuel use should be, but that a shift to thorium energy will probably force far greater efficiency on the nuclear industry. Few people fully understand the energy potential of uranium and thorium. Even fewer understand the technology that could allow our society to shift from a fossil fuel economy, to a thorium economy.
Another problem I have with Hall is what I would call the cult of Jay Forrester. Hall appears to be a great believer in Forrester. Forrester's great error in my view was his failure to allow for resource substitution, in his world dynamics model. The idea of substitution, by the way, has not made it to The Oil Drum, yet it is a simple idea, and thewre are innumerable examples of effective substitutions.
http://www.osti.gov/energycitations/product.biblio.jsp?osti_id=5045860&q...
On the Oil Drum, Forrester is regarded as beyond mistakes. I hardly think that to be the case. In addition, Forrester failed to understand that pollution is caused by inefficient use of resources, and that efficiency improvements in future energy economies, will diminish, not increase pollution. There is already ample evidence of this, if we compare our pollution problems to those of early the 1970's, when I first read Forrester.
If you take a look at how the calculation is performed, you'll see that the "free" portions are not counted as input, only as output. Nuclear power is treated fairly, more than fairly if the boundry is set at thermal output.
Looking at financial costs is also important. Apparently Austin Energy was to recommend against the new South Texas plants before the consideration of the license application was suspended owing to cost considerations which were apparently not accurately portrayed originally. I would expect new nuclear power to cost at least $8/Watt, a rather uncompetitive price.
Chris
mdsolar, If nuclear power shifts to thorium technology then efficiency increases greatly. Thermal efficiencies of 50% to 60% are potential, and mining and fuel processing costs would be for the next few hundred years minimal, and nuclear power could be extracted from 100% of the thorium that comes out of the ground, compared to 1% of mined uranium.
The cost of building reactors themselves is hardly the major expense. Compliance with NRC regulations is the really big hit, and that seems to get more expensive all the time. The same reactor that we are told will cost $7 billion a unit in Florida, costs $1.1 billion a unit in China. But some American power companies know how to build reactors. TVA recently announced that it expects to pay no more than $3 billion a unit.
At any rated I regard LWRs as expensive and dated technology. The development of Generation IV reactor technology needs to be speeded up, along with the development of new materials technology, and new site construction ideas. (Site construction appears more expensive than reactor construction.)
It seems to me that there would need to be important siting considerations before making such an investment Florida:
What seems to happen is that initial estimates such as that given by the TVA grow much larger once a few questions are asked by interested parties (e.g. state regulators). The TVA doesn't get a lot of questions until the GAO has to start investigations after the fact. The TVA has a pretty impressive record of enourmous cost overruns for nuclear power though.
I hope you'll support a moratorium on new nuclear power and accelerated shutdown of the present fleet. I'm pleased you have come out for repealing Price-Anderson.
Chris
It always impresses how much Chris worries about reactors in sea level rise. He shows us a map which indicates that millions of Floridians are in danger of drowning and hundreds of billions of dollars worth of property may be destroyed, and all he can think about is reactor siting and talks about problems TVA had with reactors some 20 years ago. What can I say>
Charles,
As you know, my calculations indicate that nuclear power it too slow to avoid climate change so every dollar invested in nuclear power is another another dollar put towards higher sea levels within the design lifetime of a nuclear plant. Because of this, if we do build nuclear power plants, we may as well not build them where they will be drowned. If we want to avoid the sea level rise, we'll avoid nuclear power all together and concentrate of renewbles which can be brought on line quicker so that we will have less CO2 to remove from the atmosphere, and more energy available to do that.
The insurance industry will ensure that coastal property values go to zero before they are inundated. There won't be a lot of private building going on in those areas before too long. So, the property losses will be pretty minimal in terms of dollars. You'll just find that you can't get insurance and then you won't be able to sell for much since no one will be able to borrow to buy. This starts to happen when the storm surge reaching you door is about 30 years off because this is the standard term for a mortgage. We are already seeing this effect all over the East Coast owing to an anticipation of stonger storms. First the insurance gets more expensive as more an more companies pull out and then in becomes unavailable. Then you can only sell to people who will pay cash which reduces demand and brings down the property values. Those who can pay cash will know what they are buying, a sort term lease from the sea with no option for renewal. But, nuclear power wants to build now with a requirement to use a site into the next century. Because of this, there is a need to plan ahead farther than the foresight of insurance and mortgage markets. The nuclear industry may not be so interested in paying back their longer term debt obligations, but if I'm to guarantee the loan, I'd like to see that it has some chance of being repaid. Not building in tidal areas provides a slim chance that the plants might be paid off.
Chris
But Chris, every dollar spent on florida real estate is a dollar not spent on fighting global warming and all of those houses, roads, shopping centers, and industrial buildings are every bit as much going to be wasted. Your choice to only focus on reactors in your projected future at the expense of all those Floridians whose property you expect to be underwater is a manifestation of your nuclear derangement syndrome.
Charles,
Again I have to say that you are not understanding the planning horizon for nuclear power. It is fine to build a thirty year road right now. People don't have to skedaddle yet. But, it is time to start planning to decommission plants that are at risk and avoid building new ones that would be at risk.
Chris
"Just to ask for a clarification, what do you mean by "it is crucial that demand is managed so that not all of the renewable energy is consumed" ? Was it a typo, where you meant the remaining access to our 'Non-renewable sources' that must be applied to a buildout of renewable infrastructure?"
What I mean is that if we consume every watt coming out of our already built renewable infrastructure along with burning up every last barrel of non-renewable, there will come a point where we cannot build any more renewable infrastructure without cutting back. Thus... we need to control demand.
It's another way of saying we need to watch what we spend energy wise.
Hi Dan;
Hmm. I think I come out differently on this. We should (and will) use every watt of renewable power we generate, precisely because those are the watts that DO get refilled for free, while we know that the energy stored in FF's is a once-only bit of capital that, once spent is not coming back.
Ultimately, we end up at your conclusion anyway. We need to control demand.. or supply will just be paring back and will do it for us, whether we're ready for it or not.. We will be cutting back, the question is do we choose to do some of it on our terms, or let fate (and our momentum) pick the entire path?
I would say as an example, that if you have added some PV to your roof, and say it has cut your grid-consumption in half, then it quickly becomes clear that any saving measures you can enact from then on will be shaving directly off of the GRID-portion, making your renewable percentage higher, and cutting both your overall consumption and your electric bill. If you have a renewable option in your system, you DO use every drop of it, as directly and efficiently as possible, as this is mitigating your consumption of 'imported energy'.
When I call it FREE, I mean that it is refilled for free, not that the equipment is free.
I'm not sure why you think we'll get to a point where we can't build any more renewables, though. Already there are Terawatts of RE power available out there, which can be used to help make more.. it becomes, again, a question of 'flow rate'.. right now, with the might of FF's, we could be spending this Trust fund to start that build out at a good clip, or we can keep-on-truckin' our redundant lorryloads back and forth across the world, while the RE stuff keeps dribbling in.
Best, Bob
OK, I think I understand you.
You don't want to count wind or solar because we keep getting a free refill?
OK well if we do that I'd like to change the name of the formula to be
Energy Returned on Barrels Of Oil Invested
because I don't think it's sensible to propagate the idea of energy as being ONLY equivalent to barrels of oil since they are non-renewable and just serves to continue to propagate the myth that there is no way out.
If we used two formulas: EROEI and EROBI then we could determine which projects were viable in terms of barrels of oil IF that was how we chose to go ahead.
Then we should run a by-comparison EROEI using energy derived from renewable sources.
Due to scarcity constraints, initially it could still be more feasible to complete a project using barrels of oil. As time goes on, however, the curves will cross and it will be easier to see that we should complete a project using renewable energy instead.
but there is no free refill for wind and solar. I like very much solar and try progressively to shift my home to solar. I can tell you that that is not free. By that reasonning, saudis still have "free" oil, by turning on a closed valve in an existing well if this well is still under pressure.
In the energy processing chain, initial harvest is always about "free" material, wind, sunshine, water in a lake, uranium in the ground, coal in the ground, methane in the ground etc ... . Energy investment begins when you want to upgrade, store, transport then transform these energy sources.
There will always be energy invested in infrastructure : construction, maintaining, operating of this. If the energy costs of these steps in fine are really below the energy returned, then fine, we have a solution for the energy problem of the world (but don't forget to upgrade the final transformation infrastructure like electrical energy to mechanical energy, extreme heat, and so on if we are to continue existing as we do presently), if we can find the energy to build this in the first place without disrupting our society.
Renewables ARE different.
The beauty of fossil fuels is that they also represent energy storage which renewable electricity doesn't have.(Something completely ignored by EROEI theories).
Solar has a capacity factor of only 15%(wind is 30%). So we need to store for the other 85% (70%) of the time.
I think for the foreseeable future we need to conserve fossil fuels as a means of energy storage which simultaneously increasing the contribution of renewables. For example, the USA has lots of wind and lots of coal. We need to replace fossil fuels used to home heating with electric heat from wind farms and convert coal into the kind of fuel we can use to backup wind, such as synthetic natural gas. But that's not enough. We need to also storage, preferable distributed at the point of use. For example, you can buy electric heaters with bricks in them that can store up to 10 hours of heating in them. This radically increases the amount of back up generator fuel that needs to be burnt.
Alternately you could make ice to store energy when the wind blows for AC, etc.
Here's the result of an integrated system simulation using the Windscreen 3 computer program.
What the chart says is that for a given wind to load ratio W/L you can save a certain percentage of fossil
fuel and their are various curves depending on how much thermal storage you have. The system load they are using is 110 KW so if you have 110KW of wind and 110 KW of load(1:1) with zero energy storage you save 30% of the fossil fuel you use--not too impressive. But if you overbuild ~200 KW of wind for the same 110 KW of load with 10 hours of energy storage(1100KWh) you save about 83% of the fossil fuel you would use.
Now this is for wind in a windy place and wind has a capacity factor of 30%. Solar electric storage at 15% capacity factor needs to be much larger, but since we have so much fossil fuel coal and so much wind in Texas for example, we can wait for new solar electric storage methods for a couple of decades.
On another subject, have you posted any kind of country by country spreadsheet of the world export oil market based on exportland?
It would be nice to see how it is (probably)going to contract. I think it would have geo-political implications.
The basic understanding of EROEI is that all life on earth before humans evolved, behaved in a sustainable manner, all other life except humans still do.
Sustainable development is development that "meets the needs of the present without compromising the ability of future generations to meet their own needs. The Brundtland definition thus implicitly argues for the rights of future generations to raw materials and vital ecosystem services to be taken into account in decision making".
Real EROEI is the amount of energy required by a human to obtain clothing, shelter and more food. Surplus to that means over re-prodution and an exponential population growth, which is what has happened.
The idea that thorium will keep us chugging along nicely simply because the energy produced has a high EROEI is tantamount to religious faith. What happens to the energy which is produced in these fabulous reactors?
The energy simply provides the means for humans, (in a forlorn attempt at BAU) to continue to deplete the environment and hasten the demise of the human race.
Energy for more mining, more food production more cornflakes and pleasure cruises and the rape and killing of the oceans.
Factor that into the aggrandizing EROEI calculations.
We kill more animals than we need, for gourmet food, fashion and finer clothes and a different suit every day, more trees and minerals for bigger homes and faster, shiner cars.
That is where your thorium energy will go.
Humans exploit.
We exploit all other life including other humans. We exploit the environment in the name of comfort, happiness and pleasure and the pleasure expectation increases with each generation.
I'm no different, I'm held hostage to my evolution and genes. It is what makes us human and we can no more curtail our hunger for pleasure and happiness than return to a cave person lifestyle.
Essentially that is why I am a doomer.
Until peak oil and my understanding of its implications I assumed there would be solutions to our plunder of the environment. I thought we would just simply stop doing it because it was the right thing to do.
I understand the presumptions of EROEI but it is meaningless.
We will continue to exploit until we can't.
The exploitation of humans will increase. The religious will find a reference to its acceptability in the bible.
Spot on. Fusion used to be the big cornucopian pie in the sky fantasy. For decades I've argued that abundant cheap energy would be the worst possible catastrophe to befall the biosphere, in that it would only allow Anthropus ecocidus to appropriate even more of global primary productivity than it already does (~40%). I guess the fusion fantasy has fizzled and now its BAU 'cept with us all 56 billion of us riding electric tricycles powered by thorium reactors in the near future. Biodiversity and ecosystem support services don't seem to matter; given sufficient cheap energy "alternatives" will be found. That's how markets work, right? Humans are so stupid we don't deserve to survive.
I agreed with you until your last sentence, though that appears to be a core belief of yours.
But I concur that one of the worst 'answers' to the unfolding crises is to come up with some cheap abundant ENERGY source. This energy surplus would then ripple through the system like a deposit in a fractional banking system, using up magnitudes more of NON-ENERGY resources like water, air, rare earth metals, forests, species, etc. We are in deep doo-doo with fossil fuels, but at least they will limit the size of the straw sucking out of other pools. (though at first of course, we will suck even MORE out of some pools - like forests, air quality, etc. in quest for liquid fuels)
Who are you? A professor? You sound like cross between Jay Hanson and Jay Forrester, but I know youre not either by your IP.
Well, at least we already have availability of cheap abundant energy, in the form of wind generators and solar collectors of all types. Maybe even lots of geothermal.
Nobody wants to pay the initial down payment to build as many of them as needed.
Therefore they will not be built because they keep getting more expensive as the price of energy rises.
Its just too bad we are wasting all those fossil fuels on pleasures instead of useful products like alternate energy systems, that future generations can use.
The link below has comments on renewability of wind power followed by a few excellent civil posts discussing the renewability of nuclear power.
http://www.theoildrum.com/node/3764#comment-322957
There is some merit in your case, and I agree that presently human activity has a major detrimental effect on the biosphere.
However, contrarian arguments should not be totally discounted, for instance it is far easier with abundant energy to purify water, dispose of sewage and process waste.
You would also eliminate one of the biggest single impactors on the earth, coal mining.
A best case scenario would have high prosperity leading to gradually declining population, just as is happening in the west.
As to whether we will actually make it, I have no idea, but the environmental impact of little power would be major - look at the devastation in war zones.
If one of our primary economic goals was to live within our means both ecologically and mineralogically, then the cheaper (i.e. the smaller the resource intensity of net energy extraction) our energy supply was the better off we would be. Unfortunately it is impossible to embrace such a goal within a system of private finance capitalism. The minute growth even begins to slow down people start to get anxious about the security of their jobs and of their retirement funds. A system of private finance capitalism will always desire growth, and there is no way to make it desire anything else. Some people argue that we need to go on growing as long as possible in order to develop new technology, so when the end of growth comes the transition to a growthless economy will be less painful than it would be otherwise. The converse side of this argument is that if we go on piling up ecological debts then no matter how advanced our technology becomes we may not be able to stave off a disastrous collapse of the human population.
Personally I reject the idea that scientific and technical knowledge can be accumulated efficiently only under a system of private finance capitalism. For one thing, I think that if we stopped wasting resources building plasma screen televisions, jet skis, 100 watt/channel stereo surround sound systems, SUVs, muscle cars, McMansions, etc. that we would have a lot more resources available for creating a sustainable infrastructure. For another thing, I believe that the system patenting and intellectual property rights actually slows down technological progress in spite of claims about the efficiency of greed. The key question is how do we reorganize our society to pursue some economic goal other that the short term accumulation of private fortunes? Many people claim that Wall Street or the Politburo are the only possible options for the organization of complex technological economies. I think that we need to find a third path, and the sooner we start thinking about how such a path can be created, the better off we will be.
anthropus ecocidus : I will have to remember that one.
"Humans are so stupid we don't deserve to survive" : we will know that in 30 years (or the arthropods will know). Human societies function like yeast colonies but still, there have been some humans and even human organisations living or trying to live on other paradigms or not ?
It is what makes us human and we can no more curtail our hunger for pleasure and happiness than return to a cave person lifestyle.
There are many sustainable ways to find "pleasure and happiness".
At dinner last night with my psychiatrist friend, we noted that "seeking a life worth living" or fulfillment was a better goal than other goals that are just "boring".
Best Hopes for Seeking Fulfillment,
Alan
E=mc2 is an abstract concept? You're kidding right. Methinks the pro nuke crowd at least might disagree, eh?
"In addition their predictions seem to have lost a lot of credibility due to the recent analysis of Morton, who showed that all of their price predictions in the past 8 years have failed miserably."
Do we have any links for Morton's work?
http://home.entouch.net/dmd/Oilcrisis.htm
Thanks
In my view EROI calculations are a waste of time.
When they actually become significant they are reflected in excess costs, so don't need separate calculation.
An example of this would be recent rises in oil prices, which is clearly associated with having to use more rigs to find the oil and extract it from smaller fields and with more cumbersome techniques.
So why attempt complicated and dubious calculations?
The clearest example of how prone to misuse they are is in the Storm-Smith works, which had theoretical values for the amount of energy needed to extract low-grade uranium, but it so happened that uranium of precisely that grade was actually extracted at Rossing, and it used 60 times less energy than the model predicted.
The rest of the calculations when this level of egregious error was recognised should have been simply put in the trash, but it is still referenced time after time.
In a similar manner there is a 50 times energy input disparity between two different ways of processing the nuclear fuel, so any EROI calculation based on the more inefficient method is simply an argument for moving to the better one, which the financials should clearly be showing anyway without reference to complicated EROI calculations.
The only time that they are at all useful is to expose boondoggles like the corn-ethanol program.
Both renewables and nuclear are fine for EROI.
"to expose boondoggles like the corn-ethanol program"
That's enough justification for me.
If the input numbers were off in Storm-Smith, then it's a data problem (and probably still is), not a problem with EROEI.
Fair enough, jokuhl.
However, simple economics shows very clearly that corn ethanol is a waste of time before you ever get into calculating EROI.
Another area where EROI is relevant is in producing oil form tar sands, so I think that you are correct and that I have overstated my case.
What put me off was all the fiddling around with EROI calculations for nuclear power, when the cost of the uranium is a tiny fraction of the overall cost of power and that is the reason it is being used inefficiently, and even the absurdly low EROI figures given were presented as some sort of comment on the efficiency of 'nuclear power' as such, rather than a comment on particular fuel and processing regimes.
In principle, unless there is an over-riding reason to do so, I prefer to avoid very complicated analyses - by their nature they lend themselves to open to manipulation by those who are seeking to confuse the issue and make polemical points.
So IOW it may be worth carrying out EROI calculations where fuel costs are a very substantial part of the total costs of the product, as it is for corn ethanol and tar sand oil production, but it's use in areas where fuel is a tiny part of the final cost is crazy, and so are the purported conclusions drawn.
"it may be worth carrying out EROI calculations where fuel costs are a very substantial part of the total costs of the product, as it is for corn ethanol and tar sand oil production"
I think I agree with this.. while 'costs' could be considered as either Money or BTU inputs, as appropriate, but the 'inputs' for Nuclear's fuel cycle involve a number of essential processes that are difficult to apply a simple value figure for. Supporting industries (parts, laborpool, security), Maintenance, Fuel refinement, Road Infrastructure, Economic and Regulatory Environment. The scale that this operates on seems fraught with vulnerabilities to 'complexity collapse disorder'. Those are inputs that have to be viewed in some kind of ROI calc, but I don't know what I'd call it.
Bob
Precisely. Carrying out these calculations opens up whole cans of worms, and that is why it is so easy to distort, and the reason many love the complication.
In fact though, although it is not a perfect surrogate for energy input calculations, in most circumstances financial costs are a good enough proxy - no one forgets to charge for the oil they used to dig out ore and so on.
It is pretty obvious that the EROI calculations are totally erroneous when the fuel costs are such a small proportion of total cost as they are for nuclear power.
Of course, you have to add in energy costs to build the plant and decommission it and so on, and that is the reason it is so easy to fake up EROI calculations, as should you count, for instance, the petrol staff use to drive to the plant whilst operating it, and so on into infinite regresses.
Actually we have fairly good figures for actual energy inputs to build and run a nuclear plant, at Vattenfall
http://www.uic.com.au/nip57.htm
Energy analysis of power systems
Of course, what then happens is nitpicking on whether this or that should be in and out, although it is quite clear that the EROI is very good, rather similarly to the debating techniques used when considering CO2 emissions from nuclear plants, where there is a lot of nitpicking when the overall conclusion that either renewables or nuclear emit vastly less CO2 than coal is perfectly plain.
If there were a real problem with nuclear EROI it would be substantially reflected in costs, just as it is with gas and oil.
Some concerns with nuclear power such as safety are ones which we all share to some degree, although the actual record is very good.
Concerns either about EROI or running out of fissionable materials seem to be entirely fanciful though, and the figures and analyses used to support them seem entirely without merit.
I just checked in with Prof Hall and he is going to respond to this post tomorrow - so if there are any direct questions/comments/criticisms of this essay nows the chance:
Considering the hydrothermal theory of mineral deposition that may have occurred as the earth cooled after the original gravitational collapse, how can EROI account for the massive energy or entropic value of minerals that were concentrated by epithermal deposition?
Hi Robert,
I am not sure I totally understand your question, but what I think you are asking is "What is the impact on EROI of these highly concentrated minerals?"
As the ore grade declines, required energy to concentrate the ore increases. Here is a chart from Limits to Growth.
As energy requirements for iron ore increase, the decline in oil and natural gas EROI will accelerate because these are very steel intensive industries.
Sigh!
From: THE AGE OF SUBSTITUTABILITY (1975)
by H. E. Goeller and Alvin Weinberg
(Eleventh Annual Foiindation Lecture for FresentatZon before the United Kingdom Science Policy Foundation Fifth International Synposiuix - "A Strategy for Resources" - Eindhotten, The Netherlads, Septsrnber 18, 1975.)
http://www.osti.gov/energycitations/servlets/purl/5045860-HVRCd7/5045860...
Assumptions:
1. All fossil fuels, at this rate of energy expenditure, would be
used up within 100 years.
2. The fission breeder, fusion (if feasible), or solar energy, -
in principle, could carry this energy budget essential ly forever.
3. The climatic changes caused by so large a release of energy
cannot be predicted with our present know1edge of climatology, a1though the average increase in world temperature, assuming no changes in albedo, would be about 0.l (degrees) C. Whether the effect of such energy output on the climate will ever be predictable, even -
in principle, remains a moot question.
----------------------
"the catastrophists, when discussing a particular resource such as
aluminurn, usually say that when all the bauxite is gone, we will have to do without aluminum. Thus we read. inZLimits to Growth, "The effect of exponential growth is to reduce the probable period of availability of aluminum from 100 years to 31 years.'' This cannot be ccrrect. As geologist Dean F. Frasch; said in 1962, "Total exhaustion of any mineral resource will never occur. Minerals, and rocks that are unexploited will always remain in the earth's crust. The basic problem is how to avoid reaching a point where the cost of exploiting those mineral deposits which remain will be so costly, due to depth, size, or grade, that we cannot produce what we need without completely disrupting our socia1 and economic structures."
Earth's crust contains 1.7 x 10(l5) Tons of Aluminum a virtually limitless amount.
* As prices for materials go up, there obviously will be stronger
incentive to recycle
* the energy required for extracting metals will not grow nearly as much as one might think.
* the overall energy required is not very sensitive to the grade of ore until the ore becomes extremely dilute .- and this will never happen for the "infinite" metals. (Iron and Aluminum)
* the estimated energy required to produce these "infinite" metals from essentially inexhaustible sources is in every case not mclre than about 60 percent higher than the energy required to win the rnetals from high-grade ores.
I call BS on this. This implies that it only takes 60% more energy to mine and smelt a 1% grade ore as opposed to 60% grade ore. At the very least, it's going to cost 60x the energy in just the mining portion.
Before that is this quote.
Even with an "infinite" amount of any particular resource, at some point it becomes unreasonable to attempt to exploit. Until and unless we, as a whole, can get it through our heads that infinite expansion is not only impossible but very unwise, there is no future for our species and probably for our planet. We might still muddle around for a while, decades or even centuries, but it's a near certainly that humans won't be around a thousand generations down the road.
Here is a link to some expert comment on the issues of mining lower grade ores.
Basically, you use different techniques, including leaching.
I understand energy costs are also a fairly small part of total mining costs.
http://www.theoildrum.com/node/3747#comment-321313
Read down to following comments by metalman and bryant - things are not straightforward!
Thanks for the attempted clarification and the chart. It took an almost unimaginable amount of energy to boil the earth and concentrate the minerals. How can one account for this energy when the minerals are used to facilitate production of oil or other energy resources?
Dr. Hall,
In the graph in the article, gas is low and coal is high but when I've investigated the high number for coal, it turns out to rest on work by Cutler Cleveland which has a boundry at the mouth of the mine. Gas seems to run into trouble because it needs pipelines to get it to market. Certainly, gas that comes out of an oil well has an EROEI that is essentially infinite in one way of looking at things. You don't need to pump to get gas so the energy invested is for the oil not the gas. Coal also needs rail to get it to the power plant and Heading Out has raised concerns about the energy needed to pulverize coal before it is burned. Coal plants also have capital energy costs and waste disposal costs and such similar to nuclear power plants and home gas furnaces. And, there are very different efficiencies between a gas furnace (85%), gas turbine (60%) and a coal power plant (40%). Could you comment on the boundries in the graph for the various energy sources? What problems do you see in setting a boundry for all sources where the rubber meets the road or where the toaster heats the pop tart? Finally, I've noticed that for sources that produce electicity directly like hydro, wind and solar PV, even with a lower self-source EROEI, they require less energy investment to meet a particular energy supply goal. Can you comment on how this effect might described clearly either in terms of EROEI or otherwise?
Thanks,
Chris
The relationship between energy and economics has been illustrated in an interesting way in Frank Kapra's 1956 Movie called "Our Mr Sun" with Eddie Albert and Dr Frank Baxter. In this childrens cartoon energy in Horsepower was portrayed as deposits in an Energy Bank, where energy deposits ( coal, oil, natural gas, nuclear) have been made in the past. Withdrawals from the Bank are being taken out at a rate far faster than deposits ( Solar, nuclear) The movie forecasts the end of the "Machine age" and a return to a world of about 1 billion people of the Middle ages, unless an efficient form of solar or geothermal energy can be found.
Perhaps the Bank - Energy analogy can be used to help predict the long term value of resources based on various energy scarity scenarios. Energy Efficiency improvements will only delay the inevitable, and in some circumstances make it worse by increasing the number of users who can afford to use machines ( eg the new Indian TATA Car). EROI needs to take into account long term energy availablity. Current ROI approaches are all very short sighted.
Even with solar and geothermal energy, we'd still run into limits of what's available eventually. There is only so much surface area on our plant to put geothermal plants and/or solar arrays (PV or thermal.)
That is an interesting supposition. We expect 9 to 11 billion people to be the largest population of people the Earth will ever have at one time. If girls are educated up though 12th grade, fertility falls off and we are headed in that direction on the education front. California has seen flat per household electricity consumption for some time now. Say 500 kWh/month for a family of four, what we expect for family size in the future. So, with 3 billion families using electricity the way it has been done in California for a while now, we need 1500 TWh/month, or 2 TW of electricity on average. The Sun provides and average 350 W/m2 (day and night) and we can certainly expect 50% efficeincy by the time the population is that large so lets say that we can collect 175 W/m2. So, we need a square 100 kilometers on a side to supply that power. Transportation does not add that much if it is electric but industry probably does add as much. The land surface area of the Earth is about 1.5x10⁸ km2 so that is about 0.03% of the land surface area. It doesn't have to be all in one square, that is just to give an idea. So, unless we decide that educating girls is a bad thing and stop doing it, we are not at risk of running out of land surface area to get energy from the Sun with our largest anticipated population, not by a very long way.
Chris
we can certainly expect 50% efficeincy by the time the population is that large
I CERTAINLY do not expect conversion efficiencies that large for large scale economic installations !
And electricity is MUCH more than raw MWh. Time of day demand, Seasonal demand, spinning reserves & load following. Solar and wind are nearly useless for these "as is".
Alan
Alan,
What problem to you have with 50% efficiency? If anything, that is a very conservative estimate on that timescale. 40% efficienct panels are being commercialized now. It hardly changes the point. We cannot run out of surface area to collect solar power. We can run out of oil and coal and gas and uranium though.
Chris
40% efficiency is being "commercialized" for satellites and other very high value applications.
There is no reason to assume that this level of complexity and cost will be applied to rooftops everywhere. 10% to 12% or so is more likely in the real world.
After all dust and bird droppings exist, and all solar PV decays over time.
Best Hopes for Realism
Alan
DARPA is aiming for $2/Watt 50% efficicent and commercialization is aiming at army field deployment first.
http://www.eetimes.com/news/latest/showArticle.jhtml?articleID=201202573
In a lot of places, to get a rebate for solar, you need an assruance that the panels will perform within 80% of their rated efficiency for at least 25 years. It is hard to find silicon that is less than 14% efficient unless it is amorphous these days. SunPower produces cells with 20% efficiency http://www.news.com/SunPower-boosts-solar-panel-output/2100-11395_3-6125...
SunTech, China's largest producer just annouced 18% for their cells: http://www.bloggingstocks.com/2008/04/04/suntech-power-stp-a-new-technol...
China will likely be the world's top producer this year.
So, to get to 10% efficiency from 18% you'd have to run the cells for more than 60 years.
I'd say you could adopt more realistic figures for your estimates of what is being installed now. By the time the population reaches 9 billion people, 50% efficient panels seem likely to be common.
So far as I know, rain is the answer to bird dropping and dust for the most part. Except for nesting areas on the shore, I don't believe I've ever seen 50% coverage of bird droppings.
Chris
One energy input I never see used is human labor - that is considered a financial rather than energy input. But when humans labor they burn calories supplied by food grown in large part with fossil fuels. If we were to replace a human with a machine, the energy formerly supplied by a human would then be counted because the machine uses fuel.
For example, in Brazil a worker may have to cut 20 tons of cane a day. I am quite sure the calorie needs of the worker are not counted in the ERoEI of ethanol from cane. If we were to use workers instead of motorized plows to grow our corn, would we then have a higher ERoEI for corn ethanol?
I would suggest that basic human energy needs of workers - food, heat, housing and transportation should be part of any ERoEI calculation.
oxidatedgem Geeze, assigning the personal energy needs of workers to their employeers is down right creepy. Should we shut down those workers whose energy output is exceeded by their energy input? Is EROEI correctness part of the New World Order?
The energy EROEI of workers should be included in the household sector of the economy, rather than under the industrial sector.
Charles, as I said, if you replace a human worker with a machine, you count the energy used to run the machine as EI. Why is machine energy the only energy that is counted?
oxi - this aspect, along with robert wilson's query above regarding the energy it took to boil the earth and concentrate minerals, I think raises an important issue of clarification regarding just what we're trying to determine the EROEI of (and for). Here's my stab... There are sources of energy out there - from gooey globs to shiny rays. Nature or (insert your preferred deity here) made and/or continues to make those. Along comes homo collosus (from Catton). We want to manipulate those globs or rays to our advantage. This establishes the boundaries. We don't count the energy of solar fission as an input. It's already done, outside human systems. Likewise we don't count the geologic process of cooking some of those rays into gooey globs or chunks of coal. That part of the process is a given - not so much a sunk cost as a floating freebie. Then humans come in and drill a well, with the intent of extracting the goo, and burning it to provide warmth or mobility. Everything that humans must do in order to make the goo into heat or mobility must be counted. So, yes, I think the energy of the workers should be counted. As you point out, if not them, then machines, which would be counted. So the defining boundary is human manipulation of the 'stuff' to provide ourselves with some useful end. How much human manipulation of stuff - energy invested - must we put in to achieve a useful end - energy returned?
There's also a second dividing line worth noting. As JMG over at Archdruid discusses, there are production costs and system costs. Confusion over this has also marred our discussion of EROEI. mdsolar suggests calculating EROEI thorugh the point where the rubber meets the road or the toaster heats the pop tart. I think it should be calculated one step back from that - at the gas pump or the circuit breaker. Everything up until that point includes what it takes to make goo or rays into energy that is useful to human activity - crude into gas for the car, or sunshine into electricity for the home. After that point, the efficiency of the system that uses that energy can vary greatly, from a Hummer to a Prius, from an incandescent to a CFL. So it's the delivery point that I suggest as the appropriate ending boundary. Everything that humans do to the goo before that point is an input, what is delivered at the pump or the socket is the return. What we do with it after that point also matters greatly, but is a separate and highly variable calculation.
I very much agree. But we should count the energy to make the ultimate infrastructure, which transforms the final distributed energy (i.e. fuels, electricity) into useful energy (cars, heating machines, industrial engines...) as an input. Because if you can run your infrastructure but if you don't have enough energy to build it, how can this be possible ?
Greer has some timely and relevant thoughts on EROI here.
Once more back to the well, so to speak, in an effort to cut through the fog. For those who say EROEI doesn't matter, I say this. Imagine two energy sources - anything you like, anything at all. To extract or convert 10 of those units into a form (electricity is a form) useful to human activity takes a certain amount of energy. Let's say extraction/conversion of 10 units of source A takes 1 unit. Ratio of 10:1, 900% return, net 9. Pretty good deal. Let's say e/c of 10 units of source B takes 7.5 units. Ratio of 10:7.5(1.33:1), 30% return, net 2.5. Not so good. Which source would society tend to exploit/use first/expand based upon/become addicted to? The real world situation is that we built a society based on the broad availability of 100:1, 9900% return energy (Kunstler's "greatest misallocation of resources ever") that is now being run on 15:1, 1400% return energy, or perhaps 10:1, 900% return energy. We've already lost an order of magnitude. This is why the rampant economic expansion that we took for granted in the 20th century, that fueled globalism and fed the exploding population, is groaning and straining, from Wall St. to Main St. to mud street. Already things are so tight that we are turning to sources in the 3:1, 200% return and 1.3:1, 30% return range. Whoops, there goes another order of magnitude. It doesn't matter what one's philosophy, or politics, or religion or anything else is. Society is going to have to adjust to the reality of this bio/geo/physical reality. Where we previously had a huge energy surplus (that not used to procure more energy) to build skyscrapers and interstates and server farms, and to jet and drive and skitter about the planet on all manner of mechanized machinery, and to provide fertilizer and pesticides and fuel to grow and transport the food for 6.7 billion mouths, we now find that surplus shrinking at an alarming rate. So EROEI matters, because the more resources we pour into 1.3:1 'solutions', or some that are even less than unity, the fewer resources we'll have to invest in more useful endeavors. Finally, yes, there is a difference between renewable and non-renewable sources. But if the return on renewable sources is in the low single digits, we're still going to have to allocate a vastly greater portion of our resources into simply producing energy than we did two orders of magnitude ago. And that then leads into all the environmental, ethical and other considerations of food, soil, species extinction and the like that are already placing constraints on the human economy. So thank you, Dr. Hall and Nate, for putting this on our plates. Here's hoping that we can gain some insight as to just where we are regarding EROEI of conventional and alternative sources through this collective process, rather than merely debating the usefulness of EROEI as a metric.
This is Charlies response after reading the above. I have also made it a separate post which can be found here.
To: TOD responders to Charles Hall’s EROI post
From: Charles Hall (With assistance from Graduate Student David Murphy
and thanks to Nate)
RE: Your posts
I am rather blown away by the response to my post, both the many attacks and the equally many folks who have come out of the woodwork to my defense, or rather the defense of the validity of the EROI approach. I thank you all, for I think we need more discussion of this issue. I regret only that since I am a very fully employed professor, teaching four courses this semester (2 more than “required” in order to try to get energy/environmental/economic analysis properly placed in our curriculum), my responses will be more limited than would otherwise be the case. In addition this is advising week, we hope to get a new energy major approved by the faculty next week, and I have many graduate students to work with. A telling comment on this whole process came from my equally busy faculty wife who asked, upon hearing me read aloud many comments “How come these people have so much time to do this stuff” to which I answered “Because we still have surplus energy”.
The main thing I get out of all of this is that Nate is right, there just are different camps, just as there are differing favorite political candidates (including none of above). OK. Please just sit happily in your camp. Carp if you must. I will ignore those who confuse conversion efficiency or material extraction with EROI (See Science June 23 2006) or who think that markets solve all problems. If you wish, however, I might introduce the latter to the Easter bunny.
I am an ecologist (but not of the tree hugging variety). All this EROI stuff comes out of my spending most of my life measuring and attempting to understand energy flows in natural ecosystems. There is no money in these systems, but there are perfectly good economies. If e.g. a trout does not maintain appositive EROI he does not survive, and if he or she does not make a substantial energy profit that trout or system does not go into the future. Likewise societies (Tainter).
For those like Mr. Barton who question my energy bona fides my graduate training under Howard Odum, certainly one of our great energy thinkers, was about energy every day, and included courses in energy and engineering as well as chemistry and biology. I did a post doctorate under George Woodwell at Brookhaven and Oak Ridge National Laboratories (basically energy laboratories) and partook in many energy-related activities with physicists, economists and so on there and later at Cornell University where I was professor for 13 years. Most of my 200 plus publications and 7 books are explicitly or implicitly about energy. I do not know everything about energy but I think few have been more consistently trained or involved, and I do not especially appreciate comments that because I am an ecologist I do not know about energy.
In mid career I became turned off by theory in ecology so I went to study economics which I thought was much more rigorous. Instead I found most of economic theory even further removed from reality than ecological theory. All this is chronicled in my various publications and my present efforts to construct Biophysical Economics. In both ecology and economics I have found a vast confusion between mathematical rigor and scientific rigor, but is energy something I can sink my teeth into and can believe. If you cannot, then it will be difficult for you to understand what we are trying to do.
But let’s get some basics down. The really sorry thing is that I believe that we asked and mostly answered most of these questions 30 years ago when a substantial portion of academia and government were really engaged in doing this kind of analysis and when we had some fine programs within which to do it at Cornell (where I was with Cleveland and Kaufmann as my students), at Florida (where my advisor H.T. Odum was still very active), at Illinois (where very comprehensive energy analyses were undertaken and published), at Berkeley and a few other places. There were national meetings, a lot of personal energy, and all the same questions as we see here. It is frustrating that in a sense we have made no progress in the last 30 years during which energy was off most people’s radar screens. (I have summarized this history in a paper with John Day just submitted). My students now look very hard to find any real energy programs to apply to that excite them beyond engineering and the development of silver bullet non solutions. Additionally, and except for ASPO and the private sources listed in my acknowledgements (thank you!), there is essentially no place at NSF or DOE to even apply for funds. As those who have attended my presentations know the top ten energy analysts I know have not been funded AT ALL, and tell me they do their work “on the weekends”, “pro bono”, “after retirement “ and so on. The point of all this is that these issues are old, have been pretty thoroughly hashed over long ago, and we should have made much more progress in deriving and promulgating and undertaking sensitivity analysis of EROI than we have. But there has been neither financial support nor, except amongst the faithful out in the wilderness, activity. And, as Nate says, rather than arrogantly publishing formally the work I have done I am somewhat humbly approaching all of you to get your input. An interesting point to add to this was made by one of my graduate students about our TOD discussions so far: “Lots and lots of discussion but no new hard numbers.” Well we hope that will change.
OK Let me respond in a very general way to the most frequent issues:
1) Are there problems with EROI analysis? Yes, of course. But in my opinion far less of a problem than with e.g. conventional economics (See Hall et al. 2001 Bioscience. All my important papers downloadable from my web site, See also Cleveland’s Boston University site). I have never advocated making decisions just from EROI but, as is clear in my post, think it a damn useful tool in our toolbags. Thank you Nate and others for clarifying the essential issue. I think in time EROI will largely drive the economics, and we have, I believe, saved some investors a lot of money on e.g. corn-based ethanol even when market signals had been the opposite. Some says that EROI analysis is useful only at very low EROI values. I think instead that the qualitative and quantitative analysis synthesized in the balloon graph shows, even with the considerable uncertainties, some important histories, some good and some bad ideas about future possibilities and a pretty good road map of what we have to do if we are to replace gas and oil.
2) “EROI has not considered the different qualities of energy”. Get real. Energy quality always has been central to most EROI analysis since its beginning (Odum as given in yesterday’s postings, Hall and Cleveland 1981, Cleveland et al. 1984; Hall, Cleveland and Kaufmann 1986, Hall et al. 2003). These papers are published in our “best” Journals (Science, Nature, BioScience) and are available in any good library. Now of course determining exactly what “quality” means can be difficult. Our method has been normally to simply weigh primary electricity as 3 times fossil fuels (i.e. that is the conversion efficiency and roughly the economic cost differential) and do the analysis with and without this quality correction. Cleveland prefers the price-based divisia index, and we are exploring that more.
3) EROI does emphasize and include many issues missed in conventional economic analysis but its cost boundaries are as subject to discussion and opinion as are those in economics. I for one like to do the analysis with various inclusion of e.g. indirect, environmental, labor and so on and let the reader take his or her choice. We have done that in the past. But without much financing that is pretty tough to do these days.
4) Howard Odum and Mark Brown have considered all of the “Earth energies” in their emergy (with an m) analysis, which attempts to include e.g. the sunshine used to lift and purify the water used, the Earth energy to make the oil and so on. I have avoided this issue because of the considerable uncertainty in estimating the “transformities” required but like the approach conceptually and believe it is a more or less upper energy cost approach. Mark Brown, Mathis Wackernagel and I have used comprehensive economic, emergy and ecological footprint analysis to examine the issue of sustainability in Costa Rica (in Hall 2000). Fortuitously or not our answers were similar.
5) My own assessments have always been based on the actual, the here and now, the energy flows now occurring (which are about 40 percent oil and 25 percent natural gas in the US), time series that have examined trends, and, sometimes, extrapolations into the relatively near future. I accept things as they are: oil rigs normally use oil or gas because this is what is available and cheap to them, coal extraction uses mostly diesel or electricity either from the grid or occasionally from dedicated coal plants because that is what they do. Manufacturing uses the general mix of energy in society unless we have more specific information, which is rare. I do not find the idea of dedicating the output of a given source to constructing more of that source except as an exercise in what that might mean because that is not what we do.
6) Yes we need more explicit protocols. I gave a paper on that at ASPO Boston, which suggested what some of those protocols might be, and wrote it up, but its completion has been delayed for reasons beyond my control
7) Oil prices do not respond just to EROI but also overall availability relative to demand, which was high in e.g. the 1990s.
8) Ok the full oil and sub prime issue. Oil was cheap, $3.50 a barrel, at the start of 1973. The US was the world’s largest producer. Peak oil had just occurred but no one noticed. Demand kept growing, US supply fell, foreign suppliers gained leverage. Political events and bulldozer accidents intervened. The price increased by a factor of ten, to $35 a barrel. The proportion of GDP that went to buying oil increased from about 4 percent to 13 percent, restricting discretionary spending for all. All around the world oil that had been found but not developed (as it had not been worth much) suddenly became profitable to develop, and it was. By the 1990s the world was awash in oil, and the real price fell to nearly what it was in 1973. The proportion of GDP that was energy fell to about 5 percent, essentially giving everyone a sudden free extra 8-10 percent of their incomes to play with. Many invested in the stock market, but the burst bubble of 2000 cured many. Real estate was a “safe” bet, so many invested into what was really a huge surplus square footage of McMansions etc. Just as my mother recounted to me about 1929, speculation became rampant. Then as energy prices have increased over the past 6years an extra 5 to 10 percent “tax” has been added to our economy, and that much of the surplus wealth disappeared. Speculation was no longer desirable or possible as everyone was tightening their belt because of increased energy costs. This may or may not be accurate and it certainly is not a sufficient explanation by itself sufficient (we would have to add in the failure of Allen Greenspan etc to do their regulatory job) but two of my energy-savvy financial friends say “that just about captures it”. In systems theory language: the endogenous aspects of the economy, that the economists focus on (Fed rates, money supply etc.) became beholden to exogenous forcing functions that are not part of their training.
9) As shown in our paper in press on investments, markets DO NOT resolve the oil and gas issue. Historically, when scarcity occurs (1970s, now) drilling rates increase BUT THERE IS NO INCREASE IN FINDING/PRODUCTION RATES. We just waste more money/energy drilling foolishly. EROI gives better information on this than does markets. There are many other examples.
Short notes:
a) My eyeball tells me that Gail’s prices are more or less ranked inversely in order of EROI.
b) It would be good to do: “food chain” analyses for energy from the mine mouth to the use, “efficiency balloons” etc Good ideas. As noted I have said since 1975 that efficiency (i.e. insulation) is the best investment, but that is not what I am doing here. Hope someone wants to do that. Or find me the money and I shall get students to sweat it out. Not my thing. Anyone who thinks I am a tool of industry certainly does not know me.
c) Efficiency has been improving, but so has energy use per household. Efficiency is in a constant race with depletion, and the empirical result is that it seems that depletion (and increased consumption and Jevon’s paradox) is winning. Efficiency increases have not resulted in energy saved overall. Mario Giampietro et al. have a new book on Jevon’s paradox.
d) As I said in my original post I am not in a position to judge the nuclear claims one way or another. Maybe someone more knowledgeable than I can pull this together. Sorry to offend with my misinterpretation of the French nuclear cycle (given with appropriate wiggle words I would say) but I think that the final rendition, such as I can interpret from the postings, indicate that maybe I was not too far off. (I think, arguments are hard to follow). I have promoted for many years the Carlos Rubia’s possibility of a cyclotron-triggered thorium reactor, but no one has stepped forward to build it. Why? To the pro nuckies: if you are so smart why aren’t you rich? And have you looked into the plumbing costs at Chalk River or the investment balance sheets of Clinch River or Super Phoenix lately? Nice ideas, but let’s analyze them when/if they are operational. I appreciate the web sites and I will see what I can get from them. Maybe nuclear energy surplus is much higher, maybe not. We need a good analysis by someone good with no preconceived position. As for fusion, Karl Ekdahl showed me fusion, or something like it, at Cornell in 1970 when commercial fusion was 30 years away. Now it is 40 years away. Do the math…?
Renoir said of his paintings “If you don’t like them, don’t look at them”. Until the EROI police come and make our national energy decisions based on EROI then I think that those who wish to try to undertake and refine these methods, get better data, and undertake sensitivity analysis on the results should not be so bothersome to those who seem so exercised by their attempts. But that is just my opinion. I end with the last posting I saw (at 198) by clifman. Hey, that’s the basic issue!
Thx for the hat tip, Doc. As much as I have harped at times here at TOD about the importance of us grokking EROEI and the implications thereof, it wasn't until I worked through that last post that the order of magnitude issue occurred to me. We basically began a century ago with a resource that provided us with a 10,000% return. We exploded in population, infrastructure and wealth (as measured by economists) based upon that return. As the millennium turned, we were operating said infrastructure and population on about a 1,000% return (very roughly speaking here, of course). Of course most people are oblivious to the imminent decline of oil extraction, nat. gas extraction on this continent, and perhaps coal not far behind (decades, rather than the centuries that get bandied about). But even among those of us who see peak oil and all that it means, too few seem to recognize the bounty that ff's have been with respect to anything that is proposed to take their place. That we are debating among alternatives that appear to have in the neighborhood of a 100% return, two orders of magnitude less than the resource with which we built and populated our industrial economy, appears to me to be a bit of a major issue, to put it mildly. Inverting those percent returns gives me this very rough approximation of the portion of human activity that must go toward procuring the energy which then allows for all other activity - at 100:1 return, about 0.1% (one-tenth of one percent) spent on energy procurement, at 10:1 return, about 1% of activity required for procurement, at 2:1 return, 10% of society must work solely to procure more energy. From there, as we approach unity, we approach 100% of all effort going toward acquiring more energy. Of course there won't be anything like a society or civilization down at that 2:1 or 1:1 level. As you point out, once the trout has to spend all its effort just to feed itself, the trout population does not perpetuate. So where are we on this negative parabola? (hope I have that right, I'm not a math nor physics guy) I look forward to learning some defensible numbers regarding the EROEI of crude and its potential replacements.
After three decades of having folks confuse the distinction between net energy and economic analysis I started using the term Energy Returned on Energy Invested, or EROEI, rather than Energy Return on Investment or EREI, which economists tend to interpret as energy returned on money invested.
It did not make a whole lot of difference, but at least I knew I was sending an accurate message.
The problem is that net energy analysis gets in the way of what a whole lot of people "want" to do, as opposed to knowing what they actually can do that will best serve their interests.
Tom Robertson, Moderator, EnergyResources Group
"Here's hoping that we can gain some insight as to just where we are regarding EROEI of conventional and alternative sources through this collective process, rather than merely debating the usefulness of EROEI as a metric." - clifman
As an undergraduate student only just beginning to wade into the pernicious implications peak oil (and indeed the peaks of all non-renewable resources) stands to hold for modern society, I have found the concept of ERoEI to be among the most (if not the most) important facet of the issue when discussing potential solutions. Accordingly, and in the modest amount of time I’ve been keeping up with TOD, I can’t help but find it somewhat puzzling that articles bearing titles such as this (Why EROI Matters) are still necessary. It appears somewhat elementary that faced with an energy shortage, the amount of energy we must consume to produce the energy we require to maintain the status quo (also clearly part of the problem) in general consumption figures would be of the utmost importance. This idea would then appear doubly important if such a ratio were noted to be slipping (less energy returned on more energy invested), which by most accounts it appears to be. All of this is of course to say nothing of the fact that as this ratio declines (in the sense just mentioned), the global demand for oil is rising, thus considerably compounding the problem. As the cited except from Clifman notes, and as this series aims to achieve, the most salient aspect of the ERoEI concept is its usefulness in gauging the feasibility of post-fossil fuel alternatives. Indeed, if I’ve correctly understood the research, it has already made considerable headway in exposing current biofuel practices as exercises in futility insofar as reasonable alternatives are concerned (to say nothing of their broader social implications). I suppose I figured that the indispensability of this metric tool would stand as something of a given at this stage in the game. Am I missing an obvious reason for foot-dragging?
Also, I suppose that I have one more issue with the title of this article. Is it not somewhat misleading (especially for those who may be unacquainted with the concept) to drop the second ‘E’ in the acronym? After all, is it not the energy part of the equation we’re most concerned with? This notion would lose much of its significance if we were to substitute other inputs into the equation (capital for instance), would it not?
There are billions of dollars of biofuel subsidies that are threatened by these studies. They don't want a careful accounting. Like money exchanged over a counter, both sides need to count carefully.
As an ordinary citizen, I sense intuitively that the EROI (or EROEI) is linked to the cost of producing energy : the higher EROI, the lower production cost. I also sense that the average cost of producing a definite amount of energy will increase in the future, thus slowing energy production growth (knowing that fast growth is greatly linked to energy produced at low cost) and in this way reducing the investment capabilities of increasing the world annual energy production. At some point in the future a threshold will be passed beyond which those capabilities will vanish. We will then reach (or will have reached) the energy-production peak. What average value of EROEI corresponds to this threshold ? I have no idea but I sense it works this way. Are there any studies about it ?