| Saudis announce oil production increases...again...and again...and again... | The Oil Drum | Australia’s Oil-Based Energy Security |
The devil is in the production details of Saudi Arabia
Posted by Rembrandt on June 23, 2008 - 9:30am
Yesterday we have heard announcements by Ali-Naimi, the oil minister of Saudi Arabia, regarding future production capacity increments. We are to believe that Saudi Arabia will produce 12.5 million barrels per day at the end of 2009 and a potential 15 million barrels per day in the coming decade. How should such announcements be valued? Is this achievable? What is meant with production capacity? What type of liquids is Saudi Arabia referring to when talking about oil? In this post I attempt to answer these questions.

Setting the analytical scene - production capacity vs production and crude oil versus all liquids
When Saudi Arabia announces production targets it isn't using a clear cut definition of oil. Saudi Arabia produces two groups of hydrocarbons: crude oil and natural gas liquids. Natural Gas Liquids (NGL) are a group of hydrocarbons that fall between natural gas and oil - which consist amongst others of ethane (C2H6), propane (C3H8) and butane (C4H10).
The important difference is that crude oil can be refined into gasoline, diesel and kerosene while NGL's cannot. These are mainly used as feedstock for the chemical industry. Therefore when Saudi Arabia increases crude oil it can influence oil markets heavily, but if it increases NGL's the impact is much smaller. Point one to watch for is therefore whether production announcements refer to crude oil or to all liquids.
A second point is that the country always talks about production capacity. It is not very clear whether actual production or production plus spare capacity is meant. Spare capacity is additional capacity that can be brought online within 90 days in case of an emergency (e.g when the US or Israel attacks Iran). The US Energy Information Administration and OECD International Energy Agency think that spare capacity of Saudi Arabia amounts to 1.5 to 2 million barrels per day. Whether this is the case or not is of course debatable, but for analysis of production it is less interesting.
Current Production of crude oil and Natural Gas Liquids
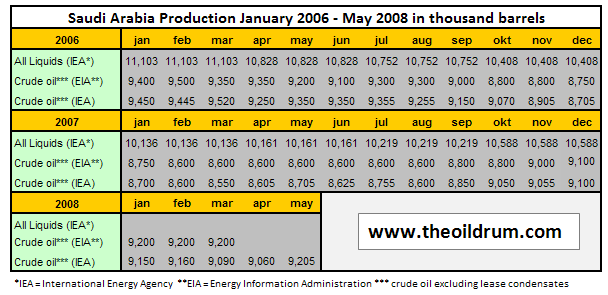
As shown in figure one, Saudi Arabia has not produced more than 9.5 million barrels per day of crude oil in recent years. In fact the last time Saudi Arabia produced more was 1981 when production briefly reached 9.65 million barrels per day.
The latest high of all Liquids production was 11.10 million barrels per day in the first quarter of 2006. We can establish from production data sources that last known production of total liquids was 10.58 million barrels per day in the 4th quarter of 2007 and last known crude oil production was 9.2 million barrels per day in may 2008.
Crude oil and Liquids production of Saudi Arabia up to 2011
In 2005 Saudi Arabia announced that it wanted to reach a total liquids production capacity of 12.5 million barrels per day. Total investment done by Saudi Arabia to achieve this is 80 billion dollars, including necessary refinery infrastructure for heavy crudes, oil and gas separation facilities, pipelines and more. The production plans are as follows:
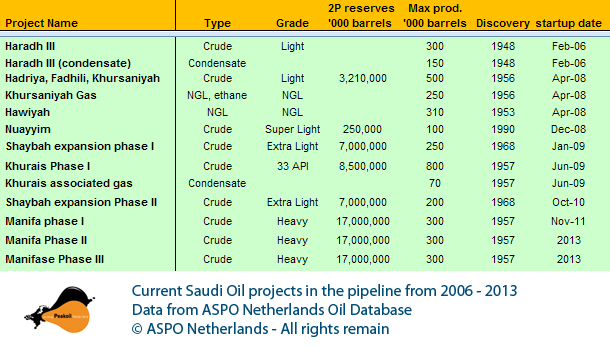
So far Haradh III, Hadriya, Fadhili, Khursaniyah and Hawiyah have come onstream. Khursaniyah faced a project delay of 5 months. The project was originally scheduled for December 2007 but the plant that would separate the associated gas from the oil was completed much later. Production finally began on 22 april of 2008. These projects have so far not led to increases in production. On the contrary, production declined in the course of 2006. Perhaps due to heavy declines in the country from aging fields. Economist James Hamilton from Econbrowser also offers a different explanation worth reading. Namely that lower production levels would have been in the economic interest of the Saudi's due to the price-elasticity of petroleum demand in recent years.
But now the tide is turning. Saudi Arabia announced in May that it would increase crude oil production by 300,000 b/d to a level of 9.45 million b/d in June. Last week another production increment of 200,000 b/d to 9.7 million b/d of crude production was announced. This would take all liquids production of the kingdom to approximately 11.2 million barrels per day by July. This production increment is in all likelihood coming from the Khursaniyah oil field project that came on-stream in April. Because the additional production amounts to 500,000 b/d of light crude which is a similar amount as the announced production increments.
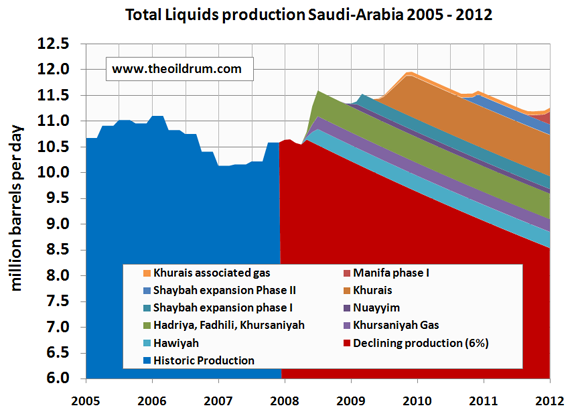
To see what will happen to Saudi crude oil and all liquids production up to January 2012 I have plotted monthly production figures from the investment program as per table 2 on top of expected future production from current oil fields. The latter is very difficult to forecast because no one has good data on decline rates for Saudi oil fields except the Saudi's themselves. Some Saudi statements were made in the press in the last few years about their decline. At one moment stating that annual decline that needs to be compensated is 700,000 b/d, at another moment talking about an 8% gross decline which thanks to infill drilling in current fields can be maintained at 2% annually. For purposes of giving a potential range of future production I have made two scenarios. One with a decline rate of 3%, the other with a decline rate of 6%:
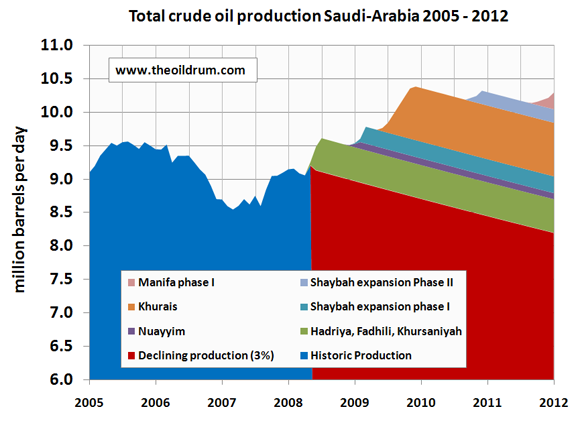
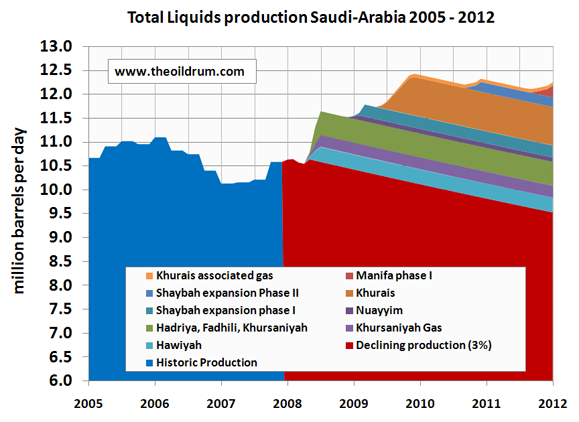
Production in the case of a 3% decline rate:
- Crude oil production reaches around 10.4 million b/d at the end of 2009.
- Total Liquids production reaches around 12.4 million b/d at the end of 2009.
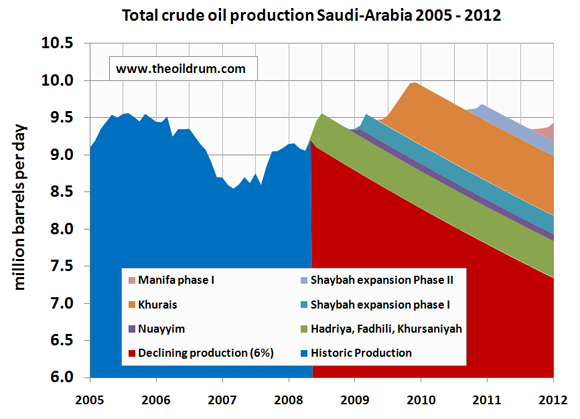
Production in the case of a 6% decline rate:
- Crude oil production reaches around 10 million b/d at the end of 2009.
- Total Liquids production reaches around 12 million b/d at the end of 2009.
What we can conclude is that production of all liquids could reach 12.5 million b/d. But only if decline rates in currently producing fields are at a rate of 3% or lower and if all announced projects will come online on schedule. Especially the Khurais fields is of high importance given that it is supposed to increase production by 1.2 million b/d. In his thought provoking book about the oil fields of Saudi Arabia, Twilight in the Desert, Matthew Simmons describes that the history of the Khurais field has been one of erratic production during the 1970s and 1980s. At maximum the field produced only 144,000 b/d in 1981 and a gas reinjection well program that started in 1983 didn't deliver much improvement. The field was mothballed not long after but is now back on the table for production to start around June 2009. Will the Saudi's succeed in unlocking Khurais full potential?
Production beyond 2011 - reaching 13.5 million b/d in 2015?
After Saudi oil minister Ali-Naimi spoke about the Saudi production targets at the Jeddah oil summit last sunday, he also mentioned that Saudi Arabia can if necessary produce an additional 2.5 million barrels per day:
"Saudi Arabia will increase production capacity to 12.5 million barrels a day of oil by the end of next year and could add a further 2.5 million barrels a day if needed, from some new giant fields, Naimi said.
``The Saudi announcement of a possible increase in capacity to 15 million barrels a day is a robust statement; it would be a huge increase,'' ENI SpA Chief Executive Officer Paolo Scaroni said in an interview in Jeddah today. ``The world is worried about the shortage in spare capacity and any improvement will change this sentiment.''
The further daily capacity includes 900,000 barrels from the Zuluf field, 700,000 barrels from Safaniyah, 300,000 barrels from Berri, 300,000 barrels from Khurais and 250,000 barrels from Shaybah, Naimi said. (Bloomberg)
Todays announcements sound nice, but are these new investment programs feasible? Zuluf, Safaniyah and Berri are all three old fields that have been producing for a very long time. It doesn't appear too likely that such high production increments will come to pass. Below are some excerpts from Twilight in the Desert about these three fields:
"The fifth Super- Giant: the zuluf oilfield - Zuluf is the northernmost offshore oilfield and Saudi Arabia's fifth super-giant. The average water depth at Zuluf is 118 feet. The field was discovered in 1965 and started production in 1973. Thirty years later, the field's production still comes primarily from its Khafji reservoir, a sandstone formation that generally consists of two production horizons, the Khafji main sand and the upper Khafji stringer. Periodic reports hint that Zuluf's production is around 400,000 to 500,000 barrels a day. Zuluf was the last great Saudi Arabian field to reaach oil production in the half-million-barrels-per-day range. By 2004, the field had clearly become very mature and was exhibiting an array of aging problems that will tend to get worse over time."
"Zuluf's Khafji reservoir has now developed a gas cap overlaying the oil in both the field's stringers and its main sand. In some areas of this field, the reservoir pressure has fallen to its bubble point, and gas encroachment is starting to limit oil flows in some wells. According to this paper [2001 SPE paper], this gas problem can be adressed most effectively by increasing the duration and frequency of all Zuluf well tests so the problem can be spotted before it becomes sever. The problem can then be mitigated by decreasing the well's output. The problem can also be countered by cementing the wellbore and sidetracking a new well at a deeper level further from the gas. But as was the case with the Safaniya oilfield, a shortage of barges needed to perform the well tests has actually led to a decrease in testing instead of an increase."
"A 2004 SPE paper of Zuluf reported that there were now 270 producing wells in the field. It described the main Khafji sands as being 200 to 300 feet thick, but current drilling is taking place in the thin upper khafji stringer. The good news is that these tiny pockets of oil have never been exploited, Until advanced technology wells were available, the oil was uncommercial." M. Simmons, 2005, Twilight in the Desert, page 201 - 203, Wiley, ISBN: 0-471-73876-x
"The Safaniya oilfield: "Queen of Sand" Safaniya was discovered just off the coast of the Arabian Peninsula in 1951 about 125 miles north of Dharan. The primary producing reservoir is the Safaniya, a Cretaceous sand in the Wasia formation. Safaniya is not only Saudi Arabia's second most productive oilfield, it is also the world's largest offshore oilfield...It was brought into production in 1957 at about 25,000 barrels per day. So far, after a half-century of production, almost all of Safaniya's oil still comes from the Safaniya formation reservoirs. By 1993, there were a total of 624 wells in the field. When Saudi Arabia's oil production peaked in 1980-1981, Safaniya was producing over 1.5 million barrels of oil per day. Today, the field still apparently produces around 600,000 barrels per day. Safaniya is Saudi Arabia's primary supplier of heavy oil (with an average API gravity of 27 degrees)... By the end of 2004, the only apparent spare production capacity in the kingdom consisted of heavy oil. A high percentage of this capacity probably draws from the remaining oil left in Safaniya."
"Safaniya's oil wells produced almost water-free oil until the late 1980's according to a 1988 SPE report, which said, "Until recently, production problems like wet crude, sand production, lack of reservoir energy, etc., had been relatively minor issues." By 1998, technical papers addressing issues at Safaniya began describing the field as reaching a mature state of depletion... A 1999 SPE paper presented the findings from the first full-scale 3D field model of Safaniya. The modeling objective was to more accurately predict the future production performance of the overall reservoir, the performance of individual wells with regard to water coning, the scope and rate of water encroachment, and the volumetric waterflood sweep efficiency. This modeling also began to address why much of Safaniya's oil was being bypassed due to water encroachment. The paper shed light on the timing and the number of additional infill or development wells that would be needed as the field is depleted, and it identified areas of this great field that would have to be switched from free-flowing wells to artificial lift. This change does not mean that Safaniya's oil flow will end, but it does signal a step-wise increase in costs."
"Since Safaniya never produced more than just over 1.5 million barrels a day and last did this almost 25 years ago, the chances that output of that level could be achieved again and sustained for any length of time must be considered remote." M. Simmons, 2005, Twilight in the Desert, page 187 - 191, Wiley, ISBN: 0-471-73876-x
" The Berri oilfield: "A Watery Prince" Berri was discovered in 1964 with oil bearing reservoirs in the Arab A,B, and C zones beneath the onshore part of the field. Sadly, these reservoirs have never been productive. The significant reservoirs that have provided all of Berri's commercial output are offshore: Hanifa, Hadriya and Fadhili. All were found in 1967."
"Following production startup, the high initial reservoir pressure went into rapid decline, falling from almost 4,000 psi in 1970 to 2,600 in 1973. At this rate of descent, the reservoir would have reached bubble-point pressure within two years. To prevent this, a peripheral water-injection program was begun in 1975. The water-injection program enabled a significant increase in production at Berri:
- Prior to water injection, Berri produced 155,000 barrels a day in 1971 and 300,000 in 1972.
- After water injection began, production rose to 800,000 barrels a day in 1976.In 1977, less than two years after the start of the injection program, water began to break through in the first row of producing wells nearest the flood front. Initially, the completions in the wet zone were plugged off, and the wells were recompleted in drier zones higher up the wellbore. A moderate amount of water production could be tolerated in each well once wet crude handling facilities were installed at the Berri Gas & Oil Separating Plant (GOSP). For some time thereafter, the typical water cuts stayed around 20 percent, although the flood front was advancing rapidly to the crestal area. The available record of Berri's production history contains the following benchmarks:
- In 1976, Berri's output peaked at 800,000 barrels per day and then began to decline rapidly.
- By 1981, when Saudi Arabia's overall oil output peaked, Berri's production had already fallen by 30 percent.
- By 1990, 25 percent of Berri's producing wells had totally watered out, choking off the oil flow and forcing Saudi Aramco to shut in the wells.""Reservoir and production experts working this once great field assume that large amounts of bypassed oil are present in the middle and lower parts of the Hadriya; but even with modern oilfield technology, recovering these remaining oil deposits is expensive, and the oil flows rarely approach those of the oil wells before they water out. Aramco had always believed that the Fadhili reservoir, lying below the Hadriya rocks, was not commercially exploitable. But in 2000 Saudi Aramco technicians began reevaluating whether it might now be economical to drill and produce this lesser-quality reservoir as Berri's prime producing areas deplete."M. Simmons, 2005, Twilight in the Desert, page 192 - 197, Wiley, ISBN: 0-471-73876-x
Contact
- Content: editors at theoildrum dot com
- Tech support: support at theoildrum dot com
License

This work is licensed under a Creative Commons Attribution-Share Alike 3.0 United States License.
Fascinating charts! I played around a bit with the 2008 Megaprojects data and created a pair of timetables of projects in order of startup; would like to see more graphic representations of this stuff, whether in the Wiki pages or here.
Have been parsing the po.com thread on Saudi Production; our member rockdoc123 had strong criticisms (such as in this post) of Simmons for using the SPE papers to only show the possibly negative aspects of Saudi Armaco's work, while ignoring anything that indicated they were successfully dealing with problems. Has anything more come to light in the SPE papers since Twilight was published showing evidence either way? Joules occasionally makes reference to them but I don't recall seeing much in other contributors' work here.
Too bad the graphs don't include export graphs ...
It would seem that 'successfully' dealing with a given problem just means that you have to deal with the same problem further down the track, and potentially with other problems concurrently.
Then we must subtract likely Saudi internal consumption to arrive at net exports. I'm sure expert westexas will provide those projected numbers.
westexas provided this link regarding Saudi Net Exports and the related internal consumption amount. From 2006-07--the latest data--net exports dropped 600Kbd, a little more than 7%, while internal consumption rose a little more than 8%.
It's probably non-trivial to get, but it would also be interesting to see the Production and domestic KSA consumption data for Arabian heavy vs Arabian light as a function of time (perhaps even including condensates/NGL).
The price difference alone between Arabian light and Arabian heavy tells us very little, I'm afraid.

If most of the upcoming production for the next year or so is of light or very light category (ref: table 2), then that is slightly promising, fwiw. Unless of course, most of it were to be consumed domestically within the KSA (?).
However, almost everything in the table after 2009 is heavy crude, the stuff that isn't going down so well with the buyers/refineries these days, if I'm not mistaken.
What have been the near-to-mid term historical trends of Arabian Heavy vs Arabian Light production/domestic consumption? Anybody have old guesstimate data on these?
I found the price information in Jerome's article of interest. Saudi is not offering a discount for their heavy or sour as one might expect.
I actually wouldn't expect them to increase their discounts. Why would they undercut the competition, when there is no competition?
A guy goes to the butchers to buy a chicken...
"How much for a chicken?"
"$4 each" says the butcher.
"But they are only $1 at the supermarket"
"Why not go to the supermarket then?"
"Because they are sold out"
"Sir, when I am out of stock, my chickens are also $1 each".
Hello.
I read about the IPSA line yesterday (Iraq-SA). It's a intersting theory, and could of course be used to mask the SA decline (politics).
From: http://www.theoildrum.com/node/4200
>
>Nate Hagens on June 22, 2008 - 7:38pm
>
>How easy would it be for some hundreds of thousands of barrels that originally are
>pumped from Iraq to end up counted as 'a production increase' from KSA? I know
>there was a conspiracy as such a year or so ago, given that much of the exported
>oil from both countries flows through the same pipelines, though I don't have the >source.
>
>Great story, Paul Chefurka-
> http://www.paulchefurka.ca/Iraq%20and%20Saudi%20Arabia.html
>
>
>"In Locked Down Iraq, Oil Still Flows Unmetered While Questions Run in Circles"
> http://www.innercitypress.com/icg022406.html
>From today's post:
>"Saudi Arabia will increase production capacity to 12.5 million barrels a day of >oil by the end of next year and could add a further 2.5 million barrels a day if >needed, from some new giant fields, Naimi said.
2.5 million barrels if needed, from some "new" giant fields...
Well, the IPSA line was originally designed for 1,65 MBD but it could have been upgraded to about 2,7 MBD using DRA (Drag Reducing Agent) and new higher hp pumps so maybe, just maybe, the 2.5MBD from some "new" fields, could come from some "old" giant fields in Iraq...
See p20, in the report from Baker Energy Forum:
http://www.rice.edu/energy/publications/docs/TrendsinMiddleEast_Alternat...
If this is the case, could some production be counted twice?
Very difficult, not to mention head-scratchingly improbable.
Of the recent 2Mb/d exported, about 0.5Mb/d goes from the north to Turkey and 1.5Mb/d of the remainder is taken out of Basra by tanker. Those tankers are tracked (there were 29 in May, according to Platts), meaning it would be very difficult to secretly send that oil elsewhere.
Occam's Razor - the idea that explanations with fewer assumptions tend to be better - is a useful heuristic to apply in cases like these. In this case, the simplest explanation is probably that the Iraqi and Saudi oil numbers are, boringly enough, just what they say they are.
Apparently you'd be able to tell the difference between Iraqi Oil and KSA Oil when you did a lab analysis on it (if anyone was indeed looking).
METHANOL, ETHANOL, THE NGL'S, PLUG HYBRIDS AND AN INTEGRATED FUTURE
THE DESIGN OF TRANSPORT FUEL IN THE COMING DECADE
This year the Methanol Institute is holding the 6th annual methanol forum in November, in Dubai, UAE
http://www.methanol.org/
This seems somehow very fitting and speaks to the rising status of Persian Gulf nations in the pecking order, and to the influence they now wield in deciding the future of the energy industry. Of the prior 5 methanol forums, 4 had been held in Houston and 1 in Toronto.
The rise of NGL’s, or Natural Gas Liquids, ties into the subject of methanol in a fascinating way, and may point the way forward as an indicator of the coming structure of the fossil fuel industry, in particular as it relates to transportation fuel.
Rembrandt defines NGL’s thusly:
“Natural Gas Liquids (NGL) are a group of hydrocarbons that fall between natural gas and oil - which consist amongst others of ethane (C2H6), propane (C3H8) and butane (C4H10).”
“The important difference is that crude oil can be refined into gasoline, diesel and kerosene while NGL's cannot. These are mainly used as feedstock for the chemical industry.”
Methanol is “a chemical compound with chemical formula CH3OH (often abbreviated MeOH). It is the simplest alcohol, and is a light, volatile, colourless, flammable, poisonous liquid with a distinctive odor that is somewhat milder and sweeter than ethanol (ethyl alcohol)” http://en.wikipedia.org/wiki/Methanol
The family resemblance of the NGL’s and methanol can be easily recognized, and the chemical reactions using natural gas and other light petroleum to create methanol are shown on down the page linked above on Wikipedia. Methanol can also be synthesized using methane contributed from waste recapture.
Methanol can be blended with ethanol in flex fuel type vehicles and blended with gasoline, although like ethanol, it’s corrosive nature creates a need for caution in the design of the engine and fuel system.
In the time period of 2010 to 2012 the automotive industry will begin to deliver the first generation of plug hybrid vehicles. The Chevy Volt is the most well known, but a variety of plug hybrid sedans and SUV’s and light trucks will be finding their way into the marketplace.
When combined with flex fuel vehicles that can consume alcohol, in either methanol, ethanol, or butanol blends, the amount of conventional gasoline needed to propel American vehicles will decline, with the rate of decline determined only by the turnover of the vehicle fleet. Since more and more vehicles will come with such drive trains, the American consumer will come to accept them in much the way we now accept emission control systems, as just part of the package. Due to the plug hybrid aspect of vehicles, the electric power grid will begin to provide more and more of a percentage of transportation energy requirements.
It is demonstrable by calculation that ethanol alone cannot possibly provide for a very large percentage of liquid fuel need for transportation. Ethanol production is already dislocating prices on natural gas and food, and if we attempt to raise ethanol production from food crops more, these dislocations will only get worse. The recent floods in the U.S., rapidly rising prices of natural gas and world grain demand has driven the costs of inputs to produce ethanol to astounding levels. We may very well reach peak ethanol long before we reach peak oil.
Given the scenario described above, the NGL’s will become a more and more important part of the transportation fuel mix. Methanol from NGL’s can offer a much needed relief valve. Combined with electric grid power, we see the next step in transportation fuels taking shape, and we see the developments being guided and encouraged by all the major power players. The GM flex fuel program, the ethanol program (love it or hate it, we will have a sunk cost in the ethanol effort for some time) the emerging NGL and methanol industry, and the plug hybrid program endorsed by the electric power utilities and advanced battery makers will actually be a system that can be integrated into a much a more efficient transportation system than has been seen to this date.
Even given the oil production declines envisioned by Rembrandt in the charts he sources, we can see the transportation fuel developments forming that will lead us through the next 15 years or so IF we are able to take advantage of the emerging NGL industry and the coming plug hybrid efficiencies.
To again quote Wikipedia, “ In 2005, California's Governor, Arnold Schwarzenegger, terminated the use of methanol after 25 years and 200,000,000 miles of success, to join the expanding use of ethanol driven by producers of corn. In spite of this, he was optimistic about the future of the program, claiming "it will be back."
It is to be recalled that of all world oil consumption the amount that is used to provide gasoline for American vehicles is only about 10% of the total (this leaves aside Diesel). The U.S. will become a smaller and smaller percentage of the world market for gasoline (and crude oil in general) as the developing Asian markets will grow in crude oil consumption. But we must assume that they will implement the same efficiency adjustments that are being made in the U.S., Europe and Japan, and current projections of crude oil (and particularly gasoline) demand may not materialize in nearly the volume that have been predicted.
Major transitions are beginning to take shape. If Europe, Japan, the U.S. and the rapidly developing nations would make efforts to coordinate activity and openly communicate knowledge and research, we can make the transitions far less painful and expensive than they could otherwise be. One of the first things I ever heard Matthew Simmons say that impressed me greatly was that we should not argue one type of energy production against the other (such as renewable vs. fossil). We would need them all.
Thank you
Rcoger Conner Jr
RC
If you've got a clean, cool supply of CO2, say from an ethanol facility, it is pretty easy to synthesize MeOH (or more EtOH) if you've got hydrogen available. Room temperature one atmosphere CO2 is easily captured and stored, while the harder to handle hydrogen can be generated from wind when conditions are right. Given a little capital investment you can manage $2/gallon MeOH and the market is $4/gallon right now.
If you grind and boil the corn feedstock for the ethanol plant in the ethanol itself you can extract about six gallons of oil for every hundred gallons of ethanol produced. Biodiesel is about 10% methanol by volume. Corn production diesel numbers are all over the board but it would appear that this amount is sufficient to handle all phases of crop production.
Now if only there were a way to make ammonia using wind power :-) We got some interest in this when prices were $700/ton ... and what I heard late last week is that it's now $1,200/ton, and I find myself called away to another meeting that might lead to development funds. I'm glad things are so serious that folks are starting to take the renewable options seriously ... I just worry we're over that stinky ol' remediation event horizon, where we don't have the energy to build the replacements.
Work on this is underway at the University of Minnesota:
See Fertilizer from Wind.
And I can dial the phone number of the owner of that blog from memory :-)
http://strandedwind.org/FAQ
Every auto and engine manufacturer I know of says to NOT use methanol in their engines; if you do, you void the warranty.
I'm not a chemist but I'd suspect the tiny molecule might be a wee bit hard on the various gaskets in the system. I'm having no joy with Google but as I recall there was an Icelandic fishing boat that got converted to MeOH as a proof of concept; lots of CO2 and cheap electricity is available there, whilst diesel is hard to come by ...
First of all everyone should know that Rembrandt was up till 3 am to complete this post - so please spread the word using the "Share This" option.
Rembrandt - a great summary - with simple clear charts - maybe a little too simple though.
The way Saudi Supergiants work is that only a small part of the field is developed and produced at any one time. Once these wells start to decline they simply drive up the road and drill some new wells which allows them to maintain a production plateau for a very long time - that is until they reach the end of the road, i.e. no more dry oil to drill in any given structure. Thus applying decline rates in the traditional way is a simplification in Saudi.
Interesting though that your models are broadly similar to this one I produced last year (apologies for posting this yet again)
The reason for doing so is to highlight the rapid decline modeled for Ghawar - which essentially shows the whole of the prolific N end of the field watering out in the years ahead as I described here and Stuart described here.
The fact that Saudi are now struggling to raise their production suggests we may have got this broadly correct.
The main point is that looking to the future, it is likely that Saudi production declines in steps as their supergiants die, and not in a simple uniform way - very hard to model I know. I suspect your 3% declines are likely closest to reality.
On heavy sour crude from Zaluf, Marjan and Safaniyah
Safaniyah at least is a supergiant that has never been produced at anything close to capacity, and so once the refining capacity is in place they will be able to ramp production significantly from these huge fields.
I found this comment by Brown Bear to be highly significant:
The Wiki entry for the Reliance refinery in Jamnagar points to a 600,000 bpd expansion due on line this year.
http://en.wikipedia.org/wiki/Jamnagar_Refinery
And some general orientation slides:
Base map from Simmons "Twilight in the Desert". Note the discovered undeveloped resource.
Estimates for reserves (initial) in Saudi Fields. From this presentation.
Thanks to Rembrandt et al. for an other detailed thread.
Talking of Heavy sour oil supply, I volunteer some related questions :-)
What is the present refinery capacity for sour crude and the projected increases in capacity? India mentioned.I think I have read that China is building refineries for sour crude also?
How do supply/ customers (refineries) match?
Could the Sour oil end up as bunker fuel instead?
regards And1
There's a progress update from April on the company's website.
The expansion is scheduled to come online in December, but apparently the company "expects to complete the refinery ahead of schedule". I would imagine there would be a ramping-up process before the full 0.6Mb/d capacity is reached, effectively counter-balancing early completion to some extent, but that's just a guess on my part.
It's sensibly the same forecast as yours:
It's that Red bit that scares the sh*t out of me... When that one starts to decline The Howling from Washington is going to be met by a wall of scared rabbit eyes...
Nick.
Euan
Duly noted.
Based on the scale there seems to be at least a dozen fields more than 10 kilometres long. How do these fit into the overall forecast.
This is a great video by CNBC's Melissa Francis.
http://www.cnbc.com/id/15840232?video=776398888&play=1
This is a real shocker. Ms. Francis was completely snowed by the Saudis.
Ron Patterson
Talk about drinking the petroleum-based Kool-Aid.
Is Russia and Putin going to have a big confab and media blitz to match Saudi Arabia and the King? They produce 9.9 mbpd (more than Saudi's 9.5) and have in recent years been the twin swing producer, although one gets all the attention and the other is treated like a stepchild. There is a good article here showing why Russia could go a long way to explaining what's happening with oil this year.
Russia had been keeping up with the rise in demand from India and China accounting for fully 80% of the non-OPEC rise. But last October, their production peaked and has declined 2% since. That's just about the same time when the present price climb got under way and when the U.S. inventories broke away from their seasonal patterns to the downside. I wonder if there could be a connection?
The show-off twin may have to increase production more than stated just to offset what's not coming from the other twin, to say nothing of the decline rate of the rest of the world.
The important difference is that crude oil can be refined into gasoline, diesel and kerosene while NGL's cannot.
Actually, butane is blended into gasoline, and isobutane is used in alkylate units to produce high-octane alkylate which is also blended into gasoline. The others can be used as fuel gas in a refinery if economics dictate. So it isn't like NGLs constitute a low-value product.
Even the short-chain hydrocarbons in NGLs - besides being used for fuel gas - can be used to produce syngas, which can then be used for all kinds of useful chemicals.
Outstanding work! thanks for sharing this.
It looks like Saudi Arabia may have not peaked yet depending if they can (or want) to deliver Khurais on time. Anyway, as far as as global supply is concerned it all depends now on how Russia's production will look like in 2010.
Question: did you apply the same resource base decline rate on the new project additions? it's not obvious eyeballing your charts.
If memory serves me correctly, it seems that the OPEC quotas are set only on the basis of crude. Lease condensates (that other "liquids" number) are not counted against the crude oil production quota for each OPEC members. If I also recall correctly, that is why the EIA's IPM shows OPEC values with and without lease condensates.
Mostly, it seems, we are dealing with the C+C value in most of the numbers we kick around here (I know I make that distinction in the analysis and the graphics I produce so that people are clear about what liquid combination I'm talking about). On that basis, the estimate maximum production rate C+C production for the KSA is about 10.4 MMBPD in November 1980.
Here is a compilation of forecasts including a rough estimate of Rembrandt's forecast (crude oil only):
The IEA forecast (2007) does not look so crazy after all. However, it seems that exports won't grow that much if domestic demand remains that strong.
from a layman's POV nothing strikes me as being out of the ball park as far as the bulk of the predictions go. To me it looks as thou we are on course for where we think we were going 2 years ago?
Boris
London
Folks, please help us spread TOD's hard work around. These authors deserve to be heard by as many people as we can drive their way. Hit the "share this" button below or go to digg and reddit and vote up TOD posts. We appreciate it...
http://www.reddit.com/info/6olik/comments/
http://digg.com/business_finance/The_devil_is_in_the_production_details_...
Questions regarding NGLs:
If the increase in production of NGLs is a result of "blowing down the gas cap" on an older field, what does its production curve look like? Would a super-giant field that had a 50 year production history for crude be expected to have a "second life" of 20 years producing NGLs? Does production drop off slowly like crude, or quickly like natural gas? Would a mature field that had produced a billion barrels of crude over its lifetime produce a half-billion barrels of NGLs, or a tenth that much (I'm sure it varies by field, but I'm just looking for an order of magnitude)?
I'm sort of wondering if the increase in the share of NGLs in all liquids production is a short-term blip or a long-term trend.
Sorry Greenman. There's no simple answer. I've been a petroleum geologist for over 30 years. Each field is very unique: different ratio oil/NGL, different NGL yields depending on prodution technique, lot's of gas is stripped of NGL's and is reinjected into the reservoir thus the late ratio NGL is much lower than the original. Even the ratio of each type of NGL in the stream varies greatly. Best advice i can give is don't take specific numbers from one situation and try to project to a larger set of fields.
Some of the Saudi NGL comes from normal associated gas that is produced with oil. They are building a lot of gas process plants where the ethane (C2H6) is extracted from the gas stream - valuable as a feed stock to petrochemicals plants.
Most of the rest of the NGL comes from "dry" gas production from Khuff reservoirs (Devonian) that underly the Jurassic Arab D in Ghawar. Since Saudi discovered they need more nat gas, these reservoirs are now being actively developed.
Ghawar (Arab D) is light years away from gas cap blow down since there are huge amounts of wet oil yet to be recovered from behind the flood front - so long as they maintain pressure above bubble point.
Thank you for posting this detailed presentation.
i have been a reader of this excellent site for a while now, but this is my first post. this is an excellent informative article, and you can learn a lot from the comments. i was thinking about prof. goose's plea to make sure more people know about this site. sadly i gave it a lot of thought, and could not think of 1 person to send this site to. sites like this as far as the average american are on another plane altogether, would require too much thinking. for proof visit a site like human events, where they espouse the mantra "drill now, drill here." but prof. goose i will give it a try. i'm just not too optimistic. everyone keep up the good work!!!
All we can do is try. :) Learn and teach, that's all we're doing. Try to get as many smart people here as possible, dialoguing, trying to find the truth in this morass of shite.
Plus, this is the kind of site you have to come to day by day for a couple of weeks to actually "get..." which is another reason we want to expose as many people as we can.
But thanks for the effort. My colleagues work hard on these posts and to keep this site running (how hard, I am not sure many of you understand...), and they do it for free because they think it's important...that makes them worth working hard for in my book.
I for one have been amazed at how hard the TOD staff works. A dazzling display of graphs, data, informative article links, satellite photos, conjecture, opinion, etc. All very informative, entertaining and specifically oriented to one very important topic: Peak Oil
My hats off to the whole staff!
PG,
I would be happy to help 'boost' the site viewing IF I had an internet connection. As it is I have to drive several miles to my friends in order to use his net connection and I use that limited amount to time to try to keep up with several other sites but TOD is always one I view.
Later if I do get a satellite dish up I will do my part.
Thanks for keeping it going. Its worth the drive(which I will now be making mostly on my Honda Trail 90 at over 100 mpg).
Airdale
new user...testing....3 failed attempts to post so far...fingers xed...testing....testing....
apologies nothing useful..hope to add stuff in future once I learn how to post!!
Forgetting for just one brief moment the incline or decline rate for Saudi oil, let's look at their current revenue from oil alone. Let's use 9.5 mbd x 135 = 1,282,500,000.00 One Billion, two hundred eighty two million, five hundred thousand and 00/100 dollars a day! And for one year: Over 468 billion - almost 1/2 a trillion, which is the amount our country has gone further into debt on average each year Bush has been president (5.4 in 2000 and currently 9.4 in 08 = 4 trillion divided by 8 yrs = 1/2 a trillion a year). Not that there's a direct connection between the two, except we do buy a lot of Saudi oil, but it does put into perspective the amount our Govt. currently borrows to support those three huge tax cuts and two war fronts.
A valid point Cslater...with a minor adjustment. The KSA doesn't get the full price for all it's production...there is a good spread for the sour stuff. But your point is valid and leads to a question: if you had a pile of beans and you started making more money as you had planned but were selling fewer beans what would you do as a smart biz man....try to sell more of your beans now or wait? Not really an easy answer: if you kill my apatite for beans with your high prices I might cut back on my purchases. If enough of us cut back (i.e. recession) you might not even get the original lower price you had planned on.
A simplistic tale for sure. But I would appreciate the group considering the following thought process and comment:
Accept for the moment the simplistic economic model offered below. The consuming world is asking the producers to flow their wells at a higher rate. Given that there is a finite demand for crude on any given month, once those crude buyers have been satisfied, any additional production must go into storage. At a later time this storage could be used to satisfy demand but that volume untilized would reduce the production requirement to satisfy demand by an equal amount. Let's ignore transport volumes, etc, for the moment.
Correct me if I've missed the headline, but has any crude purchaser claimed they have been unable to acquire what they want to buy on any given month? If not, then there is no "need" for additional production from the KSA or anyone else. When there is a call for the KSA to produce more they cannot unless they have additional buyers. And we all know how you get market share in the commodity biz: you sell your product for less than your competitors. The KSA knows this biz plan quit well: that's how oil got down to $10/bbl in 1986. They were continuing to loose market share as other OPEC members kept reducing their bids. When the KSA got tied of maintaining oil prices by reducing their delivery to the market they opened their wells up and we all went out and bought big SUV's and pickups.
Thus it's not important what the KSA's deliverability is at the moment. Down the road, of course, when we reach the point where supply demands are not being meet, then it becomes very critical. Are we not asking the KSA to undercut the prices of other producers so as to take their market share away? The KSA need not produce one more barrel of oil to accomplish this. All they need do is offer their existing production at a price below the other producers. Who would continue buying oil from Nigeria at $130/bbl when they can buy it from the KSA at, let's say, $120/bbl? Very simply, if the KSA put 5 million bbl/day of oil on the market next month would the consumers purchase an additional 5 million bbls/day? I think they would buy the same amount as they had forecast need for. Thus someone would have to shutin 5 millions bbl/day....or quickly build some very big storage tanks.
I've been a petroleum geologist for over 30 years. I know well the relationship between buyer and seller: you pay me what I want (to buy or sell) or I'll go to someone who gives me a better deal. Those who understand the diamond biz get my point for sure: if the diamond exchange in Brussels were to put their surplus inventory out into the market tomorrow wedding rings would drop to $100/carat.
I assume the KSA is watching how the world economy is responding to the new price levels. The high oil prices of the late 70's lead to a worldwide recession that dropped demand and led directly to $10 oil in 1986. I just hope all those Swiss economists on the KSA payroll are watching very closely.
Forgive my ignorance ROCKMAN but you bring up a good point that my need to be explained to people such as myself and others not familiar at all with the oil market.
I know of at least two different ways a market can work. Firstly a certain amount may be made available and ever barrel is bid over - leading always to all orders being filled but at variable prices depending on supply and demand. Alternatively, a price can be set and everyone that wants to buy at that price places their order. If too much is ordered some buyers don't get their oil. Your post implies the latter mechanism is in operation since you are saying that if supply wasn't keeping up with demand orders would not be filled. Is this interpretation correct?
Yes, Saudi has cut back on orders from various customers, but Saudi tends to make such cut backs equal to all its customers over time. The most recent I read of was asian customers not quite getting the amounts ordered. One other point, oil, like other commodities, can be ordered via a longterm bilateral contract that sets price, amount and timeperiod. Futures contracts also provide a situation where it's possible to buy for less than the market price when the contract is to be delivered, which is how Southwest Air was able to hedge its fuel costs. Which segweys into the last aspect--it is possible to buy the finished products through the futures or spot markets at below retail price.
I'm no expert ROCKMAN but I can't see the price of oil falling like diamonds ($100/carat is a huge drop) if the oil supply was increased to greater than demand simply because the suppliers realize they now have the whip hand and won't let the 80's happen again.
IF the supply did become grater than demand due to demand destruction (recession/depression in the West) does anybody here have some good numbers on how much oil could be pulled into Strategic Reserves. I'm thinking the Chinese would use any dips to spend some of their US dollars to fill up the Reserves plus lock in billions of barrels in forward contracts
OT comment:
-when will we see a break point?
- at what point does the behavior change from concerned complacency, from business as usual, to panic?
- when does mass realization hit?
is it $150, $200 or $300?
is it China with $2T, or $3T?
We have three combined crises: food, fuel and finance
Here is one scenario: China now leads ROW. China calls the shots. But they don't want to look big and bad. Public relations is everything, especially at this juncture. Perception of cause and effect will be very important
So: China is waiting for the Olympics to be over. they need calm and good will before that.
Then they may wait for the US elections to be over. no use starting to negotiate with a lame duck who does not "get it"
also, China works on very long cycles. they are in no rush.
So I think when oil is around 200, by year end, we will see some change on multiple fronts:
financial markets
energy markets
political relationships
military positions
The dangerous part is, this will not be lead by US, or of US choosing, it will be the ROW who will decide, and the US will have to agree - the US has no cards to play. Ss the expression goes, "beggars can't be choosers"
this will be some serious dislocation & retrenchment, starting in 09
Who thinks it will get to the stage of the IMF coming to bail out the US. The US defaults on its debts, or the ROW adopts another reserve currency.
So right now we are in the summer calm, the phony war, the summer of 1914. Business as usual
when the break point happens, watch out
BTW,
Front-month WTI passes through $110/barrel for the 2008 average tomorrow (unless, of course, front-month takes a nose-dive and closes below $110/bbl. But then the trading circuit breakers would prevent that from happening.
The average for 2007: $72.41/bbl (spot market was $71.99)
The low for calendar yr 2008 average occurred on 2/8/08 ($92.07)
Passed $100/bbl average for 2008 on 4/18/08.
Go at throttle up!
I don't get what all the fuss is about. My Cornucopian friends over at Daily Tech and 'Junk Science' have assured me that this Peak Oil nonsense is all just a left-wing conspiracy designed to scare us into following their crazy liberal tree-hugger agenda.
http://www.dailytech.com/Despite+Reality+Belief+in+Peak+Oil+Persists/art...
No way God would let his Chosen People (Umerikans) go without cheap, plentiful oil. If/when the time comes, He'll just turn on the abiotic oil spigot. And besides, with the Rapture just around the corner, what does it matter?
Anyhoo, gotta get back to the latest chapter of "Left Behind", sooo engrossing...
From the article:
Guffaaaaw!
Oil has been trending up for a decade now, I sure hope those better, cheaper alternatives arrive sooner rather than later...
Nick.
http://www.business24-7.ae/Articles/2008/6/Pages/06242008_4d3a76cdcbf345...
UAE Business Magazine: Oil set to surge past $150 after divided Jeddah meeting
By Peter Cooper on Tuesday, June 24, 2008
Yes...well, we could all tell this meeting did not turn out at all like what the hosts wanted. KSA, et al., hoped that this meeting would make an immediate effect on the markets this morning.
You shouldn't really watch crude prices the way I do, but there are some interesting patterns when one checks them often throughout the day. WTI went up slowly last night and this morning before the bell, it was up to around $137. Then about 1/2 hour before the bell, it fell like a rock ($3 or so). By the end of the day, it ended up being about where it was 1/2 hour before the morning bell. Someone(-body) was trying to set the morning tone down on crude, but the patient "speculators" waited for the morning tweaking to finish and then went about working it higher. It is a pattern I've seen a lot lately.
I tend to think that the KSA are playing a dangerous game. They don't want the price to go too high and cause a worldwide recession/depression. Yet, they are willing to try a bluff to prove their point that it's not a supply problem. The way the market behaved and will behave hereafter might give them the ammo to declare that the price really isn't due to the supply side. I'm not a betting person, but I'll make an exception and say they won't deliver as promised. Maybe in the short term they can push the fields a little harder than they would prefer, but they will not surpass their 1980 peak period.
If they do somehow prove a lot of us wrong, then they will become the scapegoat some time in the future. That may be inevitable at this point anyhow. However, if they suddenly supply a lot more and can keep it going and growing, they are going to find themselves on the wrong end of a gun because they will end up being demonized for allowing prices to go so high. Eventually the tap WILL slowly decline, then many in the world will declare it payback time. The KSA will need some friendly turf to escape the mobs one day and that's not going to work if they alienate every country. So whatever they do, they need to get the blame off of them.
I agree...KSA is walking a thin line here and they will need friends in the future. Right now, I'm not sure they know who they should really befriend, their neighbors or their long time advocates across the ocean.
Hi WT,
IMHO it doesn't matter too much what they are saying. Remember politicians like to be seen to be "doing something" even if what they are doing is completely useless and a waste of time. They sure will claim to "feel our pain" despite being driven about without having the costs coming out of their wallets. How do you know if a politician is lying, it's when his lips are moving:-)
So we see Congress hauling in the oil "majors" to find out why they aren't producing/refining more and working hard to find the "guilty parties" who are speculating up the prices, "gouging", stopping more drilling...
Back in the Great Depression the bankers were hauled in, in much the same manner and the press was filled with stories of such and such meetings. It didn't do much good though, stocks continued to drop with the occasional rally. Same sort of thing with the credit crunch, subprime...
Even if somehow KSA manage to get more oil out in to the market it will be used up straightaway. For example, my man in China tells me that in a lot of places the government doesn’t limit car ownership. It’s expensive to own a car, but as an example 1,000+ new cars are driven on the roads of BJ every day. Shanghai on the other hand limits the number of cars and auctions license plates on a regular basis, so more sensible car growth and market-priced ownership. For people used to queuing for gas sometimes for hours a little higher price is not going to deter them, they will be pleased to be able to get the fuel. China has the world's largest currency reserves and they're increasing so can easily afford to subsidise fuel for much longer if they want to - and why shouldn't they when the US has such appalling waste?
$250/barrel? Soc Gen has produced the oil burden index which is price/gdp and this shows prices would have to rise to $190 before the burden was the same as in 1980s. So it seems to me we have plenty of room for price increases and demand increases.
mheisler,
I don't follow the world comsumer market. If you do your insight would be interesting. But like the rest of us in the US I see no one shortage of product. No "no gas signs" at the stations, no utility cut backs, no jets grounded for lack of fuel, no maufacturing facilites shut down for lack of fuel, etc , etc. The refiners are keeping inventories very low but that's understandable...who knows when there might be a price drop.
Perhaps our buying power is overwhelming other markets. I see truckers in Spain protesting high diesel prices but not fuel shortages. I see British fisherman protesting high fuel prices but I see no stories of boats sitting at the docks because there is no fuel available.
Again, it is an earnest and honest question: who has seen reports of ready buyers with cash in hand unable to buy the fuel they want?
You're right. Just stories of Fishermen running at a loss and mooring the boats .. permanently ?
http://www.whitbygazette.co.uk/news/Whitby-fishing-industry-in-crisis.41...
Of course, price is where supply meets demand, and oil prices since May, 2007 have increased at about 6% per month. My thesis is that this has been the rate of increase necessary to balance demand against declining net oil exports. And the EIA does show two years of back to back declines in total world net oil exports.
The trend, which began in 2005, is for a smaller number of consumers to pay a higher unit price for a lower volume of exported oil. The market is simply allocating the declining volume of net oil exports to the high bidders.
Exactly Tex,
Granted it's a very simplistic analysis but it goes back to a simple supply/demand balance. It can be described in much more complicated and qualified ways but it doesn't change the bottom line. The really scary point is as PO increases which economies will be the higher bidders for the production stream. And how will winning such a bidding war degrade those economies. And then throw in the non-static nature of such a scenario: winners bidders chnge over time as economies fluctuate.
An imagine where oil prices might go when there are more moneyed buyers than there is supply. This couldn't be a static situation either.
An interesting aspect of this bidding war is the US gov. doesn't bid directly for crude. The SPR was filled largely by royalty payments in kind, and any further purchases congress nixed. The USG does bid for finished product, with the military using about 300Kbd of various products, and the remainder bidding for about 45Kbd. The combined states also bid for products, but I have no data on that amount. Otherwise, all the bidding is done by IOC's who have zero responsibility to look after the interest of the American citizen when it comes to fuel supply and price--Charge whatever the market will bear is the Mantra. Imagine a situation like that existing in China whereby refiners are forced to sell product at a loss; How many refiners would stay in business in America? Domesticly produced oil and its products could be sold for much less and still make a profit. Where's the pressure from congress or Bush to force Little Oil to lower its prices or threats of anti-trust action? Is it: Our people can collude and make obscene profits but they cannot? Polls report 70%+ of folks expect gas to break $5 soon. The public must be given some credit for understanding even if they are ignorant of Peak Oil Theory.
The problem of course is that costs are going up in tandem with prices, and the US is a high cost producing area. So any price controls on US production would accelerate the decline in US oil & gas production. No refiner wants to pay $138 for oil. They only pay it because they have to.
The truly scary thing is that I don't see the net export decline stabilizing.
Yeah, and that's why I posted the info on the newly emplaced, massive steel tariffs, as it proves the USG's impeding the ability of companies to do business and do it at a lesser cost. F'n Bush says Drill, Drill, Drill, while making the pipe needed to drill 600%+ more expensive or even impossible to get.
There have been major shortages in China for a while. The Chinese government is trying to keep it under wraps, but my sources in manufacturing have been telling me about it. There are some shortages in India too, though the reasons are different from my understanding.
PG and et al, I did Share This. Digg and Delicious are good resources. You are already listed in the sponsored ads section on Google which is good too. This site isn't for the average person though. Now if we created a Flash based game and called it "Oil Boogey Men Hunt" (something similar to Gold Miner on Modemhelp.net), it might get a million hits within a week. That's the nature of the world full of sheep that we live in. Sad but good thing is it would probably pay off...
The big problem I see is not lack of information or lack of community, instead it's the technical nature of the subject. As for me, I've posted the site's address on CNN.com in some threads in the hope that it wouldn't be moderated and some people would actually check it out. I've also posted some links to the materials here on local sites like houstonbeats.com after getting into some heated arguments. The only problem with promoting TOD this way is finding enough willing people to do it.
In the end we're a subculture within a subculture. The information is very technical and not easily digested. Btw, searches on Google for "peak oil" and "gas prices" peaked in 2005. The exception is references to "gas prices" and "peak oil" in the news, which has peaked this year and have a good chance of going up further.
It almost seems like people have simply given up or made up their minds. As I talk with friends and family it seems everyone has an opinion and all are equally uninformed. My mom listens, but she said I'm like Debbie Downer... yet my predictions have come true nonetheless. *sigh* This suggests a better strategy would be to reach the folks in news organizations and to convince them to consider us as a resource. If the big players won't listen, maybe smaller community/alternative papers would.
I'm just throwing out ideas to let them marinate.. because I don't have the definitive answer at this point.
Now with regards to the KSA, I'm skeptical about the entire matter. I will go out on a limb here and say that we'll see a report in a few months saying, "Saudi oil minister says demand not keeping up with supply, Saudi to scale back plans to pump more oil..."
They have been saying for a while that the problem isn't supply, though I don't think they believe it for a second. Whether they are able to pump more or not will not be relevant because fingers are being pointed in every direction. Yes they can push their fields a little bit to diffuse the arguments about their capacity. The main question is what can they maintain on an ongoing basis. Perhaps this is where things are going to get dicey. It's like a game of poker and someone just called their bluff. Now they are raising the stakes a bit and trying not to show much, with the hope that a little more time will give them the justification for not producing more. Later on that would give them an easy out and they could say, "We told you before it's not a supply problem.. we invested money in all these projects and the demand never justified it.. why would we pump more when everybody was so wrong before."
They are consistently saying the problem is the value of the dollar, which IS partially true. I see this entire field trip to Saudi Arabia as an attempt to stop the bad press. They are getting a disproportionate amount of blame and we all know what happened next door in Iraq. It's not a giant leap to say that they don't want to become a patsy in what will follow shortly. If they buy a little more time, circumstances may swing more in their favor. I feel bad for the politicians who will inherit this problem. Obama and McCain obviously don't know what they are getting into.
KSA will lose in the end though and so will many others. I'm waiting to see if we're going to have a worldwide recession because it seems more and more likely. That's not what the KSA probably want because it's one of the few things that could make those who are short on oil rich very fast, but it would buy them more time...
neal,
I can give you a first hand account of how far and quick oil prices can drop. When the oil price spike of the late 70's sent the world economy into a recession it took only a few years for oil to drop by 70% to $10/bbl. And the only reason it didn't drop any faster was Saudi reducing their production to maintain price supports for the rest of the producers. Eventually Saudi was looking at shuting in 100% of the production stream. At that point they told OPEC to screw themselves and cranked their wells wide open and flooded the market.
We can be certain Saudi hasn't forgotten this history. I've been a petroleum geologist for over 30 years and I know we can't add enough new production to cause this kind of price regression. Nor will altenatives/voluntary conservation/killing all crude traders/etc. knock down the price of oil anytime soon. But knock the legs out of the world economies (China has been on the verge of imploding for a couple of years) and it's possible to drop demand 15 or 20 million bopd. At that point there will come another test for OPEC to show the measure of unity that did not materialize in the early 80's.
I can see that sort of drop crucifying renewables/conservation/nuclear once more - people will assume the price drop is permanent, and fools and commentators will burble on about cycles and Pike's infinite lakes of oil etc.
Yes Dave...it was a sight to behold first hand. Winnebago sales went through the roof in the late 80's and it seemed as though half the country moved another 20 miles farther into the country.
Aahhhh...life was good and cheap
Here's a link to Garrison Keillor's very funny "Eulogy for the Winnebago"
Pretty much says it all
http://www.chicagotribune.com/features/lifestyle/green/chi-oped0618keill...
We have been around the block a few times.
From our top five paper (January, 2008), emphasis added:
It seems to me that there are two types of demand destruction: (1) Forced energy conservation, e.g., a college student can't afford to drive home every weekend; (2) The college student has to quit school because his dad just got laid off from his job with an auto manufacturer.
Right now, it's a horserace between declining net oil exports and declining demand.
From Rembrandt's keypost:
"This production increment is in all likelihood coming from the Khursaniyah oil field project that came on-stream in April. Because the additional production amounts to 500,000 b/d of light crude which is a similar amount as the announced production increments."
From Reuters yesterday:
""We are 100 percent confident that Khurais will come on stream as planned in June 2009," said Amin al-Nasser, one of Aramco's top executives.
He had been asked how he could be so certain the $10 billion project would be on time given that another major boost to capacity from the Khursaniyah oil field has yet to start up after missing a December deadline.
Aramco officials had shown similar confidence about that plan last year. Nasser said Monday that Khursaniyah would be ready to start in August.
"Even with a slight delay, it took 41 months from start to finish compared to the world average of 53 months, still Khursaniyah is doing very well," he said."
http://www.forbes.com/reuters/feeds/reuters/2008/06/23/2008-06-23T193721...
Not sure what to make of it. Did Khursaniyah go on-stream in April, or is it August? A minor quibble, perhaps.
Strange Attractor,
I don't know the details on the field but I can offer a little insight into the process in general.
Projects like this don't really start producing on a given day. The three big components are the producing wells, the surface processing equipment and the transportation infrastructure. Though the wells have likely been tested months ago their production profile and content can, occasionally, change shortly after full time production begins. At an extreme, I once saw two offshore oil wells shock an operator by turning into gas wells after just two weeks online. The surface processing equipment cannot not be fully tested and modified until the full production stream comes on line. Transportation confirmation can't really be fine tuned prior to full bore production hits.
It will probably be several months after all the wells are turned on before a stablized rate can be confirmed. But I won't be surprised if it's close to the numbers they are throwing out. That number isn't too difficult to estimate. Projecting a decline rate for the field is another matter. I'm guessing it will take several years before the production trend will confirm or argue against ultimate decline rate/recovery.
All the above would apply equally to Thunderhorse Fld in the Gulf of Mexico scheduled to come on at 250,000 bopd about now.