| GHAWAR: an estimate of remaining oil reserves and production decline (Part 1 - background and methodology) | The Oil Drum: Europe | Russian gas and European energy security |
GHAWAR: an estimate of remaining oil reserves and production decline (Part 2 - results)
Posted by Euan Mearns on April 27, 2007 - 11:59am in The Oil Drum: Europe
Two volumetric simulations (2D) of the initial and remaining reserves in Ghawar, the world’s largest producing oil field, have been determined. The High Case scenario uses somewhat more optimistic assumptions than the Base Case scenario. Background and methodology are described in detail here.
Estimate of initial oil in place = 162 billion barrels (same for High and Base cases)
High Case
Produced oil = 63 billion barrels
2004 reserves = 43 billion barrels
60% depleted
Base Case
Produced oil = 55 billion barrels
2004 reserves = 34 billion barrels
62% depleted
The Base Case production model shows Ghawar on the edge of irreversible production decline that may start around 2010 or it may already have started. The High Case production model is more robust and shows plateau production maintained until around 2013.
Reserves estimates
The areas of unswept oil observed on the Linux simulation (Figure 5, Part 1) transferred onto Croft’s map are shown in Figure 16. The measured map areas shown in Figure 16 are the same for Base Case and High Case. Base Case reserves estimates are also shown.
The reserves estimates for Base and High Cases are summarised in Tables 1 and 2. All details of input variables to these estimates are on the XL spread sheet that can be downloaded here.
All these estimates are to be viewed as provisional and subject to change as new information may come to light or as assumptions are refined.
All readers are also reminded that these estimates are a back of the envelope style calculation and are subject to large uncertainties. Jeremy Gilbert rightly pointed out that the only organisation with the data to perform this task properly is Saudi Aramco.
Note that the producing region boundary between Hawiyah and Uthmaniyah used here has been changed form those used by Croft and others. The traditional boundary chops off the north end of the Haradh – Hawiyah ridge that makes little geological sense so I have adjusted this boundary as shown in Figure 16 to follow more closely the geological structure.
Should anyone wish to propose modifications to the input to this model then I will be pleased to make adjustments so long as a good argument for doing so is presented.
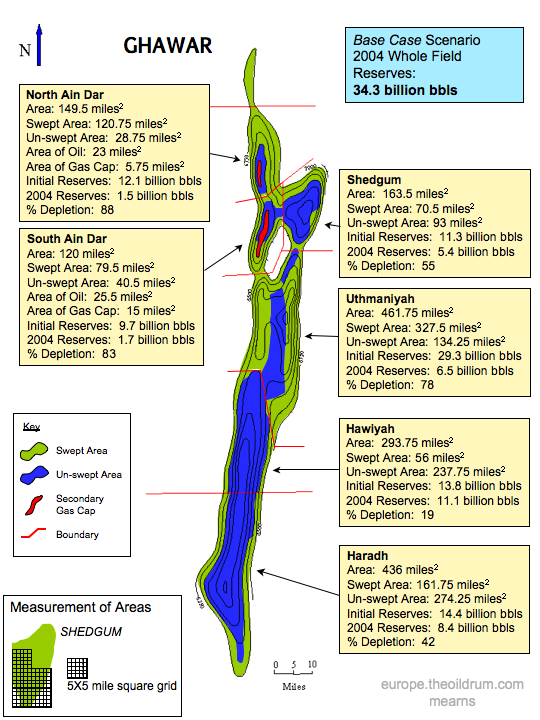
Figure 16. Contoured base map of Ghawar from Greg Croft with areas of presumed dry oil and swept zones inferred from Figure 5 (Part 1) superimposed. The areas were measured by careful counting of 1 mile squares laid out in a grid as shown. Base Case reserves estimates are indicated. See Table 2 for High Case estimates.
The boundary between Hawiyah and Uthmaniyah has been modified from Croft to follow the geological structure.
| Base Case | Initial STOIP | Initial Reserves | 2004 STOIP | 2004 Reserves | % depleted | Produced |
|---|---|---|---|---|---|---|
| N Ain Dar | 20.4 | 12.1 | 2.51 | 1.49 | 88 | 10.6 |
| S Ain Dar | 16.4 | 9.69 | 2.78 | 1.65 | 83 | 8.04 |
| Shedgum | 21.1 | 11.3 | 9.58 | 5.14 | 55 | 6.15 |
| Uthmaniyah | 43.6 | 29.3 | 9.67 | 6.50 | 78 | 22.8 |
| Haradh | 29.7 | 13.4 | 18.7 | 8.42 | 37 | 4.96 |
| Hawiyah | 30.6 | 13.8 | 24.7 | 11.1 | 19 | 2.62 |
| Totals | 162 | 89.5 | 68.0 | 34.3 | 62 | 55.1 |
Table 1 Base Case reserves estimates for Ghawar oil field, Saudi Arabia. All figures in billions of barrels.
| High Case | Initial STOIP | Initial Reserves | 2004 STOIP | 2004 Reserves | % depleted | Produced |
|---|---|---|---|---|---|---|
| N Ain Dar | 20.4 | 14.3 | 3.14 | 2.21 | 85 | 12.1 |
| S Ain Dar | 16.4 | 11.5 | 3.48 | 2.45 | 79 | 9.06 |
| Shedgum | 21.1 | 13.4 | 12.0 | 7.62 | 43 | 5.78 |
| Uthmaniyah | 43.6 | 34.8 | 9.67 | 7.48 | 79 | 27.3 |
| Haradh | 29.7 | 15.8 | 18.7 | 9.90 | 37 | 5.86 |
| Hawiyah | 30.6 | 16.2 | 24.7 | 13.1 | 19 | 3.09 |
| Totals | 162 | 106 | 71.7 | 42.8 | 60 | 63.2 |
Table 2 High Case reserves estimates for Ghawar oil field, Saudi Arabia. All figures in billions of barrels.
There is no difference between the high case and base case initial STOIP (stock tank oil in place) – 162 billion barrels. The High Case initial reserves estimate – 106 billion barrels, is significantly higher than the Base Case – 90 billion barrels, owing to higher oil column thickness and recovery factors used in the former.
The base case suggests 34 billion barrels reserves remaining in 2004 with 55 billion barrels already produced.
The high case suggests 43 billion barrels reserves remaining in 2004 with 63 billion barrels produced.
The reserves depletion levels are 62% for the Base Case and 60% for the High Case – both significantly higher than the 48% depleted value given by Saleri.
Areas of over – and under – estimation
The following summarises my views on where the reserves estimates reported here either under or over estimate.
Overestimation
- Ignoring edge wedge effects will have lead to overestimation of initial STOIP. And overestimation of remaining reserves in Haradh and Hawiyah.
Underestimation
- In transferring swept area data onto Croft’s map, the swept area in Haradh may have been overestimated leading to underestimation of remaining reserves (the estimated 37% depletion seems too high).
- All reserves estimates reported here are based on the unswept dry areas in Figure 5 and the wet area production immediately adjacent to the dry areas. No allowance is made for wet area only production. This may proceed for decades with high water cut.
- It is possible that the net reservoir thickness data provided by Croft does not take into account recovery from lower permeability rock made possible by horizontal drilling. Using thicker net pay (albeit with lower porosity and permeability) may add further to reserves.
- It is possible that the area on Croft's map leads to underestimation across Ain Dar - Shedgum
On balance, over- and underestimation will tend to cancel each other out, however, the balance sheet seems biased towards underestimation. It needs to be noted, however, that the reserves that are potentially underestimated are not easily produced being contained in either poor quality rock or in wet areas. These reserves will not significantly impact the decline of Northern Ghawar but may add significantly to tail end production.
Comparison with official Saudi statements
Ain Dar – Shedgum area
Dr Saleri provided us with a snapshot of Ain Dar Shedgum in his 2004 CSIS presentation (large pdf) (all data believed to be 2004 status). The key figures:
| Saleri | High Case | Base Case | |
|---|---|---|---|
| Produced | 26.9 | 27 | 25 |
| Remaining proved reserves | 13.9 | 12 | 8 |
| Initial reserves | 40.8 | 39 | 33 |
| Initial oil in place | 68 | 58 | 58 |
| Recovery (produced+proved)/initial | 60% | 67% | 58% |
The correspondence between Saleri’s produced, remaining and initial reserves with my High Case scenario is striking. Sufficiently so to give me a fair degree of confidence that the methodology I have employed is generally valid. However, the agreement with initial oil in place is not so good, Saleri quoting a significantly higher figure of 68 billion compared to my high case estimate of 58 billion. And this then highlights a conflict in the way all the numbers are derived. My high case already assumes a high recovery factor of 67% while Saleri’s numbers assume 60% recovery leading to the expectation of more probable and possible barrels to be produced as indicted in Figure 17.
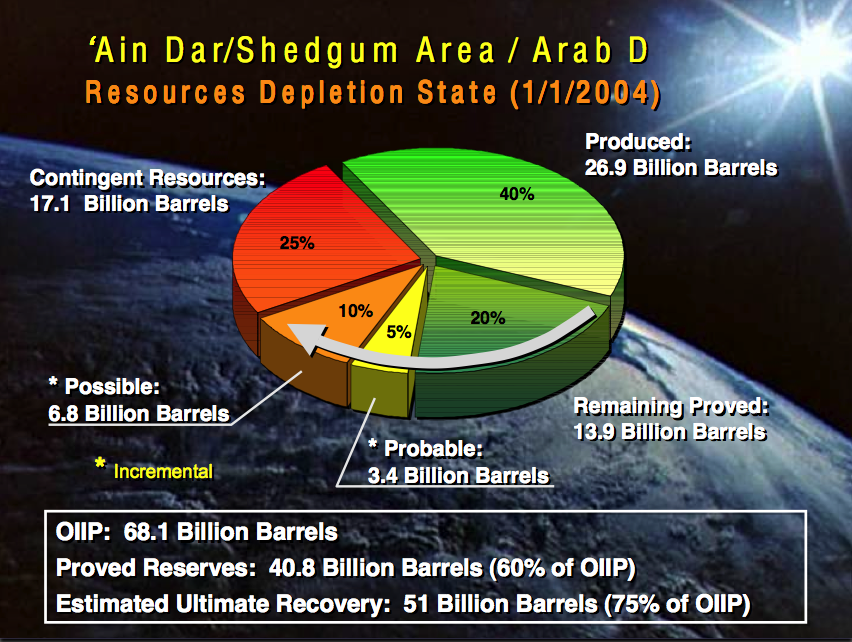
Figure 17. The Aramco view of Ain Dar and Shedgum in 2004 from Dr Saleri’s presentation (pdf).
Whole Field
Heading Out brought the paper by Jaffe and Elass (pdf) to our attention in his post Simple mathematics - The Saudi reserves, GOSPs and water injection. Jaffe and Elass (2007) provide an indication of the current Saudi view of Ghawar’s production history where they say that Ghawar still contains 70 billion barrels of reserves and is 48% depleted. In this case my figures have been adjusted for 3 years production (5 million barrels per day for 3 years is 5.5 billion barrels) to bring them into line with Jaffe and Elass’ 2007 data.
The Jaffe and Elass data have been reduced as follows:
70 billion = 52% of reserves, therefore initial reserves = (70/52)*100 = 135 billion.
With 70 billion remaining we get the 65 billion produced figure (135-70).
| Jaffe and Elass | High Case | Base Case | |
|---|---|---|---|
| Produced | 65 | 68 | 61 |
| Remaining proved reserves | 70 | 37 | 29 |
| Initial reserves | 135 | 106 | 89 |
| Depletion % | 48 | 65 | 68 |
As was the case with Ain Dar – Shedgum, there is actually remarkable correspondence between the production figures – the High Case being a bit higher and the Low Case being a bit lower than Jaffe and Elass.
However, the similarity ends there. The much higher Saudi initial reserves estimate gives rise to a remaining reserves estimate that is double mine, and this in my opinion masks the precarious state of depletion of Ghawar. The Saudis say 48% depleted while my High Case suggests 65% depletion.
The initial STOIP figure I have for the field is 162 billion barrels and this assumes generally high oil saturations throughout. The Jaffe and Elass initial reserves figure of 135 billion implies 83% recovery against my initial STOIP value. My initial STOIP calculation does of course hinge on the map scale and Croft’s average reservoir parameters being correct. If there are major errors there then perhaps someone could let us know?
Comments by Simmons
In his 2004 presentation, Matthew Simmons (large pdf) points to a 170 billion initial STOIP figure for Ghawar and he says that this matches Aramco’s 1975 estimate (pre full nationalisation).
My figure of 162 billion is a bit lower and I wonder if map scaling issues across S Ain Dar – Shedgum may account for this difference?
Nevertheless, the agreement is pretty good (5% difference) – considering my figures are produced on the back of an envelope, these areas of agreement underpin my confidence in my general approach. This emphasises the significance of differences between my estimates of remaining reserves and those reported by Saudi Arabia.
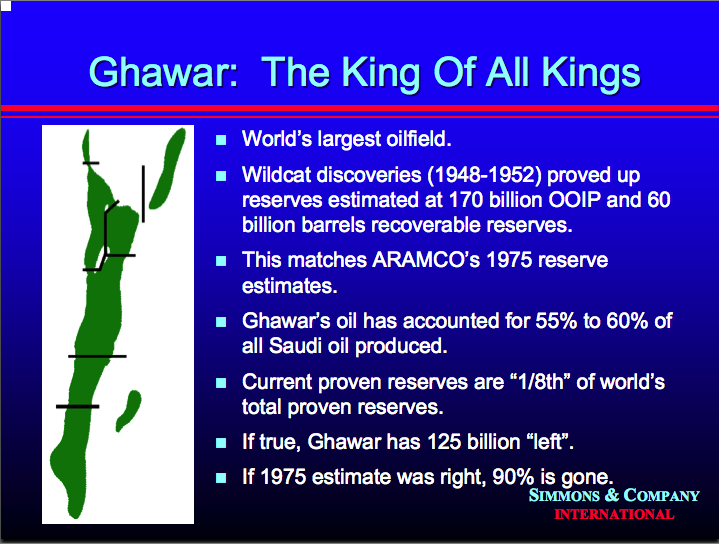
Figure 18. A view on Ghawar’s reserves provided by Matt Simmons in his 2004 presentation (pdf).
Production models
The production models for base case and high case scenarios rely on certain assumptions being made. Some details exist about production in the different areas of Ghawar. Overall production is assumed to be 5 million barrels per day. Published data point to 500,000 bpd in N ‘Ain Dar and 2,000,000 bpd for Ain Dar and Shedgum combined. Haradh is reported to be producing 900,000 bpd leaving 2,100,000 million barrels per day in Uthmaniyah and Hawiyah. The following distribution of production between the various areas has been assumed:
| N Ain Dar | 500,000 |
| S Ain Dar | 500,000 |
| Shedgum | 1,000,000 |
| Uthmaniyah | 1,500,000 |
| Haradh | 900,000 |
| Hawiyah | 600,000 |
| Total | 5,000,000 |
|---|
The production models have been run until all the estimated recoverable reserves have been consumed in the respective areas. Rapid decline over 5 year periods has been built into the models to take account of the growing use of horizontal wells in the development programs.
The reserves models suggest that Hawiyah contains the largest remaining reserves volumes and in each model a program of horizontal well drilling associated with new GOSPs are assumed to compensate for declining production in N Ghawar. It is envisaged that these projects would be similar to Haradh III, comprising smart MRC wells and each GOSP handling 300,000 bpd. In the base case, the reserves will only support a 2 GOSP development in addition to the assumed existing production. In the high case model, reserves would support a 3 GOSP extension to the field, each producing 300,000 bpd.
The base case production model presents a sobering picture of the state of N Ghawar (Figure 19). N Ain Dar is forecast to come off plateau production in 2010, followed by S Ain Dar, Uthmaniyah and Shedgum. The anticipated rapid decline of these areas points to most of the primary production in N Ghawar coming to an end around 2018 (Figure 19).
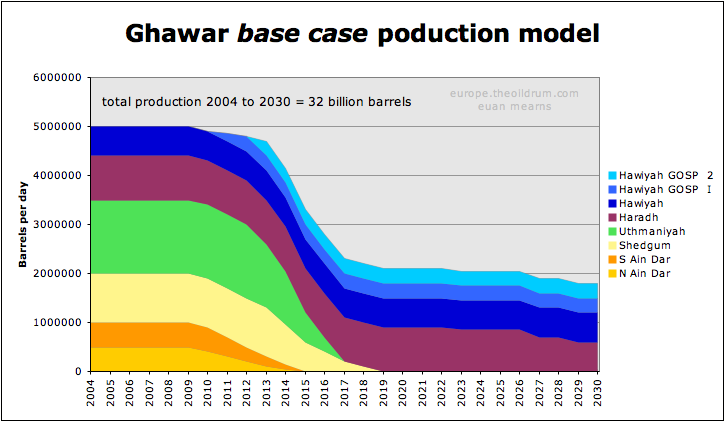
Figure 19. Base Case production model for Ghawar. The model is run until all remaining reserves in sub-structures are consumed. Not shown is potential wet area only production that may prolong the tail if sufficient investment is made in water handling facilities.
To compensate for falling production in the North, it is assumed that there will be further development of the South with Hawiyah GOSPS I and II partly offsetting the decline of the North. Around 2018, Ghawar production would settle on around 2,000,000 bpd but by 2030 most primary dry oil reserves will be exhausted.
It has to be noted that the timing of these events are based on the assumption that the Linux map is dated 2004. Should it reflect the situation in 2003 or earlier then the events described above will all happen correspondingly earlier – and 2010 is only three years away.
The High Case model presents a much more robust picture with plateau production close to 5,000,000 bpd sustainable until around 2013 (Figure 20). Following that, Northern Ghawar declines as described for the Base Case with N Ain Dar first, followed by S Ain Dar, Uthmaniyah and Shedgum. The higher reserves in the High Case also allows for a 3 GOSP redevelopment of Hawiyah with ample reserves to sustain a new plateau of 2,500,000 bpd until 2030 (whether reservoir performance will permit this or not is another issue).

Figure 20. High case production model for Ghawar. This model produces only 7 billon barrels more oil in the forecast period than the Base Case but this has a profound effect on delaying and reducing near term and longer term decline illustrating the sensitivity of these models to reserves uncertainties.
The High Case provides a very different outcome to the Base Case. Throughout the forecast period, the High Case produces 7 billion barrels more oil than the Base Case (23% more). This does not seem a lot but it has a profound effect on the near term and longer term outcomes. All readers of this article need to bare in mind the large uncertainty of these forecasts.
The additional oil in the High Case model comes from assumed, thicker oil columns in 2004 and higher recovery factors, especially in Haradh and Hawiyah. In the absence of reliable data (in the hands of Saudi Aramco) it would be unwise to discount the High Case model all together.
Consequences and conclusions
The ravages of 50+ years production on reserves in Northern Ghawar are there for all to see on the Linux oil saturation model (Figure 5, Part 1). Northern Ghawar is in a heavily depleted state and will shortly enter a period of irreversible decline. However, despite being around 88% depleted, regions like N ‘ Ain Dar, still contain a significant amount of recoverable dry oil – about 1.5 billion barrels in the case of N ‘Ain Dar. This is sufficient to support 500,000 bpd production for a few years yet (183 million barrels per year).
One thing I feel is important for OECD based observers to understand is that Ghawar has not been developed like commercial oil fields in the west. The field has never been produced at anything close to its production potential and this means that existing lower rates of careful production can be maintained, even though the field may be 65% depleted.
The real trouble for Ghawar and Saudi Arabia will start when N and S ‘Ain Dar and Uthmaniyah all begin to decline at about the same time, somewhere in the time frame 2010 to 2013 in my opinion. It is possible that this process has already begun and I eagerly await Stuart’s interpretation of these vital, highly depleted areas.
In preparing these reserves and production forecasts I became acutely aware of their sensitivity to varying certain assumptions and I have swayed between seeing an immediate production crisis and my established view that Saudi production will be maintained for a number of years to come. The data have led me to settle on the latter point of view. New field developments such as Khursaniyah (gas), Shaybah extension and Khurais will in my opinion enable Saudi Arabia to grow production slowly between now and 2013.
As I see things, the main consequence of the pending decline in Ghawar for world energy supplies is that Saudi Arabia, and other OPEC countries, will not be able to meet rising demand in full, giving rise to repeated cycles of rising prices and demand destruction. Saudi Arabian oil production will of course decline one day, but that day still seems to be a few years off. Falling oil and gas production throughout the OECD is the major energy security problem confronting the World Economy today.
The main conclusion to draw from the reserves data presented here is that the produced oil volumes tally in a general sense with figures released by Aramco. There are significant discrepancies however, with the remaining reserves figures. The data presented here show significantly lower remaining reserves than reported by Saudi Arabia and this reduces the outlook for future production growth.
Acknowledgements
Over the past two weeks, Stuart Staniford and I have been working closely with each other and have exchanged hundreds of emails. Stuart has been doing all the work – finding and reading thousands of pages and sending me summary information and key diagrams. Stuart is working independently on a Ghawar reserves model and we agreed to keep our key assumptions from each other in the interest of obtaining two independent results. Stuart is applying his computing and graphics skills to produce a more sophisticated model than mine, which I await with great expectation and some trepidation. Stuart kindly agreed to allow my more humble offering to go first.
Bob Shaw found the Linux oil saturation visualistaion and numerous other key data sources. And so I am indebted to him and several other TOD posters for their committed data mining and analytical expertise – Heading Out, Fractional Flow, Plucky Underdog and GaryP to name but a few.
Two industry friends who wish to remain anonymous provided valuable advice on the assumptions made in the models presented and have checked my spread sheet for methodological and data input errors. One is a Senior Production Geology Supervisor, the other is a Senior Reservoir Engineer.
Last must not least I need to thank my 14-year-old son Duncan who counted all the squares on the swept and un-swept zones (1624 squares in all) and who drafted many of the maps and diagrams presented in this post.
Saudi Aramco
One thing to emerge from the vigorous debate about Saudi Arabian reserves on TOD in recent weeks is the fact that Saudi Aramco are a highly competent organization doing a superb job of handling these assets that are so important to the global economy. Clear distinction needs to be made between the technical expertise of Aramco and the political statements about reserves and future production.
This article has been prepared in good faith, aimed at providing an independent view of the production history and remaining reserves in Ghawar. If here are major errors in the input data to my model then I will be pleased to revise this model should more accurate and reliable input data become available.
Recent Oil Drum articles on Saudi Arabia:
by Stuart Staniford
Further Saudi Arabia Discussions
Saudi Arabian oil declines 8% in 2006
by Euan Mearns
Saudi Arabia and that $1000 bet
by Heading Out
Simple mathematics - The Saudi reserves, GOSPs and water injection
Of Oil Supply trains and a thought on Ain Dar
by Ace
GHAWAR: an estimate of remaining oil reserves and production decline (Part 2 - results)
PDF version
170 comments
GHAWAR: an estimate of remaining oil reserves and production decline (Part 2 - results)
PDF version
170 comments
Personnel
Editors
Contributors
Peak Oil Primers
Archives
- November 2010 (3)
- October 2010 (6)
- September 2010 (4)
- August 2010 (7)
- July 2010 (6)
- June 2010 (7)
- May 2010 (2)
- April 2010 (8)
- March 2010 (4)
- February 2010 (6)
- January 2010 (3)
- December 2009 (5)
- November 2009 (8)
- October 2009 (12)
- September 2009 (6)
- August 2009 (5)
- July 2009 (11)
- June 2009 (8)
- May 2009 (16)
- April 2009 (10)
- March 2009 (7)
- February 2009 (10)
- January 2009 (15)
- December 2008 (9)
- November 2008 (9)
- October 2008 (9)
- September 2008 (13)
- August 2008 (10)
- July 2008 (14)
- June 2008 (23)
- May 2008 (16)
- April 2008 (12)
- March 2008 (16)
- February 2008 (9)
- January 2008 (13)
- December 2007 (13)
- November 2007 (16)
- October 2007 (22)
- September 2007 (8)
- August 2007 (9)
- July 2007 (16)
- June 2007 (8)
- May 2007 (7)
- April 2007 (7)
- March 2007 (10)
- February 2007 (10)
- January 2007 (12)
- December 2006 (9)
- November 2006 (15)
- October 2006 (4)
- September 2006 (5)
- August 2006 (5)
- July 2006 (9)
- June 2006 (5)
- May 2006 (10)
- April 2006 (9)
- March 2006 (13)
Vital Trivia
License

This work is licensed under a Creative Commons Attribution-Share Alike 3.0 United States License.
Euan - Congratulations and thank you for this fine piece of work. As I attempt to process all this information a question came to mind - given the sharp production fall that occurs in either of your two scenarios, and given Saudi Aramco's careful management of the field, do you think it is possible that the most recent 'OPEC quota'-driven (supposedly) drop in S.A. production is actually aimed at prolonging the life of what is left and replacing a sharp drop with a gentle decline?
Thanks again for your great work.
I think this is a quite likely scenario. With no substitute for crude oil on the horizon, medium term oil prices can only go up, and so IMO it must make sense to the Saudis, and other OPEC producers to produce more slowly, for longer at higher price.
That does make the most sense, drawing a higher number of dollars out of the global economy over a longer period. It's good oil field management. Now let's hope that the House of Saud can manage the political side of the kingdom as well as their engineers are managing the oil field side.
However, this still leaves us globally in quite a bit of a pinch, doesn't it? OPEC is not going to grow to 40-50 mbpd as envisioned in the fantasies of CERA and non-OPEC is very flat and beginning to fall so who fills in the gap? Nobody!
I see huge political mileage for the person who can come up with and successfully push programs like those from Alan Drake or Engineer-Poet.
Ghawar Is Dying
The greatest shortcoming of the human race is our inability to understand the exponential function. - Dr. Albert Bartlett
I have to say I have no idea of what you are talking about with this. Is this some reference to the bogeyman of Islamic fundamentalism? Saudi Arabia is already the greatest bastion of Islamic fundamentalism on the face of the planet. Christianity is illegal, no alcohol, stoning of adulterers... So you must mean anti-Americanism, right? Well, excuse mme if I say the rest of us don't care. You reap what you sow. You supported these dicks in the first place, and are responsible for the rise of fundamentalism throughout the rest of the Islamic world as well (the CIA and the madrassas to make cannon fodder for the war in Afghanistan, anyone?) So, if by 'political side' you mean 'The place might end up with people who won't sell to the USA!', well bad luck. What else would you expect? I'm sure they will still be quite happy to sell to the Germans, the French, the Japanese, and the Chinese.
Franz - Speaking that kind of truth to the biggest bully on the block will earn the retribution you do not deserve, but remember, God made us the biggest bully so we can protect God's chosen people, so Jesus can come back. OY Vey!
He may mean 'can't sell to anyone', due to internal turmoil like that in Iraq or (to a lesser extent) Nigeria.
The House of Saud isn't the most progressive group of people, but if they fail to contain internal tensions in KSA and substantial unrest breaks out, the skillful management of the engineers won't prevent oil production from (probably) dropping substantially.
If it ends up with a group in charge that is producing well but just won't sell to the US, that won't really make any difference - oil is (mostly) fungible.
"Non-OPEC growth in 2007 is unchanged at 1.1 mb/d, versus 0.4 mb/d in 2006, extending the sharp recovery evident since mid-2006."
IEA Oil Market Report, page 1.
It is certainly possible that they are wrong, however, so I would be very interested to see your evidence that non-OPEC oil production is beginning to fall.
Euan,
Congrats on a great piece of work, way beyond my ability. I share your excitement (trepidation) about Stuart's results.
I think many in the TOD sphere might consider your results to be "cornucopian" relative to recent discussions. Premptively, I would suggest that they compare your base and high case scenarios to what we are told by Aramco, namely that they can plateau production for another 30 years without a problem.... Even your best case gives us only 6 years before Ghawar starts to decline very quickly. Given the import of Ghawar in the macro scheme of oil production, this should be very worrying to any observer or forecaster.
I looked around the internet for information about Hawiyah a few days ago and could only find information relating to production of NG and NGLs. See this link http://www.theoildrum.com/node/2456/179010. NGL production looks set to increase to about 480 kbpd by the end of the year and NG production to 5.20 BCF/day. I assume that the NGLs are not included in your Hawiyah output forecast since they are not crude oil.
Unless I have my decimals in the wrong place, 5.20 BCF/day is equivalent to just under 900 kboepd. With the additional 480 kbpd of condensates, Hawiyah will be producing about 1.4 million bpd of oil equivalent by the end of 2007.
Were you aware of this production at Hawiyah and, if not, how would it affect your forecasts for up to three 300 kbpd GOSPs and 900 kbpd oil production in the future?
Addendum Edit: Wouldn't this volume of NG production also suggest the presence of a large gas cap in the most elevated part of the Ghawar structure, the Hawiyah / Haradh crest? If this is the case, it must necessarily impact on oil production potential there, simply by reducing the volume of oil reserves . Furthermore, by producing NG and condensate, would it not have the effect of reducing reservoir pressure substantially, thus making any oil recovery in the Hawiyah part of the field a lot more difficult?
I am coming to a layman's conclusion that Aramco has decided that NG and condensates will be what is produced from Hawiyah, and that whatever oil is produced will come a lot later and in much smaller volumes than the 600 - 900 kbpd suggested by Euan in his conclusions.
Bunyonhead - I wasn't aware of the "Hawiyah" gas and NGL production described in this link you provided:
http://www.hydrocarbons-technology.com/projects/saudi-aramco/
This gas is probably produced from the deeper / older Khuff Formation (Permian age) with prognosis for 300,000 bpd NGL production. This will not affect my prognosis for Arab D oil production - but it sure will assist the Saudis offset some declines in crude oil production else where in Ghawar.
THE PERMIAN KHUFF STRUCTURE OF GHAWAR
http://www.searchanddiscovery.net/documents/2004/afifi01/index.htm
Thanks Euan. So we can add a further 300 kbpd to the Total Liquids from Saudi by the end of 2007.
Three supplemntal questions:
- Is it right to say that the Ghawar oil fields sit "on top" of the Khuff structure you have shown above?
- What is KSA doing with all this NG production?
- Why have we heard nothing about plans for Hawiyah Megprojects?
If we need these as soon as you think, then I am surprised that I cannot google any information at all about plans for Hawiyah GOSPs....
Sorry bunyonhead, I don’t have the source but I read a long time ago that NG in Saudi is mostly spent in water desalinization. They don’t have any other source of water than the sea…
It is shocking to see in the CIA World Factbook that the Saudi NG production of 65.68 billion cu m (2004 est.) equals their domestic consumption!
Actually Saudi Arabia has two huge aquifers underlying much of the country. In fact they have been farming wheat there and watering it with aquifer water.
There are many oasis in the country where the aquifers reach the surface. Date palms surround the oasis.
However all the aquifer water is not potable but much of it is. They do have desal plants all along the coast and pipe water all the way to Riyadh from desal plants near Ras Tanura. When I was there in the early 80s, I saw the completion of a huge desal plant just north of Ras Tanura. The pipelines were the largest I have ever seen lain overland.
Since I was there another, even larger, desal plant has been built very near that one.
Saudi also uses natural gas to generate electrical power. Gazlan power plant, near Ras Tanura was a hydro (boiler) plant that burned natural gas but could also burn crude oil or naphtha. Of course the desal plants can also burn crude or naphtha but mostly they burn natural gas.
Ron Patterson
http://links.jstor.org/sici?sici=0016-7398%28199207%29158%3A2%3C215%3ADG...
We know from Voelker's thesis that Hawiyah has been on production since the mid 70s. Some wells, but not all, were rested during the period of low demand in the early eighties. We also know (from Croft tables, and from the relative perm graphs in the "50 years of wettability" paper) that the rock properties are much worse, so both rates of production and ultimate recovery will be lower, especially the former. I think Euan and I broadly agree that South Ghawar has a lot of oil left, and will produce for a long time, but is unlikely to substitute for the North Ghawar production that is being/will be lost.
Stuart, I have been trying to understand the grpah from the "50 years of wettability" paper.
I don't understand the implications of the relative permeability changes when Sw>50%. Does the water co-mingle with the oil or simply leave it behind as it rises to the crest?
Either way, the suggestion is that waterflood is not a good technology to increase production rates.
Is it possible therefore that Aramco is going to reinject the 5.20 bcf/day of dry gas from the Khuff into the Hawiyah Arab-D Formation in an effort to enhance oil recovery?
It might be worth clarifying what that import is.
Euan estimated Ghawar's production as 5mb/d, which is a pretty standard estimate. World oil production was about 85mb/d last year (IEA OMR), meaning Ghawar alone was about 6% of world production. So if Ghawar is in 12% annual decline, as some here argue, that would represent about 600kb/d decline between 2006 and 2007, or a 0.7% decline in world oil production.
For context, the IEA estimates non-OPEC oil supply will increase by 1.1mb/d, or 1.3% in 2007. If TOD suspicions about Ghawar crashing are right, then, that will cut the rate of growth of the oil supply in half, but will not cause the supply to peak (on an all-liquids basis).
So while Ghawar is important to world oil production, its peaking does not mean world peaking. To cause a decline in oil production in 2007 vs. 2006 would require:
Is all that possible? Sure. Maybe even probable. Just keep in mind, though, that all that is what "peak in 2007" means. Just looking at Ghawar is not enough, though.
SA is the only country on earth that claims to have signifigant spare capacity.
All of the models that show increasing world oil supply show huge increases in SA's production.
Now Ghawar produces 5 out of SA's 9mbd.
if Ghawar can't grow, or is even declining that means SA can't grow its production to any signifigant degree.
That means the world's production won't grow much beyond 85mbd if at all.
That's the import.
Evidence? Just because you believe something does not make it true.
April's IEA report puts 2007's non-OPEC supply increases at 1.1mb/d, continuing a strong growth trend from the latter half of 2006. They do not appear to be assuming that Ghawar is going to increase production at all, much less account for any substantial fraction of world oil supply growth.
You're making an assumption that Ghawar is much more important than it really is.
The EIA's predictions (which I use because they're free, unlike IEA's) forsee KSA growing to 17.1mb/d by 2030 (unlikely, IMHO, but we're testing their model). If we assume that Ghawar remains 55-60% of KSA production, that would require just under 10mb/d from it, or an increase of 4.5mb/d from its level last year (pre-declines). By contrast, the EIA sees total world oil supply growing to 123.3mb/d, or 38mb/d higher than its current level.
If Ghawar cannot grow, world oil production will grow only 12% more slowly.
If Ghawar declines to zero, world oil production will grow only 26% more slowly.
And that's assuming EIA believes Ghawar will continue to represent the majority of KSA production, which is probably a bad assumption. Nevertheless, even making that assumption shows that Ghawar is not the determiner of when oil peaks - a peak would require near-term and long-term disruptions to expected oil supply of many times the size of what we might get from Ghawar.
Those disruptions might well happen, of course, but fixating obsessively on Ghawar won't tell us much about them.
Those disruptions might well happen, of course, but fixating obsessively on Ghawar won't tell us much about them.
In the face of the coming troubles it must be rather cathartic to do SOMETHING, ANYTHING over which you feel you have some control ... and a mega analysis of Ghawar is an intriguing intellectual technical exercise which might fit the bill here.
Whilst the Ghawar technical "results" are indeed fascinating, they are unprovable until reality arrives to confirm (or refute) them ... and even then, like you PTE, I'm not sure if the state of Gharwar's oil production is key to the global oil situation.
Kaiser,
What you are doing is lieing with statistics.
Two bottom up analysises (Ace and the recent Swedish PHD theisis) show there is no 1.1 mbd growth from non opec.
If you look at the Swedish report you'll see that the difference between the best case and the worst case is almost entirely derived from Ghawar.
I don't have the time to go digging though the reports to quote out the numbers. I'd be a waste of my time anyway.
No - I'm quoting statistics. As in, providing some evidence to back up my claims.
I very much wish other people would do that. Citing evidence to back up one's claims is a great way to check whether those claims are actually right. There's no better way to debunk a claim than to search for evidence to support it and only be able to find evidence undermining it.
Your original claim was:
"All of the models that show increasing world oil supply show huge increases in SA's production.
...
if Ghawar can't grow, or is even declining that means SA can't grow its production to any signifigant degree.
That means the world's production won't grow much beyond 85mbd if at all."
i.e., you strongly implied that Ghawar was the defining factor in whether world oil supply could grow, and that all models recognize this.
Your implication is false, as demonstrated by EIA's model - even their "reference case" has 90+% of oil growth coming from non-Ghawar sources, and their "high price" case - which has KSA contributing less than 10% of world supply growth - has little or no Ghawar-based growth in it.
And if a Swedish PhD student was the world authority on oil production, that would mean rather more than it does now.
I read his thesis; my first thought was "they give out PhDs for that?" It was a passable summary, but the thesis requirements I'm familiar with put a much stronger emphasis on original research and production of a body of knowledge. It read like a very long term paper, and that's not what a PhD thesis should be.
Yet you have the time to post dubious and unsupported claims that 5 minutes reading will tell anyone are nonsense? It's a waste of your time if you don't quote numbers.
That you believe something does not make it true.
Right now, all you're doing is saying things that you believe to be true - faith-based reasoning. The strength of your faith in Ghawar's importance is not convincing, though, in large part because it's misplaced. Check the numbers for yourself - world oil production is so huge that even Ghawar is only a minor player.
The EIA's model assumes that because demand rises, production rises. They don't identify where this extra production comes from cause they can't.
You have seen Aces work. Is it not credible?
And here is the other analysis I refered to
http://publications.uu.se/abstract.xsql?dbid=7625
Let me know if you find a flaw in its reasoning. No faith involved.
You're right, it doesn't have much original research in it. He justs adds up the claimed production for the biggest fields in the world. Pretty simple, pretty tough to screw up. And the only way he gets world production to rise is to get Ghawar to rise.
BTW quoting bogus stats is lying with stats.
To PTE and others - I agree that Ghawar is not everything and there is false logic involved in saying that when Ghawar peaks, Saudi will peak and so the world will peak.
However, Ghawar is the biggest fish in the pond, with lots of published data, providing the opportunity to probe Saudi reporting standards.
At present, it looks like Ghawar has produced a lot of oil (as has Abqaiq) accounting for a significant portion of Saudi production. The more that has been produced from Ghawar and Abqaiq means that they must have produced a lot less else where.
Can Saudi production grow with Ghawar in decline as depicted here? Possibly yes IMO, but probably not a lot and not for long.
What false logic is that?
The utter lack of a logical chain from observation to conclusion:
1) (Future?) Observation: Ghawar has peaked.
3) Conclusion: The world has peaked.
To have any kind of logic at all, you'd need something connecting #3 with #1. The one that people appear to be using is:
2) Assumption: Nothing other than Ghawar can significantly increase production.
As I showed, though, that's false, at least according to major short-term production forecasts (IEA/EIA). Considering that the last 20 years of production growth have all been from non-Ghawar sources - including strong non-OPEC growth in the last 6 months - that's a huge assumption. So huge, in fact, that it's a very clear case of the logical fallacy of Begging the Question:
1) (Future?) Observation: Ghawar has peaked.
2) Assumption: The non-Ghawar world has peaked.
3) Conclusion: The world has peaked.
Faulty logic.
Pitt, you are something else.
I don't know who you are arguing with, cause that's not what I said.
And you just go ahead and believe in those EIA numbers. According to them we'll be at 100mbd in 2020. No need to worry at all.
When did I ever say you had said it?
You asked me to point out the false logic in an argument posed by EM that he didn't attribute to anyone. I pointed out the false logic, as per your request. Now you're getting angry and accusatory.
The reason for your upset is purely your flawed assumption, namely that I was talking about something you'd said. If you re-read what I wrote, you'll find there's nothing to get angry about - it's just a dispassionate analysis of a (flawed) argument.
No anger, just bewilderment.
Why go to the trouble of constucting a straw man when earlier in this thread I laid out my argument?
I wasn't responding to your argument, I was responding to what you asked about what Euan said. Do try and keep up.
(Your "argument" - which appears to consist of "I believe the Swedish guy who didn't test his model at all" - is not so much wrong as a leap of faith. If you want to talk about that, respond to the post of mine that is talking about it.)
If Ghawar is presently in decline, I agree with you that the KSA can probably maintain and perhaps increase production for a while, but only if it can gear up to drill thousands or at least hundreds of additional wells per year.
Notice the conditional. The problem is that the rigs aren't there, and a state owned oil company that deals almost exclusively with mega projects may not be the best at dealing with the smaller stuff. It won't be as easy from this point forward.
Are you mad?? His model is full of assumptions, most of them poorly analyzed. For example, he asserts that fields will follow a particular exponential decay pattern, but as far as I can tell provides no statistical analysis of how well his model fits previous data.
That one flaw alone means his model is wholly unreliable. Fitting a model and then totally failing to analyze the quality of the fit is, for the key model in a PhD thesis, unforgivable.
Ug - plus he's using 2P as his URR, but appears to have no analysis of how that value changes over time or with price.
Basically, he's come up with a model that's strongly dependent on parameters and jammed in parameters that "felt good" without apparent analysis of their actual quality; consequently, his results are little more than his own opinion.
And if the stats I was quoting were bogus, you'd have a point.
But I guess smearing your opponent is much easier than providing your own evidence, especially when you don't have any evidence.
The simple fact is this: non-Ghawar growth has been robust for decades, has been robust in recent years, has been robust in the last six months, and is forecast to be robust for the next year. Non-Ghawar growth is far more important than Ghawar growth, or even than Ghawar decline -- the expected case of non-Ghawar growth from the major forecasters is larger than the worst case of Ghawar decline from the near-peakers.
Am I saying they're wrong? No.
What I am saying is their fixation on Ghawar is woefully misguided, and their contention that "as goes Ghawar, so goes the world" is a huge unsupported assumption.
What goes on with Ghawar pales in comparison to what's going on in the rest of the world. If the doomers are right about Ghawar and the EIA/IEA are right about the rest of the world, the doomers lose - oil supply still increases substantially over the year.
I would like to say that all the analysis done on the Oildrum has all the data sources backing it publicly available and more important the logic behind the correlations and cross correlations. I have serious doubts about the competency oil the EIA to do more than collect and collate numbers they have been given.
If you have to question that who you should be questioning since its your tax dollars paying for them to make some pretty dreadful mistakes.
From reading I assure the debates on the oildrum and other peak oil sites are not fringe a LOT of people know what we have done. At any time anyone could step forward with a small amount of transparency and refute our claims. In the case of KSA they could even you data they have already published. This has not happened in the almost two years I've been following peak and in fact has in general not happened to my knowledge since the 70's. If your wish to refute the work done on the Oildrum then I'd say the bar is set pretty high if you can't come provide verifiable original source data then its no longer a valid argument.
The burden of proof is not in our court.
Or confirm them, but that hasn't happened either.
If the situation is as dire as the doomers say, there's plenty of reason for that information to be leaked - millions of lives are on the line. If the situation is as rosy as the cornucopians say, there's no reason for that information to be leaked...other than to appease a tiny internet community.
A probabilistic analysis of the "information leak" argument does not support your views.
Of course it is.
People here are asserting that Aramco is flat-out lying about its reserves. It's a strong claim, and requires strong evidence.
People here are asserting that the major world energy bodies - IEA and EIA - are either lying or completely incompetent. Strong claims need strong evidence.
People here are asserting that the world's biggest producer (Russia) is about to crash, despite years of steady growth. Strong claim (which keeps being wrong), needs strong evidence. And, no, HL isn't evidence - it's a model that RR showed was substantially unreliable.
People here are asserting that a modest drop in oil supply will lead to billions of deaths and the collapse of civilization, despite the fact that even halving world oil production would leave more per capita than most people live on today.
Extraordinary claims require extraordinary evidence. To say that the burden of proof is on others to refute your claims is utterly laughable.
Before I dig into this, perhaps Euan or Stuart or someone else can contact Epcon, the company that claims they are doing water production work for Saudi Aramco and experiencing water cuts in excess of 90%?
And thanks for the article, Euan! I will wade through this as time allows.
Ghawar Is Dying
The greatest shortcoming of the human race is our inability to understand the exponential function. - Dr. Albert Bartlett
Local water cuts of 90% don't surprise me in light of the state of the N Ghawar reservoirs. The quote from Epcon says it all. If they are unable to increase their water treatment / handling facilities then oil production will fall.
GeyZone;
Even Epcons CPU's have limits, like I said before, stoke's Law in physics rules. This is where the bottleneck will form in the future due to series parallel configuring in water treatment plants (GOSPs & Gathering Centers [GCs]. it is very difficult to remove oil droplets that measure less than 30um in diameter.
Regards
OCB
Thanks for the info! But I was more interested if any of the TOD modelers might contact Epcon to get some idea of the scope of high water cut production. How bad (or good) is the current situation?
We have lots of circumstantial information that I personally trust as a good ballpark estimate but Epcon has hands on experience with the Aramco situation. They are probably bound by NDAs but it can't hurt to ask.
Ghawar Is Dying
The greatest shortcoming of the human race is our inability to understand the exponential function. - Dr. Albert Bartlett
Euan,
Wicked work!
You, Stuart and Fractional_Flow, not to mention others, have raised the bar on KSA analysis.
Excellent work! Can't wait to see Stuart's model as well.
Yes, as these assessments all show, Saudi Aramco is extremely talented at managing their fields! They are extracting every last drop they can from them. My hat is off to the engineers and geologists who do this work.
But as you note the political statements often don't seem to map to the truth of what is going on.
Euan, if I may be so bold as to summarize what you are saying (and please correct me if I am wrong):
1. Northern Ghawar has either begun or is about to begin a terminal decline.
2. The rest of Ghawar still has a large amount of producible oil.
3. Due to geologic differences from north to south Ghawar, the flow rates are likely to be lower but steadier for a long time for the remaining oil.
4. KSA is likely to remain a significant producer of oil for decades to come, just at lower rates than today.
5. Unless KSA can bring online massive new capacity, their role as "swing producer" is probably over no later than 2018 (the eventual demise of northern Ghawar) and quite possibly sooner.
Am I reading you correctly?
Ghawar Is Dying
The greatest shortcoming of the human race is our inability to understand the exponential function. - Dr. Albert Bartlett
GreyZone - that's pretty much spot on how I see things at the moment. I think the concept of swing production will die long before 2018 if demand continues to rise and OPEC learns that their reserved capacity is insignicant compared with the un-met demand.
WRT to your point 5, I still suspect that KSA will manage to raise their game over the next few years if they are able to bring on new projects before serious decline in N Ghawar sets in. Stuart is doing more detailed work than I on the remaining reserves in Ain Dar and Uthmaniyah and if he provides convincing eveidence that these areas are more depelted than I have presumed then it is possible that new projects will only offset declines in Ghawar. I have a lingering concern about the vintage of the data used in the Linux satuartion map.
I guess we will see if they can "swing" very soon. 63 days +/- a month. (more likely minus).
So, if we think this is voluntary to rest fields, will they swing this summer or not? They have to soon, or 'The long emergency' begins a few months ahead of schedule.
If we are drawing down 1MMBPD of inventory, and that is after the first wave of demand destruction(Africa), and they continue to cut back(voluntarily?) that will put us at around 2MMBPD down by the end of the year.
Micheal Lynch better hope 'demand growth' can go negative soon.
We are staring at this crisis - and counting days.
Sigh...I raise my glass to Saudi engineers for good work, and say a small prayer that they will ramp this summer.
There may be plenty of oil in the southern Ghawar fields, but as I recall from all the discussions, this oil is not as light/sweet as northern Ghawar.
If the worldwide refineries are receiving this lesser quality crude and they cannot handle it without upgrading their systems, we have a bottleneck in getting finished product to the consumers.
Thus, our crude inventories go up and our gasoline inventories go down...the EIA weekly reports and the unusual refinery problems the US is experiencing start making sense in this light.
That is correct. Southern Ghawar will both flow at a lower rate and produce heavier and more sour oil than northern Ghawar.
This is only a temporary problem though, as refineries can be retooled. If all we had to worry about was a switch from sweet light crude to heavy sour, that would be doable. The greater problem is that, precisely when the OECD experts like CERA expect OPEC to drastically ratchet up production (by nearly 10-15 mbpd over the next 15 years or so) we are seeing OPEC decline almost across the board.
Ghawar Is Dying
The greatest shortcoming of the human race is our inability to understand the exponential function. - Dr. Albert Bartlett
The drop in asphalt prices with high gasoline prices and the numerous issues with refineries we are seeing indicate that a heavier grade of crude is being processed now without the refinery upgrades completed to handle it. This year it looks like we are having almost a crisis in the availability of light sweet crudes or more crudes that American refiners are optimized for. The drop in Mexican heavy may be the biggest factor. I know that refineries designed for light have low yields with heavy crudes but I don't know the impacts of changes in heave/sour crude has on refineries that can handle them I'd have to assume optimizations happen here also. So running heavy KSA crude through a refinery designed for Mexican probably lowers the yield same with the Venezuelan optimized refineries.
Asphalt prices.
http://www.acaf.org/Apr%2007.pdf
Once the refineries are upgraded we can expect that the amount of asphalt available will again drop and continue to drop until the price is very high. The tar sands are asphalt for example so upgrading of heavier crudes will eventually drop asphalt production quite a bit but raise gasoline production.
In thse short term I think refining issues are giving us a "pre-peak" peak and so far I'm not impressed with the response my prediction that above ground factors will predominate the actual production levels because of feedback problems seems to be holding up well.
I am not sure but i got the feeling that this http://www.theoildrum.com/node/2331 and haradh 3 could have something to do with the heavy grades, but are the amount large enough and is it exported to US and is the timing correct? I also suspect that it is quite possible that they send some of this http://www.bloomberg.com/apps/news?pid=20602099&sid=atacTjyPVm0A&refer=e... heavy oil somewhere else.
Hmm that seems to fit with heavier grades going not only to the US but Europe too. Notice the focus of the press release was on cutting heavy shipments to Asia and sending the volume and amounts to the EU and presumably the US but this means its probably heavy oil. A guess is that KSA may have strong armed a few people into paying a premium for heavy oil or you got no oil. Reading between the lines that seems to be whats going on. People are being forced to either take a cut or buy heavy at a premium price. I think it will be good to watch Asphalt prices as the summer moves along if true they will stay suppressed for some time.
So the real story here is that KSA may be forcing the heavy/sour gap to close right now. If its because of a decline in Ghawar then its because thats all they really have.
Who can give us a ballpark figure for time and cost to upgrade a refinery to work on the heavier crude supplies?
I'm just curious.
And who can tell us how many of the US refineries are going through upgrades? Surely, there is information out there? Where's Bob Shaw when you need him? He can find anything.
Like most things, it depends on how bad the crude is. For heavy and sour you have to add a catalytic cracker, a hydrocracker, and probably a coker. It can easily double the required equipment for a refinery and thereby the investment in the worst case. You also need a source of hydrogen, which now means you must build a natural gas reformer, since hydrogen is in short supply.
I forgot the most obvious the correlation between haradh 3 and the price of asphalt, but the correlation is in the wrong direction! I must have posted the comment to late at night.
Wow.
Figure 16 is a graphic "That will live in infamy".
I'd copyright it if I were you. (I already have mine) :}
FF
FF,
Taking all of the excellent work that you, Euan, Ace and Stuart, et al, have done, IMO, it seems to support the HL URR estimates of 150 Gb to 186 Gb for Saudi Arabia (without and with the "dogleg up" respectively).
Would you agree?
The remaining recoverable reserves would be 37 Gb (75% depleted) to 73 Gb (60% depleted). Ace's estimate is basically in between the two estimates at about 52 Gb remaining (70% depleted).
BTW, aren't the bulk of the remaining recoverable reserves in the Ghawar complex in the lower permeability portion of the complex?
WT-
Regarding KSA total reserves... I make no comment regarding things I know little of... and that would be the remainder of SA. I don't believe or not believe in peak oil- what I believe in is analysis.
Along those lines the problem I have with Hawiyah is summarized in this figure which comes on cue and was presented on March 12, 2007.
From SPE 105114 "Fifty Years of Wettability Measurements in the Arab - D Carbonate Reservoirs"

The typical relative permeability curve for Hawiyah from a composite analysis on the "numerous waterflood tests" conducted on the Arab D cores is a tough one to explain away.
FF
If I understand this, permeability relative to oil practically disappears as the water saturation goes from about 42% to 50%?
Yes
And the initial oil saturation is 57% rather than the 89% quoted in previous works. Greg Croft etal
A message from inside??
Bunyon???
Hi F_F. Puzzled already. Where do you get iniitial oil saturation at 57% for Hawiyah?
I am ready for my next lesson......
So, the production rate on the southern portion of the field will be vastly lower than in the northern portion.
The north end is watering out.
Therefore, overall Ghawar production is crashing.
As several people have noted, the north end produces light/sweet crude oil. IMO, one reason that some refineries worldwide are not running at full capacity is that they can't get all of the light/sweet crude that they need.
The North Sea, another big light/sweet supplier, is in terminal decline.
FF - as you know I don't know so much about reservoir engineering. I know enough, however, to know that Swi of 40% or there abouts is virtually impossible with an oil column of 1300 or so feet.
Croft's Swi numbers of 11% everywhere need to be taken with a pinch of salt - the varying reservoir quality across the field would dictate that Swi will also vary. This worries me a little bit, cos we are using all his other numbers as God's honest truth. Though SS tells me that he heard on the streets of LA that Croft's numbers are pretty cool.
My main question - how on Earth do we get such a high Swi in a field with such a gignatic column? Breached structure?
That's not Croft's number though is it? Isn't FF pulling the 40% type number direct from Aramco literature? That would make the situation even more confusing. And I am struggling to keep up with you folks as it is. ;)
Ghawar Is Dying
The greatest shortcoming of the human race is our inability to understand the exponential function. - Dr. Albert Bartlett
Euan-
Great question.
But when (at what minimum saturation) the capillary pressure curve for a rock goes asymptotic, it goes asymptotic.
The relative perms are generated by re-saturating that core with oil to mimic the drainage (oil fillage) process. Higher and higher pressures necessary to drive the water out.
Would the buoyancy force be 73 psi or thereabouts (difference between water and oil over 1300')???
You get to Swc (connate water) and it goes vertical.
What kinda reservoir rock would cause this- a pretty poor one in my estimation.
PS -love the street in LA line. But the "Streets of San Fransisco" would have been classic
FF
If it's a water-oil emulsion the hydrostatic head will be much less than for two phases.
on the face of it i think this kro/krw curve is suspect. is this a chalk reservoir? you are familiar with cretaceous chalks in the north sea arent you ?
Elwood-
You shock me!!!
At first you don't like reservoir simulation and now you don't like core data.
You have to read the paper and I don't have it with me (traveling) but here is the gist....
"Numerous waterflood core studies have been conducted.... use composites of 3 or 4 core plugs for each study.... each area has 3 composites and the curves you see are "typical".""
Now, you have 3 aramco lab employees who can write an SPE paper- probably 3 phd's. If they went to Stanford, they carry around a 500 page spiral notebook and never write anything in it in pencil if you get my drift- blue ink only.
Now, they are intrigued enough about the wettability which requires some really mundane stuff like measuring contact angle etc etc described in this paper. But, they probably know that the real money of what they do are the relative perm curves that go into the multi-million dollar simulator that many self gratify over.... now the money of the money of what goes into the simulator is the endpoints.
So you have 3 persons (a conspiracy) who must first pick typical core plugs for an area, then run 3-4 of these plugs for 3 sets, then sit down and agree on how to average these into "typical" curves. It just so happens that curves for 2 of these areas pretty well match what has been reported before. One area is way off.
So disregard the curve if you wish.
I don't know why though it is considered less reliable than anything else we've seen... it seems more to me.
Perhaps Aramco insiders have studied Twilight and are answering questions.
FF
I say chalk (which may be microcrystalline dolomite) or sucrosic dolomite
FF
ff, and another thing you........you...... kro slope surfing ....... well you get the idea. anyhow, do you have access to the spe papers on burgan, that might be a better place to look for declining production that saudi arabia. just a thought.
ff,i think you missunderstood what i said. what i said was something to the effect: "that if you know the results of the model before you run it, arent you wasting your time" ?(i assume that is what your are refering to).
actually, modelling is very usefull. but the modelling studies i have done are limited to x-sections, small areal models and radial models for well test analysis. i have never been involved in any large scale supercomputer "committee" modelling.
i do know enough about modelling, however to take each run with a grain of salt. and i agree with you that sometimes a modelling study is conducted to validate an otherwise bogus point of view.
and thank you for your response.
F_F strikes again.
For the uninitiated (i.e. me), what does the chart show us? What are Kro and Krw (oil and water obviously, but what does Kr mean?)?
Bunyon-
Absolute permeability is measured to a single phase flowing.
Could be air, water or oil.
Relative permeability is the fraction of that permeability granted each phase (oil, water or gas) as a function of saturation.
Effective permeability is the absolute permeability multiplied by the relative permeability.
So, a 100 md absolute permeability is fine in Hawiyah. But as Jeffrey astutely observed that is less than a 10 md effective permeability to oil when the water saturation increases just 7%.
Renders it nearly unfloodable by water.
Renders it nearly unfloodable by water.... I am sure that is right, but I have no idea how you get there.
Chart suggests that intial water saturation is about 42% (Greg Croft has 11%, but he had that across the whole of Ghawar, so looks like it was a "fudge" number).
I see that as Sw rises, the relative permeabilities of water and oil respectively rise and fall exponentially. However the two relative permeability curves cross at about 10% with Sw at 50%. At that point, the remaining 80% relative permeabiity is attributable to what? Air, natural gas?
After that point the Kro declines slowly, whil Krw increases rapidly. This suggests to me that water is able to circulate far more easily than oil at that point. This presumably has a major impact on water cut.
Therefore, logically does that mean it is too easily floodable, rather than unfloodable. Just that the water flood front would mix with rather than push the oil at Sw above 50%?
Ok, I have initial oil saturation (So) at 53% if Sw is 42%, with Sg 5% (Greg Croft has Gas-Oil ratio for Hawiyah at 485 SCF/bbl)
This is a HUGE difference to other parts of Ghawar and would lead even the uninitiated (i.e. me) to assume that water flows more freely in Hawiyah than ion the other Ghawar fields.
If Bob Shaw is on the site, I am sure he could fill in information on why this occurs with reference to DFNs and Super-K zones.
What I don't yet understand is whether the huge difference in relative permeabilities (when Sw >50%) leads to greater co-mingling of water and oil (ie higher water cut) or to the water circumventing or flowing through the oil pockets and rushing to the crest on its own leaving the oil behind
F_F - some help please.
Jeffrey, my provisional / current take on reserves:
I kind of like this chart showing total Saudi reserves of 211 Gb with 95 Gb remaining in 2005 (this is pre-reserves inflation, and declined for production).
An I'm drawn to the fact that my stretch HL points to 240 GB URR, with 116 Gbs gone leaving about 124 Gbs as of 2005.
And Ace posted this Rand corporation data yesterday (1975 vintage data) showing a total URR of 200 Gbs.
Figures 1 and 3 here are IMO a bit conservative cos they do not include reserves added by new technology - mainly horizontal drilling.
I don't want to nail myself to this cross just yet, as I want some time to look into the status of other fields. However, I'd say 100 to 120 Gbs remaining in 2005, with 116 Gbs produced - about half way through. Something like 34 to 43 Gbs of the remaining in Ghawar.
The 37 Gb figure you quote is about what I have left in Ghawar - mainly in the south where you point out reservoir quality is poorer, and production rates will be lower.
As you know, Texas had the same kind of "dogleg up" before its peak.
I asked Khebab to make three projections, starting in 1958.
This is from memory, but I think the numbers are approximately correct.
Qt (1958-1966): 50 Gb
Qt (1958-1972): 110 Gb
Qt (1958-2005): 66 Gb
In other words, using pre-peak data, including the "dogleg up" in a HL plot of the prior swing producer produced a wildly inaccurate estimate of URR. The most accurate pre-peak estimate came from ignoring the pre-peak inflection. Of course, the rub is how do you know when we have an inflection right before a peak?
IMO, this is where the strong linear pattern in the Saudi data comes in. The Saudi data from 1991 to 2002 are very similar to the pre-peak Texas data from about 1958 to 1966.
And the recent production data support an estimated URR in the vicinity of 165 Gb.
FF,
It came under copyright protection as soon as it was put up. However let me ask you. Is the Copyright emblem now on your work. How did you claim "copyright" for this graph. Is it registered with the Library of Congress. If its not, then you still have copyright, however you need to check into the legal implications of NOT having it registered with the LOC if someone else does use it. Does the copyright emblem exists on the graph posted here now. Also be familiar with the terms of "fair use" before you challenge someone with using it. Of course you may just be having a bit of fun, thats cool. If you're serious and aren't familiar with copyright, and you are now interested, a visit to the .gov site will be very helpful for you.
One last thing. How did you get the information to build the graph. The graph is yours but the information to build it was not. The source you gathered the info from to make the graph could be a copyright infringement. Copyright law is very very simple on paper. Go look. Then of course it becomes a matter of is "is" is.
Quid Clarius Astris
Ubi Bene ibi patria
If you look in the right hand sidebar of the TOD sites, including this one, you will see a link to the Creative Commons ShareAlike 2.5 license.
All stuff published here is covered by those terms
More info here:
http://creativecommons.org/licenses/by-sa/2.5/
If I understood Part 1 correctly, you assumed the reservoir basically fills up from the bottom with water. If there is a lot of vertical movement of water how does this affect the end date?
This is an outstanding work Euan, TOD is a much richer forum today than it was three days ago. Congratulations and thanks.
Here’s a question mark if you find it interesting: In either case we see the northern fields going into decline together in a relatively short period. Given Saudi Aramco’s expertise do you think they’ll let it happen like this or manage the situation in order to extend their life? If so, how would you do it?
Luis, as mentioned in my post, the Saudis are already injecting gas into N and S Ain Dar. This is one of the most effective secondary / tertiary oil recovery mechanisms. Given Bunyonheads observations on Khuff gas developments, and questions about where the gas might go, injecting this into the Ain Dars would make a lot of sense. They can strip out the NGLs and inject dry gas to increase oil recovery. The oil gets pushed down - back towards horizontal producers that are already drilled. Once all the oil is gone, then they can re-produce the gas.
BP just built a massive project like this in the UK. Gas from the Foinaven and Schiehallion Fields on the Atlantic margin is piped over Shetland to the Magnus Field in the North Sea to enhance oil recovery there.
Otherwise they should be investing heavily in water management / treatment facilities, cos they're sure going to be producing a lot more water in future.
Check out the Sand Geyser in SA - http://www.liveleak.com/view?i=652_1177619608
Hello Perpetual Energy,
Thxs for this videolink-->They had better hope it soon resembles the Indonesia mud volcano. I would hate to see it venting toxic/flammable gases; that would put a world of hurt to the people in this area.
Anybody know where Hassa is in KSA? Hope it is not on top of Ain Dar where they are reinjecting natgas.
Bob Shaw in Phx,Az Are Humans Smarter than Yeast?
Euan,
Many thanks for a presight of this article. It spurred me to spend this morning pulling together by own assessment/guess of the current state of Ghawar, based on all the data we have seen to date. I have used map data on Ghawar size and shape which, as mentioned previously, is different to yours.
I started from this map, and the various cross-sections and plan views we have discovered, drawing 4 contour levels (30,50,120,200 feet) at 1/10th mile resolution which I then fed through image analysis software (available free here) to count the areas (no 14 year old were harmed in the making of this guess).
Feeding the resulting numbers through a spreadsheet, and taking account of the various porosities, expansion factors, average recovery rates, arrived at:
porosity, rec rate, etc.)
porosity, rec rate, etc.)
I make no great claims to accuracy for this estimate (hence guess) and its subject to change at any point. I feel I may have over estimated Hawiyah/Haradh in the original case, and maybe been harsh on Shedgum where data is light. Note I'm ignoring 'wet' oil which would push the totals recovered up somewhat, but at much lower production rates.
It is however another estimate based on the same initial data, so may prove useful.
Wonder if anyone can get any idea where the Saudis are drilling this year? If your numbers are closer, they should essentially have given up on the northern fields, even for horizontals, and be drilling like mad in the south.
When you look at the N Ain Dar cross section plot its hard to put much oil there. Once you've done that S Ain Dar follows fairly naturally. You would then have to have some pretty significant data to suggest that oil in Shedgum is behaving any different to N&S Ain Dar - particularly given the relative heights and the fact they have been pumping it out at 1Mbpd for a long while.
Uthmaniyah is driven by the four sets of data we have that cover the central region. They show a fairly deep region of oil on the downslope, but also show tailing off to the north and south, limiting the volume still in place.
When I'd finished drawing these I was quite surprised by how empty they looked. I went back over the assumptions, etc., but nothing sang out as being wrong. Put it this way, the errors that are there are as likely to push volume down as up.
I await Stuart's values with interest...
GaryP - thanks for this contribution. A few observations / questions:
Initial Reserves
Your figure of 73 Gb is a good bit below my Base Case estaimate of 90 Gb. Most of the difference seems to lie in the Ain Dars. Any idea how we can get close on Uthmaniyah (27 v 29) and be so different on N Ain Dar (7 v 12)?
Where is production coming from?
One of my experienced reviewers asked how the field could still be on plateau with some areas 80 odd % depleted. My view here is that once wells water out, the Saudis drive up the road and drill new wells (but they are fast running out of options here)
In 2004/5 N' Ain Dar was still doing 500,000 bpd (SPE 93439) - that's 183 million barrels per year. You've only got 100 million left - enough to support 50,000 bpd or there abouts. Same applies to S ' Ain Dar, Shedgum and Uthmaniyah. In essence you show the whole of N Ghawar essentially gone - so where is the 5 million bpd comming from?
Oil water contact (OWC) geometry
Would you like to say how you're modelling the OWC. The gross reservoir is about 250 ft thick, so my take on this is that it will stay dry at the base in crestal areas until the oil column height thins to around 250 ft. You seem to have oil columns in excess of 500 ft still in Hawiyah but thinned oil layers on the crest?
Fantastic graphics - I need to improve my computing skills!
Initial Reserves
The areas of each of these for both of us are comparible:
N Ain Dar 140.72 vs 149.5
S Ain Dar 127.31 vs 120.0
Shedgum 174.02 vs 163.5
However the volumes of oil contained very significantly, particularly in N Ain Dar. I was swayed by the SPE 93439 plot of 'wet' areas in the north of this region, stretching back many, many years - making me think the initial volume on the 'not so high' areas was limited. I'm not sure what your assumed depth was, but I took Croft and scaled plot numbers to set that volume with some notable fall off on the less high areas.
Where is production coming from?
As regards production, I was puzzling over something last night when looking at the Jar production figures. Where was Haradh and its 900,000 if Ghawar was still performing on a plateau till 2006? Surely Haradh I, II & III should have increased production notably? My guess was that fall off in Ain Dar, Shedgum and Uthmaniyah was masked by Haradh and MRC infill drilling - and the 2006 fall off was that continued decline in the northern fields.
Oil water contact (OWC) geometry
I'm basing the heights etc. on the cross sections where water is flowing to base levels quite readily, and the strange behaviour of Uthmaniyah where the crest is 100% wet and the downslope is dry. In essence I'm not convinced its entirely gravity based with water taking a flat level, the sims seem to show something else.
And yes, using software to do the hard calculations and totalling of areas is a very good idea!
I'm not sure exactly what you are doing, but it's definitely wrong :-) Haradh and Hawiyah still have pretty complete oil layer across most of the area (look at the Linux supercomputer cluster oilsat visualization). Interesting looking tool though.
I'm not convinced of that linux visulisation.
1) we don't know the date with any degree of accuracy. It could be 1995 and something in the resolution of the plot feels wrong to me. The graphics rendering is old fashioned.
2) it only shows a 'thin skin' plot of saturation, nothing about depth which is key.
I'll agree with you that I'm not convinced of these two areas. Given the Croft average thickness numbers I think I over did the original thickness, and underplayed the current. However I was tending to focus on the other end, and time was limited.
I have a feeling you are confounding structure height with reservoir thickness somehow. There's over 1000' of vertical relief in Haradh. The Linux visualization of South Ghawar is well correlated with other information (eg the well distribution from Voelker, 2004 Uth cross sections, etc, etc. The text is reporting on simulations "as of 2004")
The Linux visualization looks like to my eye like classic Gouraud shading - plasticy looking - reflectance done with a large specular component. If you just fire up OpenGL with a pretty basic reflectance model, one polygon per simulation cell, it will produce something not too different than that. (Stare at the specular highlights in the visualization and you'll see little rectilinear ridges that may well be due to the imperfections in Gouraud shading interpolation - see the Wiki link above). We might imagine that a bunch of Aramco reservoir engineer/coders wouldn't produce Hollywood class visualizations... Likely they would just use OpenGL, and do so in a very straightforward way - no custom shaders - gets the job done.
Stuart.
My point was that in recent years they have bought COTS software that does better rendering. What looks like semi, flat triangle rendering suggests this image is from an earlier epoch. That's also true of the grid spacing. Compare with the other renderings coming out of the simulation solutions they bought in 2001.
I think we are talking mid nineties.
I think your to old on your guess see my earlier post.
The images where not done by professionals and I think they simply used some hacked up OpenGL software run on the cluster itself. So it "looks" older as far as rendering quality.
Look at it this way. You show major depletion in Haradh III. But production didn't start till last year. Doesn't pass the sniff test.
GaryP - I said in my post and in a comment to Grey Zone I share concern about the vintage of the data used in the Linux map. Since it is produced in a computing magazine boasting about some huge array of computers they have (they should simply buy a mini mac that plays music too) I think the modelling will be 2004 - but possibly using 2003 or earlier data - it will take a long time to get all this data together to run a model.
When I was discussing this with a reservoir engineer the first thing he looked for were grid cells - and they are there if you look closely.
The reservoir is just a thin skin (250 - 300 ft thick) draped over a massive structure. I agree with Stuart here, you need clear distinction between oil column height and oil layer thickness - and give or take a few feet, you should have oil full reservoir on crest when the column height is greater than 300 ft.
May also add that there are no / only a few wells down the ridge axis of Hawiyah / Haradh.
Take a look here, fig 1
I think we are looking at a whole field simulation from way back in time. Compare
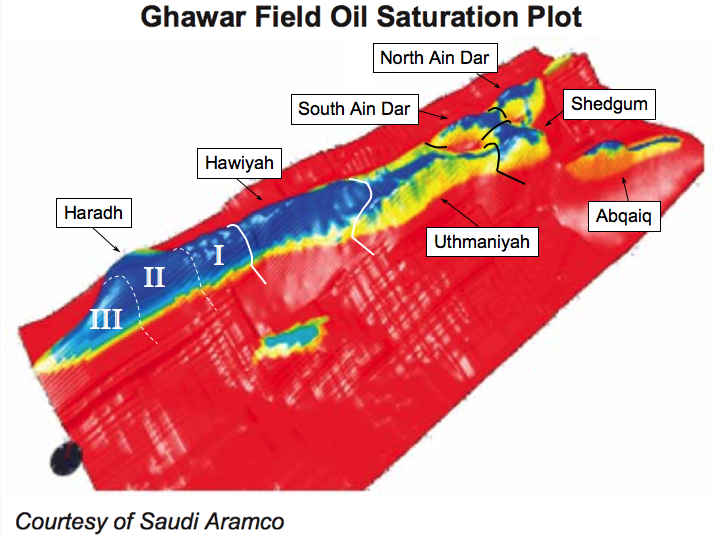
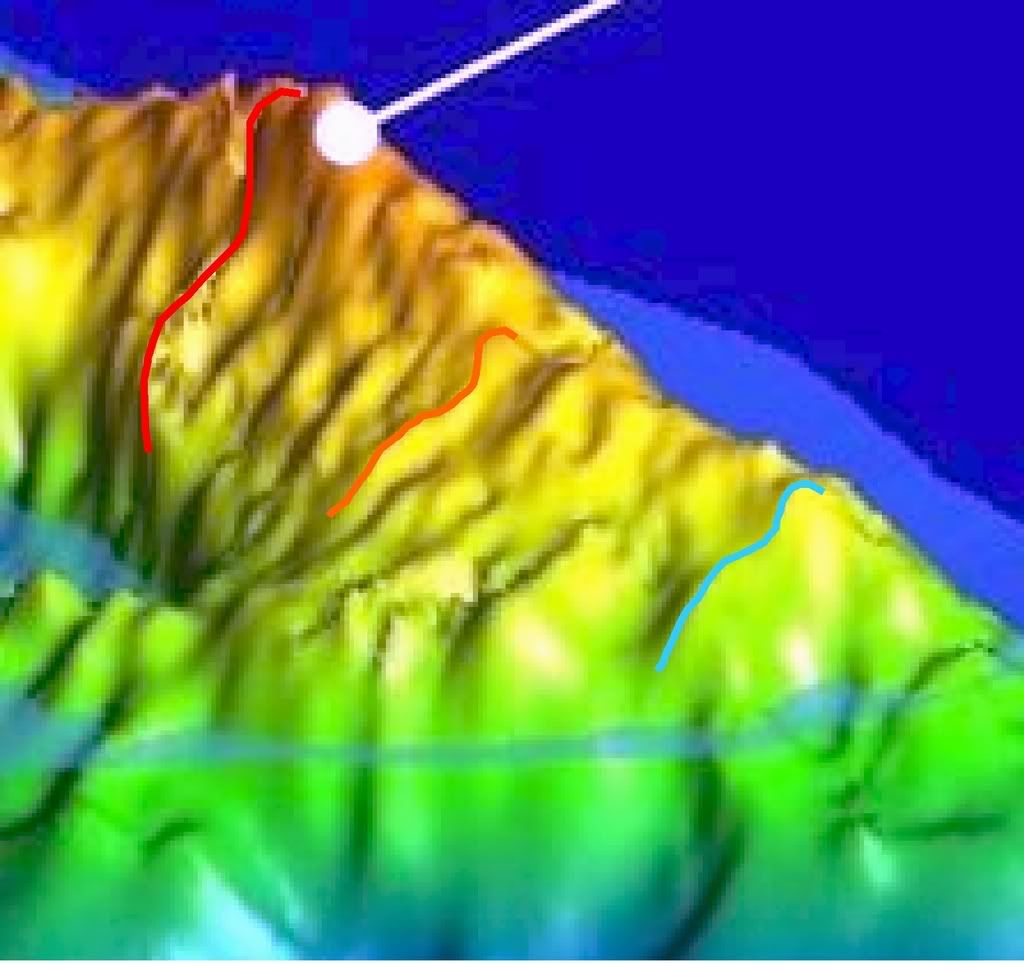
and
I'm seeing at least 4 times more grid detail, plus a very different rendering model AND much better base morphological detail. These are different epochs.
And by thin skin, I mean one grid cell thickness detail - with no indication which layer that cell thickness came from.
As much as I'd love to take this image as informative, Abqaiq is dead and this shows it as still active. It fails some basic sanity checks.
Gary - the lower image is definitely based on 3D seismic, showing most probably top Arab D Zone 2. So this is a high resolution static image of a single surface.
The top image shows top Arab D Zone2 plus the fluids the rock contains in multiple layers below the top reservoir and is probably used for dynamic simulation of fluid flow - a whole different ball game in computing power.
I agree the Linux map may use slightly out of date data - but why would it be published in 2006 in an article titled "Linux clusters driving step changes in interpretation simulation" if this was "old hat"?
Cluster is new the data was a test run to verify its functioning. Since the story was focused on new hardware it makes sense for them to publish one of the test runs.
This would be used to verify against previous simulations.
Wild guess on the data anywhere from 2000 to newer. I'd guess they would have started in 2000 and worked forward to test the simulation for 5 years. I'd be surprised if the data is newer than 2004 or older than 2000. It almost has to be one one the test runs. My guess is towards an older data set since thats what the computer guys would have focused on . If it was me and I started testing in 2000 then this would be a 2001 or 2002 data set and my gut says they started with 2000 data and pretty much ended with 2004 data with only a few runs with newer data.
I'd guess if you started in 2000 digging into SPE papers forward you could hit other images that where contemporary with this ones data to date it more precisely.
If its for a computer mag you should seriously consider a older date for the data modeled may best guess is 2002.
Memmel - if you see chat below about location of Ain Dar XYZ, I'm basically drawn to Stuart's conclusion that the remaining area here of dry oil is somewhat narrower than I have depicted. And whilst the errors in transferring data from Linux to Croft are large, I believe one way of closing the gap is to put an older date on the data used in the Linux - and 2002 seems reasonable to me. Later today I'll post an updated view of Base Case decline incorpoarting this, and a more nervous view on Hawiyah.
So programmers do think alike I suspect :)
And as of 2004, we have this Abqaiq cross-section, right:
Hello SS,
Beg your pardon, but did you get your date incorrect?
Is this a possible counter-argument to the Linux graphic being accurate, or showing insufficient detail? Maybe computed data actually represents circa 2001 timeframe?
As link below clearly states: north crestal nose of Abqaiq dead back in 2001--80% watercut-- but dead wells revived:
http://www.sulzerpumps.com/PortalData/9/Resources/technical/multiphase/M...
Also topcrest dual horizontal lateral in Abqaiq back in 1996 [see Fig. 10 further down in the above link]? Is this second geo-slice from southern Abqaiq circa 1996?
I think Abqaiq is way past its glory days. I tend to go with GaryP's assessment that the Linux oil sat graphic is computed from older data than we think.
Cheers! Now what do we do? Is Gary's hypothetical 2007 updated graphic for Ghawar looking more plausible? I think he got SE UTMN about right [recall earlier SPE papers on waterflood problems here].
Now regarding Hawiyah: Simmons thinks very little will come of it: "no proof of producible oil" see frame 24 of Powerpoint at
http://www.simmonsco-intl.com/files/CSIS.pdf
Hawiyah is the area of Ghawar with/or had the greatest compressive stress: compacting/cementing the payzone rock and lowering porosity/permeabilty while increasing the quantity of faults and DFNs. Huge fault displacement from Eastern Hawiyah to Eastern UTMN.
One more question I need answered: I have been googling around, but have found no definitive graphic or text description of exactly where, what discovery timeframe, and just how big the Shegdum leak area is; just know that it affects about thirty topcrest wells. 30 square miles? 60 square miles? Shouldn't we be able to see this clearly in the Linux graphic, or is it hidden from the view angle?
Bob Shaw in Phx,Az Are Humans Smarter than Yeast?
On reading the paper again, I see that although the paper itself was published in 2004, I see you are right that the test was in 2001-2002, so likely the cross section was from that time too.
However, given the general tone of the paper that it's all about how to get the last unswept parts of oil out of zone 1, the top layers of zone 2 etc, and they were trialing technology in a couple of locations in 2001-2002 to do this, it doesn't seem unreasonable to me that there would still be most of that oil there in 2004, though obviously it's hard to get at, and production would be low at best. And as Euan notes, it may well be turned off altogether in 2004.
The paper is helpful background for the 9a), 9b) cross-sections in the North 'Ain Dar, since it adds considerable support to the interpretation that the thin layer of unswept oil is in zone 1 (and the top layer of zone 2), and the rest of zone 2 and 3 are fully swept.
"no proof of producible oil". We know from Voelker that at least part of it has been producing since the 70s. There is well production data in there that goes on for several decades.
(However, it is worth noting that Voelker's study is of a little island of super-K in the midst of Hawiyah, which mostly lacks those layers - I actually correlated his study area to the Simmons productivity graph and will post the picture next week)
"Is Gary's hypothetical 2007 updated graphic for Ghawar looking more plausible? "
No - he's showing Haradh III substantially depleted after 1 year of production. That's completely implausible.
Hello SS,
Thxs for responding. As always, I am anxiously awaiting your next keypost.
I think the Simmons' quote was mostly for shock effect too. I think he was trying to express that this huge area of Ghawar, Hawiyah, will never come close to the flow rates like what we saw from North Ghawar. When I google Hawiyah: I mostly come up with info-links on natgas extraction from the underlying geo-formations.
Hopefully, GaryP is tweaking his hypothetical 2007 graphic for further refinement: it will be interesting to see how his future revision compares with yours.
Bob Shaw in Phx,Az Are Humans Smarter than Yeast?
Hello SS,
The application of MPPumps to revive dead wells in Abqaig was evidently tried in dead wells in Hawiyah too:
http://www.sand-monitoring.co.uk/pdfs/sms_pdf21.pdf
---------------------------------------------------
SPE 93369 March,2005 copyright date, page 5 of PDF
An additional multiphase pump [MPP] project is planned for Hawiyah area of the Ghawar field, where other dead wells will be pressure boosted in a similar manner to enable them to produce into the GOSP.
---------------------------------
I haven't been able to find any results of this test.
Bob Shaw in Phx,Az Are Humans Smarter than Yeast?
As I said before Stuart, I accept that the Haradh numbers need modification, which I intend to do. 1950s numbers likely fall, today's rise. In light of the other new data I intend to change some other parts as well.
However, for one mornings work, when I should have been doing other things, I don't feel the numbers are too bad, particular for northern areas. As I said guessimate and subject to revision.
Luckily revision should take relatively less effort. Maybe I should make an application where people can create their own assessments?
"I don't feel the numbers are too bad". I would characterize the numbers as "obviously completely wrong".
Stuart, this image ties in pretty well with the skinny ridge of oil on the Linux visualisation. Abqaiq not stone dead - but not exactly brim full of oil either.
This image from Jaffe and Elass shows no production from Abqaiq in 2004:
http://www.rice.edu/energy/publications/docs/NOCs/Papers/SaudiAramco_Jaf...
So my guess is that Abqaiq is semi-retired, asked to do occasional work whe the Saudis need her oil.
My main point, however, is that Jaffe and Elass say that Abqaiq is 73% depelted but still contains 17 billion barrels of reserves.
From this we can deduce that 17 billion barrels = 27% of original reserves, from which we get an amazing number of 63 billion barrels for the initial reserves in Abqaiq. The Rand corporation data posted by Ace shows 12.5 billion - quite an amazing discrepency.
Eyeballing Abqaiq on the Linux map I'd say it was in worse shape than the Ain Dars. 26% of 12.5 billion (Rand) = 3.3 billion remaining, and I'd say that looks generous. Note also the extreme low residual oil saturations on the x section you posted which seem to tie in with orange colours on the Linux water flood. If this is remotely true then you can't fault Aramco on their reservoir engineering. Maybe we could run a course for them on statistics?
Maybe we have a point of potential agreement here. We might speculate that Abqaiq is part of the 1.5mbpd of "sustainable spare capacity" :-) :-) :-) that the Saudi's allegedly have. That's 650mbpd (Simmons) of spare capacity right there! Those expensive multiphase pumps are all there arrayed accross the desert, ready to go at a moment's notice! :-)
What is the Abqaiq reservoir rock??
Hello Garyp and Euan,
Big Kudos to Euan for Part 2!
I agree with Gary's assessment that the circa 2004? Linux graphic lacks sufficient detail resolution when compared with Voelker's Motherlode and other papers. It was very useful for corroboration to paint a big mental picture we can use, especially where it showed the eastern crestal areas of Uthmaniyah having high watercuts.
IMO, Gary's 2007 graphic is very useful for further discussion, and I hope Euan can generate his own version for comparative purposes. I am sure that SS's 2007 graphic will be quite impressive. =)
My suggestion, to reduce possible confusion, is that all future graphics adopt shades of the color red for oil-dry areas. Hopefully, Gary can switch colors in his graphic because our minds trick us into automatically associating blue with water. Maybe gas-cap areas colored purple?
Euan, are you slogging thru the Voelker PDF on Super-K and Discrete Fracture Networks [DFNs]? I encourage you to do so as it may alter your viewpoint and future graphics. Please quickly refer to the pages/frames I posted earlier in your Part 1.
I don't have a graphics skill, but if I did: my 2D graphic would more closely resemble Gary's but with a somewhat larger oil-dry area to exploit but with lots of variously colored holes from DFN/super-k problems. See right side Haradh graphic of Voelker PDF page 97,frame 127 for a view of what I am trying to describe with words, then extrapolate mentally to the rest of Ghawar.
A simple view would be an Arab D zone stack of twenty 10-foot thick pepperoni pizzas. The sauce and cheese would represent the waterflood and DFN's coning through the high perm layers, the dough the left-behind residual component, and the pepperoni the bypassed payzone pockets that will be tapped by horizontals and/or downhole pumps.
Please see the cubes at Voelker Motherlode PDF pages 459- 461, frames 489-491: Wouldn't you love to 3D fly-thru these stacks of pizzas trying to best determine injection, drilling, and water-handling decisions?
Bob Shaw in Phx,Az Are Humans Smarter than Yeast?
Hello TODers,
I think it is very important that we consider the advances in computer simulation:
Reservoir Engineering:
http://www.veritasdgc.com/bins/content_page.asp?cid=7-1281-1300
Fracture Modeling:
http://www.veritasdgc.com/bins/content_page.asp?cid=7-1281-1299
How accurately can we reverse engineer to roughly approximate Aramco's 3D? I hope pretty damn close.
Bob I decided to shoot first and ask questions after. I'll read Voelkers thesis now. My main question for you and anyone else right now is about initial water staurations in Hawiyah that may be around 40%. That equals continuous water phase in the reservoir, which IMO means the reservoir is leaking like hell (breached). This of course creates some great exploration plays - looking for the oil that has leaked. Is there any evidence of surface seeps etc in the Hawiyah area?
Euan
Bob,
I went with blue because I was overlaying on red, yellow and green and wanted to see what I was doing !
Excellent work Bob! Clearly we now need to do a supercomputer simulation of the Pepperoni Pizza Model, to determine the residual oil in Ghawar.
Need to determine a few parameters for the model. Crucially : are they Roman (thin-crust) or Neapolitan (thick-crust) pizzas? Getting this assumption right is crucial to the predictive power of the method.
(It's the yeast that makes the difference.)
Congratulations Euan on an excellent piece of work!
One of the best on TOD.
I look forward to the discussion surrounding your conclusions.
Between the Base and High cases, the argument boils down to declines beginning in 2009 (base) and 2014 (high). With the non-OPEC peak due around 2010/2011, I am wondering if these 5 years really make any difference if the world is not doing anything to mitigate peak oil. I would think not — along with Robert Hirsh, I suppose.
Looking at Saleri's slide (Figure 17), which many of us have seen before, the question of "contingent resources" requires more attention. The SPE defines this as
Of Saleri's OOIP of 68.1 Gb (2004), 17.1 were designated as not economic in 2004. It's not clear what that means (see below), or if Saleri is following the SPE definition (I presume he is). FF apparently thinks these resources refer to waterflood residual oil, but that is not known with certainty. Assuming he is right, use of miscible solvents to recover such oil has been around a long while and is well-described in the literature (e.g. Alkaline, surfactant, polymer slugs). Polymer slugs are being used at Daqinq, but have not halted declines there, these have merely slowed them.In any case, it would seem that this kind of EOR will be applied in the tail in Saudi Arabia, which will commence in either 2009 or 2014. The Chinese probably do not care much how expensive it is to apply this EOR in their domestic oil production, because they are "selling it" to themselves. I don't know what the marginal per barrel cost actually is, but CANO Petroleum seems to think SP (surfactant polymer) flooding is economic at $25/barrel. If all my assumptions here are correct, recovery should obviously be economic at prices of over $60/barrel. There would be no reason for Saudi Arabia to use such EOR if they didn't have too (yet). So many mysteries, so little time.
The Daqing data I've seen (O&GJ) shows the method as somewhat successful — they get 240 thousand b/d from Daqing from polymer flood (June, 2006). See Surfactant boosts polymer EOR effectiveness at Daqing if you've got a subscription to O&GJ.
Have a good one. Hi, Euan. Nice work.
Dave
As Matt Simmons put it, many fields are producing "Oil stained brine."
Hi Dave, how are yo doing?
My take on Contingent resources = irreducible oil saturation on the Saleri slide. This is what FF has said. I think his probable and possible are also a bit fanciful - these are the bits used to plug the gap in their reserves estimates versus what actullay exists. I see their produced + proved as 2P and would allow them their extra 5% for decades of high water cut production from wet areas.
I think you can probably forget the use of polymers etc - this thing is just so huge, you'd never be able to make enough ploymer to have any effect. Cheaper to just dig a 7000 ft deep hole and pass buckets up and down.
Euan :-)
Re: pass buckets up and down
I could make a serious reply if I could stop laughing.
Guys (and ladies?) -I wish I could laugh at any of this stuff. I come here pretty much every day now for months and I've almost gone past the 'be afraid, be very afraid' point but not quite...
As Gordon Brown (UK Chancellor cum next-PM wannabe) said "we really need some transparancy of what is going on in SA". Surely somebody knows the real facts? How can so many be so wrong when it comes to perhaps the most important thing since a monkey rubbed two sticks together and invented the bbq? (Phew, I DO still have a sense of humour gland -I thought it had been lobotomised)
How hard would it be to put someone 'on the inside'? -a sort of passive James Bond type. Surely the CIA and the Russians have their own shadowy figures too.
Sorry to butt in on this fine technical talk -I really think you guys do the biz with what little info is available. I tremble to think what your analysis would reveal if the whole Gorgons head where exposed...
The 2010-2012 timeframe keeps cropping up in so many things I read as 'inflexion years'.
Regards, Nick.
I think that says it all, Dave. I don't think there's very much headroom left at all in daily production. We are either at or very, very near peak. We may bump up to 87 or 88 mbpd but it doesn't look likely yet to me. Of greater concern (to me, at least) is what will be the rate of decline?
Ace has done extensive work and shown that C&C decline is currently at about 0.8% annually since the May 2005 C&C peak. If that decline rate holds, that puts us down at about 69 mbpd C&C by 2020, I believe? We'd need roughly 8mbpd in biofuels and "tar sands" to just stay even, not counting all other drilling done to hold the overall decline rate to 0.8% globally.
The points you make reinforce my view that KSA will be a producer for decades to come. The problem will be in daily flow rate, which the OECD wants in the double digit range but which appears to be headed for the middle single digit range (4-6 mbpd after about 2015).
Ghawar Is Dying
The greatest shortcoming of the human race is our inability to understand the exponential function. - Dr. Albert Bartlett
Using surfactant on a field that's at 90% water cut would be hideously expensive.
I still need to study this second part of Euan's work a little better, and I still didn’t had the opportunity to read the comments.
However, one thing strikes me from the start:
The “Production models” seem to be arbitrary and unexplained.
And the starting condition of 5Mb/d production remaining 100% stable (not only for the complete field, but even in each of the individual 6 sectors that are presently producing!) to 2009 in the “base case” or to 2013 in the “high case” seems inconsistent with the present knowledge, let alone with a proper prediction for future production.
This seems strange (and a little sad) after such profound preparatory work…
Shedgum
This one's for Stuart, GaryP or anyone else who has followed this covert analysis of Ghawar.
I discovered today that Stuart is digging very deep into some data I skimmed over. IPTC / SPE 10395 has this oil column height map described as being located in the southern Shedgum area. In other SPE papers, yellow often denotes an oil full reservoir. So do you think this section may be from this lobe on the SE flank of Shedgum - suggesting a lot of Shedgum is still oil full? 2004 vintage data.
At risk of stealing some of my own thunder next week, here's what Euan was referring to (from Fig 11 of the IPTC paper).
Stuart - I got to admit that this begins to look quite convincing and that I may have over-estimated S Ain Dar.
The important point here is that the skinny river of oil in your graphic looks much smaller than the Linux map. Maybe you (or anyone else that is still awake) could estimate where you think the Linux contact runs on Croft's map. We can then work out the volume difference between your graphic and Linux @ 500,000 bpd to get a rough date on the vinatge of the Linux data. I'm thinking the vintage may be circa 2000 - and if that's the case northern Ghawar may be in serious trouble - but not quite as serious as GaryP's interpretation.
Right now, I don't see any quicky/easy method to get the data off the Linux picture with precision. To my eye, it looks broadly consistent with what I think is going on in 2004 - I don't see the inconsistency you see - but because it's rendered from a particular viewpoint looking down at an angle, and close enough in to get substantial non-isometric effects, and the Arab-D model outside of the field is probably not flat, it's hard to nail exactly where the crests are, and so how high up the oil is. It gives us a general qualitative flavor, but I haven't yet figured out a way to make it any more precise than you did.
Re: it looks broadly consistent with what I think is going on in 2004 ... but I haven't yet figured out a way to make it any more precise than you did
Consistent with, but no more precise, in a relatively broad range of possibilities. So It Goes, in the absence of what Saudi Aramco engineers — are they incompetent or self-deluding? — think based on reservoir measurements. We can only be just so certain that the worst has happened. Or, maybe their political masters are engaged in a cover up, and stifling their opinions. Who can say?
The scientific method requires 1) falsifiable hypotheses and 2) results that can be replicated.
Certainly, your view meets criteria 1), so that's good. If Saudi Arabia raises production, you are wrong. If production stays at current levels or below, the evidence is consistent with your view, but does not "prove" it, given the large number of independent variables involved which we can not measure. Only KSA production over time can make your central thesis more and more plausible — or not.
Concerning 2), unfortunately, this experiment only gets run once, so the stakes are high. In fact, the whole "peak oil" experiment only gets run one time — yes, the stakes are very high indeed.
"If Saudi Arabia raises production, you are wrong." Actually, what I said was:
10.7mbpd is the currently stated oil production capacity of the Kingdom of Saudi Arabia.
I then doubled the stakes. Oddly enough, nobody so far seems to think that this is an easy way to part a fool from his money... Come on guys, the Saudis say they can produce that much oil. Nansen would never commit terminological inexactitudes, would he? All they got to do is double up the wells in Haradh and Hawiyah, right? Right?? And they still haven't explored the Arabian Shield at all! They haven't drilled a single well in that whole huge area! Gotta be some oil in all that granite... I hear the stuff is formed abiotically in the upper mantle - I wouldn't wonder if North 'Ain Dar is filling up with abiotic oil again right now!!! Come on, somebody's gotta take my bet!! :-)
Euan,
I don't think so, the bore hole frequency looks all wrong. In particular in that location I would expect to see evidence of the water injection nearby.
I'd need to see the original to dig into it further.
Check Patent 7059180 for more info on what you might expect to see in that area.
Personally I'd be looking at the North East corner, which seems to be of general interest as a result of the Shedgum Leak Area.
IPTC 01395 says:
I'll ask Stuart to send you a copy of the paper.
The injectors will be off to the east (right) by 2 or 3 miles.
Hello Euan,
If Shedgum still has a somewhat significant quantity of dry oil [as evidenced in this 2004 detail], I think it is was because Aramco has been carefully choking back production until further, more modern studies are/were completed.
Obviously, it would be in their best interest to minimize DFN coning, waterflood override, and zonal thieving by adding more poorly placed wells.
Shedgum leak area in Voelker PDF page 80, frame 110:
----------------------------------------------------
Fracture systems were suspected early as significant elements of flow in Shedgum, by the advent of the "Shedgum Leak."
Wells in a local, approximately 30-well area on the
crest of the structure in Shedgum had begun producing water, prior to waterflooding.
It is now hypothesized that the water is sourced in the Jubaila and Hanifa Formations, located below the Arab-D, and conducted through a system of vertical DFNs.
-------------------------------------------------
We would need to know more detail on Shedgum faulting, DFNs, and the permeability extent of vertical-lateral connectivity, but compare to this text on a UTMN well, page 72, frame 102:
--------------------------------------------------
A final example of water override is that of rate dependent water cut.[51] A well in the Uthmaniyah Sector was found to have a thin interval at the top of Zone 2A, producing
90% of the well total production rate. An oil-water contact intersected the well 70 ft below the interval. The well produced 11500 BOPD at 30% water cut. The well rate was reduced to 8000 BOPD at which it ceased producing water. A flowmeter measurement taken at both rates indicated no change in flow profile of either water or oil. Water cut rate dependence can only be predicted with a water coning model.
However, the complete cessation of water production at a non-zero well rate cannot be predicted by a conventional coning model, but one in which the cone height suffers
no hysteresis.
This may occur in a DFN, where capillary forces may be very small relative to gravity forces. Therefore, a plausible hypothesis offered by the authors is coning within a DFN that is located away from the well, and that intersects the thin, high permeability layer. Further evidence of this model is seen in the very interesting result that the intersection of the oil-water contact with adjacent wells occurs 40 ft above that in the subject well.
It appears the flux of water through the flow network defined by the DFN, thin bed, and well, is sufficient to induce a significant, local drawdown of the oil-water contact.
-----------------------------------
Also [from memory], Voelker mentions that some shut-in wells backflowed by pressure differentials up to 1,000 barrels/day to higher perm DFNs connected to non shut-in wells. I think they would try and minimize this from happening in the Shedgum leak area.
Bob Shaw in Phx,Az Are Humans Smarter than Yeast?
We now from the CSIS presentation that the whole of 'Ain Dar Shedgum was producing about 2mbpd through 2002. So any "choking back" must have occurred after that.
Could someone post the link of Voelker's pdf?
thanks!
Hello Khebab,
Sorry, I regret I did not notice your request sooner:
Voelker Motherlode:
http://pangea.stanford.edu/~jcaers/theses/thesisJoeVoelker.pdf
Sourced from this webpage [There may be more useful and more up-to-date-info in these other links]:
http://pangea.stanford.edu/~jcaers/publications.html
Bob Shaw in Phx,Az Are Humans Smarter than Yeast?
Since the second graphic is for MRC wells would it make more sense that this is a thin layer they are going after ?
High is probably better interpreted as a dry oil column.
Euan, thanks for a great article.
You say that 37% depletion seems too high for Haradh. Looking at the linux figure, the 'swept' margin seems about equal along Haradh I, II, and III, and actually thicker off the southern tail. But Haradh III wasn't even running in 2004, was it? Could this water/oil mixed region be the original state? (I know little of geology, but the water/oil interface seems pretty sharp in the '1940' cross-sections).
peace,
lilnev
Euan, Stuart, Khebab, WT, memmel, bunyonhead, F_F, et al.
Thank you for all the hard work and research! I cannot follow 100% but enough to know the gist of what is going on.
OPEC's press releases have been getting wierder lately, I suspect reading between the lines they have no other choice.
Given that CERA's attempt(?) to avoid punative taxation while trying to not spook the herd looks like it back fired. Claiming lotsa' oil with high prices wooks bad (hat tip to WT on that one).The senate is looking at a windfall profits tax.
I worry that OPEC might face the same problem in an uglier fashion if they claim to have reserves but do not produce them while prices skyrocket. Might be better to say they are having a hard time keeping up with increasing demand and better cut down on use (.)
I see no reason not to panic at this point. We are so unprepared for this. delaying the colapse will only make mitigation harder because of lack of energy reserves.
D,
A copy of my post from Drumbeats follows. (You never knew you had so much in common with Richard Rainwater.)
Remember Richard Rainwater's warning 16 months ago?
Based on a communication with Mr. Rainwater, this is a one time event; apparently, he won't be speaking out publicly again, but he felt compelled to issue a public warning.
http://www.energybulletin.net/11695.html
Published on 12 Dec 2005 by Fortune. Archived on 13 Dec 2005.
The Rainwater Prophecy
by Oliver Ryan
WT, Luckily I'm poorer and alot lower profile ;-).
If you are in contact with Mr Rainwater, or his gardener give him my e-mail. I have a few things that I have developed here that are not readily available but are super easy to build that would make a big diference in ventilation construction. I would be happy to send pictures. Our heaviest houses are Agritech gothic arches with a 70 mph wind load- stout well built houses, that shed snow quickly. There are plenty of others out there - heavier is better IMHO. Assuming plastic sheeting is available long term or stock pile some 6 mil 4 yr taken off in summer they will last a very long time. Poly lock - better use stainless wiggle wire the other stuff rusts real quick. Oregon Valley greenhouse has the best IMHO and good houses as well- they have a website. Nothing beats glass if you have the $. The dutch firms I'm told have the best ones available.
That property I mentioned - I looked at and it. Would work very well. Flat, farmable and with running surface water.
Purchased a small diesel car - 50 mpg+/-.
Wondering when to pull the plug on nursery and try to switch to crops. Have been starting to stock "transition" varieties of plant material, heirloom seeds, preservation equipment.
Neighbors who are listening are saving big bucks with stored fuel. Funny how they down play my information yet act very strongly to preparedness. Those who haven't so far are starting to come around slowly- a few gas shoratges should get thier attention.
I agree with both you and Mr Rainwaters prognosis, this will unwind and most people haven't a clue. I need a few more weeks to get some of our big rigs out of here.
Hope you find your lime green volvo - you might have better luck in Portland ;-)
best,
D
Really?
To be honest anyone with such a fortune need not worry. In fact I would predict that anyone with over a million dollars liquid is sitting pretty. Problem is most of us mortals are sitting on assets that are just about to get toasted in the great selloff of 20xx...
If I had $2.5 Billion, well, I'm not gonna even go there, but I wouldn't be 'wrried' by anything...
Nick.
noutram,
I can think of many ways for money to loose its ability to inoculate one against the worse case scenarios of peak oil. For one thing, money makes makes one visible. For example, how would you treat the needy at your gate? Money can lose its value. There all kinds of ways. That's why Sir Richard is worried. He gets it.
-deleted-
-deleted-
Just wanted to add my thanks to the major contributors on this thread, particularly Euan. Amazingly enough I find myself gradually starting to make sense of this heavy tech stuff - like anything the more your exposed to it, the more you pick up.
BenjaminCole
I like all the graphs and obviously a lot of work went in. The Ghawar field may be in decline. But what about KSA heavy deposits., They have huge heavy deposits too.
And still, worldwide, it costs less than $12 a barrel to bring up oil. That includes a world-wide average of US $7.35 per barrel in finding costs, $3.57 per barrel in lifting cost (what it takes to operate a producing well), and $1.00 in production taxes per barrel.
In othr words, the marginal cost of producing a barrel, worldwide, is about $3.57 a barrel. That figure is four years old. But even if you double it....
Meanwhile, at more than $60 a barrel, you are going to see demand declines. It is demand pulling the price up at this point. But the price mechanism is a self-correcting deal. A higher price moderates demand. It is a ocean liner, but it does turn.
With conservation and substitution measures, the world economy can easily consume less fossil oil every year. Think plug-in hybrids, flourescent bulbs, lighter smaller cars. Bio-fuels coming on, may represent 20 percent of vehicle fuels in 15 years or less.
This is not a crisis. In fact, I still think we may see another glut in a couple of years. In the past, estimates of supplies have always fallen short of reality.
I would like to see someone in this group seriously address what declining demand for fossil oil is going to mean to the doomsday scenarios.
"I would like to see someone in this group seriously address what declining demand for fossil oil is going to mean to the doomsday scenarios." Perhaps you could start by reading the stuff we've already done :-) My past pieces are available, for example - you might want to check out the stuff on transport adaptation. I am not a doomer.
Benjamin - there has been so much work done in this area (fossil fuel demand, elasticity, alternatives) that the internet is chock full of information. Perhaps that is why many of the TOD posters do not feel the need to repeat the thoughts here.
I second SS's notion that you look at his postings... he did look at miles driven vs. economic indicators.
If you look at what has happened historically, when reduced oil demand was forced - in the early 70's with the Arab oil embargo, then in the early 80's with the Iran-Iraq war, the economic consequences can be seen.
Unlike some here, I do see still existing low-hanging fruit wrt energy consumption mitigation, especially in the US, Japan, and a few other wealthy countries. The issue for policy setting and planners (or anyone looking at their future) is if Peak Oil truly is a one-time event, and long term average oil (and natural gas) production falls essentially forever, what happens after the low fruit (of conservation) has been picked?
As for biofuels - so much has been written about them. Nothing I have read has convinced me that anything other than possibly algal biodiesel is a sustainable process. We are better off going straight to PV or other human engineered solar energy capture, than to rely upon farmed photosynthesis.
InJapan - Ive been reading TOD for a while now and have also noticed a lack of interest in the economic consequences of peaking. You say there is a lot of economic analysis out there on the internet and thats why but I can't for the life of me find it. (with the exception of Hirsh prehaps). Could you or anyone else point me in the direction of some good stuff if you know of it
Hi darex,
Thanks. I'm also very interested in looking at economic effects, and also in outlining some positive mitigation paths. Even given the "worst case" scenario, there are still better and worse choices, so my inclination is to start looking at what those might be. (Just to try to sum up where I'm coming from.)
As far as I can tell, Jeff Vail's article on "Rebound effect" is one effort to talk about economics. Likewise, there was much discussion after Alan Drake's "If KSA announced they're at peak" article. You can look these up (or I'll try to if I don't lose my place.)
Also, there has been some general discussion, usually in "Drumbeats". memmel has posted some on this, and there's been discussion about the pros and cons of things like carbon tax. Gail has commented on the fiat currency several times. I had a back-and-forth with Chimp about Catherine Austin Fitts work - this barely qualifies as even a jumping off point for a discussion about the economic effects.
I have huge questions. There's much discussion seems to be about agriculture and about "re-localization". Still, I wonder about the probable (emphasis) actions of multinationals - what we can say, what we can predict. Etc.
I would like to see this done in some kind of easy-to-find, easy to read and discuss format, though personally have zero to contribute on the technical/organizing side of how to do this - and the editors already do so much. (So, I hesitate to suggest something that someone else has to do the work for!)
I'd very much like to continue this line.
In other words, I can suggest you search and read TOD. And there's probably a lot else I have no idea about.
Otherwise, I'd like to begin and continue talking about this.
Perhaps we can ask Robert Hirsch to join in for this.
where did you come up with those figures? production taxes less than $ 1 / barrel? (more like $ 7). and royalties ? you seem to have forgot royalties (try $ 7 - $ 10)
Is the purpose of the SA/OPEC reserve curtain ultimately to estabish the global Caliphate?
(ps - I received A Crude Awakening from Netflix this afternoon. If you don't have netflix, ask someone you know who has it to get ACA for you. It's one thing to talk to every day people about PO, it's another to let them see it for themselves. This film delivers the reality of PO like a shot to the gut.)
Hi Euan,
Superb effort – must have taken huge number of hours! Your figure 16 serves a very good framework for further discussion of Ghawar.
Ghawar is in Decline Now
Ain Dar/Shedgum was producing about 2 Mb/d in 2003, according to Saleri’s 2004 CSIS presentation. Your base case reserves depletion rates indicate that Ain Dar/Shedgum should only be producing at most 1.5 Mb/d in 2004, if it is assumed that reservoir damage does not occur.
Your high case of 2004 reserves of 43 Gb, less 5.5 Gb, gives 2006 remaining reserves of 37.5 Gb. Applying an annual reserve depletion rate of 5%, which should responsibly produce the reservoir, gives 2007 high production from Ghawar of 5.1 Mb/d. Your base case gives 2006 remaining reserves of 28.5 Gb and 2007 production of 3.9 Mb/d.
My previous comment http://www.theoildrum.com/node/2498#comment-184193 estimates Ghawar remaining reserves of 23 Gb as at year end 2006. Using the same methodology as above gives 2007 production at 3.2 Mb/d.
The three 2007 production scenarios and the rapidly depleting Ain Dar/Shedgum areas strongly suggest that Ghawar is highly likely to be in decline now and would be struggling to produce 4 Mb/d. This means that Saudi Arabia oil production is in decline now.
Saudi Arabia Total Initial Proved and Probable Reserves are about 175 Gb
I believe that your Part 1 – Figure 1 estimate of initial Saudi reserves of 211 Gb is probably too high.
BP’s statistical review reports annual remaining proved reserves of oil (I assume crude oil). However, their oil production includes NGLs. NGLs are significant as Saudi produced 1.5 Mb/d in 2005.
The 2004 Saleri CSIS presentation states that Aramco produced 99 Gb oil to year end 2003. EIA data show that Aramco produced 9.10 Mb/d for 2004 and 9.55 Mb/d for 2005. This gives cumulative crude oil production to year end 2005 of 106 Gb (99 + 9.1*365/1000 + 9.55*365/1000) which is 10 Gb less than your estimate of 116 Gb. That drops your 211 Gb down 10 Gb to 201 Gb total initial reserves.
The US oil companies that sold their Aramco stock to the Saudi government would be prefer if Rand and any other consulting companies would estimate reserves for Aramco on the high side in order to get a higher price for their Aramco stock. The price of crude oil in 1974 was the equivalent of 2004 dollars $US46/barrel. This means that each on a stock valuation basis, each barrel of proved reserves might be worth say $US10/barrel in 2004 dollars. Each Gb of oil would have a value of $US10 billion and a 100 Gb would be worth a large amount, $US1 trillion.
BP’s statistical review shows Saudi proved reserves of 168 Gb in 1980. However, even this figure is questionable as it just happens to be the first year of 100% Saudi government ownership of Aramco. The Saudi government bought 25% of Aramco stock in 1973, bought another 35% in 1974 and the remaining 40% was transferred in 1980. This price paid for the Aramco stock would have been primarily determined by proved oil reserves.
http://www.newsmakingnews.com/lm4,17,02,harvardtoenronpt3.htm
Rand’s Table A59 shows a detailed split of production and reserves by field. This 1975 table was inserted into the 1978 Rand report. There are some interesting points about this table shown below.
First is the annotation of “(low?)” for almost every field. What does this mean? On page 99 of the Rand report, “(low?)” means “that an estimate is likely to be understated by at least 10%”. Is 10% just some arbitrary number? Why does it apply to almost every field? Why is the range for Ghawar given as 60-83 Gb and the total recovery placed at the top end of 83 Gb? In addition, the top end is labelled 10% understated “(low?)”. Perhaps the range should be changed to 60-92 Gb.
Second, look at the huge range of the recovery estimates for some of the fields. The range for Marjan is 0.7 Gb to 24 Gb! The range for Manifa was from 1 Gb to 11 Gb! In the case of Khurais, the 8.5 Gb figure was higher than the top of the estimated range of 4.4 Gb to 7.7 Gb. The range of total recovery for Saudi Arabia, calculated from the table, is 115 Gb to 216 Gb, and yet the number selected was not in the middle at 166 Gb but just over 200 Gb for the total recovery of Saudi Arabia. It almost seems as if 200 Gb was the number that the client of the report, the CIA, wanted so that the American oil companies could receive a high price for their Aramco shares.
The Rand Table indicates total initial recoverable reserves of aobut 166 Gb for Saudi Arabia.
“The Future of Saudi Arabian Oil Production" a US Senate Staff Report released in April 1979 was revealing about Saudi Arabia’s reserve situation just before the Saudi government became the owner of 100% of Aramco in 1980. Matt Simmons wrote about this as a separate issue in Appendix C “The 1974 and 1979 Senate Hearings – The Smoking Gun” pages 377-84 of “Twilight in the Desert”.
A key statement in this report is that
http://antiqbook.com/boox/strohm/52107.shtml
It is assumed that half of this 50 Gb increase from 110 Gb to 160 Gb is legitimate probable reserves. That means that the 201 Gb above need to be reduced by a further 25 Gb to give total initial proved and probable reserves of crude oil of Saudi Arabia of about 175 Gb.
Saudi Arabia will have cumulative crude oil production of 111 Gb by mid 2007 which gives a total reserve depletion of at least 63%. This means that Saudi Arabia crude oil production is in decline now.
Hi Ace,
Can you or someone else at TOD arrive at Ghawar's current production via the back door, i.e. total SA production - others fields = Ghawar. The other fields are much simpler structures so someone might get a better handle on the big one if we knew more about the rest.
It's just an idea for a future thread after Ghawar has been 'sucked dry' by TOD. Got to go now.
Ace - I'll try to adress some of your points:
1. Linking production to reserves decline - I think you are on thin ice here. I just don't think you can link production to reserves with such precision. For example, back around 1980, N Ain Dar was producing around 600,000 bpd - and presumably its reserves were much larger then! Perhaps you could do a plot tracking back in time Ghawar production using 5% decline per annum.
2. 211 Gbs URR too high - I tend always to use BP C+C+NGL. Figure 1, Part 1 uses C+C+NGL for reserves and production. To get this in line with C+C the figures need to be reduced by around 17%. This may be the source of some large discrepancies between my view and yours - so we need to take care to not talk past each other. C+C needs to be bulked up by around 20% to equate to C+C+NGL in KSA.
I do not like to exclude NGL from peak oil scenarios as it is part of the natural petroleum system and is of growing importance as crude production declines.
If you take Saleri's figure of 99 billion and times it by 1.2 you get 119 billion - which is a bit higher than my 116 to end 2005. The BP and SPE numbers used may not be so accurate as the Saudi figures. There is also room for obfuscation in neutral zone production and production shared with Bahrain.
3. I don't entirely buy into your story of the CIA, Rand figures being inflated. If we take Ghawar, for example, I just calcualted a reserves figure somewhere between 90 and 106 billion - way over the Rand figure. The mid-70s Rand data will not have included reserves made available with horizontal drilling (which allows companies to include lower permeability rock in reserves) or the high recovery factors that the Saudis appear to be achieveing. Just look at Abqaiq - it seems like they are achieving 75 to 80% recovery. The Rand figure for Abqaiq as well looks way too low. By 1975 it had already produced 5 billion barrels - and they only forecast another 7.5 billion. Further up the thread I describe Ellas and Jaffes' view on Abqaiq (63 billion initial reserves) that is outrageous - but I think 12.5 billion is probably too low.
Shaybah, that you discuss here
http://www.theoildrum.com/node/2476/0
has a reserves prognosis of the order 15 to 20 billion barrels. Rand says 7. I know you think 15 is too high - and I might agree, but I doubt its lower than 7. Rand will not have accounted for horizontal wells.
I don't know about the other fields and want to dig around a bit before commenting further on this. But at this stage I see no reason to dismiss Rand as inflated.
I want to start by getting some volume estimates on Abqaiq.
4. 2004 datum - this is the cause of some differences. I think I'm about to move my datum for Linux back to 2002 - and will then need to adjust for 5 years production.
All the best, Euan
Found some more cartoons. (pdf warning)
Ghawar
The Ghawar slide is interesting because the next slide implies the simulation was run in 2002. That would be about right for a 50 year run (like the Shaybah run also illustrated) starting in 1951. Of course, it's a simulation, with no indication how close to actual reality it is.
All this new computing technology is really amazing. How much more oil will it put in the ground?
Ron Patterson
It's reading tea leaves to an extent, but the implication of that talk is that older simulations and even the newer POWERS stuff is too optimistic on reserves. They're not getting out what the simulations are saying they should; there would be no justification for the new 2008 software/hardware if they were. So no new oil in the ground, yes; but it does look like they're losing some of what they already have.
The other thing that interested me is that their Shaybah simulation indicates that after 50 years that field is essentially over. Only a thin ring of wells will still be producing. That's with the best water management they have right now. Doesn't bode well for fields that have already been producing for 55 years.
Careful, you don't know what its showing (its not saturation) and the combine process slide pics predate 1998 (see here)
The Shaybah data however it probably good enough to come up with a solid number for reserves in 1998 - good catch!
You're probably right about the Ghawar slide. it was obviously heavily edited. If it is a POWERS run though, that would put it at no earlier than 1998, I think.
Your link seems faulty - try here
Good stuff Euan!
All this in-depth analysis of Saudia Arabia's situation is very interesting.
However the SA timeline is simply something which will evolve, analysis or not. Like Canute, we cannot change the situation.
Perhaps we should also be expending similar effort modelling the effect of future high oil prices and limited availability on the global economy?
Perhaps that would yield some results we DO have a chance of improving or modifying?
(More selfishly we might also be able to simply exploit what is to come at a personal or corporate level).
It would be very useful for my children to know if a career as say a taxi driver would be a winner or loser.
Should I invest in say wind farms - or mega insulate my house?
The answers are not obvious - in-depth analysis and/or simulation of our reduced-energy economic & social future might be very revealing and rewarding.
Great idea! You write the equations for how the global economy works and I'll do the programming.
I don't that we we need (or in fact can create) such equations.
Peak Oil role playing games such as found here: http://www.worldwithoutoil.org/
might however provide some useful insights.
Agent based simulations might also prove useful - although they do require some software/mathematical skills. For an interesting site see The Journal Of Artificial Societies & Social Simulation at: http://jasss.soc.surrey.ac.uk/JASSS.html
I feel that we are on the Titanic steaming towards the iceberg. A group of eccentric scientists on board have glimpsed the coming problem and are 100% sure that there will be a fatal impact. They are now trying to work out how severe the impact will be and exactly when it will happen to the nearest second. Many drawings have been made about typical profiles of the ice hidden beneath icebergs, and we are trying to merge this with the publicly available data about the iceberg released by the Captain ... who for some reason is convinced that there is no real threat.
Whilst I appreciate the hard work being done by these scientists, I feel that it is simply gilding the lily ... the fatal impact will come soon enough.
I would also like to see a similar planning group trying to work out how many lifeboats we will need, what portable food & water stores we have available and what actions we need to take to minimise the loss of life. The actions of this second group are likely to save more lives than any results released by the group of scientists.
Hi Euan,
Below are just some general comments about reserves and recovery factors which might be of interest.
Reserves - Geological, Technical and Economic Aspects
The Rand Table A59 defines reserves as the following from page 10 of the 1978 Rand report: "Proved reserves of crude oil are generally defined to be the quantity of crude oil demonstrated with reasonable certainty to be recoverable in future years from known reservoirs under existing economic and operating conditions".
These definitions are used in BP's annual statistical review data which you used in Part 1 - Figure 1.
http://www.bp.com/liveassets/bp_internet/globalbp/globalbp_uk_english/re...
BP Proved reserves (similar to Rand definition):
"the estimated quantities of oil which geological and engineering data demonstrate with reasonable certainty to be recoverable in future years from known reservoirs under current economic and operating conditions".
BP Recovery factor:
“the ratio of reserves to oil in place for a given field”.
The reserves are not only geological but must take into account engineering, economics and operating conditions.
The recovery factor is not used to calculate reserves, instead it is an output equal to reserves divided by oil in place.
Many geologists calculate estimated reserves by multiplying a recovery factor by the oil in place. This recovery factor might be similar to that of nearby fields in the same basin. The reserves are not proved reserves as defined by BP above.
The figure below is from this 87 page document.
http://www.spe.org/spe/jsp/basic/0,,1104_4544118,00.html
http://www.spe.org/web/ogr/OGR_Mapping_APPENDIX_A_15Dec05.pdf
Each country has its own reserve definitions. This chart shows China because it illustrates the differences between geological and economic reserves.
Click to enlarge
This chart shows the process for the initial petroleum in place (TPIIP at the top) becoming proved developed remaining economic reserves (PDRER marked with * at lower left corner).
In general, discovered in-place volumes are first classified as measured, indicated or inferred “geologic reserves” based on the phase of exploration and development. That portion that is estimated to be theoretically recoverable under given technological conditions is termed “technically EUR (estimated ultimate recoveries)” or “TEUR”. The equivalent recoverable reserve categories are defined as Proved, Probable and Possible based on the degree of geological confidence. Economic initially recoverable reserves (EIRR) are those quantities of petroleum that are anticipated to be economically recoverable under existing economic conditions and under current executed or planned to be established technical operating conditions.
An estimate of Ghawar’s total reserves might be equal to proved economic initially recoverable reserves (PVEIRR) plus probable economic initially recoverable reserves (PBEIRR).
Euan, I think your thorough calculations of Ghawar total reserves are greater than PVEIRR plus PBEIRR. Your total reserves assume some technical factors (eg sweep efficiencies) but economic factors are not directly considered. Therefore, your Ghawar total reserves might best be represented as proved technically estimated ultimate recoveries (PVTEUR) plus probable technically estimated ultimate recoveries (PBTEUR).
Economic factors which convert technical recoveries to smaller economic reserves include oil prices, capital costs, operating costs, development plan, operating conditions, production profile and required profit margins/rates of return to the Saudi government.
For example, water injectors are commonly used by Aramco. As water cuts increase (ie oil stained brine being produced), Aramco has to increase the volume of water to optimise aquifer support. This can require not only sourcing more water but building bigger water pipelines. This might not be economically or physically possible which reduces the amount of reserves. If the water pipeline is built, then the capacity of the downstream gas oil separation plant (GOSP) must be increased if oil production volumes are to stay constant. Water from the GOSP must often be treated (sulphide removal) before it can be reinjected.
In other words, there are many associated infrastructure (upstream and downstream to the each production well) and economic issues which have to be considered to convert technical ultimate recoveries into smaller economic reserves. Accordingly, your Ghawar high and base case technical reserve estimates might need to be revised downwards to estimate the smaller true economic reserves.
Really not sure about this Ace. Once you worked out how much oil is there then you need some how to work out how much will be recovered to get a reserves number. In a virgin field with no production analogs will be used. But Ghwar is no virgin - and we have ample oil / water satuartion data to guide likely recovery factors as I descibed in Part 1.
WRT different conventions for reserves calculations - there is a fundamental difference between OECD conventions and OPEC conventions - which I think Jeremy Gilbert failed to recognise. The OECD conventions are way too conservative (based on current knowledge and economics) and this results in "reserves growth" - the more money you spend the more oil you get.
ME OPEC have tended to do an estimate of what they think may be ultimatley recoverable at the outset - and the Rand figures IMO follow this convention.
As for economics - most of the investment to recover the oil I have booked has already been made, apart from Hawiyah and drilling the remaining producers required to get at the remaining pools. I don't see the Saudis running out of money to drill producers on Shedgum and Uthmaniyah.
As for my estimate being too high - you may be right, but not for the reasons you give. Aramco have not yet resorted to the simple cheap way of running their water injection - which would be to drill in-field injectors around the remaining pools in the N which would provide much more efficient pressure support. This would be done at the expense of sweep efficiency down the flanks. Their focus seems to be to push recovery factor to the limit.
I have a question mark in my own mind about Hawiyah - and need to read some more about this. I maybe over-estimated there - but I'm not sure.
In my post I documented 4 areas where I think I may have underestimated reserves - would you care to comment on those?
I'm working on a quick revisions / update placing Linux in 2002 and then compensating for 4 years production. This makes quite a differnce.
"recovery factors are not used to calculate reserves"
well in general i agree with that statement. however, euan is not assigning reserves.
if the only information available is ooip, one can or could apply a recovery factor (by analogy) to estimate "recoverable oil". and it seem that that is all we really have here (and what euan is doing).
there seems to be general agreement that ooip for ghawar was 160 to 190 gb. further, there is not much doubt that cumulative production is about 60gb. will production decline by 10% for recovery of 95 gb or decline at a lower rate to 110 gb recovery, or follow some other production profile ? we just dont know.
Good work Euan. So the conclusion, after considerable analysis, is based on assumptions. Assumption = guess, however informed.
I do not know why your post makes me want to scream idiot. Maybe it is the visceral response I have to a disingenuous analogy. Guess does not equal assumption. I would not characterize these discussions based on guesses; I would equate it the approach of this modern day scientist.
Wow, I see the light.
Ghawar will peak somewhere between 200X to 20XX assuming yadda yadda. But it might peak earlier or later. It all depends on what really happens.
You're right. No guessing there. Just pure scientific hypothesizing.
Serengiti is just trying his lawyer tactics out. They are poor tactics and probably result in a court record that is less than stellar, or is it, Oh yes, this type of talk is more familiar from an attorney that does divorces regularly.
Full of blowhard wizbang like a wiffle ball player that thinks he is in the big leagues.
Quid Clarius Astris
Ubi Bene ibi patria
Developed along OECD oil company lines, Ghawar may have peaked at around 10 to 15 million bpd some time in the 1980s. Its oil would have been sold for 50 c and barrel and the reservoir would now be a mosaic of flooded zones and by passed oil, a lot of which would never be recovered.
But that's the fairy tale that never happened. Ghawar was denied a climax, and has been drained systematically with maximising ultimate recovery in mind.
I suspect my production decline models will turn out to be pretty accurate give or take a couple of years.
Paradox in the Desert
The vice president of ARAMCO was quoted by PIW:
"One challenge for the Saudis in achieving this objective is that their existing fields sustain 5 percent-12 percent annual "decline rates," (according to Aramco Senior Vice President Abdullah Saif, as reported in Petroleum Intelligence Weekly and the International Oil Daily) meaning that the country needs around 500,000-1 million bbl/d in new capacity each year just to compensate."
See quote at:
http://www.eia.doe.gov/emeu/cabs/saudi.html#oil
Was Saif referring only to his worse field cases? How many fields were affected? It could not be their newest field.
Was N. Ain Dar the 12% decline or was it Abqaiq, or both?
It is not an exact match with some of the statements of immense oil field reserves in all existing fields.
Someday the murky oil industry in the desert might be better revealed.