Jeremy Gilbert's Comments on TOD Saudi Analysis
Posted by Stuart Staniford on April 12, 2007 - 9:47pm
Born and educated in Ireland. Moderatorship in Mathematics from Dublin University. Joined BP in 1964, worked as production engineer in Libya and then helped introduce the new technique of reservoir simulation into BP - working in Libya, US, Kuwait and Abu Dhabi - prior to eight years in Iran in reservoir engineering posts and as Planning Manager. From 1979, supervised BP’s North Sea reservoir engineering and later managed all BP’s UK petroleum and reservoir engineering activities. Worked in San Francisco as Vice President of BP Alaska Exploration before returning to UK in 1987 as Technical Manager for the development of Wytch Farm field. Appointed BP’s Chief Petroleum Engineer, responsible for the company’s worldwide petroleum engineering performance and for an associated R. and D. program, in 1988; later became Resource Development Manger, overseeing technical recruitment and helping design and implement the ‘Challenge’ program for new staff.Steve Andrews and Randy Udall at ASPO-USA asked him to comment on recent Saudi Arabia discussions here at TOD. The verdict? Read on...In subsequent posts worked on a range of staff development, equity and major legal issues in London, Houston and Anchorage. Retired from BP in 2001. Is now Managing Director of Barrelmore Ltd., a company providing technical audit and training support to the oil industry worldwide. Has been Chairman of Heriot-Watt University (Edinburgh)’s Industrial Advisory Board, a member of ImperialCollege (London)’s and of University of Alaska (Fairbanks)’s Industrial Advisory Boards, an external examiner for Masters’ courses at Robert Gordon’s University (Aberdeen) and Heriot-Watt Universities. Has also occupied several significant posts in the Society of Petroleum Engineers, including that of Chairman of the London Section. Lives in West Cork, Ireland - where he and his wife own a bookshop.
- SS: Saudi Arabian Oil Declines 8% in 2006
- EM: Saudi Arabia and that $1000 Bet
- SS: A Nosedive Toward the Desert
- EM: Saudi Production Laid Bare
- SS: Water In the Gas Tank
- HO: Of Oil Supply trains and a thought on Ain Dar
- SS: Further Saudi Arabia Discussions
- SS: The Status of North Ghawar
- HO: Simple mathematics - The Saudi reserves, GOSPs and water injection
- Ace: Further Evidence of Saudi Arabia's Oil Production Decline
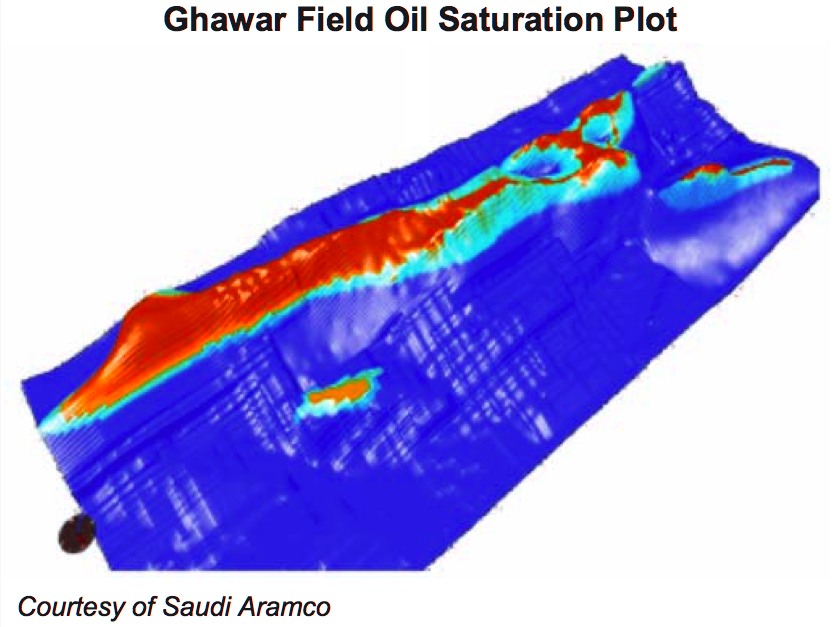
Lots of questions - not so many easy answers!Also, this is totally unrelated, but I'm putting it here for the sake of somewhere to put it. Various folks were complaining about the Linux supercluster oil saturation picture having the opposite color convention from the various SPE paper cross sections. On the plane earlier this week, I had time to do a little image processing code, and here's a better one:Yes, I have read through the Oil Drum articles and comments and also the Peak Oil News article.
I am amazed at the energy and diligence which the authors exhibit in carrying out their analyses. It is, of course, almost tragic that the Saudis won't release more detailed performance data - and their own analyses - which would show the situation clearly and avoid the need for the painstaking work reported in Oil Drum. The conclusions reported seem to me to be credible but I have to emphasise that in any reservoir engineering analysis there are almost always more unknowns than equations. As a result, one is generally faced with having to make estimates for part of the solution and then be concerned about the uniqueness of the solution derived. This is a situation which users of complex reservoir simulators are continually faced with.
It seems likely to me that the conclusions the authors have reached about Ghawar's current status are broadly correct. However, it's a big step to take from concluding Ghawar is currently at or close to maximum achievable production rate to saying that that rate cannot be maintained, or even increased, through the addition of additional production wells, through increased or more efficient water injection schemes or through surface facility modifications. Oil companies employ reservoir engineers and reservoir geologists, and use massive numerical analyses, to deal with just the situation we probably have here: "a mature field is showing signs of declining production with its current development, what can we do profitably which will change this situation?"
Does the situation which the Oil Drum people have described mean that Ghawar's production rate is about to decline? Possibly, but not necessarily. It depends on the amount of additional investment that would be required to address the problem and whether the cost of this work is economically justifiable. The answer to that depends a lot on the oil price scenario which the company has adopted.
I think the problem with what the authors are doing is that they have got to the limit of what can be achieved by well-meaning amateurs who have limited access to geological and reservoir data. Any more detailed analysis requires reservoir engineering expertise and better data. Sorry, but in my opinion it's just not possible for the authors to produce results which are as definitive and reliable as those produced by Saudi Aramco's professionals; they are the people who will decide Ghawar's future.
Now for your 'separate' queries!
1. Reservoir Modelling prior to project sanction.
Right from the time a successful discovery well is drilled the geologists will put together a 'whole earth' model, using PETREL or similar software. This contains all the geological and petrophysical data available and is continually updated as more data is collected. Reservoir engineers will upscale the 'whole earth' model to produce a less complex (smaller) model which can be used to simulator the future performance of the reservoir. Over the years when the field is being appraised hundreds of prediction runs will be made showing how recovery efficiency can be influenced by varying well numbers, well locations, well completions, pressure maintenance and gas/water flooding, different production profiles. The best of these prediction runs will be used as the basis for making a decision on whether or not to proceed with field development; the total cost of the development will be assessed, the future production defined; DCF analysis can be used to decide if the project would be profitable - and to rank this project against others that the company is considering. Once the company's board have approved the project and development drilling begins the numerical model will be continually updated with many prediction runs being made. These will continue through field's producing life as history matching becomes possible.Although BP's geologists forecast 13 billion barrels of recovery from Prudhoe, the field facilities and TAPS were designed for reserves of 9 billion. Field life was predicted to be about 25 years at the time of sanction. The field stayed on plateau longer than predicted and the decline rate post-plateau was much less than had been predicted.
Contact
- Content: editors at theoildrum dot com
- Tech support: support at theoildrum dot com
License

This work is licensed under a Creative Commons Attribution-Share Alike 3.0 United States License.
This brings about another possibility; a step function in water cut and total fluid production.
Let us suppose North Ain Dar "waters out" over the space of, say, 6 months. Water cut climbs (made up #s for example) from 33% to 92% ! This rapid climb is only possible because of the superb quality of the reservior.
Total fluid production before was 1.5 million b/day = 1 million b/day of the good stuff (more likely #s for North & South Ain Dar combined).
One can note the large volume of yellow mixed oil & water underneath the rapidly shrinking dry oil at the crest.
Could North Ain Dar be redeveloped to produce, say, 10 million barrels/day total fluids (it is good rock), 92% water cut with oil production of 800,000 b/day (still down 20%) ? Or something comparable.
GIGANTIC GOSPs would be required ! Is there any indictation of such on order (I know some are on order).
I think this is what he is saying.
If I interpret his point correctly, then I can also discount it (with very low confidence). Possible, yes, but is it likely ?
North Ain Dar will NOT be plugged and abandoned in my lifetime (should I live another 50 years). It will be redeveloped. However, any redevelopment scheme for a watered out reservior is unlikely to maintain current oil production rates, or even close IMVHO. Aramco is NOT a share holder company that operates entirely on Net Present Value.
The answer to that depends a lot on the oil price scenario which the company has adopted
Saudi Aramco has more pricing power than any other oil company (or nation) in the world.
Best Hopes for Rational Planning,
Alan
Alan; You are correct, Giant Gosp's or Gathering Centers are being built. SK Eng'rg of Korea is won the contract for GC-24 This particular one was damaged when Iraq invaded Kuwait. However, I believe oil service companies will become busy going forward.
If higher water cuts are the norm, then bigger OWS facilities will be announced. You can extract additional oil out of a declining well/ field by increasing pumping rates and separating equipment, but then you going into demand destruction faster.
Good barometer of this issue imho
OCB
Thank you very much Mr. Gilbert.
Back to the Data.
Whilst you'll was arguing about how well ol Dolly would survive PO, FF was burnin the midnight erl crouchin ov'r the digit-tizing tablet with good ol' SPE 93439er (which don't hav nuthin cordin to much expurts) and doin massive linaer interp'lations with his 386 deep in the Holler.
Alan from big easy is lookin for a step change in water cut
Jeepers- gander at that 33% production drop pert near good ol 98. Oil prices????
Devil -lopin......
F_Flow...just to state what I am assuming is obvious here...
Blue = water
Green = oil
Correct?
Yep. Standurd Erl Bidness Colours.
Hundruds of Thousands of Barr'ls Pur Day
Excuse me for being dense, but isn't this just an extract from fig 1 of that doc? I'm missing where we know the production drop is due to something other than artifical contraint?
OPEC quota increases 10% 2.5m Jan 1 1998
quota cuts 1.25m Apr 1 1998
quota cuts 1.335m July 1 1998
Garyp-
Where I come from we don't have no valve that can turn off the oil and keep the water a comin.
FF
but mother nature has a valve that does the opposite.
FF
Yes, but at least in fig 1 the blue line is the water cut %age. Turn down the flow from a few typical wells and you would expect the %age to stay that same (assuming you can turn down the flow, I expect that's the case).
Just playing devils advocate, it is very similar to the time when oil prices went into a downward spiral...
If you're turning off high water cut wells to rest them, the water should come down too, right?
Your next question- Oil Production for Total Wet Dry
Emailing you my data- verify it is to your liking
FF
OK, if I get this right you've reversed the ratio data towards the back of the doc (fig 10?) to generate kbpd from wet and dry areas, given the total production figures?
The figures tend to show a significant event in mid 1992 that increased the %age of oil produced from 'wet' areas, but without changing the water cut %age rate of change significantly.
In mid 1993 action was taken which stabalised the water cut %age somewhat, but didn't change the %age of oil that came from 'wet' areas.
In mid 1998 the %age of 'wet' area decreased sharply, back to its pre 1993 level, as the total production decreased. %age water cut took a small step change from here to 2000.
The %age of dry oil has been gradually increasing since then.
OK, so what does it mean?
Dr. Husseini
Buried in the text down the page
http://www.saudi-american-forum.org/Newsletters2004/SAF_Item_Of_Interest...
Look at the previously debated xsections. THe water saturations are 65% when the residual oil saturation is 21%, the theoretical end point water saturation is 79%. To take the post breakthrough water saturation as high as you can ... is where the potential lies.
The crash of this 200kbopd around 1998 might have been caused by shutting in the best oil cut wells in the wet area... only 20,000 bwpd was lost. But why did the dry oil area production increase at the end of this drop and continue on an upward trend ????.... Possibly answer- the oil was needed to supply world markets.
You are trying to post peak model- what happens when the degree of freedom to pull the dry area is gone??
FF
OK, try this on for size.
1991-1992 the waterfront nears a set of vertical wells, all along a isofront. As it does so the watercut increases.
1992 the waterfront nominally hits those vertical wells, converting them to nominal 'wet'. However you can still produce at about the same level without too many issues.
1997 production begins to drop off.
1998 you take significant action, cutting off some high water cut wells, drilling new infill higher up the slope to increase the number of dry wells. Overall the water cut situation continues to get worse (why?).
1998-1999 you stabalise the production figures.
1999-2005 you continue to drill new wells, possibly vertical to horizontal sidetrack conversion, probably MRC to keep the water cut and production to a figure.
I'm not convinced it explains the shape.
I cannot see any high water cut wells being shutin on the water produced.
1998- You sit around in meetings all day and discuss "where is it going to bottom" .... where can we make up this production... "we have to start producing the crest " Is it not interesting that there was no where else to turn but to violate the "prime directive" in the most mature field.
... this period is not defined by action, but by inaction.
You are right to see dry oil wells being assimilated by the Borg of the wet area... it had to happen on that WOR vs. cumulative oil that you have.... look at the production logs in 93439.... I did an exponential fit of the WOR versus cumulative but that includes the influence of absorbing those good dry oil wells..... if that field has no more dry area (which was the point of the last 3 weeks discussion) Where are we now???
1998 has to see either new dry wells, or wells reclassified as dry after sidetrack drilling - how else can dry area production increase.
However the water cut rate of change increase doesn't tie in with that.
Are you sure you've comparing apples with apples? Where did the water cut %age come from? Its not measuring the physical geology rather than the well classification is it - they would be two different things and might explain things, a little.
open a choke???
C'mon guys....Fractional Flow just gave you the proof of the looming catastrophe on a silver platter. He might be the next deep throat. Look what he found that Mr Hussieni said:
"if cost cutting strategies and high risk production
practices are allowed to prevail, the consequences can be both
devastating and sudden. Examples of such ill considered
strategies might be an early shift to in-field water injection
patterns, a shift to dry crestal production strategies away
from wet flank areas..."
DRY CRESTAL PRODUCTION!
That's what they've been doing the past few yrs and FF's data shows that.
So they are doinng the worst possible thing the last 3 yrs!!!
Desperation.
They are drilling the crests, opening up every well they have and just plain producing flat out to try to keep production up. In the VERY near future the whole thing will collapse. Maybe by the end of the year...
So...if this is true...back there in 2000-1 timeframe...KSA and BushCo "probably" knew there was going to be a problem with Ghawar...SOON...meaning 3-4 yrs. down the line?
Just trying to piece together my conspiracy theories.
Stuart,
Thank you for getting Mr. Gilberts remarks on TOD. He is a man with impressive credentials, and a seemingly well balanced view of things, not "cornucopian" nor "run for the hills!"
The central point of his remarks seemed to me to be: It's a tough complicated business, and it's in the Aramco specialists hands now.
One cannot help but notice that he seems to have a fair amount of faith in their abilities, and does not show any indication of thinking that they are telling outright untruth, at least not knowingly.
I said in a post the other day that I hate to bet against the Saudi's money. We can watch where they are spending it, on the assumption that they don't want to willingly just throw it away, and "follow the money" to borrow an old phrase. This brings to point Alan's remarks about the giant gas oil seperation units. Are they spending that kind of money? Also Khurais and the empty quarter, how much are they spending? Would they spend it on fields that couldn't deliver payback? That seems unlikely.
But, there is always the risk that they simply are at the limits of their own knowledge. That the world is now so relient on such a small area of the globe for it's energy and economic, perhaps even cultural survival, should not give us great comfort. We are hanging now by a thin thread, and that thread is in the Saudi desert.
We should be prepared for anything.
(edited for correction, and in consideration of Alanfrombigeasy's remarks)
Roger Conner Jr.
Remember, we are only one cubic mile from freedom
"Follow the money" Indeed!
Another saying from the political world (which is intertwined in all this) "Watch What They Do, Not What They Say". Obviously, GOSPs would be exactly the kind of thing to look for, along with water pumping stations, pipelines, etc.
Knowing what we know now about how Gov't political types can "influence" civil servants, even in more open gov'ts like the USA, I presume that the same thing is going on in KSA with its Oil ministry, and the companies doing business with it. Something along the lines of "Yes, the emperor has no clothes, but don't you DARE say anything about it to anyone!"
Franc (penguinzee)
Taken out of context, Jeremy Gilbert's comment would appear to dampen Stuart's analysis. But consider these points:
1. Brent Crude futures prices remain quite high
2. KSA production has dropped
3. Stuart developed an explanation consistent with the public evidence for the drop, which was a high-level depletion analysis involving the timing of KSA mega-projects
4. Prompted by Fractional_Flow, Stuart performed an in-depth resevoir analysis providing support for the depletion assumptions in his first argument
Others here have argued that the presumably well informed Saudi Aramco professional management have biased their public pronouncements for political reasons. So it is all well and good as Jeremy Gilbert says for these professionals to manage their resources wisely and with the best information, but how does that help us know more about the unfolding crisis?
Surely a truism, but it is relevant ?
A few hundred professionals (with perhaps a half dozen senior experts on the top) with access to ALL the data (and new monitoring wells drilled at their request), decades of experience, no constraints on computational & software resources, etc. certainly can produce better projections than what The Oil Drum has available. However, that information is behind a wall.
The relevant question is can TOD extract enough information to get a better understanding of what is happening, and likely to happen, with North Ghawar ?
I think the answer is yes, with error bars and relatively low confidence.
As I posted a while back, taking a string of the most likely of the alternatives will give one the most likely outcome; but the confidence will be low (less than 50% probability in many cases).
In this specific case, I think that Stuart's conclusions are more than 50% likely to be right and an error (misplacing that North Ain Dar cross-section profile is the most critical one) will affect the timing of watering out but the trend is clear and rapid watering out (whenever it happens) IS ANOTHER VERY IMPORTANT CONCLUSION !
Another important conclusion is that North Ain Dar, South Ain Dar, Shedgum and Uthmaniyah are all likely to collapse within a few years of each other.
Another means of predicting the future is tracking equipment buys by Aramco and interpreting them. Their forecasts and resulting plans will be reflected in their purchases. And there is always that "spy in the sky" from Google Earth, etc. and rumors and leaks.
In summary, IMVVHO, Stuart's conclusions on the near term (today ?) decline rates are both alarming and most likely right. However, there is a good chance that he is in error by a few years.
Other important conclusions are that
1) a complex that recently produced 4 million b/day are all at similar points of decline.
2) This North Ghawar complex is composed of at least 4 "high points" and these 4 points will water out independently of each other.
3) Watering out is likely to be a fast process with dramatic rises in water cuts on the order of days to months. This rapid watering out is possible because of the very high quality of the reserviors.
Anyway, that is my take on it all. When I have a spare day or two I will reread it all for better understanding :-)
Best Hopes for the Truth,
Alan
You couldn't run the GOSPs without extensive process data. The Saudis have years of data on GOSP operation, which wouldn't tell you much about any individual well, would certainly tell you a lot about the aggregate field. Aramco could instantly prove the point one way or another by releasing five years of GOSP data.
One thing that I keep remembering, and which should be kept in mind throughout this discussion, is that the data Stuart et al are working from is THREE YEARS OLD. (I apologize for the shout, but I think it is important to keep in mind that today's data is likely much worse.)
Alan, you say, "However, that information is behind a wall."
Maybe it's behind TWO walls. In 1977 the CIA correctly predicted that the Soviet Union would peak in the 1980s (doc on CIA's FOIA Web site). It will be a sad state of affairs if we learn too late that, in the name of 'National Security' the CIA kept, behind its wall, the info that the 'working middle class' (Clinton's term) needed so it could prepare.
Mr. Gilbert is a professional in the business. The vast majority of professionals failed to foresee the Texas and Lower-48 peak and decline. The vast majority of professionals failed to foresee the peak and decline of the North Sea. The vast majority of professionals failed to foresee the peak and decline of Yibal. I could go on (and on and on) but the record of these professionals is not heartening either.
Brent futures have continued to rise. IEA is saying OECD stocks are at dangerous lows. OPEC, including KSA, refuses to increase production. The world appears to be running a daily shortfall of at least 1 mbpd that is being covered by stock drawdowns.
But all is perfectly well because Aramco professionals say it is? I find this appeal to higher authority unconvincing in light of current events.
Ghawar Is Dying
The greatest shortcoming of the human race is our inability to understand the exponential function. - Dr. Albert Bartlett
When Texas went to a 100% allowable in 1972, there was widespread shock in the industry when oil production started declining in 1973.
According to Matt Simmons, the majors working the North Sea were predicting a peak around the 2009 time frame, while the humble HL method clearly was pointing toward a peak around 1999 (when the North Sea, on a rock solid HL projection, crossed the 50% of Qt mark).
In the Yibal Field, which like Ghawar was redeveloped with horizontal wells, Shell was expanding their surface production facilities to handle an expected flood of new oil, when they instead had to deal with a flood of new water, as the horizontal wells started watering out.
IMHO, Gilbert's response is mostly a case of "Sour Grapes:"
An exceedindingly smart, hard-working -- and perhaps bolder-- "amateur," in the name of SS, has beat them all in acurrateley predicting Saudi deline.
Also, RE the end example of Prudhoe Bay producing more and longer than anticipated.... what about the North Sea example of peaking earlier and declining faster than anticipated? This example always sticks in my mind when talking about the oil company engineers with all the sophistication and access to all the data. They can still get it spectacularly wrong. Ditto for Shell (I think it was Shell) and Oman. The Prudhoe Bay example seems designed to give the impression of the BP engineers being conservative in their assumptions. Other examples show a different picture.
Prudhoe Bay oil could only be shipped out via the pipeline, and that pipeline was very expensive to build, and was built at a certain size. Thus eventually the rate of extraction had to plateau at the pipe's capacity for a while, no?
I think that you are talking about the Yibal oil field of Yemen. Shell put real $$ into processing infrastructure that was not needed as Yibal quickly watered out. (Does anyone have the stats on just how quickly Yibal watered out ?)
Best Hopes,
Alan
Stuart has put forth a hypothesis and supported with some good data. However, Gilbert is only verifying what we all know, and that Stuart's hypothesis will be proved out in the future by Saudi oil production since Stuart's hypothesis has some uncertainty in it (mainly that the Saudis may have a few oil production tricks up their sleves), or that they may have in fact turned down their oil production.
What is also interesting to note is that I believe that Skrebowski's forecasted total liquids peak two years ago was 2010. Since then I believe that he now has been convinced that Saudi oil production has also peaked (Ghawar is in decline) and thus the total liquid peak will be in 2009 instead. Thus, the difference that Ghawar makes in the whole scheme of things is one measely year. WhoopDeDoo We are still headed for a train wreck...
Retsel
I am the merest of lay readers.
But here's what it's like:
A magnifying glass held over a stunned insect.
"So it goes."
The point I made earlier was that not only were there no signs of the contract from SA necessary to bring such a thing about, when you look to their in-house technical journal they are not talking about "how to extract even more from mature reservoirs", they are talking about gas and refining.
Now maybe, once they have their new megaprojects onstream they are planning to go back and attempt to force a little more from North Ghawar. But that will be at a much reduced rate, and won't last that long in anycase.
Which brings us round to the key question. If there were an attempt to force longer, high flow rate from North Ghawar, where is the practical sign of it, given the demonstrated situation of those reservoirs? Without those signs, surely the unique solution is that further effort does not form part of their short to medium term planning cycle?
garyp,
I like how you are playing devil's advocate here.
Saudi Aramco is on the forefront on how to reduce water cuts at the lowest cost. They have worked on and expanded horizontal wells and related technology. They use placement of injectors and pair them with oil producing wells. They use different injectors like acid HCL and emulsion. They use different pumps to increase pressure on low pressure wells. The list goes on and on. SPE papers on these types of solutions and their latest results have been published.
Saudi Aramco is betting heavily on these different methods to reduce water cut and keep production in a 1-3% decline rate.
nth-
They can make the water go back from whence it came.
Since 1988
um, could someone please explain the color codes to us plebs?
The black data is the water oil ratio bwpd/bopd for the wet area of North Ain Dar... the straight line is an exponential fit through the data.
The blue is the Water Oil Ratio for the entire field.
The purple is the oil production curve for the wet area.
The x axis is the cumulative oil produced since 1988.
Graph really shows how good Aramco is at managing water -like nth says best in the world above and how the paper "North Ain Dar Water Management" which is the only known source of evidence in existence of Aramco's water management skills clearly shows this.
Note: Wet Area WOR with 99% probability includes the acquisition of several dry oil area wells over the time period plotted.
FF
I think this is a relatively prudent way of presenting an arrogant "amateurs-can’t-do-any really-useful-job-on-our-very-difficult-field-of-knowledge" kind of statement.
However, this is totally wrong.
Obviously (as Stuart himself has proved on his set of articles on the Saudi production), educated “amateurs” with a good scientific background and with the will to spend some effective studying effort CAN understand, discuss and produce relevant work on oil field production (and on almost other field of knowledge I can think of).
Moreover, Simmons’ “Twilight” and Stuart’s recent articles on TOD are, beyond doubt, the best (early, well researched, well documented) alerts ever produced over the future of Saudi oil production: a key point on any PO analysis.
It is true that the available data is very limited.
It is also true that a good professional working with no time constrains (and free to develop politically or economically unconstrained conclusions) could probably produce an even more precise analysis.
But the fact is that up until now nothing better has been done!
And I would bet that Simmons’ “Twilight” and, more recently, Stuart’s analysis presented here in TOD had a more profound impact on the community of the oil production analysts than any of the SPE papers ever written…
In fact I even think that the extremely important “Water in the Gas Tank” (by the way, it is not listed in the list of TOD articles SS presents above?!) was one of the main reasons behind the subsequent rise in oil prices (especially for medium and long time frame futures).
I, myself an investor in crude oil futures, was not fully convinced by Stuart’s first post on the subject, and had the same doubts Euan presented in his first response.
But the “Water in the Gas Tank” (introducing the analysis of the time evolution of water saturation of North Ghawar) dissipated most of those doubts.
The following day I reinforced my long positions on long-term oil futures, and so I followed closely the subsequent evolution of the oil futures prices:
My feeling has been that the subsequent price evolution (an oscillating but significant rise) is much more due to the increased confirmation of a near term PO following Stuart’s post here in TOD than to effects of the British sailors episode or to the confirmation (by the IEA and EIA numbers) of the present “strange” second quarter insufficient world production (this last could be explained away by the OPEC quotas, and would not have a significant impact on medium term oil prices if it was felt as a transient voluntary effect easily corrected by a future lifting of artificial restraining quotas…).
Impressive post. I dont know you (who knows who around here), but it is surely interesting to hear how peak oil stories influence each and other personal decisions. To hear about actions put things in perspective (more than what people plan to do).
Keep us updated if you wish. Cheers.
Ming...I also believe that some fairly important people keep up with TOD and the recent debate and it is influencing decisions and events in subtle ways.
Or perhaps this is just my HOPE?
It is not just your hope, it is true. I am a Swiss portfolio manager investing in resources and the TOD is an absolut "must" to read.
If (I am sure it is) the basics are only about 51% true what TOD is saying, then we are on the edge of a multi century change in energy use. A multi century change from burning things (fossil fuels) towards minerals (nuclear) and alternative energies (ethanol=agriculture, solar and wind.
There are HUGE investment opportunities around. Because life goes on with peak of oil.
Hello Brutus11,
Thxs so much for your post. Perhaps, you and other portfolio managers might consider setting up an endowment fund to further enhance TOD research and funding of a professional PR outfit to rival CERA [Do you buy and believe CERA reports anymore?]. I will leave it up to you to email Prof. Goose if you wish further discussion.
In short, I believe TOD is ready to evolve into a huge, professional open-source forum if interested institutions and individuals can get the ball rolling. We could buy sophisticated modeling software, and hire fulltime Reservoir Engineers and FF-Production Specialists, along with PR experts. Pickens, Rainwater, and Simmons--can you help flog this idea along?
Imagine merging ASPO, SPE, and TOD into a huge database and discussion forum. How much does it cost to rent time on a 100 teraflop supercomputing supercluster?
Bob Shaw in Phx,Az Are Humans Smarter than Yeast?
Bob
Please consider that much TOD credibility comes from the fact that it is amateur.
Also consider that the big boys who do have the software and the big CPUs are apparently coming here and reading.
And take a bow. You deserve it.
Well...nice to meet you brutus11. Perhaps it would be enjoyable for more of us to introduce ourselves that care to:
I'm Chris Wright from Lee's Summit, Missouri, USA. I am an Inventory Systems Support Analyst for a company in Kansas City, Missouri.
In a former life, I researched environmental impacts of pollutants on aquatic ecosystems. Used to pay the bills, now just a hobby.
There are all different types of folks here and it is the power of TOD. The vast diversity of knowledge here is immense.
We have had someone claiming to Hugo Chavez, politicians, economists, insurance actuaries, all forms of petroleum industry types, biologists, poets, economics professors, doctors...it's mind-boggling...
Who am I leaving out?
Might be a cool thread to start for those that want to share their backgrounds. I know it's on our personal profiles, but it could be fun to discuss further...just a thought.
"(by the way, it is not listed in the list of TOD articles SS presents above?!) " Oops - fixed.
If I read his post correctly he "broadly agrees" with the estimations done here. I would interject this is what I wanted - a broadly correct answer. I don't need April 13,2007 is national PO day.
Broadly is close enough for me.
HL is close enough for me as well.
It has been a gut wrenching 1+ years reading posts here. I think it is time for me to get "extra" busy.
Great posting here btw (sans freddy & hothgor).
Best D
'I think the problem with what the authors are doing is that they have got to the limit of what can be achieved by well-meaning amateurs who have limited access to geological and reservoir data.'
Interestingly, though you can never be sure who is a dog on the Internet, several of the commenters do not seem to be amateurs. And as for that limited access to data, that pretty much describes everyone outside of Aramco.
Which leads naturally to -
'...it's just not possible for the authors to produce results which are as definitive and reliable as those produced by Saudi Aramco's professionals; they are the people who will decide Ghawar's future.' He is right about the people running the fields determining what happens to the fields - the rest seems amazingly confident - after writing this in the preceding paragraph - '...but I have to emphasise that in any reservoir engineering analysis there are almost always more unknowns than equations.'
So trust the professionals, who almost always deal with more unknowns than equations, because the professional handle the unknown better than amateurs?
Tell me again - was it BP that believes maintenance is an unnecessary cost when running a pipeline or refinery? Somehow, the results of running your operation into the ground in the pursuit of short term profit is an easily understood equation, with little in the way of unknowns.
I trust BP deeply, since after all, they are Beyond Petroleum. Maybe there is a connection between those maintenance costs and the marketing slogan, after all.
As for that Prudhoe decline rate - guess the geologists didn't have anything to do with the depletion rate of the pipeline walls - and yet, the oil delivered is what matters, not the oil in the ground. A point he seems to have glided right over in terms of what is still recoverable after the flood in the desert, so to speak.
This comment and the other comments above criticising the critic (against us...(?)) I agree with fully. I think aramco nor the other big ones have little credential in knowing what to say, nor what the actually internally company knowledge is. They have made equally many mistakes as the free-thinking amateur analysts.
I found Gilbert was kind of patting on the head of the favorite pet dog (Stuart?). F**k that! Lets go show them.
Jeremy Gilbert.
As you would seem to read the Oil Drum on occasions, in view of your comments on the Saudi and Ghawar production issues I wonder if you would mind answering three questions when time permits.
1. As a former BP Chief Petroleum geologist would you agree or disagree with the on going BP yearly statistics of greatly increased reserves from 1988 onwards and the lack of reduction of these reserves due to production depletion and any significant major discoveries?
2. In view of the stated figures of M.K.Horn and Associates in their report of the World's Giant oil fields in 2004, using the previous data from Halbouty, Carmel, St.John, Beydoun, Nehring and other highly qualified geologists, why would you suppose that Ghawar and other Saudi fields might not be in serious decline? In 2004 their report shows Ghawar as 79322 BBOE depleted with 17766 BBOE to go from a URR of 97 BBOE. With production since then this now puts that field at around 86% depleted. In your professional opinion, do you know of any giant field anywhere in the world that would not be depleting after this level of production over fifty years?
3. As the major oil companies, including BP have been in the middle east for nearly 100 years, don't you think that they have pretty well explored and understood the geology and reserves of the whole Arabian Plate and were in a position up until the 1980's of knowing this information and since then still being informed from service companies doing business there? The size and reserves of the major fields in the Middle East have been known for a long time and the URR of 900 BBOE ( including gas) for the whole area has not been challenged to my knowledge. There seems to be a contradiction here in what you are saying.
Ah Down Under...I was wondering when you would show up!! You have been missing from the whole debate here in the last week or so.
What is your take on the analysis of SS and F_F? Are you 100% their observations or do you have more info to provide?
I think Gilbert has his opinion and it is that. He has brought little evidence to counter anything here at TOD. Until he "puts up" he has no counter arguement.
Dragonfly,
I have been watching the whole debate and not being a reservior engineer didn't think any comments I could make to the whole water/oil issue would be of value. I think SS and FF are very conclusive in their assessment and I was able to give Stuart some links which he may have used.
I have not had the time to spend finding information which I know is there, on the whole reserve/production issue but from information I do have I doubt the whole Middle East has more than about 200 Billion barrels left, Saudi about 60/70 and Ghawar about 13 billion of which some would be gas (from five separate sources it seems to have had about 80/85 billion of oil out of 97 total oil and gas). I have come across a report done for the CIA in 1978 giving all the reserves and production for the Middle East up to that ime and when used in conjunction with other reports it should prove enlightening
DU...even if you're not a reservior engineer...for some reason...I trust and value your comments. You are concise and humble...and you appear to be quite familiar with KSA.
So, whenever you write...like F_F...I know each word packs more value than most.
Down under:
Do you seriously believe the man is going to come on this blog and answer your questions, after his EGO has been seriously questioned. I would be shocked if he did.
Old Hermit
No I don't but he might through Stuart
Wow, this is an important piece. It may be my lack of language skills but here is a text which seems as supportive or more than the GAO report. It is very far from what I initially expected.
First of all, the text remains very ambiguous with that kind of twisted logic and syntax you can expect from such an important person. Of course he has to do that for a number of reasons: he doesn’t want to wake up in the morning with flat tires, he must always be able to say “but no, I didn’t say this but the opposite” because he knows that no one really knows the future, a fact he has painfully learned in his lifetime.
But this ambiguity on the surface doesn’t prevent a certain lifting of the veil on his personal opinions. For instance see the following:
which seems to imply that as a person he can believe what is written by Stuart. What he uses to weigh against this is mere uncertainty! Yes, I believe I read correctly that he says that the conclusions (ie ghawar is watering out) are credible to the extent of what we know. To the contrary, if the conclusions are found to be false it must be because of what we don’t know yet (he says that there are often more unknowns than equations). Given the fact that the best engineers of the world are working on these uncertainties, it does probably reduce the importance of the “unknown” facts. So the word “almost” he uses in his phrase has a higher logical value than a first order reading would evoke.
I also very much liked the next paragraph. First of all he repeats:
May I also repeat: i.e. Ghawar is beginning its decline.
The next sentence is the core of stereotyped doubt casting while acknowledging the underlying truth :
This sentence seem to be a critique of a logical implication : ghawar is at a maximum achievable production rate => the rate cannot be maintained or increased. The funny thing is that by doing so he seems to decrease the importance of the conclusion, not the first statement. So logically speaking he fully agrees with the fact : ghawar is at a maximum achievable production rate. Now then, how can he disagree or nuance the conclusion ? Indeed, a maximum is a maximum, by definition you cannot go over it, or it wouldn’t be a maximum. Well in fact he said, “at or close to” which leaves a little wiggle room. The rest of the sentence and the next paragraph are about the general solutions of how to increase production rate and are far too general to weigh on the debate which is precisely the object of TOD. So it would always be possible to infer that he didn’t mean to support the hypothesis “Ghawar is currently at or close to maximum achievable production rate” but in fact “Ghawar is currently at or close to maximum achievable production rate with current technology”.
A little remark about how he goes on to try to balance stuarts study he goes on with general solutions :
1 -through the addition of additional production wells,
2 -through increased or more efficient water injection schemes
3 -through surface facility modifications
When I discuss with a hospital director I know precisely when to inflect a too optimistic discourse or the use of rhetoric anxiolysis (which is called wise managing). In my opinion, the use of such pleonasms as “addition of additional wells” is a sign of a struggle between the left and the right brain. It is the sign of someone who knows he has to look optimistic or confident about something which in fact worries him as much as the rest of his audience. So when I discuss with the initial director and he tells me : “I will add some additional nurses in the emergency room” I will immediately ask him “but do we have the money to pay them”. If he had said “ we will increase the ER staff” he would have answered my question with “the ministry has given us a brand new budget”. But having begun with his pleonasm his answer will be “We will have to look at some cuts in our general expenses” which everyone knows will never occur especially with the sad look on his face at my answer.
My comment to number 2 is that a lot of people have already commented on the fact that water injection schemes are already the best in the world, and how the heck would you want to increase it at what risk ?
My comment to number 3 is that this is precisely what is discussed by everybody on TOD. Of course Mr Gilbert knows all this and this is why he goes on and touches on the core of the problem : how much money can SA throw at this, and how can all this make an economic sense ?
So now, what did I learn from M Gilbert ? We are at the point where :
- either SA will invest a lot to maintain production, which will induce quite an inflationary pressure
- either they won’t which will mean decline of production i.e. recession
If this isn’t a supportive view of PO, I don’t know what would do it.
Jeroen KOK
As this is an exceptional case, I will break my personal TOD commenting rule, which is strict abstinence since I mentioned — anonymously, unfortunately — Gilbert's view of SPE #93439.
I am glad to see Gilbert's remarks published. I certainly took a lot of heat for paraphrasing his views. In fact, I was insulted & assaulted for adding nothing of value to the discussion, for using an anonymous authority to cast aspersions on the prevailing and apparently popular view that North Ghawar was crashing, and for various other crimes. I was merely waiting for everything to fall into place before publishing. As Gilbert's remarks have been re-produced here, there is no need for me to add anything further other than to say that —
And that's all I have to say.
Yes, we need better data, Dave. And Mr. Gilbert appears to have done nothing to improve that process other than to say "Stuart's wrong because he's not a professional", an opinion that I find rather unhelpful.
You are, of course, free to believe Mr. Gilbert as you choose. That some of us may find his position less than convincing in light of ongoing events is simply a divergence of opinion and not character assassination.
By all means, Mr. Cohen, please do believe Mr. Gilbert and base your actions off his authority. You will have to excuse me if I choose to do otherwise.
Ghawar Is Dying
The greatest shortcoming of the human race is our inability to understand the exponential function. - Dr. Albert Bartlett
I suppose you still stand by your previous comment:

In contrast, I and perhaps many other TODers are proud of the Ghawar analysis and the rapid collaboration it spawned.
I don't remember the part where you told us about "The conclusions reported seem to me to be credible" and "It seems likely to me that the conclusions the authors have reached about Ghawar's current status are broadly correct.".
Which is all I was trying to say — that it was not possible to jump to conclusions.In my view, KSA is working hard to stem declines at Ghawar. Depending on how successful they are in the near-term, they may be able to raise production substantially. It is just a matter of time before counter-measures will fail to halt declines there, however. Meanwhile, they are trying to put on new capacity. Remember when I said I wouldn't take your bet that they will ever produce 10.7 million b/d? I still wouldn't take it. I've never said I thought things were looking rosy in Saudi Arabia. They will never produce what the world (eg. the IEA, EIA) are expecting in future projections, in my opinion.
However, in order to counter an extreme position you took, I put myself in jeopardy of being bulldozed by the true believers, who are strangely eager for "bad news" and the end of the world. This is, in fact, what occurred. And, I won't be forgetting it anytime soon.
"...extreme position..."
"...in jeopardy of being bulldozed..."
"...And, I won't be forgetting it anytime soon."
Take a holiday, Dave.
Gentlemen! I strongly urge you to a conduct in a civilized discussion i.e. view and counterview! Please use your sharpest wit on the data and it's interpretation, not ad hominem. Furthermore, if someone has the incourteousness of addressing you in such way please ignore him or her. That way flames and trolls are starved, and honour is kept.
- Your local (slightly old-fashioned) internet social control officer.
Like you said, true believers. The site is increasingly the refuge of people with faith-based conclusions rooted in apparently strong analysis; that is, non sequiturs abound. Pointing out that we do not have enough data to support conclusions, or that other hypotheses work equally well, will win you no friends with people of essentially the same temperament as fundamentalist Christians. It's agree or burn, heretic!'Ghawar is dying! Head for the hills!'
I mean no slur on recent analyses, which are top notch. But the question is always what do the analyses support? What conclusions are we justified in drawing? Are other hypotheses refuted?
All questions which do not matter to the Goodie-goodie-everyone's-gonna die-except-righteous-me-of-course brigade.
A central mystery of this site is that so much good continues to be done with it when it is increasingly overrun with headcases. I used to come here to learn - and I did; I learnt that a lot of 'obvious' PO stuff was not. Ironic, huh? But nowadays I usually drop in just for a good laugh.
I think you are misclassifying peoples passion on the subject. There may be a few nut cases that want to see everything come crashing down but the majority that believe we are post/at/near peak believe now is the time for action not later.
They support their conclusions based on many well researched articles done here and elsewhere. It seems in the best interest of everyone here, based on lack of data, to assume the worst. The worst being that peak happened a year or so ago. That being the case then government at all levels would need to start preparing now. That being the case then personally we should all be preparing now.
When doubters are slammed it is peoples gut reaction to what they see as support for the "do nothing" crowd even though people like Dave obviously don't support this idea. Equating passionate people to lunatics and faith based nut cases seems a bit overdone.
Indy
Dave,
Gilbert absolutely coroborated Stuart's analysis.
The only caveat he gave was not if... but exactly when...
and how bad....
Now... you assert KSA will supply 10.5Mbbl/dy...
Interesting....
My opinion is your figure is pure crap...
Why?
Because....
Unlike Stuart and Fractional, you recite dogma... no
facts, no figures, no research, nothing nada....
Pure unadulterated bull shit....
The kind which encourages dumbos to vote Bush when they need to ask the really tough questions...
When are we going to reinforce our grid so farmers in Iowa can plant wind turbines to make electricity?
When are we going to let the contracts to build 1Tw of CSP
in the SouthWest?
When are we going to let the contracts to build a modern
rail system powered by electricity?
When are we going to build the HyperCar promoted by RMI?
When are we going to put 10Kw of PV on every house?
When are we going to insulate every house to reduce heating costs by 80%?
When are we going to require 6" of insulation in our refrigerators?
When are we going to require free piston stirling refrigeration units in our refrigerators?
When are we going to run bus routes on a 15min schedule in all our cities?
You like all your ilk will reply with the question as to where the money will come from....
The short answer...
Gut the military budget to nothing....
Put some money in talking to the rest of the world...
Charge Bush and Co. with violations of the Geneva
Convention, put them in front of a wall and let Bin Laden
pull the trigger.
Hope like hell all this is done in time....
Regards,
Indy
Indy
One more thing Dave.....
Unless you are at this moment astride both a grave
and a banana peel, I'd guess you are in your 30's..
If so, unlike me at 60, you will definitely live past
PO. A question that should frighten you to death is..
How much oil will be left for my later years?
The answer is ... lots less if you pump like mad now...
AND...
If you have kids....
How much oil will they have?
At the rate your ilk is going... the answer is "NONE".
AND....
NO OIL.....
No pharmaceuticals....
No water supplies from utilities....
Crop yields 20% of current levels....
No imported junk.....
A dollar less valuable than the Rouble.....
Think it can't happen... then why have India, China, Russia, Venezuela, Ecuador, Bolivia, Sudan, Angola, (soon Nigreria),
Indonesia, Vietnam, Myamar, and others all joined together
to nationalize their petroleum reserves, and commit those
to their friends, and only their friends, on long term contracts, involving mutual cross investment.
EXCLUDING THE USA AND BRITAIN !!!
Why??
Indy
Hello Indy,
Thanks and while I'd support a bit more neutral language, I like the substance of your points.
In particular...
re: "No water supplies from utilities."
This seems to me to be an urgent top priority, perhaps using distributed energy.
I'd add another question:
"When are the world's people going to be told the truth and who is going to tell them? If one personally knows, and does not do everything possible to inform..."
PS I think Dave has mentioned he's around 50, if I recall correctly.
Dave, I think that we see here the problem of your paraphrasing Gilbert's views with him remaining anonymous. As neuroil analyzes above quite impressively, Gilbert supports Stuart analysis, and then throws in a flurry of internally contradictory corporate ass covering speak. If you read it carefully, it seems to be an endorsement of Stuart conclusions, as least as much as you could hope to get publicly from someone in Gilbert's position.
Re: flurry of internally contradictory corporate ass covering
Hmmm... that's some strong language.
Re: problem of your paraphrasing Gilbert's views... and if you read it carefully...
Hmmm... now, I don't know how to paraphrase or read.
So it goes. RIP Kurt Vonnegut.
There is no point talking to someone who deliberately takes offense at any difference of opinion.
Ghawar Is Dying
The greatest shortcoming of the human race is our inability to understand the exponential function. - Dr. Albert Bartlett
If he doesn't like the peak is happening now concept, a different date would be nice, rather than just more "Trust in Aramco."
If I am not mistaken, even Wood Mackenzie assumes Ghawar to have already peaked. In its forecasts of the 15 biggest oilfields of the world, they assume production Ghawar to already drop from 5.6m barrels this year to only 5.0 barrels by the year 2010, a decline of 11%.Only question remains whether depletion will be faster.
Simmons had stated something like the decline of Ghawar might be one of the fastest in the world. This might be the profile of Ain Dar - Shedgum if I have correctly followed some of the arguements posted with only limited university training in geology. North Uthmaniyah was supposed to have been in danger of a decrease in production not many years after Ain Dar.
It is true one has very little public data from Saudi Arabia, especially about the midsection of Ghawar that might contain spare undeveloped capacity.
In 1972 geologists estimated the East Texas field would ultimately produce about 5.6 billion barrels.
In 1993 the field was described as "dead" and had produced about 5.1 billion barrels. More than 30,000 wells were drilled into the field. At one time it had produced 900,000 barrels a day. It was reported to produce a little to this day by one TOD writing.
http://www.tsha.utexas.edu/handbook/online/articles/EE/doe1.html
If U.S. geolgists had accurately forecast the URR of East Texas at about 5.6 billion barrels in 1971 and it was producing so little in 1993 as to have been declared clinically dead, one might believe the U.S. Aramco geologists' estimates of 60 billion barrels URR for Ghawar in 1975 as something you might put some trust in. Of course after the Shell debacle and downgrading of Omani reserves, one should not go wildly guessing that they totally blew it and missed tens of billions of barrels, nor could one if shown data to prove it belive that they could never miss extra reserves.
It would be unwise to proclaim without data that the Saudis might actually increase Ghawar production above the 5 million barrels a day it used to be. Ghawar once was a mighty field, its description as growing major producer might be described as heresy.
Yes, its great that we see what Dave Cohen was insinuating on the board. I am glad that Stuart did not listen because other "experts" did not agree with Stuart according to Dave C.
Though it seems that he does not disagree, he just says more data is needed for a "complete" answer. This of course was understood. I saw no reason for Dave C to "advise" Stuart that he should be careful etc. That real pros had a different opinion. I don't see that at all in this post. I am glad Stuart followed up and works on adding to the data everyday to help those of us that realize the implications of PO.
As for the "amateur" comment. LOL.
The Wright Bros were amateurs compared to the Professors and heads of Science academies that said man could not fly.
There is a certain player for the Cleveland Cavaliers that was an "amateur" yet went right into the NBA and dominated.
Does the word Amateur "Tiger Wood" ring a bell.
The list of "amateurs" who compete against pros and win is not a short list. I found that "line" like many others a weak response and at worse a "dig" to discredit what he already admitted was good work with the info.
the main difference between an amateur and a pro? The only difference is one gets "paid" to do the work. An amateur does not. Being an "amateur" does not mean you do not have the skills and knowledge to be a "pro".
Thanks for posting this and for the "pro" to allow it to be posted.
Quid Clarius Astris
Ubi Bene ibi patria
PrisonerX,
Thank you for the above post. My exact sentiment.
Translation: The work of the TOD authors has been truly remarkable and it could be verified if only the Saudis (Aramco)were more transparent.
Translation: The work of the TOD authors has been truly remarkable and it could be verified if only the Saudis (Aramco)were more transparent.
Translation: The work of the TOD authors has been truly remarkable and it could be verified if only the Saudis (Aramco)were more transparent. The TOD authors certainly have the balls to conclude that Ghawar is peaking when technology and higher prices will save us.
Translation: The work of the TOD authors has been truly remarkable and it could be verified if only the Saudis (Aramco)were more transparent. Technology and higher prices will save us.
Translation: The work of the TOD authors has been truly remarkable and it could be verified if only the Saudis (Aramco)were more transparent. They are well-intentioned wannabes treading on my expertise. Let's rely on Aramco's professionals and their secret data since they, not nature, will decide if Ghawar has peaked.
My take: (this is pure opinion only based on the above statement only) Gilbert is impressed, and he believes as noted by his comment that the TOD conclusions "are broadly correct." He just can't take the plunge (publicly) absent Aramco's confirmation and more transparent data. I interpret Gilbert to be saying that the technology is there to maintain and increase Ghawar production as long as the "professionals" determine that the price of oil is high enough to offset the increased costs of that production.
Given the discussion over the past several weeks re Ghawar, my hope is that the Aramco professionals truly have something up their sleeves. I certainly do agree with Gilbert, as I think most of do, on the issue of the need for Saudi transparency. Then again, Saudi production over the next 3 to 6 months may tell us more than any data that they may have to offer.
.
But nowhere in this brief discourse is a statement of what it may mean if Ghawar is in [irreversible] decline. From the dispassionate view of an oil field engineer, speaking strictly as an oilfield engineer, he can look at the TOD analysis and, in effect, say, "Yes, maybe so. But so what?"
In a sense, oil field engineers are complete amateurs when it comes to the "so what" part of the equation. Thankfully, even though sometimes aggravating, TOD has allowed extensive discussion on the "so what" portion of the question of post-peak production of crude oil.
Mr. Gilbert has rendered his expert opinion, which goes as far as it can, given the limits to his particular area of expertise. Now he should get out of the way and let the 'professional' prognosticators of post-peak society continue their discussions. :-P.............
I think "Gilbert's Dilemma" is much like that of an airplane pilot spotting a UFO. The pilot knows what he saw, but if he admits it to anyone in his profession, the pilot will be ridiculed and ostracized.
So he says..."yes, yes...good work TOD, but come on...really..this is nice theory, but it's outside what I consider the norm and therefore just couldn't happen".
Wasn't it former Arizona Governor Fife Symington that recently admitted to seeing a UFO over Phoenix, but had lied about it because he didn't want people to think he was crazy or cause a panic. Is Gilbert much different here?
Guys, that's it in a nutshell. Discussion about SA's production capability is *speculation* and will remain such until that most important piece of information, reserve capacity, is demonstrably verified. Of course, one can redouble efforts to line up a few more circumstantial factors to support one's own pet speculation, but those factors, because circumstantial, will remain open to multiple interpretations and won't give the desired certainty, however clothed in urgent language.
Discussion about SA's production capability is *speculation* and will remain such until that most important piece of information, reserve capacity, is demonstrably verified
Or until KSA production drops in the face of ever higher oil prices. Perhaps this late May/June.
The kind of "proof" that you require will NEVER appear. (Absent strong outside pressure; and even then, it may not be public info).
Alan
Alan, you've happened to hit and miss the target in the same breath. What you call "proof" (which parenthetically is merely proof in some real sense) is not something I require, but is what the issue in question requires: a form of data other than suppositive stitching of circumstantials. Listen, it's completely banal to say Saudi will some day run dry. 99.9999% of all people alive would agree to that. The only question is when, and that question can only be answered, with some degree of certainty, with .... proof.
C'mon guys....Fractional Flow just gave you the proof of the looming catastrophe on a silver platter. He might be the next deep throat. Look what he found that Mr Hussieni said:
"if cost cutting strategies and high risk production
practices are allowed to prevail, the consequences can be both
devastating and sudden. Examples of such ill considered
strategies might be an early shift to in-field water injection
patterns, a shift to dry crestal production strategies away
from wet flank areas..."
DRY CRESTAL PRODUCTION!
That's what they've been doing the past few yrs and FF's data shows that.
When this baby waters out it will be the biggest news in our lifetime, we'll remember the end of Gharwar like we remember 911.
IMO
What Stuart and FF and the others have presented is first class evidence that the people when informed and the politicians see this, DEMAND, that SA give out such information that can be verified that shows the true state of their and of course every nation state likewise NOW, show the world the true state of their reserves with no BS.
We all know its that F'n serious, and with this work by the great amateurs here and with this "admission" by the pro, IMO. a push using this info and other should be presented to Politicians and the media for immediate action.
Like Matt Simmons says.
What company in their right mind would allow a company they buy there resource from hide from them the number of "widgets" that they can supply on a regular basis to feed the customers need. The answer ZERO, yet its happened in oil business, which drives the whole thing.
Quid Clarius Astris
Ubi Bene ibi patria
Hello Korg,
In my rank amateur opinion: not entirely dry crestal production--see my postings and links downthread. Joe Voelkers Motherlode PDF posits the placing of some horizontal wells in the bottom lower porosity layers that were bypassed by DFNs causing non-uniform waterfront overide. This tactic can lower watercuts if the horizontals can be carefully placed to avoid vertical faults and/or DFNs. Unfortunately, if verticals are unintentionally encountered while drilling horizontally, the well waters out instantly due to geo-structure zonal thieving. Aramco has also noticed that shutting in some wells increases the restart watercut due to this zonal thieving. During the shut-in time: the oil has pressure-differential migrated into high permeability, but high water percentage sinks.
I bet Aramco is going nuts trying to economically resolve all these geo-structure problems in a mature Ghawar. My guess is that they cannot accumulate the essential data, then write accurate 3D simulation software faster than new reservoir sweep problems pop up. The Laws of Receding Horizons and Diminishing Returns are BRUTAL.
Bob Shaw in Phx,Az Are Humans Smarter than Yeast?
I want to applaud Stuart for posting this commentary even though it is not 100% supportive of his analysis. I would in fact characterize the overall tone as "polite skepticism" in that it questions the fundamental conclusion, that the Saudi decline is irreversible. I also get the impression that this is just an excerpt from a larger document since it concludes by proposing to answer "questions" but only has a section 1.
Earlier I asked Stuart to put his ideas forward for review by credentialed experts. This is a good first step but I would also like to hear from someone who is not already associated with ASPO. My ideal would be a working academic geophysicist or geologist with expertise in oil field dynamics from a top university. I did a search and these are the top 10 U.S. universities in geosciences:
If we could find some expert geoscience researchers from these schools who could review Stuart's findings, I'm sure that would be informative and helpful.
Hmmm.
According to this article my hometown has the best school:
Study: UT has top petroleum program - University

I often visit the campus to attend seminars in my field of Artifical Intelligence research. Here is a link to the seminar schedule:
Petroleum & Geosystems Engineering at the University of Texas at Austin
I can imagine attending a relevant session and asking some pointed depletion questions similar to those posed in the Ghawar analysis.
Here is the UT Petroleum school faculty page, which includes email addresses. Halfin, I would be glad to email a soliticitation to each of the seventeen or so resevoir engineers, to see if any would be interested in reviewing the Ghawar analysis articles and commentary posted here. I am only a few miles south of the campus and can easily bug them during office hours too. OK?
UT Faculty Directory
The University of Texas at Austin produces half of the Petroleum Engineering PhDs in the world, and their geology and geophysics programs are at the top from a petroleum POV (less good for volcanology, etc.)
Best Hopes,
Alan
It was good to see this post from Jeremy Gilbert.
His biography is most impressive. I suspect that he has forgotten more about oil production than 95% of the TOD members will ever know.
As Halfin suggests, it would be great to see more input here from professionals working in the field.
(Despite what some here might like to think, being a "keen amateur" doesn't make you more capable than a professional. If I ever need a cardiac operation I don't think that I would be happy being operated on by a keen First Aider who had read ALL the books. I would rather be operated on by someone who has been through medical school and who has real world experience. True, there ARE indeed some very gifted amateurs such as Matt Simmons, who can out-think almost any professional ... BUT such people are few & far between. I'm certainly not in this elite group ... and statistically, dear reader, neither are you. )
As for the word-by-word deconstruction of Jeremy Gilbert's article: this reeks of the sort of over-detailed introverted approach used by conspiracy theorists.
Peak Oil is simply a rather mundane geological/economic theory which has the potential to cause economic & social havoc sometime in the next few decades. It is NOT a religion or any sort of mystical truth .. although perhaps some perceive it as a way out of a boring life, or as a Final Solution which will blast away the world's ills.
This more localised & often intense argument about Saudi Arabian oil production rates is merely a side show, a diversion. Saudi by itself cannot supply the whole world with oil. Neither can a decline of Saudi Arabian supplies bring the world to a complete halt.
It might be wise for all of us here to prepare for a lower energy world. It would be helpful to have a clearer picture of what the Peak Oil time scales might be ... but even without a clear timetable, we can probably assume that severe problems will arrive within a decade or two but probably not as soon as 72 hours time.
Once Halfin gets his experts on board then perhaps we will be able to pin down the timetable more accurately.
I look forward to the professional & informed discussions than might result.
Too right, but the converse is also true.
In the end its down to mental models. The professional often has a better mental model of what's going on, and how they would respond in a particular circumstance, than you as the amateur does.
That's a characteristic of experience.
However experience, particularly of what bureaucratic organisations do, can be transferable, as is asking the right questions.
You can get 80% of the model in 20% of the time. You can also employ a broader viewpoint on the issue much more easily - seeing the wood for the trees.
Expert or amateur is less the question than open minds and desire to contribute. Not invented here is an easy disease to catch. I've been there as the expert. It can be hard work, but on your own you can achieve little. Getting others to comprehend your worldview; watching as they take it forward is more rewarding in the end, and more effective.
Still, if I collapse in the street, I would be happy to receive first aid from the "keen amateur" than wait 30 minutes for the fully qualified professional, who would perform pretty much the same chest compressions as the keen amateur.
Indeed, there are many moves to put better tools in the hands of keen amateurs, defibrillators for example, as it is recognised that immediate care when you become ill is better than getting perfect care at the hospital, but dead on arrival.
I was hoping for a lot more from Dave's source than "trust the experts". If we wait for the Aramco experts to resolve all the unknowns then Ghawar will be dead by then too.
Hello Halfin,
Do we know if the students and staff at these schools are regular readers of TOD--perhaps an email to each institution to get more expert input here on TOD?
Any students & staff currently logged on--please sound off on how TOD-aware your school is please. Thxs for any reply.
I wonder if this might be the last time that Mr. Gilbert acquiesces to having one of his private emails published on TOD???
I warned him in advance he might take a few arrows and he didn't seem to think he'd get offended.
Hello TODers,
Thxs for everyone's input, but please remain calm and cordial. I hope everyone has been studying my recent postings showing geo-slices of non-uniform waterfront flooding due to DFNs. Also, I would encourage everyone to study the PHD thesis of:
http://pangea.stanford.edu/~jcaers/theses/thesisJoeVoelker.pdf
page 54 of the PDF shows the multi-thousands of wells throughout Ghawar. It would be helpful if we could find out the descriptive legend one encounters upon zooming in with the magnifying tool. If possible, it might show:
1. % of wells converted from producers to injectors.
2. % of vertical wells converted to horizontals and/or MRCs.
3. Stratigraphic OWC at various depths in producers.
4. Produced C+C per well.
5. I suspect the red pixelation at the very top of North and South 'Ain Dar is gas reinjection for pressure maintenance to help forestall premature waterflood encroachment.
6. Maybe other crucial details that I have overlooked as an admitted truly amateur reservoir engineer.
But please consider the effect of thousands of wells in Ghawar since production began so long ago. What we really need is more updated info, or better yet: KSA extending an invitation to the TopTODers for an extensive Ghawar computational 3D fly-thru of the various subfields of this giant oilfield.
SS, F_F, and others would then know much more about the Shedgum leak area, gascap formations, Uthmaniyah waterflood overreach [page 106 of PDF], Harad production problems from DFNs, and other mature reservoir production problems such as unforeseen injector fracturing and chemical diagenesis to carbonate structures from crude saturation to saltwater saturation at very high pressures.
I am not a computer guru so I don't know how difficult it would be to accomplish this: could Jeremy Gilbert, GaryP, SS, and others use Photoshop or some other software to create their own version of what they would expect a 2007 Ghawar oil saturation graphic to look like? Dual views by using the Laherrere SW-->NE graphic plus the view posted uptop? This could be very useful for future discussion.
Bob Shaw in Phx,Az Are Humans Smarter than Yeast?
Take a close look at Google Earth. Its illuminating.
Already tried that, but its not as simple as it appears.
If someone in Saudi Aramco would just provide access to the 2007 water saturation gridded data from their model, we could be there in a jiffy...
F_F and others with more expertise,
When a formerly producing well waters out, then is converted into a water injector: are there any SPE papers written on what happens to the geo-structures when the flow direction is now reversed and highly pressurized?
I think it would be helpful to know the probabilities of stratigraphic fracturing generating wellbore DFNs that then connect to the inherent geologic vugs, voids, and faults. Also, does this flow reversal lead to sand and mudflows further updip clogging some oil-dry structures and frictional erosion through super-k fractures and between geo-layers causing increased water override [bypassed pockets from non-uniform reservoir sweep]?
Does the next well updip from the new injector have to configured with mud & sand filtration equipment, or is this an inconsequential factor? Thxs for any reply.
Bob Shaw in Phx,Az Are Humans Smarter than Yeast?
Hello TODers,
If one goes to this PDF link, page 20:
http://www.austingeo.com/recon%20publications/white%20papers/ReconInnova...
One can see a decidedly different and more pessimistic Ghawar oil saturation graph circa 2004. By using the PDF magnifying glass zoom-tool to investigate the well logs: it shows a lot of water breakthrough and isolated oildry pockets. Check it out please, then tell me if I am analyzing this properly.
Bob Shaw in Phx,Az Are Humans Smarter than Yeast?
Bob - I think you mean p19, right? I think the color in the Ghawar map on the right is height, not oil saturation (red high, blue low). I've stared at the Greg Croft contours enough that I almost know the shape by heart at this point....
The well log visualization on the left is interesting. I believe it's probably the peak at the south end of Haradh, viewed from the north-west. However, I'm not sure exactly what variables are being plotted on the well logs - many things are logged in wells - what makes you think it's one variable rather than another?
Hello SS,
Thxs for respondng. To be honest--I don't have a technical clue--I was hoping those well-logs would reveal a lot to you, F_F, mudlogger, and others with more real-world experience. Yep, page 19.
The graphic says 800 well logs-- isn't that North Ain Dar looking from SE--> NW --my earlier link said Haradh III only had 46 MRC wells total. Zoom compare the right graphic of N AD wells [page 54 of Motherlode PDF] with this well log graphic.
Sorry, gotta go! later!
Well, we'd be seeing parts of all three Haradh's, but staring between the well logs I think you might be right that it's North Ghawar. It's a little confusing because Shedgum and South Ain Dar are kind of buried under data, and also Shedgum is colored quite differently than North 'Ain Dar. Not sure what that means.
If we could decode that picture, it might tell us a huge amount.
Well the basemap on the right doesn't include wells from Haradh III OR Haradh II. That dates it to prior to 2003 at a minimum. It is however the best mapping of the well locations we have, just not quite detailed enough.
The data on the left shows gamma ray and porosity logs, and judging by this doc, is from prior to 2002. Not sure where its of, but I doubt its going to help.
Hello GaryP and ATTN: SS, Euan,F_F:
Thxs for responding. Is there anyway of correlating these well-logs with this Ghawar Productivity map from Simmons?
See frame 12 of Simmons PDF:
http://www.simmonsco-intl.com/files/Texas%20Alliance%20of%20Energy%20Par...
I think Simmons' map clearly shows the extent of waterfront override and no-uniform reservoir sweep. Especially at various points of the fractured, sharp crestal regions whereby super-k and DFNs prevents these wells from being the most productive oil-dry producers.
From frame 45, page 15 of Motherlode PDF:
--------------------------------
....as SA reservoir modelers are publicly unanimous (Chapter 5) that faults and fracture systems are the primary flow elements at Ghawar.
----------------------------------
From Frame 5, page v of Abstract:
----------------------------------
Spatial prediction of super-k occurrence is desired for placement of water injection and oil production wells, and for improved production forecasting. Premature oil well abandonment has become a problem for the operator, Saudi Aramco, due to the inability to mitigate the high injection water conductivity of super-k, and associated early water breakthrough at adjacent production wells.
Given the potentially deleterious effects of super-k, and the enormous volume of reserves that it impacts, the accurate characterization of super-k has profound implications.
--------------------------------
Also, shutting in wells, in some cases, reduces future recovery:
Frame 95, page 64 of Motherlode PDF:
-----------------------------------
Differential depletion is manifest in zone thieving, that is depleted intervals in wells that become sinks for production in the well, after it has exited other, productive intervals, decreasing the total well production. The diversion of production, or backflow, is maximized during a well shut in, and has been observed in wells at
Ghawar. Thieving is not a recognized widespread problem currently at Ghawar, as thief zones do not appear to be common. However, thieving is a mature field bane, so
its significance will increase.
-----------------------------------
From frame 84, page 54 of Motherlode PDF:
--------------------------------------------
The layered nature of the Arab-D is seen in the disparate permeability means of Zone 2A, 2B, and 3. The mean porosity does not vary significantly between the upper
layers, however a significantly lower porosity mean characterizes Zone 3. Zone 2A is undoubtedly the most important layer, having a high pore volume and the highest
permeability. Table 5.1 summarizes the data, by zone, and by major lithology. The lithology categories in Table 5.1 and in Fig. 5.1 are described in Sec. 4.3.
Recognition of the layered aspect of the Arab-D has provoked at least one major reservoir management initiative: the drilling of horizontal wells in Zone 3 to increase well productivity.[46],[51]
--------------------------------------------
This might help explain how the recent Ghawar watercut has been reduced: MRC horizontals targeted into the lower levels of the waterflood-bypassed payrock.
I believe this Simmons graphic correlates well with the fracture networks of the Motherlode PDF [frame 126, page 96] and N=>S cross section of Ghawar Arab D [frame 72, page 42]
The good news at the Shedgum leak area is:
From frame 87, page 57 of Motherlode PDF
-------------------------------------------------
A deduction may be made, at the least, that Arab-D vertical permeability is significant at Shedgum, and that vertical heterogeneity is not significant, that is, there are few vertical permeability barriers in the reservoir that have significant lateral extent.
-------------------------------
Thus, they can/already have probably placed pump-assisted wells around this leak area to extract the oil.
I think the Uthmaniyah graphic is very interesting too:
From Frame 106, page 76 of Motherlode PDF
The well workovers backfired increasing watercuts: I think this compares fairly with the low well productivity seen in the extreme SE UTMN sector of Simmons' graphic.
In the Hawiyah Thesis Study Area graphic [frame 124, page 94] this analomous waterflood is clearly seen in the Simmons' graphic too. Initial well productivity is fairly high until water breakthrough along fracture networks.
Please recall my earlier admission that I am a rank amateur: I welcome elaboration or disputation of my cursory analysis. Thxs for any expert reply.
Bob Shaw in Phx,Az Are Humans Smarter than Yeast?
Note that Jeremy Gilbert wrote:
Price.
Yes, folks, there it is on the supply side. Truth is it has to be mentioned in all discussion of future supply and demand. It can't be avoided.
There is a tendency among peak oilers to grab demand projections from official sources (without reference to the price expectations they are based on) and then juxtapose those with supply scenarios derived by Hubbertians with no reference to price at all.
Confusion compounded.
A few comments of my own in reaction to Jeremy's observations:
Thank you SS!! And thanks also to Jeremy Gilbert for allowing this discusion to take place. It is truly invaluable.
I concur.
Amateur is somebody who likes his hobby (amare is latin for to love). The main difference to professionals is that amateurs are unconcerned about the financial implications of their work.
Yes, technically Colin Campbell and Jean Laherrere, since they are retired, could legitimately be called amateurs (no longer 'doing it' for a paycheck)
Not sure about that.
Once you are paid for the work and have a career, then you can't regain your amateur status from non payment.
Any pro in sports or considered in business in a specialty once they have that designation, can't go back is how its viewed even in law I guess. Can't go back to college and play College once you have been a pro.
Quid Clarius Astris
Ubi Bene ibi patria
Semantics.
I think the attempted distinction was between
An expert - a person versed in the skills and knowledge of a particular domain. Usually requires at least 10 000 hours of work in the domain to roughly reach this level.
A non-expert - a person who has varying levels of skills and knowledge on the domain in question (may be an expert in other domains), but is not near being considered an expert in the domain in question.
However, even innovations research acknowledges the fact that sometimes the initial discovery (or knowledge breakthrough) is done by a non-expert.
It doesn't always take an expert to make the breakthrough, but it requires experts to verify it (if there is no empirical way for the non-expert to verify this without experts).
That's what we are lacking here (to some extent, no offense to experts from various fields, but afaik no person here is an expert on Aramco, it's techniques and Ghawar specifics).
Which is of course not to say, that SS/FF/others may not be correct.
It's just that we have no verification.
And I believe (cannot demonstrate), we likely will not have any verification until the whole question has become largely insignificant (clearly past peak when the data can't be hidden in obscurity anymore).
That is what concerned me about the response. FF is clearly a professional, and is readily identifiable as one. As Leanan posted when FF first commented on the board, in perfect understatement
My guess is that a man of Mr. Gilbert's stature would not have the time or inclination to wade through the all comments on the stories, including FF's. I can certainly understand, it is a huge undertaking to read all the threads and keep track of the discussion while ignoring all the OT stuff. Unfortunately the comments, especially FF and Euans, contain some of the most important material in understanding the basis of the observations that Stuart presented. In this case Mr. Gilbert would be lacking some information for his review. It would be nice to figure a way to condense the salient items to a few pages, so it would be more presentable to review.
I have to applaud FF for brushing off the professional slight with humor.
Back to the Data.
Whilst you'll was arguing about how well ol Dolly would survive PO, FF was burnin the midnight erl crouchin ov'r the digit-tizing tablet with good ol' SPE 93439er (which don't hav nuthin cordin to much expurts) and doin massive linaer interp'lations with his 386 deep in the Holler.
I wish more of the professionals in all arenas would relax and take some heat. Most of us poor saps take heat all day. I appreciate this site and Stuart for his wide range of skills. As TOD gets closer to a correct answer Stuart will be a good judge of the responses to the dilemma of declining transportation fuels. As he has stated and I second - Alan Drake for President.
Thank you for doing so. I was going to post something since I got such a good laugh at his tongue-in-cheek ability to laugh it off, but I didn't want to muddy up his "discourse" with garyp with one of my essentially worthless comments. The one about the "erl bidness" was good for a broad smile too...
Just a couple of observations from years in top management.
1)Mr. Gilbert, while highly qualified, has not done detailed analyses for at least a couple of decades. He has had excellent subordinates to do that and has lived on concise and incisive summaries. His 50,00' response is the best he could give without putting in a lot of hours reviewing the source materials for the SS, FF et al analyses, and he is no longer accustomed to doing that, and probably lacks the inclination. Also he will not go to far out on a limb and risk tarnishing a sterling and hard earned reputation, even if he is 80% in agreement and sees the risk as fairly low.
2)Even (or especially??) experts in a field are limited by their very expertise. There is a major tendency to see only their part of the elephant. It is rare for even a group of experts to put all the pieces together and take a holistic view, undistorted by their special interests/knowhow, which is at least part of the explanation of the failures of the experts mentioned above. With all of the digging up of sources (often obscure), and the exchange of ideas and analyses done by SS and his fellow TODers, this may be the first holistic view anyone has developed of Ghawar, including all of the Aramco experts. People who are capable of combining the pieces of the puzzle and assembling the full holistic view of the elephant, unaffected by their personal bias or expertise are very rare. SS is clearly good at synthesis, capable of objective critical thinking, and advantaged by being an amateur uninfluenced by what he "knows".
I am inclined to take this analysis very seriously. It may be better than anything done before, including by Aramco.
Murray
Murray,
I greatly appreciate your points.
re: "People who are capable of combining the pieces of the puzzle and assembling the full holistic view of the elephant, unaffected by their personal bias or expertise are very rare."
Murray, I'd very much like to (as a group, or sub-group) go to the next step, addressing what to do. Yes, "ELP" is a good place to start. Still, we need so much more.
Do you think this is possible? If so, how can we begin?