May 2008 EIA Oil Production Record. Will it Too be Revised Downward?
Posted by Gail the Actuary on August 7, 2008 - 10:28am
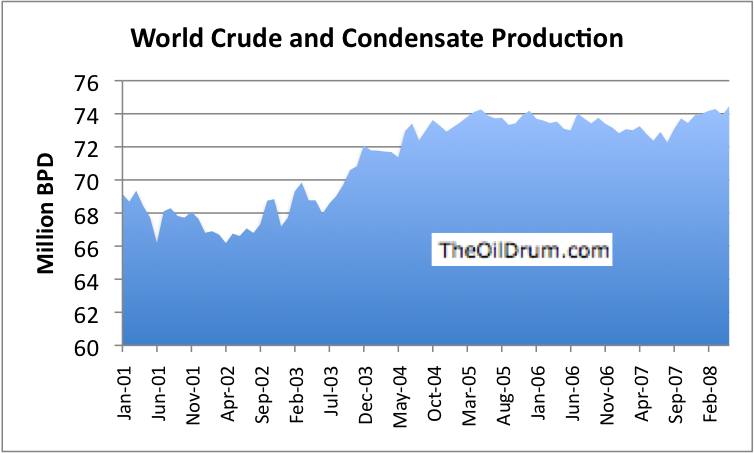
Yesterday, August 6, the EIA published new International Petroleum Monthly data. The new data revised downward previously published estimates, all the way back to 2002, with the biggest revisions in 2007 and 2008. With the revisions, the latest month, May 2008, shows new record-high oil production. Other recent months which had previously set records are now 67,000 barrels per day to 417,000 barrels per day lower than reported just a month ago. In this post, I offer a few thoughts on what the new data suggests.
How Frequent are EIA Data Revisions
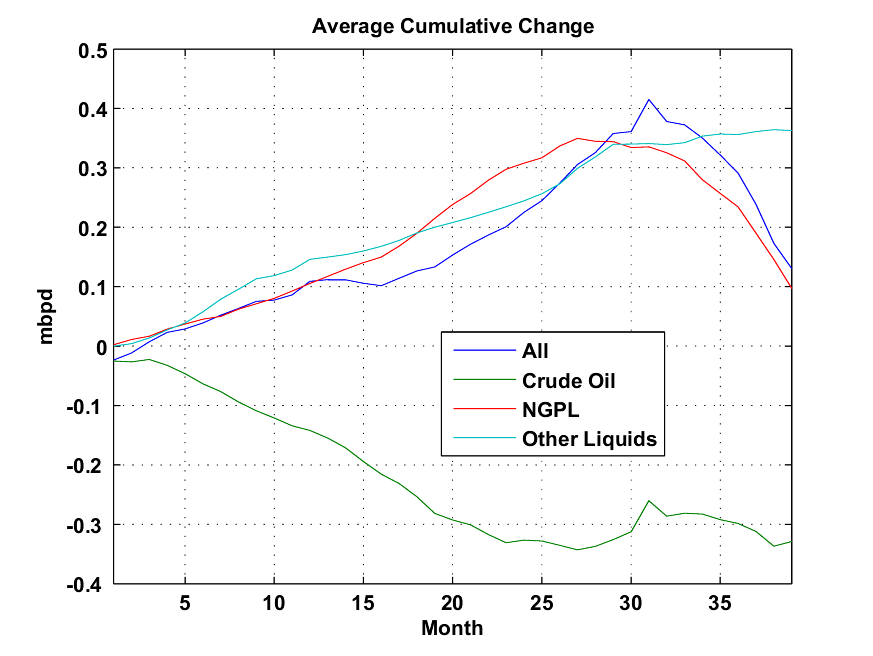
Khebab did an analysis of EIA data revisions back in October 2006. His analysis showed that at that time, crude estimates on average were revised down by about 300,000 barrels from their initial estimate. The downward revision took about three years. Estimates of other liquids tended to get revised upward over time. On a "total liquids" basis, one might expect some offset, since part is being adjusted upward and part downward.
Khebab made these estimates of expected bias in 2006. It is likely that they will change over time. One possible reason for such biases is the practice of estimating future production based on past production, if new numbers are not yet available. If production is declining, as is often the case with crude and condensate, there would tend to be a bias toward over-estimation. Also, if wells are taken off-line for maintenance, or because of a storm, using recent months production as an estimate will tend to miss these dips in production, also leading to overstatements.
Khebab's analysis showed that for portions of "All Liquids" other than crude and condensate, estimates tend to be revised upward. If we think about the matter, these liquids, such as ethanol, tend to be growing over time as a percentage of all liquids. If the same method is used for estimating these (using past months actuals to estimate the most recent month where production is unknown), it is not surprising that they will tend to be biased low, and show upward development over time. Since the "other" items tend to move in the opposite direction of crude and condensate, it is likely that there will be less bias in total liquids estimate than in the pieces.
In this analysis, we are really concerned with the crude portion, not the other items Khebab analyzed. If anything, we might expect crude estimates to be even more overstated in 2008 than 2006, because more countries are experiencing production declines.
One thing we can learn from the recent revisions and from Khebab's 2006 analysis is that we shouldn't put too much faith in the estimates for recent months. The crude and condensate estimate of 74.481 million barrels per day appears to be new record, but this is only 215,000 barrels higher than the record of 74.266 set in May 2005. If we estimate the expected downward revision at 300,000 barrels per day based on Khebab's analysis, the revised amount is expected to be less than the May 2005 record.
Saudi Arabia and Iraq
When we look at the data, the majority of the recent increase in production is from Saudi Arabia and Iraq. I have graphed the EIA crude and condensate production for these two countries, in this stacked graph.
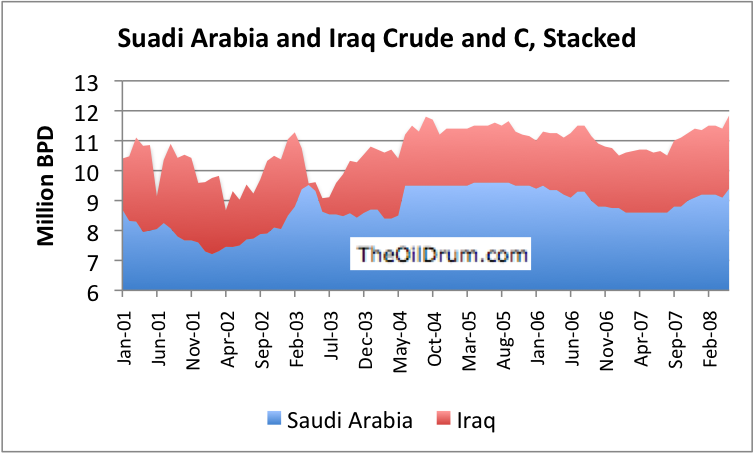
One thing that a person notices about this data is that it is very irregular. The reason that May 2008 looks high is because there were dips in production in 2007 for both countries. The May 2008 numbers are close to the highest production each of these countries have reached, during the period graphed.
One thing ace pointed out to me is that while the May 2008 production estimate for Saudi Arabia is shown as 9.4 million barrels a day, both OPEC and IEA data show Saudi Arabia's production for May as about 9.2 million barrels a day (9.18 million BPD for OPEC and 9.21 million BPD for IEA). Since both of these sources agree with the EIA's April production estimate of 9.1 million barrels per day, the differences in May production estimates raise questions as to whether EIA's May estimate is correct.
The estimation of Saudi oil production is very politically charged at this time, with the election in November. If the EIA gets its initial Saudi estimates from a third party, it might be that the third party allows political motivations to affect its estimates. If the estimate is wrong on the high side, it might be pleasing to the current administration. Who would notice an extra 200,000 downward revision, with all of the other revisions? This additional estimation issue adds further to the apparent bias in the May numbers.
Production Trends for Other Groupings
I thought it might be interesting to look at production trends for other groupings as well.

The graph shows that production now is at a level similar to that in late 2005, when increased production was requested after Katrina hit. Production for these countries also dipped in 2007, similar to the pattern we saw for Iraq and Saudi Arabia.
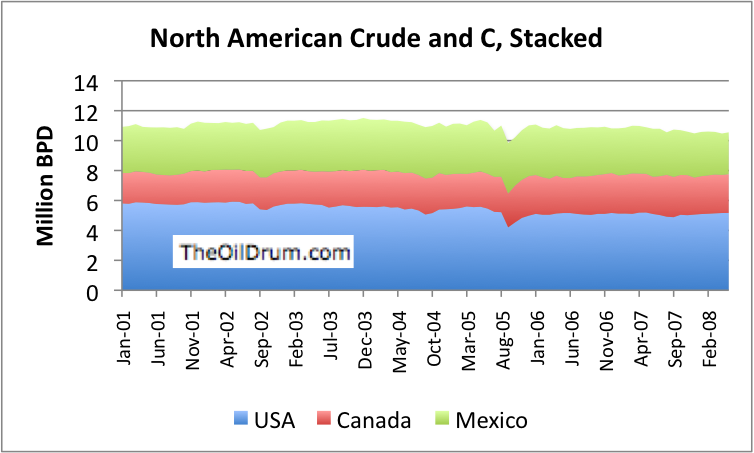
This graph shows the stacked production of the United States, Canada, and Mexico. I have grouped these, since these are our closest trading partners. The dip in 2005 shows the impact of hurricane Katrina and other 2005 hurricanes. Oil production in United States has been declining since 1970. Mexican production began declining in 2005. Canadian conventional production is declining but tar sands production is increasing, providing a small overall increase. One can see from the graph that in total, North American oil production seems now to be declining slightly (about 300,000 BPD in the past year).
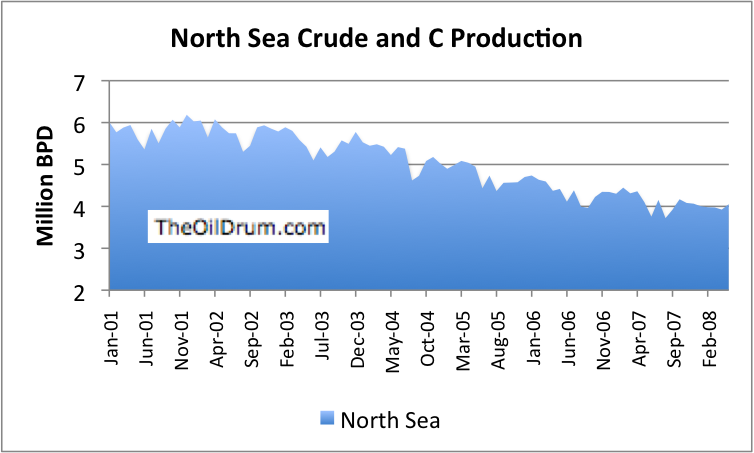
This graph shows that North Sea production has been declining, since 2001. The various attempts to hold production up do not seem to have reversed the decline.
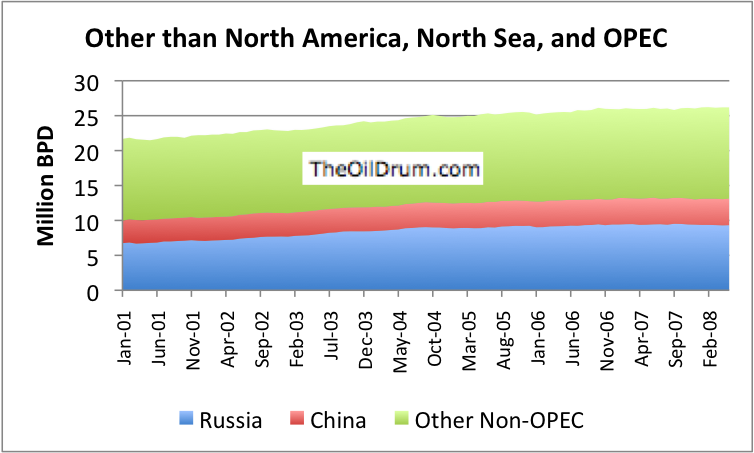
This graph shows recent trend in oil production for the "all other" category. The biggest countries in this grouping are Russia and China, which I have shown separately. This grouping also includes all of the non-OPEC countries in South America (including Brazil), the non-OPEC countries in Africa, the various Former Soviet Union countries, other than Russia, and Asian and Australian production.
One can see from the graph that the production for this grouping is still increasing slightly. In the past year, production for this grouping has risen by about 200,000 barrels a day.
Observations
In looking back over the graphs, there is not really very much upward trend in oil production for any of the groupings shown. OPEC production bounces around; an upward trend is not clear. North America and the North Sea both show declining production. The "All other" group with Russia, China, Brazil, and the "stan" countries shows only a slight upward trend--not enough to offset the declines elsewhere.
Contact
- Content: editors at theoildrum dot com
- Tech support: support at theoildrum dot com
License

This work is licensed under a Creative Commons Attribution-Share Alike 3.0 United States License.
Nice article.
Just a couple of small corrections:
record oil high production should be record-high oil production
and
Saudi Arabia and China should be Russia and China
Thanks. Should be fixed now.
Gail: in our article "Did Katrina Hide the Real Peak in World Oil Production?"
http://www.theoildrum.com/node/3052
we calculated in Table 12 that a crude peak - without Katrina - in December 2005 would have been 74.73 million barrels/day. So for those who are looking for monthly peaks, we still haven't exceeded this.
Here are the updates of the graphs:
We see:
Crude oil plateau is bounded by 2 underlying peaks: one in 2005 (declining and peaking group) and another shaping up now (hitherto growing group); Saudi uptick; Russia peaked; everything under Iraq and Saudi Arabia is practically flat
As far as I can see, the debate is over regarding the peak in conventional oil production.
In their 'high price case', the EIA says conventional liquids will peak soon (2010). It will be earlier than that, of course, because they lump natural gas plant liquids with conventional crude oil to get what they call conventional liquids. Even ASPO believes natural gas plant liquids will increase in coming years. So, even with NGPL increasing, the EIA says peak 2010. The difference between the EIA's 'high price case' and Deffeyes' 2005 peak has diminished to just a few years -- maybe 3.
They currently regard their high price case as more likely than the 'reference case'.
I used "conventional oil" in the title of the graph below rather than "conventional liquids". You can clearly see how the EIA has revised their views over the years.
EDIT: I should add there is likely to still be plenty of debate on the shape of the slope post peak.
Excellent graph!
Given that track record and systematic positive institutional and governmental bias, perhaps amateur hour is not yet over??
EDIT: I should add there is likely to still be plenty of debate on the shape of the slope post peak.
The production curves of individual fields and regions may tend towards being more or less bell-shaped (is that true?), but I can see a reason why the world curve would have a sizable plateau.
Because there's a global market in oil, there's no immediate crisis for those large consumers that can buy or otherwise extract the oil from the global market. But matters are quite different in the case of the global peak. Here, given the way things are, there's bound to be a desperate attempt to ward off decline. And it can no doubt be done for a while.
Of course that flattening, a long plateau, means the dropoff is sharper when it does arrive.
Pure speculation -- caveat emptor.
This desperation combined with lack of adequate policy change is the worst nightmare regarding peak. I don't place much importance on the idea of a global peak per se. I'm more concerned with the stupidity of the mob mentality.
I just love that graph.
Wasn't late 2005 roughly when Fatih Birol replaced Claude Mandil as the face of IEA? (Anybody?) Birol is a peaker and started making statements (and revising estimates) in stark contrast to the Mandil-led regime. I have a theory that this may have effectively shamed EIA into coming correct as well.
So what have you and Nate been smoking tonight?
Like I said, it's just a theory...and I wasn't able to figure out when Birol became the go-to guy...what is your recall?
Hi Chris - I'm on vacation in S France and have succumbed to some of the local pleasures. Rumors circulating in Scotland that the Sun had gone out I find were over done.
I likely agree with your analysis that Fatih Birol has brought a new sense of realism to the IEA - BUT - the 2008 estimate showing crude production rising to over 80 mmbpd in 2030 is hallucinatory.
What event in the early 2020s is going to turn oil depletion around?
It is interesting to observe the shifting perceptions from 2006 to 2008. 2007 was a bad year for forecasting?
You lucky dog...it's been WAY too long since I sampled the pleasures of Provence! Have a duck confit or an epoisse for me.
Agreed that the projections of both are still too optimistic, but I think they're backing into the truth slowly. I, for one, will be extremely interested to see how EIA responds to the IEA report in November.
It's easy enough to say that the supply problem will resolve itself more than a decade in the future, if palliatives are what you're after. Such projections rarely get called out. So that's a nice little safety zone for them.
I think 2007 wasn't a bad year for forecasting so much as a good year for optimism. Energy stocks were all on a tear.
Nobuo Tanaka replaced Claude Mandil his position at the IEA. Fatih Birol is still the chief economist. It is said that the changeover from Mandil to Tanaka did lead to a different perspective within the IEA that is now driving upwards. But I have no proof of this, which makes it speculation.
I don't think this has anything to do with the EIA monthly corrections. Doesn't sound logical at all.
Yes, but Tanaka is rarely mentioned in the press, at least on this side of the pond. At some point--wish I could nail down when--the spokesman reguarly cited in the press switched from Mandil to Birol, which seemed to correspond with a distinct change in the tone of their announcements. Scuttlebutt I heard at ASPO-USA last year was that it was due to Birol's being convinced of a relatively near-term peak oil. My point about EIA is that they seem to have followed IEA, starting two or three years ago, in downward revising their projections. (Sorry, I didn't mean the historical monthly corrections.)
Hey, even I can follow that graph!
Perhaps when the Olympics are over, you can (try and) impress it upon MS media; tie it in with those current "white-out" back-drops the morning shows keep broadcasting. Or do they need the oil price to veer north again?
(The problem I currently have with with global-production graphs is, although they look flatish, they don't yet seem "scary" - to Average Joes and Janes such as myself, that is. And not-scary indicates little meaningful talk, much less action).
Regards, Matt B
From the Land Down Under
Interesting. But in all honesty, Iraq has NOT been running at full capacity since Desert Storm. With the embargo no longer there they could (in theory) get back up to their full potential (of ?? 6mb/d ??).
So, while the rest of the World's production goes downward the numbers from Iraq will make it look as if oil production is still healthy.
I agree--Iraq is one of the potential bright spots going forward. Even if they can increase their production by, say 3.5 million barrels a day, this won't last very long in meeting the world's increasing demand. I have not investigated this enough to know what a reasonable estimate of this amount might be, and over what timeframe.
I think the HL method would be tricky here as production was artificially restrained for over a decade (Desert Storm-2003), and then followed by the "above ground factors" (i.e., infrastructure destruction) that continues with the insurgency. Then there're the political factors of which of the 3 geographic areas can produce what amount.
On top of that, the reserve figures have also changed over time (to who knows what).
Would make for a good Geology Master's thesis though.
I take a slightly different view of Iraq's potential impact, in the future.
On one hand, I assign a kind of chaos dynamic to future Iraq production. Which means that it's so complicated to gauge risk of US withdrawal, US presence, Iran's influence, sectarian tensions, and Israel-Iran tensions, that I throw up my hands. I'm a big believer in keeping a strong "I have no idea what will happen" in my analysis, if that's what's called for.
However, one data point on which I can rely is the fact that daily Iraqi oil production has now fully recovered to the levels we saw prior to the Iraq War. Not to the two, monthly spike-peaks we saw when clearly the government jammed production higher, in anticipation of conflict. But, in 2008 we are tracking at 2.3MB/day. So that is easily matching the 2002 average of 2.02MB/day.
So what that tells me is that the potential swing higher, from current levels, is not quite the eye-opening swing it might have been, say, from levels 1, 2, and 3 years ago, when Iraqi production slumped below 2Mb/day . As important is consideration of the long-term damage to Iraqi oil fields that took place under previous rule. I should add I have seen or received some dispute over this idea from Iraqi Petro engineers. Perhaps a middle case is appropriate here: potential for significantly increased production lies in wait, in Iraq. But the speed by which that increase would take place may very well surprise, on the downside.
I assign high risk to the advent of both an Obama or a McCain administration. Simply put, they both represent change. This will provoke anticipations, reactions, and new dynamics. I'm not optimistic. My most optimistic case for Iraq oil production is that it could be crossing above the production level of 3Mb/day in late Q3 2010--with hope for 4Mb/day in late Q3 of 2011.
G
Gregor,
Which War? I remember reading that in the late 1980s Iraq had the potential to produce 6mb/d. That was before Desert Storm, the UN embargo, and then Operation Iraqi Freedom.
Also, production had been disrupted by the Iran-Iraq War that happened even before Desert Storm.
So production around the 6mb/d may still be a possibility
... or maybe not.
Iraq oil production never reached 6 million, Iraq maximum production took place in 1980 at around 3.3 bpd, the talk about 6 million barrel a day goes as far as the days when I was a kid living in Baghdad in the mid-80s, in order for Iraq to reach this 6 million a day number, it require massive multi-billion dollar investment program, but the issue is not really about money, the issue with Iraq is about politics, the hydrocarbons law has stalled for years in the parliament, the Kurds will not sign on the law before the issue of Kirkuk is resolved, and by looking at the deadlock regarding Kirkuk local election of late, the Kirkuk issue seems far from over.
The best Iraq can do is sign the long talked about technical oil contracts (even thought those have also stalled), should Iraq sign those, Iraq oil production can increase by 0.5 million bpd, however it is also worth noting that any political stability in Iraq will also greatly enhance internal demand which has been artificially depressed for too long, as a matter of fact Iraqi oil exports already decreased from 1.99m bpd in May to 1.85m bpd in July, due to the current relative stability:
http://www.iraqdirectory.com/DisplayNewsAr.aspx?id=6653
regards,
Nawar
Thanks Nawar,
This is the most credible summary that I have seen on Iraq. Demand must have been hugely depressed by all the violence and is bound to increase in the advent of stability.
ELM in action.
I didn't check my email until this morning and the first thing I checked (before I came here) was "what happened to the previous peak (2/2008). Given what's been said, we may be back (shortly) to the C+C peak of May 2005. That number has been adjusted several times, but it seems that we are zeroing in on a final number.
I will continue to note the former peak in my graphics because it seems that the latest one's eventually fall by the wayside.
As I noted yesterday, I think that the best way to handle the monthly EIA C+C data is to calculate the cumulative difference between what we would have produced at the 5/05 rate and what we actually produced. The last time I ran the numbers is was something north of 700 mb--and the cumulative shortfall has increased in 2008, albeit at a low rate. What this number measures is the cumulative failure of producers to simply match the 5/05 rate, despite vastly higher oil prices.
the EIA published new International Petroleum Monthly data. The new data revised downward previously published estimates, all the way back to 2002, with the biggest revisions in 2007 and 2008
We'll just change the numbers. How convenient.
Poof! No more Peak! What? Don't be silly, there's no man behind the curtain.
Now, let's go to the beach!
(groan)
IOW:
Shout the lie.
Whisper the retraction.
That is exactly what they are doing. As World Crude Oil Production (Including Lease Condensate), Part D clearly demonstrates, the February 2008 "new peak" is now no longer the peak. Later peaks are also quite likely to suffer from similar revisions.
You know, if all these "new peaks" in 2008 get revised BELOW May 2005, I will guarantee that none of the well-known trolls who screamed about these new peaks disproving Deffeyes will have the honesty to come back and admit they were wrong.
Further, I will state that as soon as another fresh "new peak" appears, these same trolls will reappear, shout the same bullshit, then vanish again as data accumulates against them.
I agree... There has to be more transparency about oil production. Hopefully, once Obama comes to power, everything would change for the better. We will have better understanding of the remaining resources, and then would be able to properly allocate them for future survival.
Modified Pickens Plan
REMEMBER: we do not have an energy crisis, we have a liquid fuels crisis
firstly, forget the wind plan aspect
One report from the gas industry says the US has 112 years supply of gas, or 2,688 TCF recoverable
OK, they are exaggerating, so lets cut that in half, and say we have 50 years supply, at current consumption of 24TCF/yr = 1200 TCF recoverable
Now lets convert cars to run on nat gas. Costs about $3000/car
If there are 100M vehicles of the right age & technology to be converted, thats $300B (half of one years oil imports)
So when you convert 100M vehicles, you increase annual consumption of nat gas to 73TCF/yr = 16 years supply. this assumes straight conversion, no hybrids, no new effiencies
In ten years the US will be producing 3 MBD oil. Canada is ramping up to produce 4 MBD in ten years. So sustainable 7 MBD in ten years
If total NA use today is 24 MBD, if we cut 1/3 due to efficiences, demand destruction, increased use of VESPAs and hybrids etc. Then cut 1/3 due to conversion of transportation to nat gas. Then we have sustainable 1/3 from domestic production
the key is a sustainable domestic economy. No ELM issues. The conversion would be a crash program. Manhattan project etc. But there is no technical risk here at all. If we do the conversion, we reduce global demand dramatically, and thus reduce price, and thus the effects of oil price on the economy. the nat gas conversion would be a big boost to the economy
the reduction of $700B in outflows would be a BIG boost to the trade deficit, and level of the dollar internationally.
Improve balance of payments
We thus get to keep the economy in some basic recognizeable form.
This gives us breathing room, - a 10 year window - the time to put a sustainable long term plan in place.
right now we are facing a brick wall.
On all of the Oil Drum, I have not seen any other viable plan, despite all the arm waving
REMEMBER, its not an energy crisis, it is a liquid fuels crisis
As Margaret Thatcher would say "TINA" or "There is no alternative"
In the face of a 4+ year plateau in oil production, I don't see the relevance of looking for a peak at a particular year or month. What matters most is how long the current plateau can be sustained and what happens when production falls off that level.
I don't buy the idea that a liquid fuel crisis is different from an energy crisis. As soon as we try to create a substitute for gasoline-powered cars, then the crisis becomes a full-on energy crisis. If we electrify our vehicle fleet or try to create a hydrogen-powered fleet, we transfer the the crisis to our power grid. If we convert the fleet to natural gas, or synth fuel from coal, etc., we create a general energy crisis.
I already believe we have an emerging generalized global energy crisis. India and China increasingly don't know how to fuel their electricity expansion plans. We are competing with the global economy for our coal supplies. Global demand is bidding up the price of fissionable uranium and alternative energy capacity, and so on.
The EIA says we are hitting all-time record production. We have not hit a peak yet. Even while Iran, Iraq, Libya, Russia, Nigeria, Venezuela, Mexico and even KSA labor under horribly repressive, despotic, backward, cruel, non-free market and undemocratic regimes. In other words, every serious oil exporter is run by thugs, and oil production reflects that. Surely, every country on the above list could be at least 1 mbd higher, were they part of the free world.
Still, reality is reality, and this political problem could take decades to solve and even then. What is remarkable is how world oil production keeps rising, while wonderful new technologies, including the GM Volt, come to market.
If oil stays above $100 (dubious proposition), then the GM Volt, and copycats, get introduced worldwide, and we will have radical declines in oil demand -- while our cities enjoy cleaner air and quieter streets.
Hard to see a downside here.
Never bet against the inventiveness of man in a well-captalized free society. Or against the price mechanism in commodities markets (unless rigged by speculators).
Anyway, I think the oil bulls have left town. They will take huge losses this month, than abandon ship. Then we get another price dump on the NYMEX.
Are you referring to natural capital? Social, built, human capital? Or just financial capital? (which of course is fiat, compared to the other 4)
Fallacy of composition. Perhaps a good bet with respect to a micro enterprise, it is certainly not true for the economy and environment as a whole. Where we should be running things on income, we are running on capital. And our scale is beyond what we can run on income. Ooops. Time for some creative financing, right?
It's not clear to me any more how "well-capitalized" our overall environment remains. The environment has accumulated far too many liabilities. We cannot build our way out by further drawing down capital.
We cannot build our way out.
Nor are we are not free to operate by a different economic paradigm. So much for the free society.
I would bet against.
cfm in Gray, ME
In the same vein, Poly says:
emphasis added.
Now, I don't know about him/her, but three grand is a chunk of change for me and I'm sure for a lot of other people.
Finally, there aren't a lot of natural gas fueling stations out there so the new infrastructure also has to be included some place along the line via an increase in the price.
Todd
The Western world, despite our nice mortgage mess, actually is enjoying something of a capital glut, which is one reason interest rates remain low. Asia and Europe every year produce capital surpluses, that need to be invested. I will quickly concede they have been burned by US residential MBS, and there may be fall-out from that. Still, compared to 20 years ago, the world has plenty of financial capital, and almost every worthy venture capital venture, esecially in energy, can find financing.
China is investing mightily in a wide variety of energy ventures, including several million acres of jatropha, and nukes galore, coal plants etc. (Also a GM Volt-tyope car is being built there, and they have many, many lithium battery companies). China has plenty of capital, and still buys US Treasuries, freeing up US capital. It has been a long, long time since anyone heard the expression "crowding out." I wonder if anyone even remembers what this means.
The point remains that nearly all the "thug state" oil exporting nations, were they free market states, could increase production by 1 mbd each, and no one argues that point. That would mean another 8-9 mbd on the market.
We are also lucky (answering Hagens q. again) that we are better capitalized in terms of education and human skills than ever before, and particularly the alternative energy sector is growing rapidly.
Is it not remarkable that France gets 80 percent of its electricty from nukes, and soon will be able to buy GM-Volt type cars? In short, they may be "home free" so to speak, in just 10 years. The U.S. will get there to, hopefully with healthy dollops of solar, wind, and geothermal power.
As to Mexico, Venezuela, or Russia, I find the people of such nations to be wonderful and warm. (I have not been to the other nations on the list). However, their governments are truly wretched and deeply corrupt.
Of course, in time, production in the Thug States would fall, even if they are free (although Heading Out says Venezuela has 1 trillion barrls of oi, 20 percent of which is recoverable at $1 a barrel, citing a Rigzone article.
I was being facetious. There is no such thing as financial capital. Money and credit are convenient abstractions that we accept as real, because others do.
Bank capital and growth only exist due to natural, social, human and built capital.
From natural capital comes natural interest, in the form of ecosystem services like wind, hydropower, biomass, etc. Our 'capital glut' as you put it, from a very high vantage point is due to us drawing down our natural capital instead of just using our natural interest. If we were forced to maintain society TODAY, on just the interest on our natural capital base, there would be NO financial capital.
Well, it gets nearly metaphysical here, but no such thing as financial capital? Yes, it is blip on a tape in bank, erased by a keystroke. An IOU, or credit, exists as a figment of the imagination.
So does a marriage contract. Try telling that to your wife. Is it real?
Fact is, if a Chinese company came to me, and offered me a fat contract, I would take it. They would pay me, and I would have real buying power.
The financial system has worked now for 70 years or so. The S&L crisis of the Reagan Era was worse. Bu$h jr. is trying hard to top Reagan, but he can't. He is crewing up pretty bad, but no that bad.
In the real world, there is plenty of capital out there, and it is getting invested in companies doing real things. And, int he real world, we may see a France in 10 year geeting 80 percent of its power from nukes, and driving GM-Volt type cars around. They will have cleaner air, quieter citie, and much, much lower oil bills.
If lazy France can do it, taking their 8 weeks off a year, I suspect we can do it too.
So it seems a batch of contaminated weed is circulating in cyber space.
The S&L crisis was worse? Horse manure! The S&L crisis was just over $100 billion TOTAL. This crisis is far from over and has already cost well over $400 billion with respected professionals all estimating that it will cost at least $1-$2 trillion before it is all said and done.
The S&L crisis was worse? This one hasn't even gotten started yet.
MF says "If lazy France can do it, taking their 8 weeks off a year, I suspect we can do it too."
Hmmmm. Forbes recently published data showing that the French are more productive than Americans. Now by the fuzzy logic you have been using in your posts, I guess that makes Americans lazy - no, excuse me, lazier.
I can't speak for the general populace or my learned colleagues here on TOD, but my experience with American productivity was an eye opener to say the least. At times, I'm sure the phrase "work smarter, not harder" never got wide circulation throughout the country.
When I first moved down to FL I would go about my usual daily engineering work and those working with me were astounded how much I got accomplished - and, I'm not the always the most productive person. These clients were used to having three people doing the same work. I thought that if this is the way these guys work they wouldn't make it to coffee break in Canada (this does not include government jobs BTW, there they would fit right in).
The notion of great American productivity is BS - a myth. It is accomplished by throwing more bodies at it, often at lower and lower wages. I'm sure the economists in the crowd would agree this is the result of increased productivity (in the GNP sense) with a static population. There's less money to go around.
Did it ever occur to anyone the French take 8 weeks off because they can?
Excellent comment. Also did it ever occur to anyone that there are are other qualities of life. Obsession with increasing material possessions but not taking time off to enjoy life, IMHO is not a desirable path to quality life. BTW I believe that the French worker is entitled to 5 weeks vacation not 8.
More like a debt glut. And have you been asleep for the last 9 or 10 months? Did you miss the credit crisis entirely?
"The Western world, despite our nice mortgage mess, actually is enjoying something of a capital glut..."
I repeat, both Europe and Asia annually, regularly, continously are producing excess capital that needs to be invested. China, Japan, even Thailand every year accumulate capital surpluses. Europe's aging population routinely saves more than it spends.
Do not confuse the lamentable lending practices of U.S. home mortgage bankers with a global capital surplus, even glut. This fount of capital is a wonderful reality.
Ask yourself: Have you heard of any good ideas in energy or even alternative energy that lack for funding? From my observation, even so-so ideas, or even bad ideas can get funding. No one disagrees with that. If you know of a truly great idea in energy that lacks for funding, then visit some VC guys. You will get funding.
Happily, we do not live in a time where a creative group of engineers might have terrific ideas, but no funding. This is different from even 30 years ago. Back then, connections played a large role in getting funding, and the venture capital market was nonexistent by today's standards. In this aspect, the world has changed for the better.
So, we have smart people, we have capital.
And we have an example of an economy making a easy transition to a post-fossil economy. France gets 80 percent of its electricity from nukes, and starting in 2010, can migrate to much, much higher mpg cars, such as the GM Volt.
I see only daylight here. Cleaner air, quieter streets. Radically lower demand for oil.
Surely, we can emulate the France model, adding in solar, wind and geothermal power.
Where is the downside in this?
And if someone is smoking pot, can you pass it over?
Add this: Nissan's new line of EVs is powered by lithium-ion batteries manufactured by the joint Nissan-NEC venture called AESC, which plans to invest $12 billion USD over the next three years to build battery production facilities.
One company, spending $12 billion.
That is not what I call a capital-short world.
Nissan plans to sell cars that go 100 miles on a charge. (No onboard recharger, as with the GM Volt, however. I like the GM Volt idea better, Go 40 miles, go to onboard charger and get 50 mpg.)
That's one company, spending $12 billion, on one line of cars, with tremendous promise for eliminating the need for gasoline (transportation accounts for 70 percent of our oil use).
In 10 years, oil demand coul be radically reduced, while we get cleaner air, quieter cities.
I say we go for it.
Giddaye Millard,
I've been in video production for 23 years; have been using pro-grade lithium-ion since their inception. Very reliable. However...
They still take a while to charge fully and properly.
Though I take particular care of them - store them properly when not in use, don't subject them to knocks, etc - their total life is still limited.
Replacement cost continues to be rather expensive.
Some of the bits that go into them are part of the non-renewable, finite source situation.
As I see it, it's the "new technology" that will save us. And that may be the problem.
Regards, Matt B
This capital surplus or glut you are talking about only exists because we're in a cheap energy glut. Or at least we were up until about a year ago. I suppose we still are to some degree, but take another look at the growth rates of your beloved asia. They are on the verge of contracting, the ones that haven't contracted already. Some asian stock markets have lost 30%. The Shanghai Composite has lost more than 50%. Global economic growth is precarious at best. And this is happening while oil is still on the plateau. How long do you think it will be before there is a total meltdown if oil goes into decline?
"And if someone is smoking pot, can you pass it over?"
I will; when you get your ratings back to zero.
Millie: I, unlike everyone else here,dont think you
smoked something...I think its gotta be intravenous.
The flush capital you were speaking of is fiat.
The "thug state" comment was hilarious also....when did Iran ever attack anyone??? Tens of thousands of Jews actually prefer Iran to Tele Aviv and have done
so for thousands of years.
But the punch line had too be that skit about being
better educated...hahahahaha....I cant tell you how many times Ive placed a bunch of broccoli or asparagus
on a grocery store counter and the college girl working her summer job,didnt know what it was....she
had only seen it come from a can or frozen from a plastic bag.
Not to seem like a chauvinist...most educated men
today couldnt change the oil in a lawn mower.
The skills you spoke of elude me.Iam willing to bet
some fiat currency too see if many people under
40 in America would recognise a clothspin...let alone
be able to "work" one...hahahahaha
True. We saw what happened in Texas and the North Sea when horribly repressive, despotic, backward, cruel, non-free market and undemocratic regimes seized control of the production facilities:
It's amazing how few people know about the Midland, Texas based Communist takeover of Texas production and the radical Vegan terrorist takeover of North Sea production. Go figure.
WT, here I am getting ready to go mano a mano, but you simply tie the guy's shoelaces together.
O.k. folks (and sorry davebygolly), but I'm going to put and end to this gross mis-use of the Spanish phrase mano a mano!!!
It does not mean to "go man to man" in conflict. It actually means "hand to hand" and is an expression to signify doing something together. It's a colloquialism for cooperation.
So, mano a mano actually means the opposite of what so, so, so many people believe it means. And that goes for all the sports show talking heads.
Sorry, but this is one of my pet peeves as it is one of the grossest of displays of ignorance. Don't take it personally Dave, and I'll be cutting back on the coffee now...
however hermano a hermano means "brother to brother" and mano a hermano is sibling rivalry and hermano a mano is, well, ask your parents.
No offense, but now I'm confused. Here's Wikipedia:
http://en.wikipedia.org/wiki/Mano-a-mano
Are they wrong too? I know lots of Spanish speakers -- I'm going to check it out. I did know it meant hand-to-hand, not man-to-man, but thought it was combative in connotation.
EDIT: Also http://www.merriam-webster.com/dictionary/mano+a+mano
So whatever it means in Spanish, it seems to have my meaning in English.
Well, I've lived and loved in S. America and that is what is meant. I would hazard a guess Merriam-Webster have it wrong. Mano-a-mano means "hand to hand" as in joining hands like you would with your wife or girlfriend (or other...). It may have got maligned with an association with the French "tete a tete" (head to head) which is somewhat antagonistic in connotation.
Somewhere I think it got misappropriated in the U.S.
So "mano a mano" is now English, and means the opposite of what it means in Spanish.
Why is anyone surprised? This would not be the first time a foreign word entered English by changing its meaning! ;)
English words change their meaning over time, too. Try "gay," for example. Borrowed and butchered words are nothing new and nothing to get excited about. Not that you are doing that, mind you; just extending your point.
Cheers
World production so far looks a lot like the N. Sea pattern in WT's chart above. This year might or might not make that nice little apex to for the World's "multi-year plateau."
If so, we all have about 3 years left to get our personal affairs in order before Wiley goes tumbling down the energy hill and humpty dumpty can't find all his pieces, and ...
(note to self, cash out of investments early to avoid the run on the banks across the world... pixels in a frozen account will be lost and will evaporate ... )
F***in Commies
You might consider that in your characterization of oil producing states as thug states, and your implication that they are dysfunctional, that these observations are actually very much in agreement with resource depletion, and the political behavior that attends scarcity. I encourage you to review the theories of Scarcity Rent, and also the Hotelling Rule. Simply put (though you should read over the concepts for yourself), when producers of a resource finally become aware of its value, they start treating the resource differently. They might hoard it. Or they might sell less of it. In Harold Hotelling's case, he observed that an awareness sets in when the value of the resource is seen to be appreciating more rapidly when left in the ground, than any capital one could receive in exchange for selling it.
There are other important factors which have led to the political conditions you describe, in many of these producing countries. But frankly, whether they could produce "lots" more oil is less the question than what would happen were they to convert to much higher-functioning economies. For example, what would happen to domestic oil consumption in Nigeria, were it to suddenly convert to a much higher-functioning economy? Nigeria's population is an enormous 138 million. The demand that you could unlock, domestically, with a transformed government with massive infrastructure projects would be astonishing.
Even while Iran, Iraq, Libya, Russia, Nigeria, Venezuela, Mexico and even KSA labor under horribly repressive, despotic, backward, cruel, non-free market and undemocratic regimes. In other words, every serious oil exporter is run by thugs, and oil production reflects that.
Actually, my question would be: why are some of these producing so much oil for export, and neglecting their domestic economies? In general, if I were to step back from the situation, and simply look at the population levels and the amount of exports, I would conclude that many of these countries are sacrificing the health and wealth of the people to keep the rest of the world well supplied with oil. It's case of shifting perspective, therefore, when we think of them as not producing "enough" or perhaps producing "too much."
G
Enter Maximum Power Principle, when translated to economics via human neurobiology. The leaders in these countries want to maximize their current power (i.e. palaces, favors, influence, parties, feeling of power, etc.) which goes AGAINST Hotelling theory. They are in a sense, addicted to their oil revenues because their (and their broader network) have ratcheded up the money (via oil receipts) they need each month/quarter.
Takes a special ruler to think a decade ahead, let alone a generation.
I agree with Memmel that underlying the logistic curve of oil 'production', is really the human demand for more 'power' as defined by the current socio-economic system, which of course is, economics.
It will be interesting to see in which cases, if any, true Hotelling theory holds. Personally I think it will only hold true in countries that have vast surpluses of energy vs. population - the only one that comes to mind is Russia - they might choke in some production and forgo the money because they don't need it - I don't see it happening in KSA, Nigeria, etc. Too much fixed expenditures to cut off the cocaine sales in any meaningful fashion.
Top points supporting your observations Gregor. First, the US and other consuming nations should send a thank you card to some one the most despicable dictators on the planet. One who I observed first hand is the ruler of Equatorial Guinea, just next door to Nigeria. With a population of only 500,000 they are the richest nation per capita on earth thanks to their new oil production offshore. At least technically they are. I drilled wells there last year and got to watch a nation slowly starving to death. Besides destroying the fishing fleet so it couldn't be used in an coup attempt (which is why the general population is so protein poor) he also stopped the malaria spraying program his predecessor (his uncle whom he murdered) had begun. Much easier to control a population when they are diseased and starving. My guess is their oil income for 2008 should be somewhere north of $80 billion. I was told an extended family of around 300 get all the income. Even just witnessing this little nightmare on my trips between the airport and the camp become too much. I chose to not work there anymore.
Secondly, regarding control of commodity markets for ones own benefit we can’t point a finger too sharply at anyone else. Most Americans don’t know that prior to OPEC there was another organization that had absolute control on global oil prices by controlling the flow of oil to the market. It was an “allowable system” under which operators who were controlled by this group were allowed to produce just a certain percentage of the their production capability. The allowable was set every month and was adhered to under penalty of the law. This kept oil prices artificially high through the 40’s to 60’s. This mean and evil group that told the world how much oil they could buy: the Texas Rail Road Commission. An odd name but this is the group that regulates, to this day, oil and gas production activates in the state. As Texas was the “Saudi Arabia” of that time they wielded this power to our benefit. The allowable system is still the law of the land but since the late 60’s the allowable has been set at 100%. If Texas, for some unimaginable reason, wanted to limited oil production in the state to 10% of current rates they are free to do so. Bullies really aren’t so bad if you’re one of their friends, eh?
Commodity trade usually has a way of promoting the strongest over the weakest. Oil, Gold, Diamonds, Uranium, none of these have come about guilt free. I only hope humanity gets past this brutishness.
In regards to the TRRC,
Lack of competition always lead to the worst abuses of power(or best preservation of resources, your choice).
So true Greg. But the TTRC powers will come in handy when TX secedes from he union. Damn…I bet some of the Yankees around here heard that!
As I understand it, Texas doesn't have to secede, it only has to not resign the annual agreement. That's it, it's been a slice, time to move on folks. I probably got my information from some conspiracy site, but I understand Texas is the only state that is part of the Republic on a year by year basis.
While living in the U.S. I became a staunch constitutionalist I guess.
I've lived and worked in Venezuela and it is none of what you have described. The only thing that makes the country appear that way is the massive smear campaign by the U.S. because Chavez won't do what they want.
Matter of fact, Notre Americanos (or Gringos) could learn a lot about how to live from Venezuelans. And the U.S. is a free and democratic nation? - Ya, right. We'll see how dysfunctional it is come this November.
I agree with you post but wonder how long you worked in Venezula? Notre Americanos? You meant Norte Americano, no?
I have similar opinions about the world's perception of Venezuela, but as I travelled through South America, it seemed that everyone who had visited Venezuela had either been mugged or knew someone who had, and most folk recommended going via Columbia instead (very few horror stories from anyone who had actually been there). So I never made it to Venezuela (and Columbia was fantastic, btw).
So I'm left wondering about the first hand reports I heard. Was this caused by the poverty left behind by the tyrants before Chavez? Or anti-imperial hate? Mismanagement of the economy? Or none of the above?
Ladies and gentlemen,
may I remind you of Todban and Greasemonkey for Firefox for filtering TOD comments.
If you don't want to filter programmatically, just ignore the trolls.
Users who comment with max two weeks of membership and start spouting incomprehensible streams of consciousness with absolutely no data, splattered with ideological fervor and showing complete lack of not having read a single study on the issue....
Well, just ignore them. Glaze your eyes over. Move on.
Life's too short. Concentrate on the important.
This doesn't mean we shouldn't debate and entertain the opposite view, but it needs to be grounded, well argued and backed up with more than just hearsay and ideological posturing.
Cornucopain du jour, which may be the same person, or a small group of persons.
I think you are misunderestimating the amount of ignorance out there in the world WT. The pool of idiots out there is plenty big enough to account for this steady stream of Cornucopians without blaming 1 or 2 stubborn trolls.
Rigged by speculators? Sheesh, man, the government is rigging the damned market now! Free market? WHAT FREE MARKET?!?!?!
The entire thing is rigged, top to bottom now.
You are making an appeal to your deity (free markets) when such a thing does not and never did fully exist. Your entire argument is based on a fallacy. Since your assumptions are erroneous, it is no surprise that your conclusions are erroneous. And since they are your assumptions, you will most likely refuse to review them logically until they fail you catastrophically.
Millie: If I were Jewish (not saying Iam not) I would
be allowed to immigrate to Iran, but if I were
Irainian I wouldnt be allowed to immigrate to Israel
unless I were Jewish.
Millie: Iraq is run by America...it being an occupier
and all. I could see how you might have missed the past nearly 7 years. If I were living in a cave in a
remote part of the world I might have missed that fact
too.....(no I dont think so)
Millie: Can I call you Millie? I ask cause Iam fond of
that name as I once lived with a family of Gypsies for
a year and the youngest girls name was Millie!
Russia isnt "despotic" as you put it. Russians are
free to leave or come and go as they please.
Moscow has arguably more billionaires then any city on
earth. Many Russians immigrate to USA. Many go back
to Russia all the time.
You must be confused with the Bolshevic era. I suggest
you look at todays date when viewing the classic cinema movie channels
Oh Oh Oh....the south American states had all their
"thugs" trained in the good ole USA at the
"SCHOOL OF THE AMERICAS"...Theres that educational
skill set you were speaking of in an earlier post.
Look up "IRAN CONTRA" and get back to us....and
Thanks for stoppin by Millie!
I agree kenny. And you don't have to look to far to see the connection. Last Jan, at the peak of the "high season" natural gas was selling for $7.50/mcf at the well head. This spring, the "low season", as oil shot up the price of NG went over $13/mcf. Today it's back under $10/mcf. Much of the winter gas supply has been going into storage during the summer at these higher prices. A lot of folks could be truly shocked when they see their heating bills this winter especially if higher oil prices keep the pressure on NG prices.
Also, China does have a few ideas about future energy sources. Five months ago I saw report claiming that China was starting up one new coal fired elect. plant every two weeks. Additionally they were also killing an average of 10 coal miners a week. The price of progress I suppose. Given that the great majority of electrical power increases in the US over the last 25 years has been done via coal there isn't too much we can complain about their plans.
Building a new coal-fired plant every two weeks is not the same thing as sourcing the coal to keep them all operational.
I missed your point kenny...are you implying they're building the plants but aren't running them?
I think he means they are having trouble procuring enough coal.
http://environment.newscientist.com/article.ns?id=dn13765
The Australians are having trouble keeping up with demand. Google around for coal ships waiting to load.
I believe the spot price of Uranium was recently around $50/lb down from about $150/lb a few years ago. During this time oil has gone from around $40 to around $120 and coal has gone up by an even larger percentage.
Speaking of electricity expansion, I have been hearing for a while about the squeeze on worldwide diesel fuel availability resulting from the increasing use of diesel powered generators for prime power in critical installations around the world. It has also been noted that gasoline in the United States is still relatively cheap because of the fact that most of the world's transportation system has been optimized to run on diesel.
But I have been thinking lately that if diesel fuel becomes too expensive or unavailable, there's no reason why electric power users in other countries would not start relying on spark-ignited, gasoline powered, prime mover-driven generators for prime power applications. Manufacturers like Cummins and Caterpillar already make large spark-ignited gen-sets for use with fuels like digester gas and landfill gas. It probably would not take much re-engineering at all for them to produce large prime movers (over 500 kW) that run on gasoline. And storage of large amounts of gasoline is already a well-established technology (otherwise, we wouldn't have gas stations). I think the demand for increased availability of electricity in other parts of the world could soon put a squeeze on the availability of gasoline in the US. Any comments?
With the shortage of petroleum, it is hard to believe that any fuel will be under-utilized for long. Gasoline may not be optimal for prime mover applications, but if it is available, and diesel is not, someone will figure out a way to make use of it. It seems like gasoline could be used for other applications also, such as home heating oil, with some adaptation.
Besides a liquids fuel crisis, we also have a capital availability crisis that is gradually unfolding through the financial system. Governments will be in much less of a position to subsidize new programs, because they will be up to their ears and beyond in paying off defaulted debt (Fannie and Freddie, banks, insurance companies, airlines, auto makers, etc.). Banks will be in such bad shape that they will not be making loans to private businesses either. All of this makes any ambitious plan to build new drilling rigs, add new natural gas production, convert cars to natural gas usage, and the rest much less doable.
Gail,
The lack of capital availability means that practical 'demand destruction' is going to have to come from the simple things with short packback times that can be paid from cash in hand.
Today I got a pack of low energy light bulbs free in the post from British Gas. This is part of their requirement by the UK government to get demand down. Yes - it's the sort of thing they should be doing and it is probably more cost-effective than drilling in the North Sea for more gas.
It seems to be working - according to the latest BERR stats UK domestic delivered energy demand peaked in 2004 and had declined by 9% for 2007.
In the current financial climate maybe what's needed is a long list of simple affordable methods of demand destruction rather than a short list of investment-intensive methods of alternative (or even just more-of-the-same) energy supply.
BobE
"...we also have a capital availability crisis..."
The irony is that oil producing areas currently have the most capital to prepare for peak oil. IIRC, there have been several recent announcements of big solar projects in the Gulf countries.
Alberta's government is subsidizing expansion of local mass transit and possibly passenger rail between Calgary and Edmonton. Also, they are pushing micro-generation in a big way:
Micro Generation
The big losers in PO are going to be the people with the least capital.
It will be probably be bimodal.
Actually the people with NO capital (which includes about 3 billion people), may not be much worse off.
The people with LITTLE capital - I agree, are going to be in bad shape.
The people with LOTS of capital (and by this I mean money, not forests), are probably going to be worst off of all - because the difference between their old and new realities will be the greatest.
The bigger they are, the harder they fall, eh.
Unfortunately the limitations in the financial system will also make our transition to a carbon free economy so much harder. We can expect a dramatic climate change in the Northern hemisphere once the Arctic summer sea ice is gone, maybe already by 2013.
The Australian public broadcaster ABC TV (4 corners program) had a film on this problem this week:
The 2013 year is from this study:
Causes of Changes in Arctic Sea Ice; by Wieslaw Maslowski (Naval Postgraduate School)
http://www.ametsoc.org/atmospolicy/documents/May032006_Dr.WieslawMaslows...
Latest news always here:
http://nsidc.org/arcticseaicenews/
The best record of sea ice thickness is here:
http://nsidc.org/images/arcticseaicenews/20080717_Figure5.png
Watch this video, how ice is flushed out of the Arctic, in winter:
http://www.homerdixon.com/download/arctic_flushing.html
Hi Matt, in a nutshell what's the latest thinking that leads you to think this/what change do you expect -I live in London btw.!
(I've heard if the gulf stream slows/stops we are in trouble but this is a bit 'Day After Tomorrow, no?...)
Nick.
I am not a climatologist but continental climate over frozen ice will change to a maritime climate over open waters. Everything will change: humidity, salinity, ocean currents, winds, precipitation, temperatures, new feed back loops, Greenland surrounded by warming waters.
I have the impression that regional climate models have not been developed yet as the speed at which the sea ice disappears has surprised all climatologists.
Read here:
http://www.abc.net.au/4corners/content/2008/s2323805.htm
It's not fantasy stuff, no. It is very real and can happen in a few years' time, and has. Excellent general info on the topic:
Rapid Climate Change
Article on ice evidence:
Greenland Ice Shows Rapid Climate Flips, Study Says
Some modeling:
Day After Tomorrow?
Cheers
Those thickness estimates and current daily Northern Hemisphere extent trend graph are what have me thinking we might yet hit last year's record. Personally, I think people are failing to fully account for all the new methane being released from hydrates and permafrost.
Cheers
EDIT: Late note (early for those in the Americas): there's a slowing of the decline in the 8/8 images for the Arctic, but that will likely disappear as the trend should be down through mid-September. However, it could be a significant change since it kind of breaks the trend since August 1st.
polytropos,
I think you’re making a rather grand assumption regarding increasing NG production from 24 tcf/yr to 73 tcf/yr. With all due respect to you and Boone this is my daily business (I’ve got over 20 wells drilling in unconventional gas plays right now). Short of quadrupling the number of companies, drilling rigs and personnel in the oil patch it will be difficult to even hit half the increase you offer. I just finished an analysis of unconventional gas drilling and we are quickly reaching a peak. Wells drilled just 2 to 3 years ago are beginning to go into steep decline. It will take an ever increasing effort to maintain existing levels of production. Just a guess at this point but it difficult to see much more than a 20% increase in the short run but even less in a longer time frame. In other words, peak unconventional gas is not too far away. Again, just a guess, but I would offer a 5 year time frame.
Just as in the case of PO how much NG is in the ground isn’t nearly as critical as the rate at which it can be produced. And there is significant competition for existing NG production. If we see an exceptionally cold/long winter the public could be hit with significant short term delivery/price problems that would make any push towards a national strategy of LPG motor fuel all the more difficult to sell.
But I do think going forward with PLG motor fuel is a good idea. Every part of the puzzle will help. But it’s difficult to see it carry too big a load in the overall effort, IMHO.
Rockman,
If you have any information you would like to share on your unconventional gas projections, (or on other matters), send me an e-mail. I could help make it into a post. My e-mail is GailTverberg at comcast dot net.
Thanks!
I agree with Rockman. As people drill for new NG fields all they are finding are smaller and smaller fields. NG fields act pretty much like bottles of compressed gas (which they are for all practical purposes). The smaller fields just "fizzle out" that much faster... meaning that the drilling crews have to run even faster to the next site.
Thus the popular comment that you need to run twice as fast just to keep in place.
You can have a case with twice as much gas in several smaller fields than in one large field, but the faster depletion (fizzle) rate - along with the need to keep drilling crews moving - will just keep your production falling faster than the single field.
In trying to explain to people the difference between conventional gas wells and the unconventional tight gas (as we have a fair amount just north of us here in the WCSB).
A conventional well production life is like emptying an air mattress. An unconventional tight gas well is like a fart.
So to make up for one air mattress that is a lot of beans!
BC,
How eloquent. I’m almost compelled to change from Rockman to Fartman. But the analogy is excellent…no matter how distasteful.
So you think CHK paid too much
to acquire 4 000 acres from the AR Game and Fish?
$29.5 million and 20% royalty.
Kinder Morgan and Boardwalk are both building/built pipelines across (from west/east Arkansas/Louisiana.)
"The $1.3 billion Midcontinent Express Pipeline, a 500-mile natural gas pipeline that originates in Oklahoma and terminates in Alabama. Pending necessary regulatory approvals, Midcontinent Express is expected to be in service by February 2009 and has an initial transportation capacity of 1.4 billion cubic feet per day. The project is a joint venture of KMP and Energy Transfer Partners."
Will we have enough to fill both?
They did in the current credit environment. CHK and XTO have largely represented the marginal 'growth' in the natural gas business last few years. They have done this not by organic growth but primarily by new acquisitions. The era of financing for this stuff has rapidly ended. I have heard that these companies cannot get financing except on their 'hedged' exposure (which may explain the flurry of nat gas futures strip sales in last 2 weeks).
The companies that can pay for new drilling and production out of cash flow are a smaller number than those that can get oil/gas production by borrowing money. For this reason alone, I think we're peaking in conventional production even before Barnett peaks and including extra bump from Haynesville.
Heres where net energy (e.g. high cost) is really going to come into play. Much of Haynesville horizontals cost $1 per mcf. Rockies shale gas cost is $5-7 per mcf. There now is a natural floor (barring another Amaranth) on nat gas prices because if it drops much more a good deal of marginal production will be shut in - due to lack of profitability.
In terms of production, we are well past peak in conventional gas. Maybe you mean we are peaking in terms of additional capital for the industry. If this happens, it is pretty much curtains, since we need to keep drilling new wells (and even increasing the number!) to keep production level.
One issue is that we are close to maxed out on drilling rigs, and old ones will need to be replaced. Someone will need to pay for these.
Hey Nate,
Where did you get your numbers on Haynesville horizontals?
From a hedge fund friend who trades NG stocks. I don't think there is a public research report on that but I will look.
Mc,
At $7500/ac (30 m/ 400 acs) X 40 acs = $300,000 per drillsite that is squezzing a bit of the profit out but with wells running $4 to $8 million it's still doable when you work it into the whole cost basis.
As I mentioned elsewhere: pipeliners don't tend to be risk takers. If the lines are being built the odds are good they will get filled...at least eventually.
Thanx to all above for your comments.
Rock, I asked because Boardwalk has commitments from
pipeline fillers and buyers.
I'm not familiar with Boardwalk but if they follow the same protocol most pipeliners do they don't put to much value into commitments unless they are backed up by some hard dollars. Pipeliners used to have their own engineering and geology staff review an operators real potential to deliver gas to the line. These days I suspect they use the consulting companies for this evaluation. And they may even charge to operators for that cost. Been a long time since I was involved in PL economics but many years ago they looked for a 7 to 10 year payout of their costs from the transport fees. I wouldn't guess how the numbers are crunched these days. But I could see new companies funded by investor $'s be more aggressive in these matters. If you can get enough gas PL’s tend to be very good long term investments. Regardless of what the gas eventually sells for the transport fee doesn’t change. And once a big line is laid into an area they’ll have an effective monopoly for a while…maybe a long while. And I’ve seen pipeliners slaughter local operators who had to take their price or shut their wells in indefinitely.
James,
I searched Boardwalk and they are the real thing. Big time PL player. If they think the gas is there then it's a pretty solid bet.
Poly: The problem with all our ideas, yours included is trying to come with a strategy requires data we can believe. I don't know where you came up with the number 2500 trillion cu feet since you gave no source link. Go to the current EIA reserve figures and you will see that their number is 274 trillion for ALL OF NORTH AMERICA! http://www.eia.doe.gov/emeu/international/reserves.html. That is about 1/10th your number. Their estimates of Russian and middle east reserves are 2000 and 2500 trillion cu ft respectively(rounded off of course).Chesapeake and others will likely be adding to our reserves with their tight shale fields but that method of horizontal fracturing technology is expensive and the wells deplete rapidly. Converting our internal combustion engines to run on CNG is possible and the current advantage is that gas on a btu basis is costing 40% or so of oil so running on gas seems like a screaming deal, which it is, and you would pay off that $3000 retrofit pretty quick if that figure is in fact correct. If enough folks switch to CNG that btu differential would disappear in a hurry and so what was the point of the switch? Boone says gas stations would have to ante up at least $400 K to put in one CNG pump. The range on CNG is much less than diesel or gas unless you have a huge tank @3000 psi.Pretty nice bomb that the kids in the back are sitting over, eh? Putting CNG into our minimally efficient internal combustion engines when you could be burning the gas in a power plant at close to 70% efficiency with the new generation boilers is a much better idea IMO.Poly, the party is on its last legs. Where is your asphalt going to come from? Natural gas? Sorry. I think the best use of our dwindling energy sources is to accept only the solutions that move to non fossil energy sources and use that electrical energy in the most efficient manner possible. Electrifying transport is such a no brainer. We need to concentrate on adding electricity production from sources domestic whether from wind, solar, tides or nuclear and of course building areliable electrical grid. We need to be laying steel rails everywhere and stopping new asphalt roads. We can repair critical roadways for while longer but eventually you're looking at gravel roads, if you want roads.If you concentrate on increasing electrical output, a lot of options are possible.. Natural gas is too valuable to be wasted moving lardbutts down freeways in 6000 lb SUVs in search of elusive CNG filling stations.
I've been wondering about this, and I'm not so sure:
Watch the animation
or the same from Luís de Sousa:

or from ASPO:

The peak volumetric flow rate for oil+gas has high probability of being very close. Coal could be constrained as well.
If this all coincidences within 10 years, we're in for more than just a liquid fuel crisis. That's 87% of the world energy mix.
Remember what Hirsch and Bezdek found out: it takes 20 years minimum for a crash mitigation program that might avoid the worst of the effects.
I think we have an energy infrastructure crisis on top of a primary fuel shortage crisis if we continue on BAU. We may have potential replacing energy flows (solar, wind, geo, etc) but no overnight fix for the infrastructure we run on.
That's my take currently and I retain the right to revise my opinion as new information arises :)
I did something like that using GliderGuider's excellent work.
http://geocities.com/rethin/
We'll reach a total energy peak around 2017. I tried to figure how much solar/wind growth would be needed to fill the gap.
Polytropos, that's an awful lot of ifs.
I debunked much of it in my article of yesterday. Please see Of Ghosts, Unicorns and Energy Policy: Will Arctic Oil, Natural Gas, MIT, Paris and Pickens Save the Day?
That seems really arbitrary. I think you need to explain why "half" is the right number.
Whoa whoa whoa. That's nearly half the current rolling stock, which are typically replaced at the rate of 3-6% per year. If we assume there are 220 million vehicles (disregarding distinctions about cars vs. light trucks etc.) then replacing 100m of them will take somewhere between 7 and 15 years. What will natural gas prices be then?
As Rockman noted, that sounds well-nigh impossible to me.
I have my doubts about Canada, but leaving that aside, how can you call even the 7 mbpd "sustainable?"
"NA"? Where do you get the 1/3? As I asserted in my article, with a large conversion of vehicles to nat gas like this, it doesn't necessarily mean we will cut our use of foreign oil.
Really? So, no technical risk in trying to rapidly convert 100m vechicles, you say? No technical risk in rapidly decommissioning nat gas peaker plants? No technical risk in scaling up nat gas distribution such that it's available at your local gas station? No technical risk in radically beefing up the grid and deploying wind turbines from Mexico to Canada? And you're quite sure it can all be done in 10 years?
Actually, as the price of nat gas increases due to the new vehicular demand, and the price of oil drops, I would expect the conversion rate from oil-burners to NG-burners to fall off. Over a 10-year time frame, it's extremely unlikely that we would just eliminate the foreign oil component, as Pickens claims. Nor can you claim the $700b credit without also claiming the debit resulting from the state/federal incentives to switch to NG.
I think the Pickens plan has some merits, but what they are exactly remains to be seen. There are still a lot of crucial details left out. I hope he comes forward with them. Again, see my article...
Fleet operators are the ones most likely to convert to CNG. The big switch then would be from diesel to CNG. The amount of nat gas needed per year would be less and the number of vehicles converted to make a significant difference would also be less.
You seem to have it all worked out. Considered Politics? May be you could get all us arm wavers to wave in formation.
Looking A Little Downstream
Just a thought, but wouldn't recent developments in refinery capacity and construction have an impact on the oil produced? That is, more heavy sour crude could be produced as the refineries in India and China come on line to use the feed stock.
It's my postulation that we will see a true peak once the oil production and refinery capacity come more in balance.
A couple of thoughts:
I think that you may be right. I understand that Saudi Arabia and Iran both have some heavy sour crude that cannot currently be refined. With refineries built especially for this crude, it may be more salable, especially if Saudi Arabia and Iran will drop the price of the crude enough to compensate for the higher refinery costs.
Longer term, it may not make that much difference. Memmel has pointed out that it generally takes quite a bit of natural gas to refine heavy sour crude. As the price of natural gas increases, it may no longer be economic to refine heavy sour crude--it may make more sense just to burn the natural gas directly. If this happens, some of the supposed large reserves of heavy sour natural gas may evaporate.
I tried to find info on the Indian reliance refinery..expecting that it has come online by now...would this refinery be capable of processing this heavy crude?
http://www.icis.com/Articles/2007/07/23/9046296/Reliance-Industries-push...
Peak,
Here's another link but it doesn't mention crude type. But I beleive I read it was built specifically for ME heavy/sour.
http://www.downstreamtoday.com/News/Articles/200807/Reliance_Set_To_Begi...
Not only that, but I always wondered when we'll reach the point where oil will be priced on a cost plus basis?
Will that be at 10%, 20% or 30% down from the production peak?
Figure 1 looks like a C + C plateau since early 2005.
QUESTION -- Would May 2005 C + C production be higher than the 2008 if tar sands was removed from the C + C data (EIA includes tar sands in C + C) ? Tar sands is not crude oil as it is not pumped out of ground, other energies are used to process it, and the EROEI for tar sands stinks compared to C + C.
Given very high oil prices since 2004, this looks like PEAK OIL.
Thanks, Cliff Wirth
I'm not a petroleum expert by any means, but the Tar Sands does not qualify as conventional C&C. As I understand it, the bitumen product has to be blended with quality Alberta oil to make it usable for refineries. To mix metaphors, this is like using your best scotch to make a mixed drink.
I'm sure many others will clarify appropriately should I be incorrect.
All that said while I am about to start designing a large scale pumping and control system for aforesaid Tar Sands project. To quote Doc Holiday from Tombstone, "It appears my hypocrisy knows no bounds."
Thanks BC_EE, but you did not answer my question, so here it is again:
QUESTION -- Would May 2005 C + C production be higher than the 2008 if tar sands was removed from the C + C data ??
I'm not the one to answer that. I'm a relative novice. My personal opinion is I don't care too much about when the peak occurred or not, I'm more concerned with the present and near term affects. Other than bragging rights and historical foot notes, the date of maximum oil production has little value. Many may disagree with me, but I don't think a few kbpd is going to impact our life one way or another.
And, I've been meaning to ask, just where is this place to relocate you keep mentioning??
We've moved back to BC and the northwest - pretty good odds here. The lower 48, no matter what the locale, I don't hold much hope for. If it goes real bad, I think the misery will be widely spread.
BC looks cold in January, except right along the coast.
Heating is a big problem. Cutting and moving wood without trucks, horses, and wagons will be "challenging." There are not many horses around and it will take decades to breed enough horses to go around. Horses require food, care, vets, and medicine. No one is making wagons these days locally.
Wood stoves break, just like everything else. You could keep one or 2 extras, but eventually you have none and can't get more, because there is no transportation on the highways.
Asphalt roof shingles need to be replaced, and houses need to be painted and maintained.
Food must be grown in with a short growing season, and all of the farm stuff that used to be in a 1890 Sears catalog is no longer available. Last summer I took a tour of a farm and saw how dependent farming is on oil -- transportation and manufacture of plastic feeding bowls, containers to store grains/feeds, straw, roofs for animals and storage areas, wire, rope, wood boards, cement, fencing, antibiotics for animals, asphalt shingles etc. Seed and hardware used to be available at the local hardware store, no more.
Then there is clothing which is manufactured and transported from afar. Making cloth is a major operation from growing cotton to making cloth. I have studied the textile mills of Lowell National Historical Park in Lowell , MA for years, as I used it as an example of the confluence of capital, technology, and labor for a course I taught on Global Urban Politics at the University of New Hampshire . I know that the parts in those factories were manufactured in many places with a vast transportation network. Those factories will not be built again after the last power blackout. And there are not many sheep around, nor animals to make wool or leather cloth out of. Eventually down coats and comforters wear out, as do blankets. It sounds like just keeping warm will be a major problem.
Potable water is another problem, and sanitation.
And there will be no modern pharmacies or hospitals.
Don't want to say where here, call or email clifford dot wirth at yahoo do com 603-668-4207
I believe, Mr. Clifford, that you are exaggerating just a bit. Remember, there would only be a permanent shortage of oil... It is not going to run out anytime soon. There still is a chance.
P.S. I have all my saving in paper assets, and I'm looking out for indications of when I could sell, to get the best price. I'm in negative at this moment, and hope to recover atleast my initial investment back.
What could be the spark to this disaster? Or as Mr John Michael Greer says, it would be a slow crash... spanning many decades of low-to-negative economic growth?
CJ, there is no better knowledge than local knowledge and your assumptions are only 25% correct. It is cold in BC, but up north. Most of the inhabited parts of the province have a moderate climate. Just check out the wines coming out of the Okanagan now.
If one is to rely on wood for heating, you couldn't be in a better place. How much do you want? We've got enough to cover the western states of the lower 48. And potable water? Surely you weren't talking about us? How much do you want? We can still drink from our streams and creeks around here.
But we're not going to give our water to the U.S. because that would be like giving booze to an alchy. We're not going to facilitate golf courses in Phoenix and 4,500 sq. ft. homes in Las Vegas.
I think the motto of "In God We Trust" on the currency should be replaced with another more recent American saying "Stupid is As Stupid Does".
Probably yes. However year to date 2008 average production is currently higher than 2005 average even without oil sands increase. It's all easily within the noise in the data though in both cases.
Here's how I arrived at that conclusion in yeterday's drumbeat. Someone please correct me if I'm wrong.
Hey Thanks!!!
Sure looks like oil production has peaked out, and soon will peter out.
If you can't get it up after 3.5 years, you've peaked :)
Alberta bitumen CAN be blended with other (lighter) petroleum products, and it is often diluted with very light petroleum "dilbit" (naptha) to reduce its viscosity for pumping through a pipeline. However almost all of that light petroleum is recoverable and there are upgrading technologies that have been around for a long time but are continually being improved (e.g. "hydrocracking" and "deasphalting") that can upgrade the bitumen to much lighter products (including naptha). In short, although the cost of handling bitumen is higher than conventional light crude, it is much much less costly than the current per barrel cost for sale of the product. Alberta companies selling the product are currently making profits in the 10s of billions of dollars per year (rough estimate at 2million barrels/day = 700 million barrels/year X 100 dollars per barrel = $70 billion/year + ). The amount of bitumen production is rising and will continue to rise for many decades. It will not "solve" the Peak Oil problem but it will provide a substantial contribution to offset (partially!!!) the decline of conventional oil in North America. Potential reserves of oil sands are estimated at between 150billion to 1 trillion barrels. I do not doubt that Peak Oil will dramatically alter our way of life, but the Oil Sands will do their part to keep us from starvation for the short to medium term.
By the way, I should correct a somewhat inaccurate assumption that seems to be made about oil sand bitumen production. That is that it is assumed that natural gas is required for extraction. It is certainly true that the vast majority of CURRENT production uses natural gas as a heat source (at a 3-4:1 EROI), but it is practical to convert the waste fuels (e.g. petroleum coke) from bitumen upgrading to synthetic crude to create methane through a catalytic process involving water. Of course, it creates prodigious amounts of CO2, but perhaps if you live in Canada, a little extra heat is not seen as such a terrible thing (and some crops grow better in Canada (and Russian and Northern US, etc.) when it is warmer and there is more CO2 in the air (e.g. soybeans). Of course, I could be wrong!!
Gail the Actuary
Encourage you to add a graph of crude oil divided by population.
e.g. Like SamuM's posting of Luís de Sousa's graph above. That emphasizes peaking/capita.
Thanks for the idea. About a year ago, I made this graph for the US:
My point was that we have a lot of imports. If these drop off, our consumption per capita will be down to Mexico's level pretty quickly.
Hello Gail,
Thxs for the chart. I would suggest that people mentally prepare for much of those decreasing future energy imports to be transformed into I-NPK before they hit the US seaports. In short: expect a rising percentage of postPeak oceanic import shipping to be I-NPK container ships, not LNG tankers or VLCCs.
The US will be heavily import dependent upon Athabascan sulfur and Saskatchewan potash [K] from Canada, Morocco's phosphorus [P], and Haber-Bosch nitrogen [N] from the remaining sources of natgas.
Source: UN FAO [57-page PDF warning]:
ftp://ftp.fao.org/agl/agll/docs/cwfto11.pdf
Hopefully, sufficient numbers will recognize this problem, then we can ramp up O-NPK recycling, plus do much more nitrogen-fixing by crop rotation, plus maybe have some US-based infrastructure to generate our own ammonia with windturbines and other equipment. This can greatly help defray the US import reliance and/or time-extend the globally depleting I-NPK reserve base.
It will be a matter of utmost national security, IMO. Job specialization is dependent upon food surpluses.
Bob Shaw in Phx,Az Are Humans Smarter than Yeast?
Thank you Gail and the rest for the analysis of the EIA report.
Yesterday I asked the question; 'since the price is so high are some percentage of wells are being ruined by over extraction?' The answer was yes. This may mean the record numbers we are seeing are really a greater disaster in the making and not some nice thing to show over abundance of energy.
we all know the principle of peak oil is not exactly when the peak occurs but what happens on the down side. The lower 48 Hubbert curve has little to do with the curve of world oil because it occurred in the presents of very viable alternatives, i.e. foreign oil. So instead of 2 or 4 percent on the downside as per Hubbert we may very well have 10 to 15 percent on the downside of light sweet easily processed oil. And we will be very much behind the power curve for refining heavy sour crude, natural gas stations, and massive solar and wind infrastructure.
I did a google for NG filling stations in Reno … none, but there will be a conference here in October (whoopee). The city has a couple pumps for some of its busses but none for me. There must be two hundred regular gas stations and truck stops here.
To me, determining the exact month of peak oil is only a very minor, nice to know, date. Again to me, this is like brushing gnats away from your eyes while the alligators are closing in on you’re hind end.
It seems we have an extreme multilevel multidirectional crises coming up. Financials (banks etc), housing devaluation, climate change (did you see China Olympics coverage?), oil depletion, NPK peak (and me without ashes), etc, etc.
This is a pandering election time so nothing will happen. Dems and Repubs are so busy fighting each other they have no time for us, i.e. vacation instead of debate and action. If you don’t like the government, don’t re-elect anyone even if you have to hold your nose to vote against the incumbent. IMHO, they are all on a power trip and most are on the take.
Worst yet, and this may be true of many of us here. I am getting old and do not have the energy to try to explain where we are heading against a backdrop of cornucopian BS. So I am trying to take care of mine and we will do OK if we get through the time of chaos.
Yep, I'm a doomer and have seen nothing so far to change my mind.
This site lists one public NG filling station in Reno...if it is accurate:
http://www.eere.energy.gov/afdc/progs/ind_state.php/NV/CNG
Lynford:If you have a vehicle that runs on NG I have a
way you can obtain your fuel no matter where you are.
These tanks are used on forklifts....sometimes also called
"towmotors".
They are as safe as any other fuel tank filled with any
other stuff that can go boom.
Guys who run forklifts always smoke around em..on em.
The ease to hook them up and change them out takes 1 min.
1 full tank goes an easy 8 hour shift and having 2 or 3 in
your vehicle would give comparable mileage to a full tank
of gasoline
Heres the puppies your looking for....
http://www.missiongas.com/images/forkliftcylinderservices.jpg
http://www.worthingtoncylinders.com/images/forklift/alumn.gif
The second site is the worlds largest producer of these
and they are the industry standard.
Also companies all over America refill these things exactly
like a retunable soda bottle.
Ive heard "on the street" that things are easy to get as
they often "fall off trucks" all the time.
You provide the habeas corpus and I can supply the tanks...
just kidding!
Thanks for the links.
I can get propane at several places. Propane is a product of the crude oil cracking process. Natural gas of course comes from wells directly. Also, in furnaces natural gas and propane require different jets. I don't know about auto/truck engines. The link to a Reno NG station is no longer valid for NG and all the remaining fuels there are exclusively "Western Energetix Card Key" products.
Your analysis of the August EIA release seems to be based on the analysis and speculations of other people rather than on the actual numbers.
The record for production was previously about 7.6 mbpd in February. The numbers for that month were revised down by approximately 450,000 bpd.
Those changes occurred in basically three places. 50,000 barrels for Yemen, 230,000 barrels for Nigeria, and 170,000 barrels in the EIA’s “other” category.
In the August release the EIA revised down the “other” category all the way back to the beginning of 2003. The revisions averaged about 50,000 bpd for 2005 and 2006. In 2007 they jumped to 122,000 bpd. In the first three months of this year they moved to 178,000 bpd. I don’t know in what countries these changes occurred, but the “other” category includes over 100 countries. These are the countries with the smallest production, are non-OPEC, and are generally not discussed anywhere as far as peaking or declining production(because it is a waste of time).
The IEA and OPEC are separate data sources that don’t always match the IEA. They are also equally open to revision. Using those numbers to determine what EIA numbers “should” be or if they will be revised is problematic. One would expect that OPEC’s numbers would attempt to mask the fact that Saudi is currently cheating on their quota by over 700,000 barrels per day.
Most importantly, the EIA releases are an attempt to make an accounting estimate of historical past production, and have nothing to do with forecasting future production. This is something you are reading too much into the process.
As I have pointed out before (and also before the current revisions for “other”) the notion that over time EIA revisons have trended downward is incorrect. In the last three years the revisions have tended to settle at a higher level than the initial releases. I have told Khebab this. You folks need to take an updated look at those data sets.
I just checked out this spreadsheet, posted yesterday by the EIA. It lists February C+C as 74.176 million barrels per day. I'm not sure where you got the 7.6 (I presume you mean 76) from. Perhaps you could post a link.
I meant 74.6 mbpd. The t11d June release listed 74.628. That was the one (two months ago) I used in this particular analysis. April, May, and July would also have different levels.
I'm not sure I understand you completely.
Nobody is saying that the EIA numbers are "predictions", it's perfectly normal that first estimates are subsequently revised. All we are saying is that for C+C, the revisions of the first estimate for a given month have mostly been downward and that these revisions can take up to 2 years before they stabilize. It seems that it has been the case for the last 6 months:
I don't see any upward revisions in this chart and this is the same pattern as I observed in 2006:
I appreciate your detailed response. I'm as confused as you are. I was simply referring to what Gail said in that passage. I just don't see any connection between estimating future production and accounting for past production. Also, the numbers are published 3 months after the fact, any storms or maintenance outages would be fully known about especially when these situations are often accompanied by estimates of barrels per day outage before the events. Witness last year's UAE outage. It was over-estimated initially.
As as the revisions going up or down, the more recent(first graph) only shows 6 months. To be fair we would need to use the same 3-year time period as the second which we will have to wait for. I'll send you a spreadsheet I have with these datasets. The period I studied (conveniently) came in between the two of yours :)
I think that what may happen is that storms and other outages may very well be known to people close to the situation in say, Viet Nam, but the analyst sitting in Washington DC is not tuned in to the situation. If it is a Hurricane Katrina, there will be more knowledge (and more confusion about that knowledge) than if it is a local event. The analyst will choose a number based on the knowledge he or she has, but there is a good chance it is not very complete knowledge.
Perhaps you should think of it as a group project. When we are working with data that comes out the day we are writing about it, for a post the next morning, it works best to work as a team. Somebody has to put some words in HTML. I got the job.
When you talk about reading too much into the process, it is pretty clear that EIA has to come up with values for all of the "historical" data points each month. They almost certainly do not get direct reports from each of the countries each month. The question is how they fill in the missing blanks for data they should have, but don't. There are a few ways of doing this:
1. Build a sophisticated computer-based prediction system, which considers prior trends in data, likely outages, and gives a "best estimate" that to the extent possible has all bias removed. As an actuary, I would work with things like this (but not in this particular field.) From looking at the Khebab's analysis of past errors, it is pretty clear this was not done.
2. Assign the project of making an estimate for the latest month to some analyst. Have them look over prior amounts, and make their best estimate, based on historical amounts in the files. I would expect precisely the kind of bias that Khebab showed in his analysis, if this approach were used (estimates too high on crude, low on products that are increasing like ethanol.)
3. Get estimates from a third party, who may in fact use something similar to 2, if they have incomplete data.
The point is the data looks like someone somewhere is using the unsophisticated approach (Either the EIA itself, or a third party), and making estimates that are biased in the expected direction--too high where there is a problem with declining production and outages, and too low for products which are increasing.
This is very interesting. How do you estimate this, or has this already been studied elsewhere?
Considering the history of quota cheating in OPEC and the incentives recently from very high prices I'd have imagined that everybody capable of producing more within OPEC was at least tempted to cheat on their quota.
Any data on cheating for OPEC countries other than KSA (the aggregate for those might actually be significant)?
I would love to see a supply graph for the U.S. (and Europe too) factoring in 1. the Land Export Model, 2. increasing world population, 3. decreasing EROEI for oil production and refining, 4. availability of rigs and platforms per the increasing number of small reservoirs, 5. deterioration rate of rigs, platforms, pipelines, and refineries, and 6. personnel and investments needed per what we will get. :(
Did I miss anything :)
One of the problems I see with this is that while we have had "world market" drilled into our head, this isn't necessarily going to be the case. If we in the US can't pay for it, we aren't going to get it. Thus, the amount of oil available to the world is irrelevant to the United States, and for that matter to Europe, if we can't pay for it. Our financial problems will trump the theoretical world oil availability issue. I expect that at some point in the not too distant future, we won't get oil imports unless we have wheat or some other desired commodity to ship in return.
I fully agree on your points, esp. on oil markets fragmenting or at least the notion of 'fungible global markets' will see a redefinition.
However, the per capita calculation Colin is suggesting would perhaps be telling in estimating the timing and after effects of this breakpoint.
Yes, it is going to be within the peak itself, but the downside of the slope is going to be increasingly worse for per capita figures.
That can only mean one thing, and I'm not now referring to the Rimini protocol. It's got three letters in it, but for humanity at large is mostly a four letter word.
I think what we have is different per capita trends for different countries. The US started its per capita downtrend in 1970, when oil production peaked. We gradually shifted production of the things we needed overseas. This resulted in the lower per capita use trend that looks wonderful, except that now we can't produce what we need for our own use. We have somehow been able to import all the stuff we need without really paying for it, but when this game comes to an end, we will discover we don't have either the manufactured goods we need or the equipment to produce them. We also don't have the oil or the capital needed to produce new manufacturing equipment.
China has recently been experiencing increasing oil per capita, and increasing coal per capita. It is not clear that this can continue for much longer. It is these increasing per capita amounts that have fed China's export boom. If there is a downturn, China is likely to focus its exports on parts of the world that are better equipped to pay for the manufactured goods than the US.
Dead right. And the global oil market won't function anymore once there are global physical shortages. The market will morph into barter business. We should watch out for signs of this happening in certain regions of the world first. That will mean trouble is ahead for other regions, too.
We may also see such deals for airlines stopping over in the Middle East and refuelling there.
For example, we should not forget peak water in Saudi Arabia which will make this country more and more dependent on food imports.
http://europe.theoildrum.com/node/3520#more
Commisioner, fire up the Khebab light. Calling Khebab, this is a question for you. Can we use the difference between the final updates and the initial as an estimate of variance to come up with confidence intervals on the initial estimate of the final estimate? Ultimately we want a confidence interval on any estimate of the actual, but I'm not sure we can get there.
IMO, the confidence interval is impossible to know, you would have to get all the error intervals from all the various data sources. Just looking at this chart for Saudi Arabia from Stuart Staniford, the error bar (2 sigmas) is fairly large and around 250 kbpd:
So a lower bound on the confidence interval would be around 250 kbpd. A consequence is that comparing peak values separated by less than 250 kbpd is probably meaningless just because of the uncertainty on Saudi Arabia alone.
If you assume that the observed bias on C+C is valid and stationary, you could guess what the present EIA numbers would look like in 2 years:
Thanks, Gail!
Here are two updated forecast charts for the recent EIA data release. No significant changes from last forecast.
The EIA says that there is a record C&C monthly peak for May 2008 but C&C is still on a plateau since 2005.
Crude and Condensate to 2012 - click to enlarge
The forecast to 2100 hasn't changed significantly.
Crude and Condensate to 2100 - click to enlarge
Thanks!
Clear there's been a C&C peak plateau from May 05 thru May 08, however I'm not sure there is enough evidence yet to be certain of the predicted decline point in time, especially in light of Iraq's predicted future production increases. Meaning it's quite possible that this plateau could be maintained for some years to come, especially if demand destruction continues via this recession.
Hi Gail,
Thanks for this post.
In looking over the N.A.Stacked C+C chart and viewing it as a region, I am thunderstruck by how steady the production rates are for the period 01/01 > 03/08, 30 years after the Big Dogs(USA) peak!
With the exception of Katrina, it has hardly budged at all.
Can we expect other regions to have such extended declines?
Don't forget that the apparent steadiness is because we were drilling like hell to keep the flows up! The only way other regions can have such (apparent) extended declines is if they drill just as hard...a highly questionable prospect, without being equally open to foreign investment, personnel and equipment.
I think the steadiness of North American production, together with the fact that Europe could mostly support its needs with North Sea oil for a time, that has held things together so far.
One of the reasons that North American production was so steady is because once production started to decline in the US 48, there was a quick rush to begin to develop oil resources close by. Oil had been known about in Alaska, Mexico, and Canada, and even the North Sea, but until prices rose, it didn't make sense to exploit it. Once these things started going, they helped fill in the blank spots cause by the drop in US production. Ramp up time was much quicker than would be expected in, say, the US offshore now, because these resources were well recognized, and not too difficult to extract. It was only a matter of getting production going.
I think that there have been other things holding extraction quite level as well. Mexico used various advanced recovery methods to keep Cantarell producing at top level, and the US has continued to add wells offshore, and use EOR on onshore wells. Canadian oil sands production has provided a little increase to offset declines elsewhere. Also, the monthly scale makes the period longer than it is. The flatness can help explain how world production can remain on a plateau from 2005 to now, and perhaps a little longer.
Looking ahead, with Mexican production dropping as well as US conventional and Canadian conventional, it is pretty clear that Canadian tar sands are not making up the difference. Brazil keeps claiming all kinds of discoveries, but so far, production hasn't ramped up much at all. Even optimistic forecasts don't suggest Brazil will have much export capability very soon. This leaves the US with the only option being importing expensive oil from much farther away. It takes many more boat-days to do this, so even if the even oil were available, it wouldn't necessarily be feasible with existing oil tankers.
While reason for the high Oil price is often attributed to the growing demand of Oil in China, India and Saudi Arabia,a key factor often ignored is the fact that steep decline in production in North Sea and Mexican Oil fields have made Europe and US for filling the gap by buying Oil from other sources which has equally contributed to the increase in price of Oil.
Care to explain?
Oil is roughly a fungible global commodity, although crude varieties and time to pump estimates do practically break this down.
Are you saying that the demand fall in OECD/US has been less than the net output fall from their primary geographical suppliers (of preferred crude variety), prompting them to bid for oil from other regions and esp. of the kind of variety that is becoming scarce?
If so, do you have numbers to illustrate this?
Or did I misread you?
Gail has brought out vividly the point. OECD in general and North America in particular have been producing less oil over the years thanks to declining production in US oil fields, Mexico and north Sea. This has put more pressure on other sources than the increasing demand of China and India. Hence the crisis can be addressed only if OECD countries drastically cut down the per capita consumption and China and India increase public transportation to slow down the galloping growth of private vehicles.
I think maybe part of what you are thinking of is the growing gap between North American oil production and consumption. This data is from BP, so is on a slightly different basis. Production seems to be something like crude and condensate, plus natural gas liquids, but not including non-oil products like ethanol. The data goes back to 1965.
There is a growing gap between the oil consumed in North America, and the oil produced. Going forward, with Cantarell declining, and no real way of ramping up production, the gap is likely to grow if business continues as usual. Financial considerations say that it really cannot, though.
Chris Skrebowski called this hidden demand. The world is losing 5 million barrels per day in 2008, at field level. That is around 3 times more than any real demand growth