Fermenting the Food Supply - Revisited
Posted by Stuart Staniford on August 16, 2008 - 11:00am
Modelling Biofuel Production as an Infectious Growth on Food Production
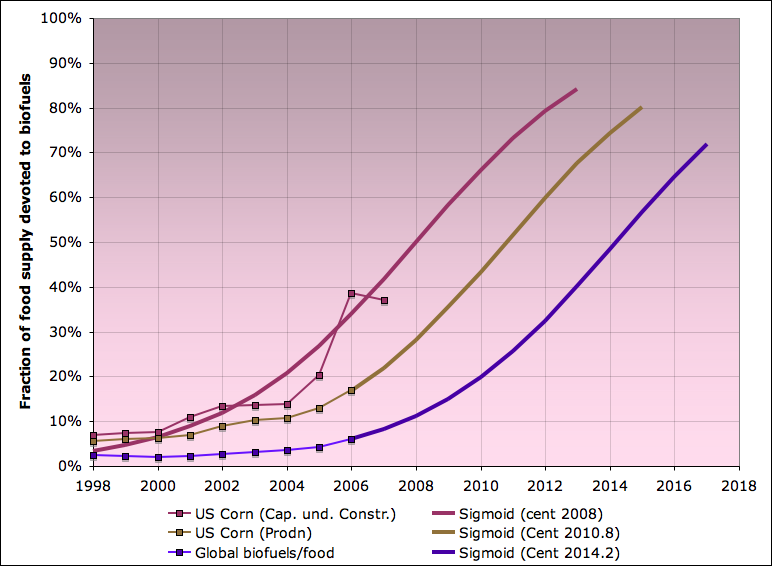
Biofuel capacity or production as a fraction of food supply for three different cases, along with sigmoidal (ie logistic) projections, 1998-2018. Plum curves show US corn ethanol processing capacity in service or under construction as a fraction of ethanol potential of entire US corn crop. Brown curve shows actual production of US ethanol as a fraction of ethanol potential of US corn crop. Violet curve shows global biofuel production as a fraction of estimate of biofuel potential of entire global human food supply. Sigmoidal curves all have K = 1/3 (infection doubling time of three years), and cross the 50% line at 2008, 2010.8 and 2014.2 respectively. Sigmoids are scenarios, not forecasts. Actual biofuel production growth will depend heavily on oil prices and policy responses to increasing food prices. See text for sources and methods.
(Ed note: Stuart has been an important part of this team, but no, he is not "back." It has just been more than six months since he wrote this article, and it seemed like it might be a good time to revisit it.)
Many people are aware that food-based biofuel production has had an influence on food prices. Many people also know that US ethanol production is growing rapidly and now using a noticeable fraction of the total corn supply. However, I'm going to argue that the situation in the near term is potentially more serious than is generally realized.
I will use a mixture of existing data, analysis of biofuel profitability, and simple modeling of biofuel production as an infection or diffusion process affecting the food supply, to demonstrate that there are reasonably plausible scenarios for biofuel production growth to cause mass starvation of the global poor, and that this could happen fairly quickly - quite possibly within five years, and certainly well within the life of the existing policy regimes. It doesn't have to be this way, but unless we start doing things differently soon, the risks are significant.
This piece is very long, and I apologize for that. But I think it's important - I'm coming to the view that biofuel growth is by far the greatest near-term challenge arising from the plateauing of global oil supply that we have experienced over the last two years.
I'm going to focus a lot on the US corn ethanol situation, because it's where the pattern has developed the furthest, and it's also where we have the best data. Then I will broaden out to look at the global situation where I think the same pattern is developing, but a few years behind. Let's first look at global biofuel production just to orient ourselves.
This next graph shows (in the lower panel) the annual production numbers for ethanol and biodiesel from 1975-2006. Here, and throughout, I am going to use volumetric units of millions of (42 US gallon) barrels/day, for the convenience of those of us used to thinking about oil supply. However, be aware that the energy content of biofuels is lower than that of fossil fuels (ethanol has only about two thirds of the energy content per gallon that gasoline has, for example).
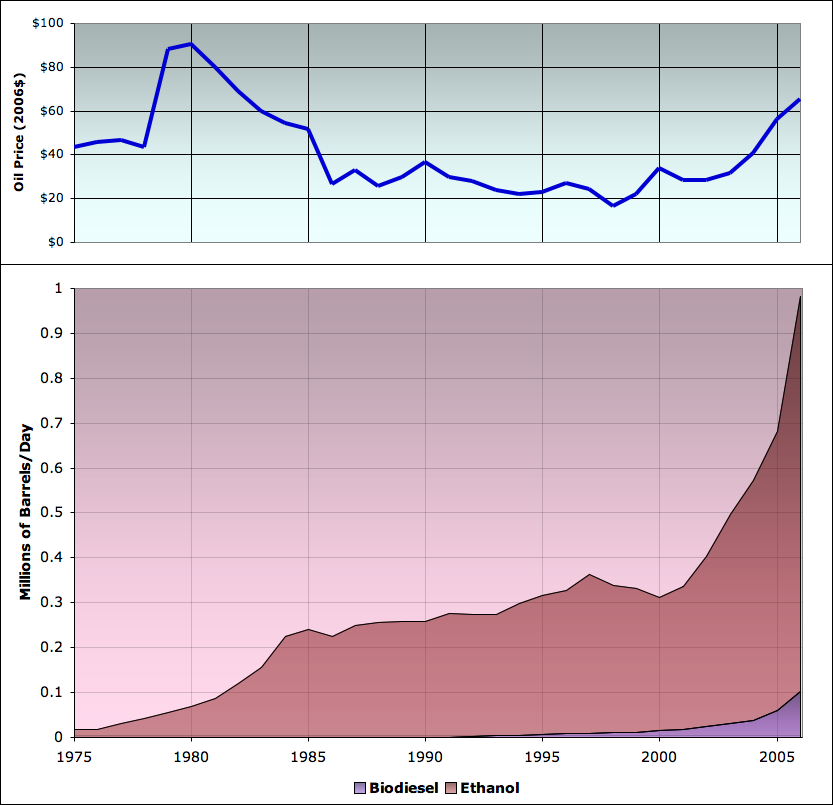
Major components of global biofuel production, 1975-2006 (bottom), with oil prices (top). Sources: Worldwatch Institute for biofuel production through 2005, and various sources for 2006 (1, 2, 3, 4). Oil prices are sourced from BP and are expressed in 2006 US dollars.
This graph shows the major facts. Beginning from a very small base in the 1970s, by 2006, biofuel production reached about 1 million barrels/day, a little over 1% of the roughly 85mbd of liquid fuel production in that year. Ethanol is the largest flow by far, but biodiesel has started to become important. Growth of both products in the last few years was explosive - that is a key fact at the core of the problem. Furthermore, that growth is correlated with oil prices (shown in the panel at top). When oil prices are high, biofuel production increases rapidly, but when oil prices are low, biofuel production grows more slowly or stagnates.
This next graph shows US ethanol production (almost all of which comes from corn) as a fraction of the global biofuel supply:

US ethanol versus global biofuel production, 1980-2006. Sources: US figures are from Renewable Fuels Association. Global figures from Worldwatch Institute for biofuel production through 2005, and various sources for 2006 (1, 2, 3, 4).
As you can see, the US is a major biofuel producer, but both the US and non-US supplies have been growing rapidly. The reason the US corn ethanol supply is growing so rapidly is a large number of new ethanol plants being built (as well as expansions of existing ones). Here are the numbers from the Renewable Fuels Association (they have a very helpful list of every plant in production or under construction):
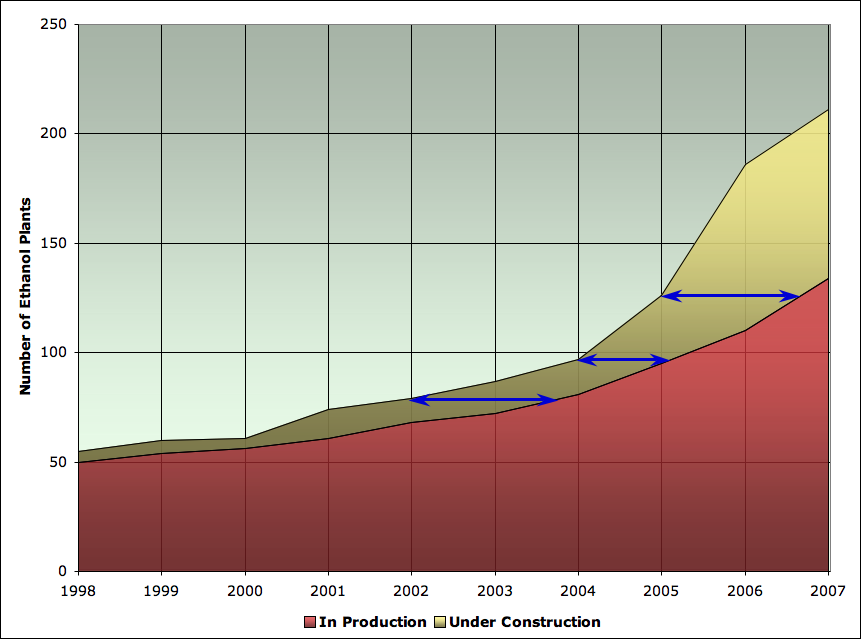
US ethanol plants in production or under construction at year end, 1998-2007. 2007 numbers may be a month or two earlier than the end of the year. Sources: Renewable Fuels Association.
As you can see, there has been a huge construction boom in the last few years. Looking at 2006, when we had 317kbd of ethanol produced in the US, that was coming from about 100 ethanol plants. Thus the average ethanol plant only produces 3kbd of ethanol - miniscule by oil industry standards. The blue lines indicate the average time for the population under construction to become the population in production at various points along the way. That lag is only 1-2 years, very short by oil industry standards. I think these are important points - these plants are very small, and they can be ramped up quickly at quite modest levels of investment. Thus the biofuel supply can respond quickly to changes in profit incentives of ethanol plant operators. There's quite a lot of these plants now, and a lot more on the way.
For me, always the most important thing about some flow is to understand how it relates proportionately to other relevant measures in the situation. And what I want to do now is relate US ethanol production capacity to the US corn crop. That requires converting bushels of corn (which the USDA National Agricultural Statistics Service keeps track of), to ethanol. The National Corn Growers Association has statistics for that, as follows:
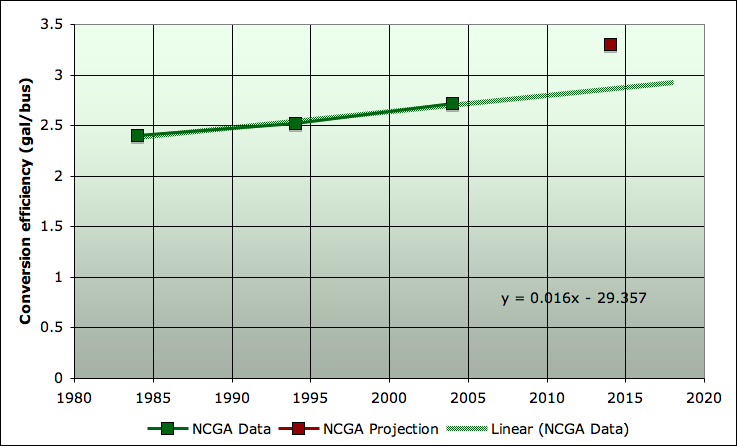
Conversion efficiency of corn to ethanol over time. Sources: National Corn Growers Association.
As you can see, the efficiency of ethanol plants is rising slowly, but appreciably. Note that the NCGA has a theoretical estimate for 2014. I figure they are doing their jobs well, which is to be a trade group and aggressively promote the interests of their members, so in my extrapolations later, I used the linear extrapolation of the historical trend, rather than something based on their 2014 estimate (the red dot).
Let's just pause a moment and figure out how much food we are talking about when we discuss bushels of corn, or gallons of ethanol. A bushel of corn is 56 lb (or 25.4kg) of corn. At about 8000 btu/lb we get 113120 kCal/bushel. Given the average human diet globally contains 2800 kCal/day (see figure below), 1 bushel represents 40 days worth of calories for a person (if that person eat only corn!). Thus at current conversion efficiencies of about 2.8 gal/bushel, the corn in a gallon of ethanol represents a shade over two weeks worth of food (again, all corn). A 15 gallon fuel tank of ethanol is thus 7 months worth of corn calories for one person. Of course, the American corn crop is mainly fed to animals, and after conversion to meat, eggs, or dairy at efficiencies in the range of 1/10 - 1/3, the 15 gallon tank of ethanol is more like 1-2 months worth of food calories for a person.
Anyway, given the USDA corn production statistics, NCGA conversion efficiencies, and RFA data for the amount of ethanol production capacity on stream or under construction, I made the following graph:

Capacity of ethanol plants at year end, in production and under construction (stacked on each other), together with total ethanol potential of the entire US corn crop (not stacked). Expressed in millions of barrels/day of ethanol. Sources: USDA National Agricultural Statistics Service for corn production, National Corn Growers Association for conversion efficiencies, and Renewable Fuels Association for ethanol plant capacities.
This graph completely floored me from the moment I saw it, and immediately suggested the conclusion of this piece. Let me try to develop the argument in stages though. The first thing to note is that the corn crop generally increases over time. This is due both to ongoing improvements in the yield/acre of modern industrial agriculture, but also increasing acreage planted to corn versus other crops (especially in 2007). The corn crop also fluctuates, both due to acreage decisions and the vagaries of the weather.
More importantly, the amount of ethanol processing capacity is growing much faster than the corn crop. Whereas in 2006, the US produced 317kbd out of a global total of 982kbd, once all the construction under way is complete, the US will be able to produce almost 1mbd by itself. Let's focus in on the ratio of the ethanol processing capacity (both finished and under construction) to the corn crop. That looks as follows:

Capacity of ethanol plants at year end, in production and under construction, as a percentage of total ethanol potential of the entire US corn crop in that year. Sources: USDA National Agricultural Statistics Service for corn production, National Corn Growers Association for conversion efficiencies, and Renewable Fuels Association for ethanol plant capacities.
Starting out from 7% in 1998, the percentage of the corn crop covered by ethanol plant capacity in progress has now reached 37-38% of the corn crop.
Furthermore, the general shape of this graph is very familiar to me, and strongly suggests thinking of the process of ethanol conversion of corn as an infection process (or spread process, or diffusion of innovations process, to use various terms from different disciplines for more or less the same kind of thing). There are a large variety of processes in both the natural and social sciences which have the general flavor of something spreading exponentially in a finite setting, and then slowing down as it saturates the finite available capacity. An infection spreading through a vulnerable population of plants or animals is one classic example. The diffusion of a new product or innovation through a marketplace of potential users of that product is another. An invasive plant or animal species spreading through an ecosystem new to it is another case.
In the context of corn ethanol plants, the general idea is that if the existing plants are doing well and making money, there is a basis for building more of them. Because there are plants already operating successfully, there are a set of skilled employees, managers, and contractors that know how to build and operate ethanol plants. There are investors who are comfortable enough with the industry to risk their capital and are excited about the returns that building more plants might offer. There are farmers who are aware of the possibility of selling corn to ethanol plants if there was one close enough (or forming co-operatives to start their own). And there are marketing and distribution channels that know how to get ethanol sold to final consumers.
The larger the industry is currently, the more new plants it could potentially implement next year. (Its desire to do so will be heavily influenced by current profitability, but let's return to that point in a few paragraphs). So when things are going well, a young industry naturally grows exponentially - the amount of new capacity each year is proportional to the existing size of the industry. Eventually, however, any industry tends to mature - something or other limits further growth. In most cases, it's lack of further customers interested in the product. However, the corn-ethanol growth process faces another obvious limit, which is that it cannot convert more than 100% of the corn crop to ethanol.
To try to help your intuition for growth/spread processes, I'm including the following short video. The spread of a computer worm or virus through a population of vulnerable computers is another example of exponential growth in a finite situation that I am particularly familiar with, having being involved heavily in research on it a few years back. This example, made by collaborators of mine, shows the progress of the Code Red worm spreading across the globe in 2001 (the size of the red balls depend on the number of infection cases in each city):

Animation of spread of Code Red computer worm on July 19th, 2001. Source: CAIDA.
Notice the way nothing much seems to happen for a while, then the infectious agent seems to infect lots of cities at large scale very quickly, then slows down as it runs out of vulnerable computers to infect. That's a classic property of exponential-spread-in-a-finite-system situations.
Looked at globally, computer worms infect cities, because that's where the computers are. By contrast, ethanol plants infect areas with a lot of corn:
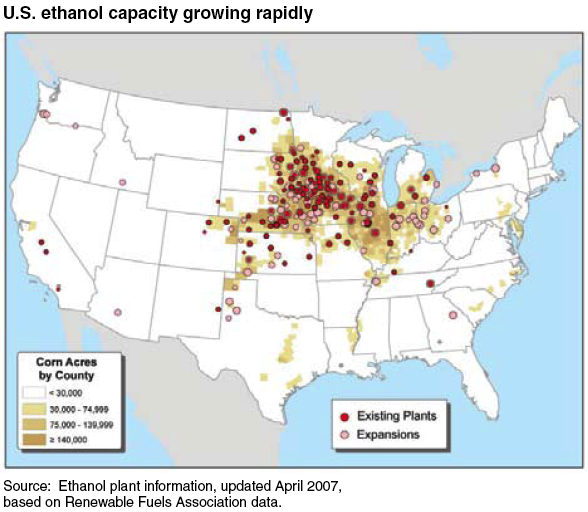
Location of ethanol plants onstream and under construction. Sources: USDA: Ethanol Expansion in the United States, plotting data from the Renewable Fuels Association.
Hopefully this suggests to you, as it does to me, the visual metaphor of little dots of red and pink mold growing in a Petri dish (yet another case of exponential spread in a finite system).
The simplest model of exponential spread in a finite system is called the logistic equation, which gives a simple sigmoid (S-shaped) curve. It's called the SI model in epidemiology. I'm going to spare you the math, since it's well discussed elsewhere. At the time of the Code Red computer worm, I happened not to be familiar with that piece of math, and I rederived the equation in the middle of the night as the worm was spreading and I was trying to predict how long it was going to take before it saturated ("saturated" meaning that it ran out of vulnerable computers to infect). I ended up with a graph like this:
Rate of infection attempts at one location on the Internet due to Code Red worm on August 1st, 2001. Blue line is data, and red line is logistic model. Sources: S. Staniford, V. Paxson, N. Weaver, How to 0wn the Internet in your Spare Time.
That particular infectious agent was a fairly simple-minded thing, and it followed the simple model very well indeed. Note again the pattern of a long period of very little sign of growth, then the rapid rise in the graph when most of the infections occur, and then the tail off as the worm struggles to find the last few uninfected computers amongst a sea of already infected ones. Once you are in the middle of that graph, things are going pretty fast. It's this that leads, in infectious disease control, to the huge emphasis on quarantining the early cases. It's so much easier to put a stop to an infection that hasn't got a grip yet, versus one that has already gotten a good grip on a sizeable fraction of the vulnerable population and is now making new infection attempts in all directions at a huge rate.
Which is the perspective that I bring to 40%, as the fraction of this years corn crop that could be processed by the ethanol capacity under construction. 40% is well into the steep part of a sigmoid. Let's take a look again at that graph of the ratio of ethanol capacity (producing and under construction together) to the ethanol potential of 100% of the corn crop. This time I'm going to add a sigmoid model extrapolated out into the future.
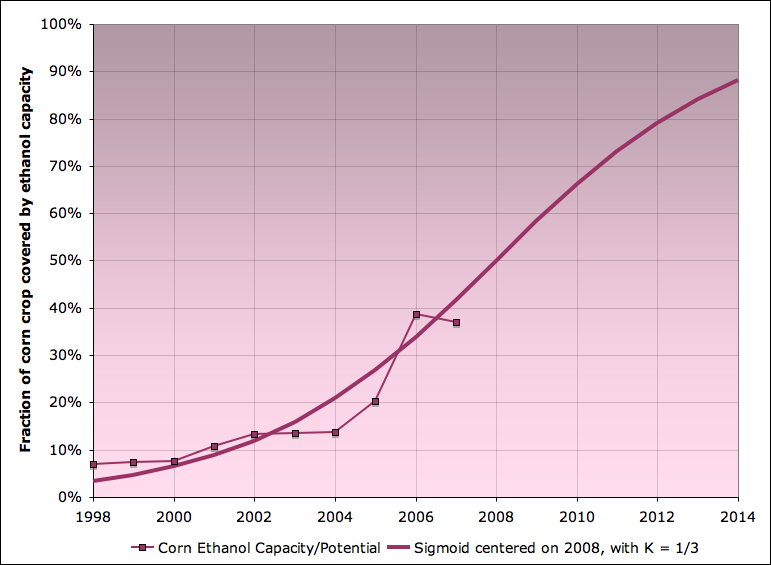
Capacity of ethanol plants at year end, in production and under construction, as a percentage of total ethanol potential of the entire US corn crop in that year, together with sigmoid model with K = 1/3 centered on 2008. Sources: USDA National Agricultural Statistics Service for corn production, National Corn Growers Association for conversion efficiencies, and Renewable Fuels Association for ethanol plant capacities.
Ok, the fit is a bit rough - clearly this ethanol plant spread process is a little more complex and noisy than the computer worm I just showed you. Still and all, I think this graph should set off pretty serious alarm bells. The fit does look like it's capturing some of the important dynamics of this process, and it suggests that we'll be using almost all of our corn crop for ethanol in 5-7 years. That's not very far off. Should we believe it?
Let's investigate further. One of the major departures from a straightforward logistic spread model is that the doubling time (or equivalently the growth rate) has varied significantly through the life of the process. Let's look more closely at the changes in the growth rate of this ratio, along with oil prices again.

Bottom panel: capacity of ethanol plants at year end, in production and under construction, as a percentage of total ethanol potential of the entire US corn crop in that year (left scale), together with year on year change in that percentage (right scale). Top panel: oil prices (annual average in $2006). Sources: USDA National Agricultural Statistics Service for corn production, National Corn Growers Association for conversion efficiencies, and Renewable Fuels Association for ethanol plant capacities. Oil prices are sourced from BP.
I suggested earlier that the growth rate has a lot to do with oil prices, and I've made that more explicit in the graph above with the green lines. When oil prices spike up, a year or so later we have a new burst of ethanol capacity under construction (which then comes on stream 1-2 years after that).
(Note that the drop in the growth rate of the ratio in 2007 is largely a result of a 20% increase in the acreage put under corn from 2006 to 2007, due to the high demand for corn - this increase came almost entirely from reducing the acreage under soybeans and cotton. See p 18 here for details.)
You might argue that correlation isn't causation, and this suggests that it's important for us to assess the profitability of ethanol plants more carefully - clearly growth of the industry will have a lot to do with perceived profitability of ethanol plants, but do they actually get more profitable when oil prices go up, or is the low energy return of the ethanol process such that they don't actually do any better?
Let's start with the price of ethanol. I can't find raw data in the public domain, but I did find this graph of rack prices in various locations over the last ten years. (The rack price is basically the wholesale price at regional distribution terminals).

Rack ethanol prices at various points in the country May 1997- May 2007. Source: California Energy Commission.
It helps to understand the relationship between ethanol prices and gasoline prices. I took the graph above and made the contents of it the background to my own graph of gasoline prices (on the same scale). That gave this:

Retail and rack gasoline prices, national US averages, and ethanol prices at various points in the country (background). Source: California Energy Commission for background ethanol rack prices, and EIA for gas prices (which are all grade, all formulation national averages)
The purple curve is a national average retail price (average across all grades and formulations), while the blue curve is the rack gasoline price. Clearly, ethanol and gasoline prices correlate fairly well (as one might expect, given that the main end use of ethanol is to mix it into gasoline). However, wholesale ethanol prices are often higher than wholesale gasoline prices. This is possible for two reason. Firstly, gasoline formulators are effectively required in many states to include ethanol in gasoline for oxygenation (to reduce tailpipe emissions of carbon monoxide). In particular, the spike of ethanol prices above gasoline in mid 2006 is likely due to the phaseout of MTBE (a groundwater polluting oxygenator that Congress decided not to shield oil companies from liability for). Secondly, formulators receive a 51c tax credit for each gallon of ethanol included in retail gasoline. This allows them to pay more for ethanol than for gasoline and still make money.
The fact that ethanol prices tend to strongly correlate with gasoline prices is suggestive, but we also need to understand the costs of making ethanol. I have relied here on the outstanding USDA 2002 Ethanol Cost-of-Production Survey. (We are only looking now at operating costs, not capital costs, ie the costs of running the plant and making ethanol, not the costs of building the plant in the first place - which at that time averaged about $1.50 for each gallon/year of capacity). Let me summarize the operating costs from that survey in the next graph.
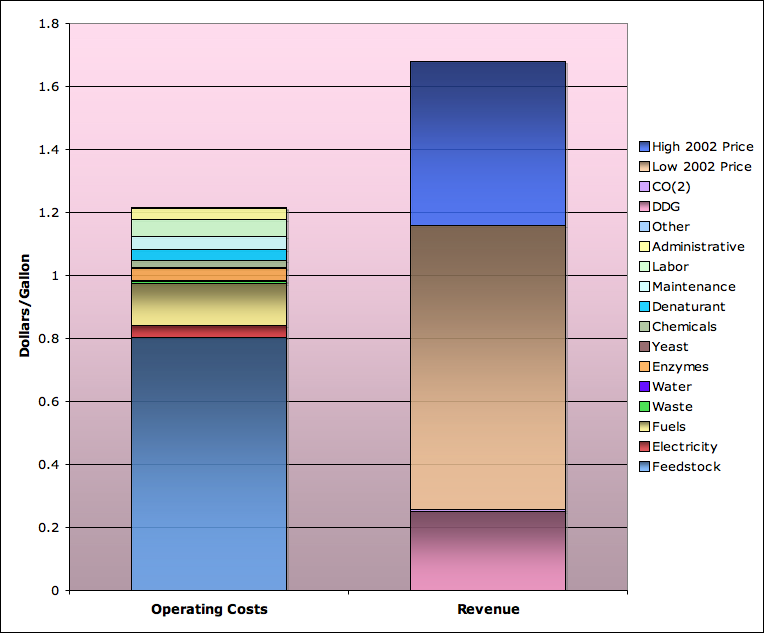
Ethanol operating margin analysis for 2002. Source: USDA 2002 Ethanol Cost-of-Production Survey for cost data and and DDG and CO2 revenue. California Energy Commission for ethanol prices.
This is rather complex, but let me try to explain the highlights. The left column represents a breakdown of the average costs per gallon of making ethanol. The largest item by far (blue) is the cost of the corn. The second largest item (yellow) is fuel to provide process heat in the plant. Generally, this has been natural gas in the past, but there is currently an ongoing shift towards using cheaper coal instead. The rest of the bars are all smaller - administrative expenses, enzymes, maintenance, etc, etc.
The right column of the graph represents the revenues for that gallon of ethanol. The bottom (pink item) is the revenue from selling the distiller's dry grain (DDG) residue left over from fermentation, which is used as animal feed. The brown column takes us up to the lowest ethanol price obtaining at any time in 2002 (from the earlier California Energy Commission graph). The blue column takes us up to the highest price of the year. 2002 was not a great year to be making ethanol, with operating margins ranging from a scanty 25%, to negative (selling the ethanol for slightly less than the operating costs of producing it). This was because oil and ethanol prices were relatively low in 2002.
This explains why capacity growth in 2003 and 2004 fell back to essentially zero.
To extend this analysis further, we cannot rely on survey data, which has not appeared since the 2002 survey. However, with just a little modeling, we can get close. What I did was to take the 2002 cost structure and divide it into three components: the corn, the natural gas, and everything else. The corn and natural gas components I extended to other years by using corn and natural gas price data. The "everything else" component I assumed to be more slowly changing and I just inflated it at a fixed 2 1/2% annual rate. I think this will get us fairly close. My cost structure model then looks like this:
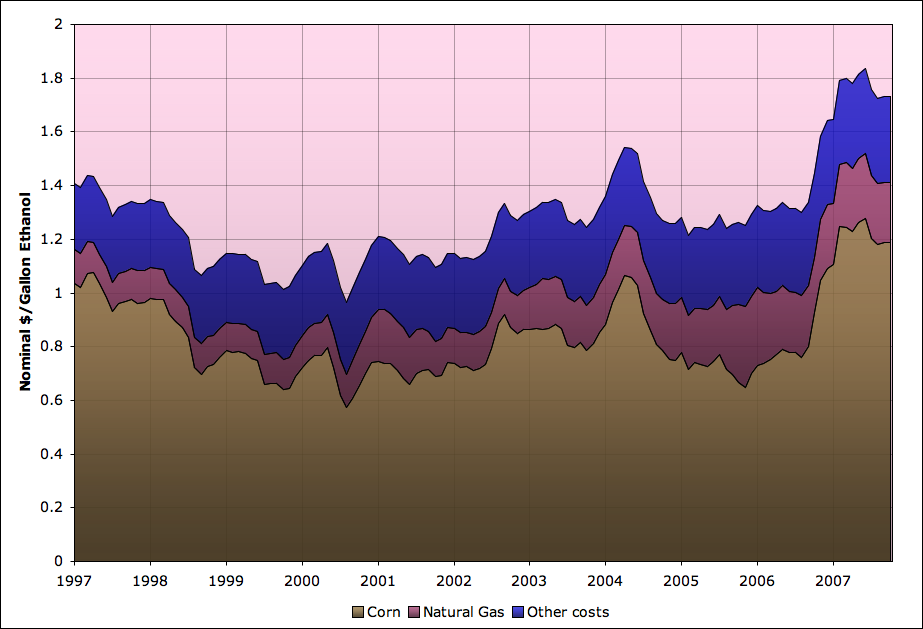
Ethanol production operating cost model, Jan 1997-October 2007. Source: USDA 2002 Ethanol Cost-of-Production Survey for 2002 cost data. Corn prices came from USDA NASS, with conversion efficiencies from National Corn Growers Association. Natural gas costs were indexed from 2002 using price data from EIA. Other costs were computed from 2002 data by inflating at 2 1/2%/year.
As you can see, the main impact on the cost structure of ethanol producers is the price of the corn, which is quite volatile - varying by a factor of two over the course of the last ten years. Natural gas prices have been less important as a factor, and I assume they will get moderated further over time by switching to the use of coal.
We can now take this cost model and look at the rack price of ethanol against it:
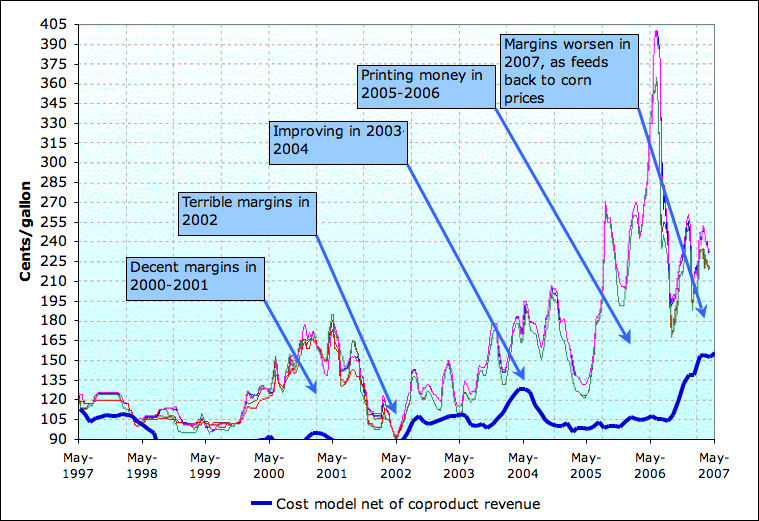
Ethanol prices at various points in the country, along with operating cost model (with DDG revenue subtracted from costs). Source: California Energy Commission for background ethanol rack prices, and USDA 2002 Ethanol Cost-of-Production Survey for 2002 cost data and DDG revenues. Corn prices came from USDA NASS, with conversion efficiencies from National Corn Growers Association. Natural gas costs were indexed from 2002 using price data from EIA. Other costs were computed from 2002 data by inflating by 2 1/2%/year.
In my mind, this makes pretty clear what is going on. Making food into biofuel was profitable in 2000-2001, with oil/gas prices high, so the industry started to expand. It stopped being very profitable in 2002, so the industry stopped growing. Then it became hugely profitable in 2004-2006, and we had an enormous wave of expansion which is still coming to fruition. However, that additional demand has backed up into corn prices, which have now increased. Thus margins are falling, and we will probably see a drop in the growth rate of corn ethanol capacity for a while. However, if oil prices go up much further, then there will be another big growth wave. This one will be starting from around 35% or 40% of the corn crop and going up from there. Clearly, that will drive another big round of corn price increases.
So at this point, corn prices are indexed to oil prices via biofuel arbitrage. There are lags and imprecisions in that linkage, but corn prices cannot fall too far below gasoline prices, or biofuel production will become very profitable and the industry will quickly grow to the point that corn prices are bought back into relationship with oil prices. Furthermore, the large displacement of soybean and cotton acreage to corn in 2007 suggests that this arbitrage is quickly extending to other agricultural commodities. I by no means think that last process is complete, but it has started.
That's bad news because demand for oil is extremely inelastic, and the world is struggling to grow the supply of it at present, so over the medium term it seems fairly plausible that there will be further rises in oil prices. As we will see shortly, one can throw the entire global food supply at our fuel problems and still only make a modest impact on them.
Before we turn to the global situation, I want to make one last graph on corn ethanol. Taking the same cost model I just showed you, I made a graph that shows the cost of making ethanol as a fraction of the (retail) cost of a gallon of gasoline. In both cases, I subtracted the DDG revenue from the ethanol cost, but in one of the lines I also subtracted the 51c/gallon blending tax credit.
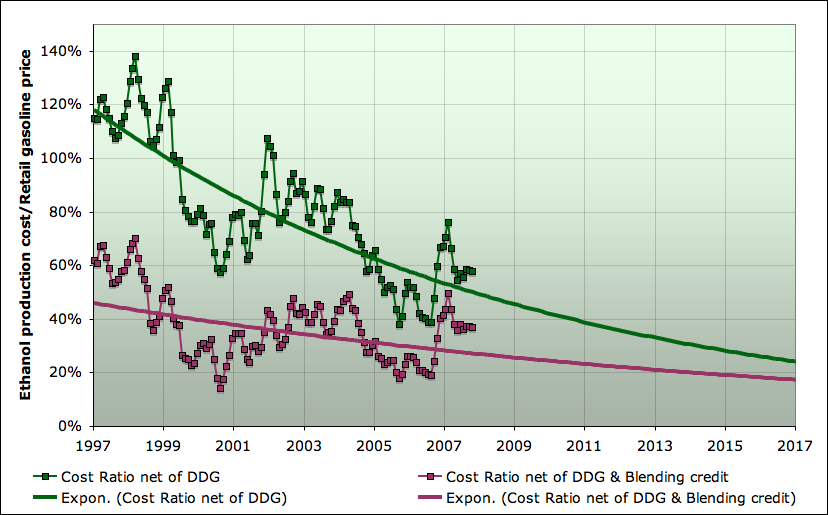
Ethanol production operating cost model as a fraction of retail gasoline cost, Jan 1997-October 2007. Green curve is cost net of DDG revenue. Plum curve is also net of 51c/gallon blending tax credit. Source: USDA 2002 Ethanol Cost-of-Production Survey for 2002 cost data. Corn prices came from USDA NASS, with conversion efficiencies from National Corn Growers Association. Natural gas costs were indexed from 2002 using price data from EIA. Other costs were computed from 2002 data by inflating by 2 1/2%/year.
As you can see making ethanol has been getting steadily more profitable, and the unsubsidized margins are recently getting comparable to the subsidized margins back in 1997. (The fit lines are exponential just to guide the eye to the trend - I have no great confidence in the extrapolation).
Let's now turn to the global picture.
Last year, President Fidel Castro of Cuba alleged that plans by developed countries to power cars with biofuels risked starving up to 3 billion people. While I am no fan at all of communist dictators, I fear he might have a point here. I established above that biofuel profitability/growth creates an arbitrage between oil prices and corn prices. We will see that the same trends are going on globally. They aren't as advanced, but the basic mechanism are going to be the same, and the growth rates are comparable. With fuel prices and food prices linked together, then the dinner tables of the poor are in a competition with the gas tanks of the global middle and wealthy classes. And we already figured out that a 15 gallon tank of ethanol is 7 months worth of corn calories for one person.
Let's start with the UN Food and Agriculture Organization's statistics on energy in the global diet:
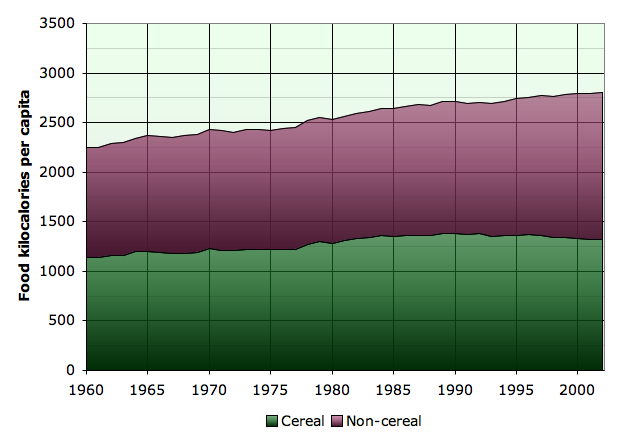
Global food energy intake per capita, 1960-2002. Source: FAO.
As you can see, at least until 2002, the world has been getting better and better fed. This comes despite the global increase in population over the period:

World population, 1960-2005. Source: US Census.
So far, so good. Multiplying the food intake by the population, and noting that 1 kilocalorie is 4.184 kilojoules, we can derive the total energy content of the global human food supply:
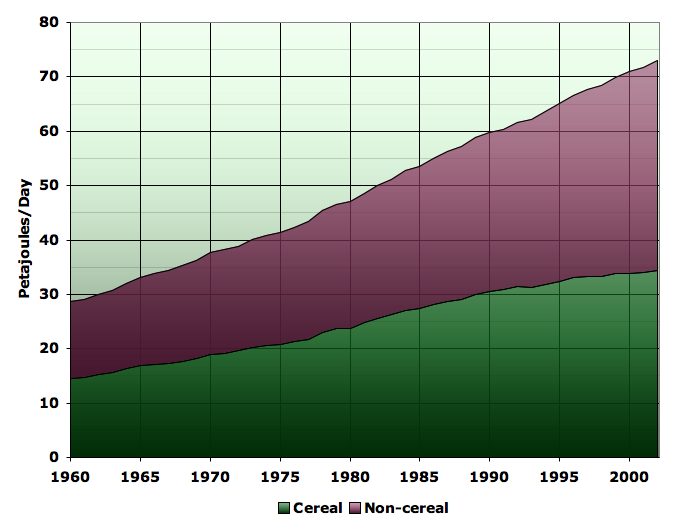
Total energy in global food supply, 1960-2002. Source: US Census for population, and FAO for food intake.
Since the amount of land in use has been fairly constant, most of the increase in food energy over this period has come from steadily increasing crop yields.
A petajoule is 1015 joules, or about 278 million kilowatt-hours. Ok, so is 70 odd petajoules a lot, or a little? To answer that question, I'm going to compare the food supply to the global supply of liquid fuel via a notional conversion to biofuels. For the cereal portion of the human diet, I can straightforwardly apply the exact same conversion factors as for corn above (on the theory that a calorie of rice or wheat can be induced to make about the same amount of ethanol as a calorie of corn - a little more than 50% of the calories in the corn make it into the ethanol).
The rest of the diet is more complicated - it ranges from things like lettuce and celery that are probably poor prospects for biofuel feedstock, through things like potatoes and cassava which would probably do about as well on a per-calorie basis as cereals, and then to meat, eggs and dairy products which have, in many cases, been converted at low efficiencies from cereals. I'm not in a position at the moment to make a precise accounting of this, so I just assume as a rough calculation that these things will cancel out, and I directly translate 1 non-cereal food calorie to 1 ethanol calorie. That assumption could be off by a few tens of percent, but it wouldn't make any difference to the overall conclusion if it was.
Given all that, I can estimate the volume of ethanol equivalent of the global food supply, and compare it to the actual liquid fuels. (Again, remember in these volumetric calculations that the ethanol barrels are really only 2/3 as good as the oil barrels).

Ethanol equivalent of human food supply compared to global liquid fuel supply, 1965-2002. Cereal and non-cereal portions of food supply are stacked, but fuel is not stacked on food. Source: US Census for population, and FAO for food intake. Liquid fuel numbers are from BP.
You can immediately see the problem here. The biofuel potential of the entire human food supply is quite a small amount of energy compared to the global oil supply - somewhere between 15-20% on a volumetric basis, so 10-15% on an energy basis. If you look at the rate of growth from the mid 1980s to 2000 (and it would be similar to 2005 but the graph doesn't go that far), we were requiring about an additional 10mbd per decade. So if we continue to try to drive more at historical rates of growth, eg as the middle class in China, India, and other developing countries continue to build roads and get cars, while our oil supply is stagnant, we can only get about a decade or thereabouts from converting our entire food supply to fuel.
However, just because it's not a very good idea globally, doesn't mean it wouldn't be profitable to the folks doing the conversion. Let's look at the growth rates in global biofuel production, and compare them to oil prices.
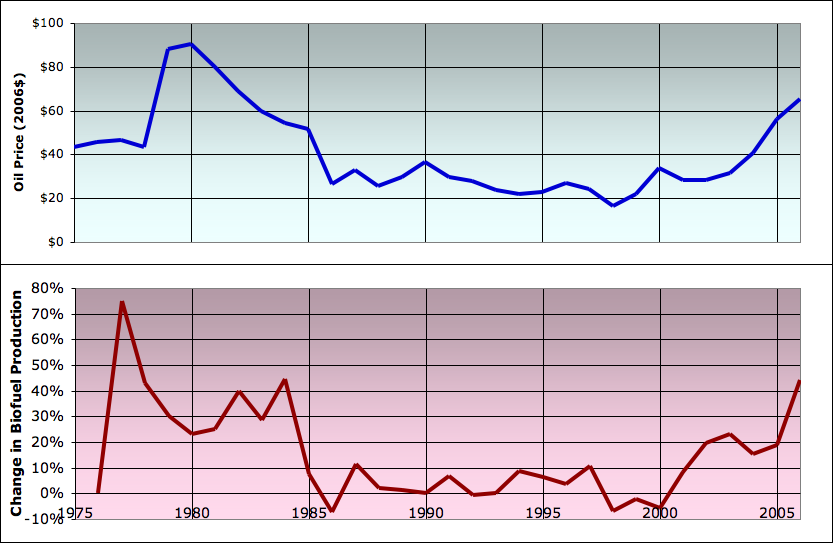
Annual change in biofuel production, 1975-2006 (bottom), with oil prices (top). Sources: Worldwatch Institute for biofuel production through 2005, and various sources for 2006 (1, 2, 3, 4). Oil prices are sourced from BP and are expressed in 2006 US dollars.
Again, we see a mirror of the US situation - when oil prices are high, biofuel production growth rates respond very dramatically in a short time. When oil prices are low, biofuel production almost stops growing. With the increasing oil prices of recent years, global biofuel production is up by a compound annual growth rate (CAGR) of 23.8%/year from 2001-2006. This next graph shows extrapolations of global food supply (expressed as mbd of ethanol), extrapolated on the highly linear trajectory it's been following, with biofuel production continuing to grow at 23.8%:
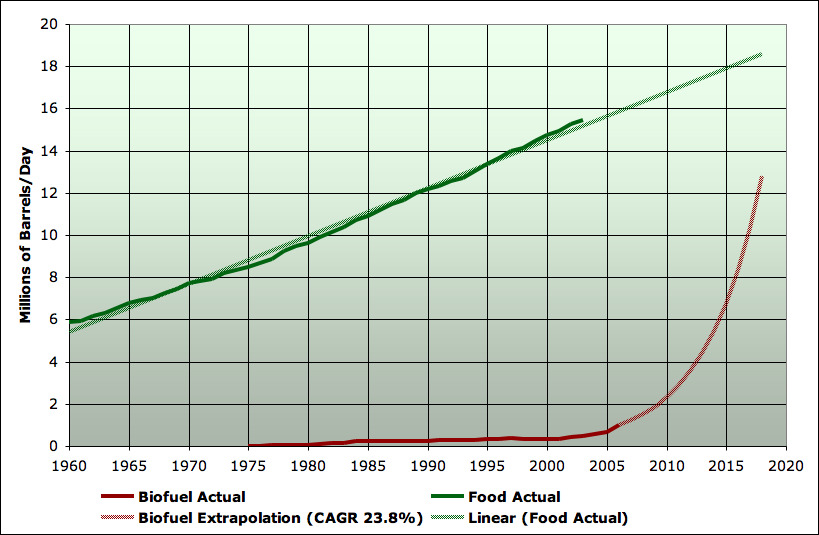
Biofuel production and energy equivalent of food supply, 1975-2018. Food is extrapolated linearly. Biofuel production is extrapolated at the CAGR of growth from 2001-2006 (23.8%/year). Sources: as above.
It appears that the biofuel production will be catching up to the food supply very quickly. Clearly, we are in the same exponential-growth-in-a-finite-box situation, again. It's just earlier in the process than with the US corn ethanol situation.
To make this comparison clearer, this next graph shows three things. Firstly, I repeat the same ratio I showed you earlier (US ethanol capacity in production and under construction divided by total corn crop ethanol potential). I also repeat the same sigmoid I showed you before. For the global case, we don't have capacity under construction estimates, just actual biofuel production, which I show as a ratio to the biofuel potential of the global human food supply. To help make the connection, I have put the US ethanol production on the same graph, as a ratio of the US corn crop ethanol potential again. The latter is just a couple of years behind the capacity build-out curve.
With the idea that the dynamics are roughly the same here, I've put the same sigmoid with the same basic doubling time as a projection for all three cases. I just shifted the time offset - the global production curve is offset about 3 1/2 years behind the US corn ethanol production curve.
Biofuel capacity or production as a fraction of food supply for three different cases, along with sigmoidal (ie logistic) projections. Plum curves show US corn ethanol processing capacity in service or under construction as a fraction of ethanol potential of entire US corn crop. Brown curve shows actual production of US ethanol as a fraction of ethanol potential of US corn crop. Violet curve shows global biofuel production as a fraction of estimate of biofuel potential of entire global human food supply. Sigmoidal curves all have K = 1/3 (infection doubling time of three years), and cross the 50% line at 2008, 2010.8 and 2014.2 respectively. Sigmoids are scenarios, not forecasts. Actual biofuel production growth will depend heavily on oil prices and policy responses to increasing food prices. See text for sources and methods.
The underlying idea is that both oil and cereals are global commodity markets. If it's profitable to make food into fuel in the US, even without a subsidy, then it's profitable elsewhere also - possibly more so given lower labor costs. So the basic growth dynamics are the same. The infection just hasn't got as strong a grip on the whole globe yet, but it's growing at similar rates.
I want to stress something here about the implications of the recent growth rates for the timing of the problem. Something growing at 25%/year growth doubles in three years. So in both the last two graphs with different extrapolations, you see global biofuel production hitting half the global food supply within about six or seven years. We'll discuss in a moment what factors could stop that from happening, but first I just want to point out that these time constants render cellulosic ethanol irrelevant to the issue.
Cellulosic ethanol is what most most advocates of biofuels assume that the future will belong to. It is ethanol made out of the cellulose in various kinds of agricultural waste, fast-growing grass or tree crops, etc. In an abstract, in-principle, kind of way, it might indeed be possible some day to produce a lot of fuel this way, since current global consumption of about 8 gigatons of fossil fuel carbon is an order of magnitude smaller than the roughly 60 gigatons of carbon fixed by the world's plants (net primary productivity). However, cellulosic ethanol is not commercially practical today, and there are reasons to wonder whether the transportation and material handling issues will be overcome soon. At the moment, there is a single pilot plant operating in the world at a non-commercial scale, and otherwise the technology is in the lab.
Let's grant, for the purpose of discussion, that all the problems will get solved and cellulosic ethanol will get off the ground commercially a couple of years from now. It won't have any meaningful impact on what happens with food-based ethanol. Remember the Code Red video, and the shape of the sigmoid curve? Remember how the infectious agent spends a long time quietly multiplying below the radar screen till it gets into the sharply rising part of the curve and seems to take everything over all at once? Cellulosic ethanol is at the very beginning of that long growth process. Food based ethanol is on the steep part of the curve already.
Ok. So this is all incredibly bad news. What could stop this process from continuing?
Well, I think there are three major possibilities worth mentioning. Again, the key point is that the spread rate of biofuel plants is controlled by the profitability of those plants. That in turn is mainly set by the difference between oil prices and food prices.
So, for possibility number one, if oil would go back down to $20 a barrel, that would certainly do the trick. There are people who continue to believe that the current stagnation in oil supply will end soon, and allow prices to fall. I'm not going to spend a lot of time on that possibility: we're still waiting, alas. Those who would claim oil will go back to $20, or $35, or $40, or $60, are getting quieter and quieter as it passes the $100 mark. My own view is that we are on the bumpy plateau of global oil supply. I do not expect either large increases or large decreases in oil supply any time soon, though small increases and decreases are certainly possible. If that is correct, I expect oil prices to increase in the medium term, though certainly they could go down in the short-term if the credit crunch affects the global economy enough.
The second way that biofuel conversion of food could sharply slow is when food prices get high enough. This is certainly going to happen before 100% of the food gets turned into fuel. The question is, at what point? When we have a bidding war between the gas tanks of the roughly one billion middle class people on the planet, and the dinner tables of the poor, where does that reach equilibrium?
This is not an easy question to answer. The situation is unprecedented enough that it's not easy to find good data with which to project the situation. Significant uncertainty remains, but I have found a couple of ways of making rough estimates, both of which produce similar answers.
One thing that probably puts a lower bound on the number of persons affected by large food price increases is the number of people who were already chronically hungry. The UN, as part of its Millenium Development Goals effort, has statistics on how many people currently cannot meet minimum dietary energy guidelines. Throughout the 1990s, that hovered around 800 million people:
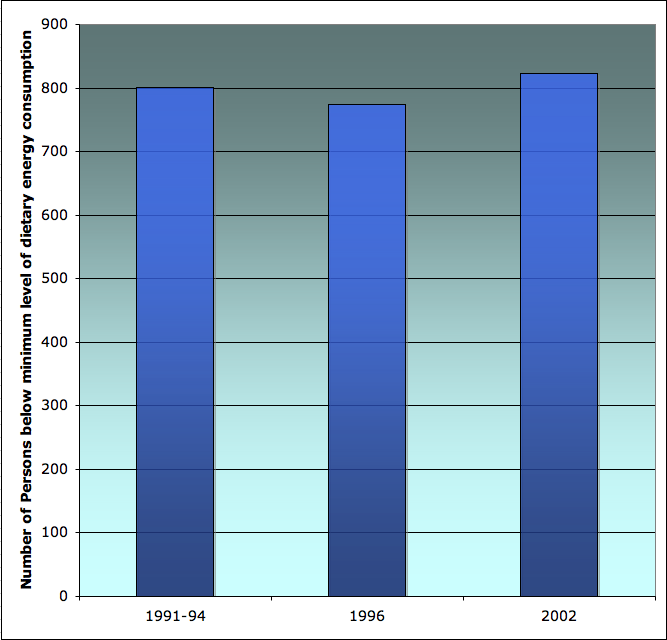
Global population unable to meet minimal dietary energy requirements according to UN Millenium Development Goals Indicators.
Presumably, it remained a similar number, at least until the major food commodity price increases of the last couple of years. I wouldn't claim to be very knowledgeable on this, but I struggle to imagine how someone who wasn't meeting minimum dietary guidelines already can continue to exist on half as much food, or a quarter as much food, as food prices come into equilibrium with the current oil price level, or perhaps double again should oil prices double again. I would imagine that if you are hungry all the time you would already be devoting most of the skills and resources available to you to the problem of eating, and you would have limited ability to increase that in the face of large increases of food prices.
This still leaves the question of how many people who were able to meet their minimal dietary needs at historic food price levels might not be able to do so at doubled or quadrupled prices.
I managed to find some data for food consumption elasticities across a broad range of countries in a USDA study Cross-Country Analysis of Food Consumption Patterns by Regmi et al. The most important graph is the price elasticities:
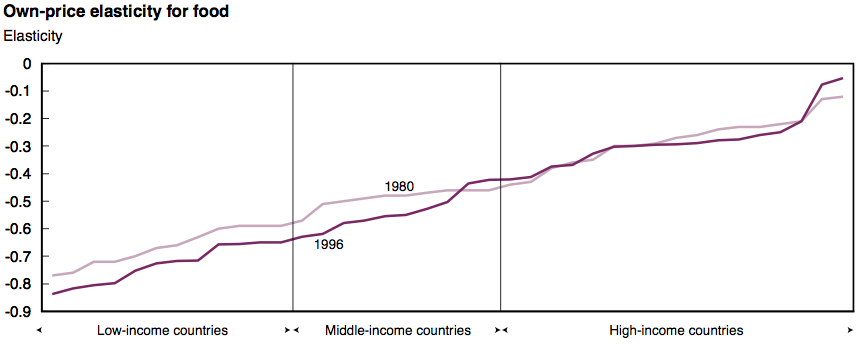
Food income elasticity by country income according to Regmi et al..
The definition of the price elasticity is that it's the ratio of the percentage change in quantity consumed as a result of a certain percentage change in price. For the low income countries in the sample, price elasticity is about -0.7. Thus a 10% increase in price would be expected to result in about a 7% reduction in food intake. It's not clear that elasticities can safely be scaled up to very large changes in price, but if they could, a 100% price increase would imply a 70% decrease in food consumed, which would presumably create severe hardship or death by starvation for most people in poor countries (unless their income derived from growing food, and they had secure title to their land).
The definition of low-income country in the Regmi et al study is that it has less than 15% of US per-capita income. Per capita income in the US in 2000 was just a hair less than $30,000, so 15% of that is $4500. According to this global income distribution data,
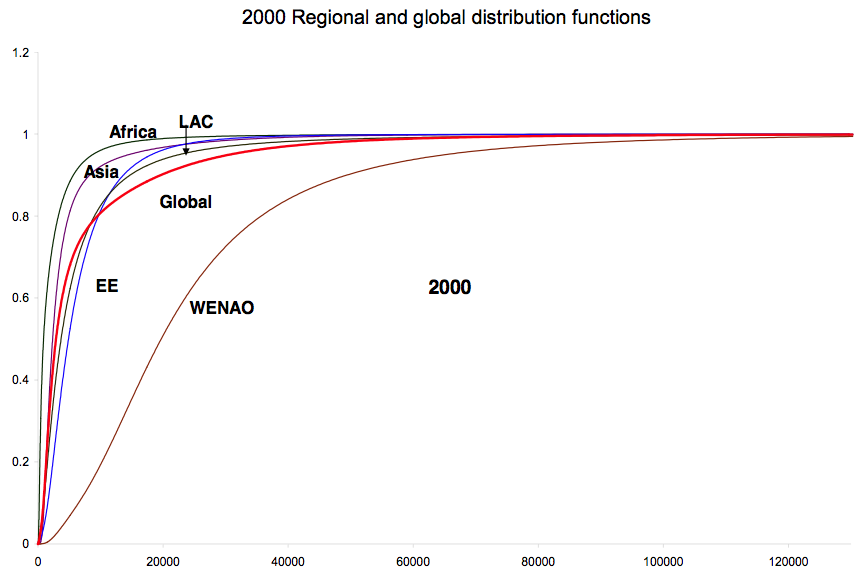
Global income cumulative distribution according to Chotikapanich et al..
for which I've blown up the low end here,
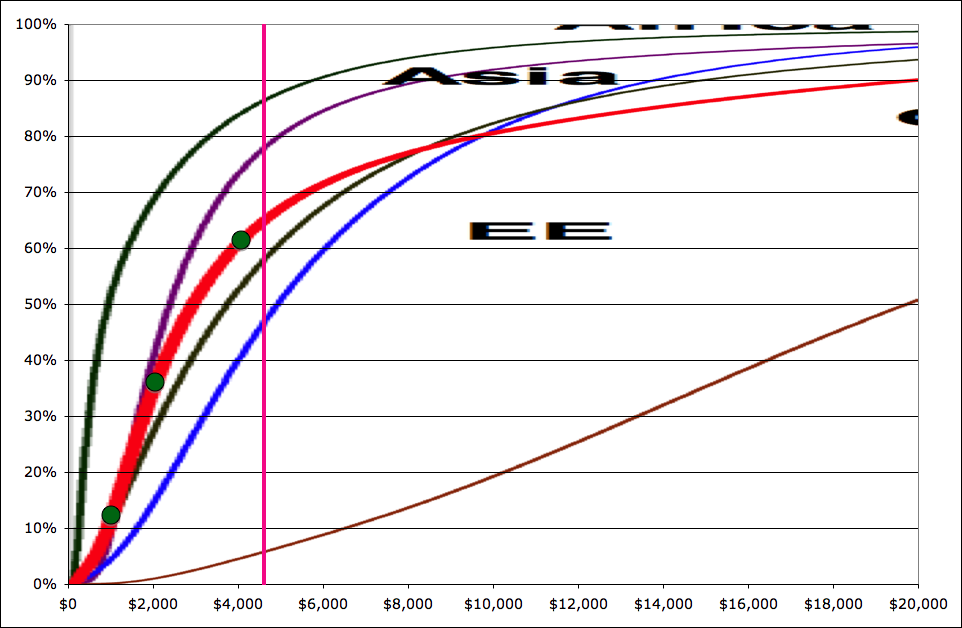
Low end of global income cumulative distribution according to Chotikapanich et al.. Pink line represents the $4500 income level.
about two-thirds of the world's population would fall into the low income category, and thus would apparently be extremely vulnerable to doubling or quadrupling of food prices. For another approach to the same thing, we can look at income elasticities (the ratio of the percentage change in food consumption produced by a certain percentage change in income):

Food income elasticity by country income according to Regmi et al..
Here the value for the lower-income 2/3 of the world's population is about +0.7. What this means is that a 10% reduction in income has about the same effect on food consumption as a 10% increase in food prices. This suggests that we can use the global income distribution (shown above) to roughly estimate the impact of a doubling or quadrupling of food prices. We noted earlier that according to the UN about 800 million people are unable to meet minimal dietary energy requirements. That is 12% of the world population. On the income distribution (one graph back), the 12% mark corresponds to $1020/year in income (shown as the lowermost green dot). By looking at the $2040 level (36% of the global population - second green dot up), and the $4080 level (61% of the global population - third green dot up), we can estimate that a doubling in food prices over 2000 levels might bring 30% or so of the global population below the level of minimal dietary energy requirements, and a quadrupling of food prices over 2000 levels might bring 60% or so of the global population into that situation.
These estimates should be regarded as quite uncertain. Still, it seems hard to make a case that food price increases will cause a cessation of biofuel profitability before a significant fraction of the global population is in serious trouble. The poor will not be able to bid up food prices by factors of two and four and keep eating. In contrast, the quadrupling of global oil prices, and tripling of US gasoline prices, over the last five years has had very minimal impact on driving behavior by the middle classes.
The core problem is that gasoline price elasticity in the US is about -0.05, versus the -0.7 price elasticity for food consumption by poor consumers. This makes clear who is going to win the bidding war for food versus biofuels in a free market.
This brings me to the final thing that could stop runaway biofuel growth: public policy. So far, there has been a fairly broad coalition in favor of increasing ethanol production. This encompasses agricultural interests, environmentalists hoping to reduce carbon emissions and rely on a renewable fuel, and many citizens concerned about reliance on Middle Eastern oil supplies. The Renewable Fuels Association reported recently that 3/4 of Americans believe we should increase our reliance on ethanol. This kind of thinking has led to subsidies and mandates for biofuel production in the US, in Europe, and even in a number of developing countries.
My conclusion in this analysis is that this broad agreement is in fact mistaken. It is based on a failure to appreciate the speed with which high oil prices and profitable biofuel operations can fuel a very rapid growth of the industry up to the point that it consumes a sizeable fraction of global food production. This will have only modest benefits for global fuel supply, but will cause massive abrupt global hardship in poor countries. Many unforseeable consequences may follow from that.
I suggest we reconsider our policy.
Contact
- Content: editors at theoildrum dot com
- Tech support: support at theoildrum dot com
License

This work is licensed under a Creative Commons Attribution-Share Alike 3.0 United States License.
A lot of blabber. If we could cut out the blabber, more people would be less hungry. The poor and hungry of this world don't eat corn. Period. Nor do they eat our chicken. Europeans are the main consumers of our corn and beans.
And oil prices (transportation and distribution costs) are by far the most important cost component of food prices, not the food crops themselves. Think about the box of cereal you buy and backout the crop costs: you will see.
There are vast lands closer to where those hungry people live that can be used for effective (human)food production. Hunger is not due to a lack of acres or world food prices, but is due to man-made messes in the areas where these peoples tend to live. Don't blame America's corn farmer for it. They only produce what the world wants.
I don't think any (most?) people are blaming the corn farmers.
They grow to the best of their abilities and sell to the highest bidder. That's the way the markets now work.
But subsidies for corn ethanol are fairly short sighted and single-minded based on all the data given on this page.
The fastest effect for oil consumption replacement in USA is efficiency and life style changes.
What would these people do after the whole US corn production was turned into biofuel and it still didn't make US liquid fuels independent? Burn wheat, barley and the rest of the cereals too?
It'll be interesting to see how this one plays out in the years to come. One way or some other :)
Unfortunately, that's simply not true. Corn is a staple foodstuff in many regions of the world, including Africa, where it is made into a porridge known as 'Pap'. Maize flour is the primary ingredient used to make tortillas.
Last year thousands of Mexicans took to the streets in protest at a 400% rise in the price of corn flour which was threatening the diets of millions.
Also, even if the poor didn't eat corn, the extra corn being grown is squeezing out other crops and raising the price of land. This tends to raise the price of other crops, like wheat, that the poor eat.
Seems that a few facts got skewed in all the charts and figures.
In fact, 95 percent of the price inflation in all world commodities, including food and corn, is attributable to the inflation in the price of petroleum, not corn.
In fact, you can not even break even making 2.8 gallons of ethanol from a bushel of corn, especialy as the target cost of production to beat with all bio-fuels is now under a dollar a gallon. Some of the most efficient bio-fuels producers are now well under 50 cents a gallon cost, even as low as 32 cents a gallon in one case I noticed recently.
In fact all profitable corn derived ethanol producers make their profits on the co-products; they have to.
Corn co-products include the fuels; ethanol, bio-butanol, hydrogen, methane, 4 or 5 varieties of bio-diesels, jet fuel, prop plane fuel, bio-crude oil, bio-kerosene, bio-gasoline, bio-bunker fuel, bio home heating oil and syngas. A few of the other co-products all coming from any single kernel of corn are; High Fructose Corn Syrup, Corn Syrup, Dextrose, Crude Corn Oil, Corn Gluten Meal, Sweet Bran®, Dry Sweetners, Acidulants, Citric Acid, Anhydrous Citric Acid, Liquid Citric Acid, Sodium Citrate, Potassium Citrate, Itaconic Acid, Natural Vitamin E, D-Alpha Tocopheryl Acetate, Mixed Tocopherols, Phytosterols, FFA, Citrous Salt, CO2, Monosodium Glutamate, Threonine and Cyclodextrins. There are also hundreds of pharmaceuticals, industrial chemicals, plastics, animal foods, and human foods and food ingredients, all coming from the same kernel of corn as co-products of the various fuels produced.
Corn processors have a lot of choices in determining what co-products to make and sell.
The earliest corn processors only made ethanol and brewers grains, which went for livestock feed. Now at minumum, they are finding that due to competition, they also have to extract the corn oils to make a profit. Corn oil, like soy oil, is a negative in livestock feeding rations. The processors can buy inexpensive add on modules to get the corn oil out at the front of their process. They can make the oil into cooking oil or diesel fuel. Used resturant and factory food processing cooking oil is of course reprocessed into diesel fuel also.
There are over 4,000 corn ingredients found on grocers shelves. Any of them can be made as co-products along with most any of the fuels from any singel kernel of corn. They have a wide selection of income streams to go along with the the income from the ethanol.
In fact the more corn we grow for fuels, the more co-products the processors have to sell, including food. Ethanol production from corn makes more food, not less.
Right now we are only processing around a third of our corn at its optimal values. Simply feeding it to cattle as we have been doing is very wasteful. We should be processing closer to 90 percent of it to best uses. There is plenty of high protein food left as co-products after the processing for the other value added ingredients to meet Americas food and animal feed needs and export plenty too.
larryhagedon
http://groups.yahoo.com/group/AmericanFlexFuelExperience/
This is a monumental piece of data pondering and as such, worthy of a re-post, imho.
I'll unashamedly copy a part of my old post from two weeks back here, as I think it is relevant to discussion at hand and bears repeating.
RE: Cellulosic ethanol vs. arable land for food production
According to University of Minnesota ecology professor David Tilman we are using c. 5 billion hectares of land for food production. If (and only IF) we can continue to grow crop yields on current rate, then we are going to need additional 1.7 billion hectares of cultivated land to feed the increasing population AND increases in meat consumption.
The trouble is, that we have 2.7 billion hectares available land for rain-fed agriculture, most of that forest. There goes the rain forest, puf! That's going to be an unmitigated ecological disaster, whether one cares about AGW or not.
So, if we are going to feed the world, where is the land needed to grow this cellulosic feedstock going to come from? Let's remember that it makes more economic sense to grow any crop on existing agricultural land or cleared forest, than it is to do it on marginal land. This is already showing as deforestation effects all over the world.
We should further keep in mind that he was referring to land based cellulosic biofuels.
Additionally, I'd quote Mr Daniel Nocera of MIT about plant biomass potential (paraphrased):
That should make people pause and think.
If we use all the land available, don't grow food at all and assume some losses in logistics, manufacturing, delivery, end use, then we could in theory fill our current oil use with biomass pontential.
However, in real world this is not possible, because we have to eat (we are using 65% of that land for food production and the growth need is another additional 35% or more), biomass thermodynamic potential does not equate actual Barrel of oil equivalent, and the price we would pay in terms of ecological disaster is pretty much unthinkable.
To put things into perspective: If all the cellulosic ethanol challenges can be solved, it may become a worthy silver bb in decades to come after all the biofuel plantations, logstics, plants and vehicles are in place. But it cannot come one overnight.
Further, it alone cannot solve the oil decline issue by replacing all liquid fuels. It is just not physically possible when looking at the raw potential of the biomass and land available on this planet.
As for what the biofuels craze of burning corn has done, World bank and IMF had this to say:
Fortunately, the corn biofuel craze may in fact be slowing down after 2008 if this data from RFA is any indication:
Still, the high price of corn as animal feedstock and for human consumption is probably far from over. This year USA will burn est. 32% of corn in car tanks and in similar uses, instead of eating it.
Personally I beginning to think that anybody who advocated burning corn in tanks probably cares diddly squat about what poor people in the world eat. That's of course a value choice, but at least these people should be open and honest about it :)
Should I starve my neighbor?
It is critically important to remove public subsidy from grain based ethanol. Solar energy on a few percent of deserts could generate all our fuel.
Ask you legislators to:
Remove public subsidy from grain based fuel and develop NON-food based fuel.
I have copied this post from the Stuart's prior article, because I think it supports Stuart's main theme that we are heading for a major famine. The numbers are slightly dated. Prices for gasoline, corn, coal are all up.
 EIA AEO
Because Ethanol is low EROI, it is essentially a conversion process for turning Natural Gas into a Gasoline substitute. One could argue that biofuels will grow when the price difference between NG and Gasoline is large enough to cover the costs of growing the corn as a "processing stock" (and pay other ethanol plant overhead).
This chart from the EIA's AEO 2008 shows the price per BTU comparing oil, natural gas, and coal.
If Nat Gas prices rise then the limit would be the price between oil and coal.
Using this price differential you could roughly predict when the biofuel boom will end. It ends when the price of corn increases to wipe out the margin between coal and gasoline btu's. (The increase in coal price might be a factor if the amount of corn production were larger, but with it peaking at so little, coal might not increase in price enough due to biofuel demand to matter).
Coal was $1.211 per million BTU in 2006
Gasoline at $3.00 per gallon is $26.2 per million BTU
1 Bushel of corn converts 2.6 gallons of ethanol which is 0.1967 million BTU
The price difference between that much coal and gasoline is $4.93
Operating costs on that much ethanol is $1.04 (eyeballed from Stuart's chart on plant costs per gallon).
So corn could reach $3.89 per bushel at $3.00 gasoline
At $8.00 gasoline, the difference rises to $9.04 and a max corn cost of $8.00 per bushel
Corn is ~ $3.20 per bushel now, so that is roughly a 100% rise in corn prices.
By the elasticity factors in the graph of human food supply above, that is a 70% reduction in the food demand by the poor and a 20% reduction in the food demand of the rich all put into motion by a further 5% reduction in global oil supply.
energy price data:
http://www.eia.doe.gov/oiaf/aeo/prices.html
BTU per gallon data
http://www.epa.gov/oms/rfgecon.htm
The US Department of Agriculture slashed its corn price estimate for the 2008-09 season by 60 cents August 12, forecasting a season-average farm price at $4.90-$5.90/bushel the agency said, as farmers shrugged off the worst flooding in 15 years and are expected to harvest the second-largest US corn crop in history.
From Platt's
Ahh, Predictions are tough. Especially when, as Yogi said, "They're about the future."
Today, we're producing about 650,000 barrels/day of corn ethanol. We exported about 16% more corn this year than last; and, we have 14% more corn in stock than this time last year.
Corn is selling at market for about $0.10/pound (up about a nickel from two years, ago, and grain prices are plunging all around the globe.
We're going to top out at a little over 900,000 barrels/day it looks like, and then we move on to cellulosic. The first/biggest move, there appears to be municipal waste to ethanol. The one dollar to one and a half dollar a gallon range seems to be where we'll get the next 1 1/2 to 2 million barrels/day.
Sometime after that we'll be moving on the "Ceres" enhanced cellulosic crops. With a Billion acres of abandoned/unused land lying fallow in the world we should be able to see between 500 Billion, and a Trillion Gallons/year from energy crops. That's before Ceres Gen II.
BTW, to get the "True" number of acres of corn used you have to take the yield (use 450 gal/acre - it's, actually, now a little more) and divide by .60 (you get 40% of your weight gaining ability back from the distillers grains.)
Yep, predictions are tough - esp. when they're about the future.
Also, keep in mind: Something like 70% of the world's hungriest people are subsistence farmers. The greatest thing imaginable for them would be Five, or Six Dollar Corn. At that price the Urban Poor would still be able to afford it; and, the poor farmer would be able to afford to raise it.
As for our friends in Mexico: Whatever happened down there with their White Sweet Corn (we grow Yellow Field Corn for Cattle Feed, and Ethanol) it had nothing to do with what we were doing up here. At the time, Mexico had high tariffs on our corn. Actually, it was only after the tariffs expired in Jan 1 of this year that the whole thing went away.
Now, of course, the Mexican farmers are protesting the cheap U.S. corn. Cain't win.
Same old kdolliso, same old ethanol propaganda. Your ethanol lies have been repeatedly refuted yet you continue to spew it as if doing so will make them "true". You come in here and attack Stuart's massive work with a few lines of trash commentary, zero data, and refuted "facts".
Many of us are tired of your propaganda, kdolliso. Also, you may want to reconsider what you are doing, because if this turns into a massive human tragedy, you may be one of the many who will be held at fault.
By the way, the "plunge" in grain prices is a correction from recent highs. Current prices are still vastly higher than previously, which even you note. Do you enjoy contradicting yourself repeatedly?
Instead of slinging ad hominems, why not just point out where I'm wrong?
I'll check back a little later.
Point out again? Why bother? Robert Rapier and many others have debunked you again and again and again. Yet you show up in the next ethanol related thread claiming the same old tired horse manure and then demand that it be debunked AGAIN.
There's zero need for anyone here to continue debunking you yet again. All they need to know is that you've been debunked so many times in the past that this is becoming tiresome.
Cain't remember, huh?
Well, maybe someone a little more knowledgeable will show up to tell me where I'm wrong. Meantime, you really shouldn't call someone a liar, unless you can Prove it.
The USDA forecast is for a lower corn harvest this year than last. Last year there was a record corn harvest at the expense of planting fewer soybean acres. By taking soybean acreage out of production and putting corn into production one did not solve the problem of higher food prices, and increased malnutrition of the poor. The nation is nowhere near satisfying Federal ethanol mandates and more corn is needed.
Not only does the United States have aspirations to make more ethanol in the future, Canada has a mandatory ethanol law that may require much more corn consumption for ethanol production by 2010. There were EU directives resulting in both ethanol and biodiesel production. There are U.S. state laws requiring biofuels production including mandatory biodiesel production. Soybeans were consumed in order to make biodiesel. There are additional biofuels programs in India, China, Brazil, to name a few. One of Stuart's charts shows the escalation in ethanol capacity bieng built. This year may not be like last year. Already there have been losses in ethanol production facilities at a time when the nation needs corporate profits and the jobs created by such.
A United Nations report blamed biofuels production for most of the rise in food prices since 2000. When George Bush claimed cellulosic ethanol to be the way to energy independence, the cost of cellulosic ethanol was as high as no company or individual could produce cellosic ethanol without losing money. Cellulosic ethanol is a very expensive and inefficient energy loop that has not been proven economically viable in any nation on earth and if carryed out may lead to record high fuel prices and voter dissatisfaction over government waste and inefficiency.
Feeding your grain to cattle does not increase your yield.
Why you insist on repeating this utter falsehood time and time again is beyond me. Its not like it hasn't been pointed out to you each and every time.
The first couple of dozen time you've done this I guess I could dismiss it as plain stupidity. But the fact you continue to do so shows nothing but the plain desire to deceive.
You are a liar, a fraud and and all round pain in the butt. Please go away.
That's what field corn is, R, Cattle feed.
It consists of starch, and protein. To make ethanol you remove the 1/3 that's starch, and retain the approx one third that's protein. The approx 1/3 that's CO2 is either vented, or, increasingly, used for dry ice, soft drink carbonation, or oil field flooding.
There's also a little over a pound of corn oil in there (that, actually, is bad for the livestock) that's increasingly being removed to be used for either biodiesel, or cooking oil.
As you have, no doubt, noticed: No one, yet, has disputed any of the particulars of what I've had to say. I'm sorry knowledge offends you so. You might try the funny papers, tomorrow. They're entertaining, and will not upset you with truths you don't want to hear.
It doesn't matter what you do to the DDG. You still have x gallons of ethanol from the fermentation.
You are trying to attribute whatever energy credit you can get from the ddg to the ethanol itself.
I don't care how fat your cows are getting. Unless they start pissing ethanol ddg's do not increase ethanol yield.
This is a lie. Stop repeating it.
One last time:
I've got an acre of cattle feed (corn.) I use 2/3 of it to produce ethanol. I get 450 gallons of ethanol. What is my yield/acre.
Your yield is 450 gallons.
It matters nothing what you do with the DDGs. Feed them to your cow, burn them for heat, throw them back on the field as fertilizer etc. You still only get 450 gallons
You can't divide 450 by .6 like you repeatably claim.
I wonder what the prospect is for a repeal of the tariff on imported ethanol after the election?
They expire in 2010? It would take 60 votes in the Senate before then. Ain't gonna happen.
kdolliso,
The analysis is quite silly, real ivory tower nonsense.
USDA projects exports in the next decade to be flat on most corn related
items such as meat, poultry, pork and dairy.
http://www.usda.gov/oce/commodity/archive_projections/USDAAgriculturalPr...
In fact, hungry countries like China, Brazil and India don't want our food and in fact want to export food to us! The Koreans and Japanese bar our beef.
Bottom line, 'evil' corn farmers are trying to create another market for their crop so they shouldn't kill each other so agribusiness, grocers and slaughterhouse have low costs and so Big Oil doesn't face a competing fuel.
For example, the US produced 28 billion pounds of beef worth $36 billion dollars or $1.28 per pound and corn feed is just a fraction of that.
Ethanol is a straight substitute for gasoline
so $4 gas=$4 ethanol is about the same as $.62 per pound. At $200 a barrel oil, that's $6 gas or almost $1 per pound for ethanol.
Sooner rather than later, ethanol will be needed to take up the slack as petroleum declines.
Corn farmers are right to be skeptical of these 'humanitarians'.
Can corn farmers take up the slack with very pricey diesel and nat gas? High input costs?
No agenda on my part but I have trouble thinking we can keep production going ever higher with higher expenses based upon less available resources.
Todays Drumbeat export oil declines projections are spooky.
Redcoltken, corn is expected to yield 155 bu/acre this year. Every bushel will give up approx. 1.2 lbs of corn oil (biodiesel.) As a result you can farm approx. 4 acres of corn with the oil off of one acre. Note: This doesn't affect the 450 gallons of ethanol, nor the 2,700 lbs of cattle feed, and the 2,700 lbs of CO2 (that could be used to lift approx 200 gallons of oil from tired oil fields.
Nat gas won't be a game-ender in that more, and more ethanol refineries are going to biomass for process power.
However, our good friend Totoneila has identified the dark cloud on the horizon. Phosphorous is going to be a real headache. With, or without, biofuels. Peak oil doesn't scare me. Peak Phosphorous does.
Then that means 1/4 of the corn harvest needs to be cycled back into energy for farming operations
What about fertilizers, I thought they are natural gas based?
I am a computer-engineer-turned-farmer. My experience tell that 20% to 25% of your crops if used as an energy source is enough to keep the level of food crops we are having now due to green revolution provided:
(a) You are happy to get 2.5 times the yield than was before the green revolution. Per acre 1000 kg wheat, 1600 kg grass-hay, 2500 kg fruits, 2500 kg vegetables, 3000 kg rice etc. If you press it to get what usa now get, 2400 kg wheat or what europe now gets 3200 kg wheat then you are calling for much more troubles than you can handle.
(b) You can't avoid pesticides. Green revolution seeds are weaker to pests than traditional seeds. So some of energy must be used in making pesticides.
(c) You not really have to worry about fertilizers. You can always recycle it. All you have to do is to accept doing the "dirty" work of applying animal and human excretions back to soil. Ofcourse you have to be careful about the amounts of fertilizers you apply or it would burn the plants but the law of conservation of mass tells that your NPK can always be get back. 60% of nutrients is in non-seed parts of grain plants that can easily be left in soil to recycle so that you only have to worry about the other 40% that you actually take out of farm and sale it to city.
Interesting - thanks!
No, No, read it again - Closely. It takes a little less than 8 gallons of diesel to farm an acre of corn.
You get enough corn oil off of one acre to farm the next four. In Addition, you, also, get 450 Gallons of Ethanol off of that acre of corn, In Addition to the 2,700 lbs of DDGS (enhanced cattle feed,) and approx. 2,700 lbs of CO2 (which could be used to lift 200 gallons of oil.
I just used the "Corn Oil" because most tractors, at present, are Diesel. If you had an ethanol-powered tractor you could farm another 50 Acres off of the One Acre.
So 450 Gallons of ethanol off of 1 acre of land would be about 1800 dollars per acre with 4.00 per gallon as a baseline.
THIS is what we're "Really Talking About.
$1.5 BILLION Going Overseas EVERY DAY! I would rather it was going to Iowa, or Tennessee, or California, even. At least, there, I'd have a chance to get some of it back.
I've never sold the first insurance policy to a Saudi Sheik.
I will have to study this a bit more
How convenient that you'd mention such a trivial energy input rather than the nitrogen fertilizer you're applying to the field(natural gas equivalent to about 20-30 gallons of diesel), or ethanol conversion process(natural gas and electric power equivalent to 160 gallons of diesel).
Ethanol is nto a straight substitute for gasoline, it only supplies about 2/3 the BTU's of gasoline and it requires a large energy input to make the ethanol. You needed natural gas or coal to distill the ethanol; energy to transport and crush the corn. The ethanol is not entirely "green" either. Combustion of ethanol released formaldehyde and acetaldehyde into the atmosphere. Both were carcinogens and one was an eye irritant.
If you eat less meat you have more corn available for ethanol. This is not very popular with the ranchers and livestock raisers. Tyson's food recorded a large loss due to higher corn costs. There were losses reported at Pacific Ethanol due to high corn prices, and we had to pay taxes to subsidize this farce that is losing money and driving up food costs.
From the Tyson web site
The continued escalation of grain prices, driven largely by government mandates for corn-based ethanol, has caused a domino effect for other inputs
http://ir.tyson.com/phoenix.zhtml?c=65476&p=irol-newsArticle&ID=1100522&...
I have doubts about corporate statements - a lot of sins can be hidden within a single bad quarter.
--------------------------------
Then a part of the answer may verge on the ridiculously simple - don't eat too much, and when you do eat make sure its mostly plants.
You appear to be 'stuck on STUPID'.
Let me help to EDUCATE you.
"The upshot of all this production is progress toward the ethanol quotas required by the new Renewable Fuels Standard, which mandates 15 billion gallons of ethanol be produced from corn in the US by 2015."
http://gas2.org/2008/04/09/2015-30-of-us-corn-harvest-will-be-gasoline/
So the US in 2015 will produce 15 billion gallons of ethanol. The US consumes 150 billion gallons of straight gasoline, so at that time we can replace that with 150 billion gallons of gasohol(E10).
This will result in a 3% decrease in miles-per-gallon fuel economy.
http://ncseonline.org/NLE/CRSreports/energy/eng-59.cfm#_1_7
This is could be immediately offset by properly inflating your tires.
(IOW, the amount of fuel you could save by not driving like a jackass, which I would guess is how you probably drive now).
http://www.fueleconomy.gov/feg/maintain.shtml
How much is 15 billion gallons of gasoline saved per year? About a million barrels per day--the entire US currently PRODUCES 5 million barrels per day of crude. Alaska today produces 700,000 barrels per day. The offshore GOM is 400,000 barrels per day.
http://tonto.eia.doe.gov/dnav/pet/pet_crd_gom_s1_a.htm
http://tonto.eia.doe.gov/dnav/pet/pet_crd_crpdn_adc_mbblpd_a.htm
Funny how that MORON McCain hates ethanol but wants to drill offshore where there is increasingly less oil to be found(see above eia table).
Stop being an idiot.
You appear to be 'stuck on STUPID'.
I think that tone is inappropriate within this forum.
Okay, I apologize to rainsong for my poor choice of words.
Rainsong, a high compression engine will give the same hp/mileage rating on ethanol as a standard engine (the only kind you can run gasoline in) on petrol.
The most modern ethanol plants will use much less nat gas (some/many, none) to produce a gallon of ethanol than an oil refinery uses to produce a gallon of gasoline.
All energy processes give off some pollutants. Ethanol much less than any of the other major ones. Acetaldehyde is the gas given off by ripening fruit. Gives it a nice smell. Same with corn ethanol.
In any case, we're now producing 9.8 Billion Gallons/Yr. The Max is 15 Billion Gallons. We'll be almost there (13.6 Billion Gallons/Yr) in a little more than a year. You'll never know it happened. It's a tempest in a teapot. Except, We Won't be sending 120 Million Dollars every day to some people that don't like us.
Stuart
I do like the parallel between corporate behaviour and a virus.
I have one issue with this analysis and that is that you seem to assume that everyone that eats is in the international market for food. I don't see this being the case, what proportion of the 800 million are subsistence farmers, that use no external inputs, ie no seed, fertilizer or fuel to farm. The international price or availability (or market for that matter) of food has no effect on these people, they simply farm year after year for their own existence.
Neven
Good point that a large number mostly eat in situ what they grow, but I am not sure that it alters Stuart's case that much.
For what its worth though, no update, but I have a hard copy 1995 ref from my old prof (he was a world authority) that only 10% of world wheat, for example, was traded across international borders. Similarly, not that long ago(couple of decades) village ecosystems fed clothed and housed 40% of world's population. Of course rapid urbanization has continued, now just over 50% of world population. (This 1:1 ratio needs comparison with perhaps a billion USA, EU, OECD where less than 5% grow food) so very significant world population still eats at home probably about 80% of their cereals production. I have hard copy ref for highly productive Yangtze village. They have needed particularly N fertilizer to supplement very high levels of in situ soil nutrient recycling. The need for N presumably accounts for China's recent investment in N production next to Mongolian sources of NG. (Globally, N fertilizer production uses about 5%of world NG).
Knock-on effects of profitable growth in biofuels however must be huge. The rapid expansion phase does look like an infection. My understanding is that sudden taking in of USA set-aside for corn ethanol sucked in world potassium (K) and the mines could not ramp up. Similar for P. Recent increase in price of internationally traded cereals and legumes i.e. the basic calories and protein, and derived food, is 75% due to biofuels according to recent report http://image.guardian.co.uk/sys-files/Environment/documents/2008/07/10/B... : associated low grain stocks, increased fertilizer costs for local production all over the world etc.
I note also Stuart's chart of the trend for biodiesel (Oil Palm) which eats into tropical forests with potential terrifying release of soil carbon. As well as transport eating into world food we could see biofuels rapid 'infection' of forests. Potential for growing our own biodiesel in the UK is at max 6% of our current diesel use in transport. We are preparing to import very large quantities of biodiesel feedstock for newly constructed refineries.
The beginnings of biodiesel figure in one of Stuart's chart with potential similar to bio ethanol
*sigh* Lately, I seem to have switched to constantly taking the dissenting opinion.
The one big, glaring problem with this post is that no one is arguing for infinitely increasing corn based ethanol production. Even the bonehead journalists seem to get the idea that we're using a significant fraction of our corn crops for fuel, and with the attention that food riots and whatnot brought, I think that the general populous got the idea pretty clearly.
In the beginning of this post, it was mentioned how very short lead times were needed for the infrastructure over oil, commonly 1 to 2 years. So, this technology has huge maneuverability over other technologies. But at the end, there are no other solutions, and anything you've heard is wrong. End of story.
Yes, I'll post this image again...
This isn't just a matter of cellulosic ethanol. I don't come close to believing kdolliso's estimates, but the current efforts should constitute scaling up to something else. Demo algae plants are under construction all over the world. Hydrogen powered cars and cellulosic ethanol are both pie-in-the-sky things that, in my mind, will come marching in with fusion in the infamous "40 years". But it seems like many posters here would rather trash all the options. But yet, the entire advantage of biofuels is that there is more than one path. There are lots of potential feedstocks, and the choice of corn (vs something else) was arbitrary technically (not politically). The entire point is that this technologically can evolve and take small steps, as opposed to taking a HUGE leap and going to cellulosic or algae or something really futuristic.
I'm just saying, putting all this together, it sounds like you're saying the deployability of this technology is huge when it's bad and can starve half the world, but when it's adaptability could be a good thing, then it's overrated. It kind of sounds like, maybe just a little, there is some preconceived conclusion.
I strongly believe that peak oil is a big problem (I'd even call myself a "peakist"), that's why I read TOD. Really, I think of myself as pesmistic, but I can't compare to the people here. Burrying the few options that have had intermediate sucess does not sound like a good idea. Saying that efficiency decreases consumption of a resource is a lie, conservation can validly decrease use, and is in all reality the "moral" response, but there are reasons I don't think that will stick. The only way to get over this is to have high prices to destroy demand and usher in the alternatives, and those alternatives should be chosen based on merit. A quick stop to the expansion to the one alternative that has had large (1M barrels/day!!) success doesn't make any sense. We need changes in this policy, but it should come in time. When we planned for that change to happen.
The "Food vs. Fuel" argument leaves out a great number of relevant factors in the equation. Most importantly, why would anyone assume that Americans will continue driving 9 MPG Hummers when 100+ MPG PHEV's are available? Of course they won't! Which is why they've already stopped buying gas guzzlers. Demand destruction has already reduced America's gasoline consumption by 5%. When PHEV's become readily available at auto dealerships, consumption could be reduced by another 75%.
Growth of Ethanol production in the US has been nothing less than miraculous. Everyone involved (including the politicians) should be commended, not ridiculed. If the auto industry can be transformed as successfully as the liquid fuels industry has with Ethanol, then the Peak Oil problem will be solved.
If prices are high, you are of course right.
However, and this is my personal pet peevee here, is that people think PHEV's will somehow change things overnight.
They will not.
This has been covered a gazillion times with many references.
Car fleet replacement rate is 2% in US. Less than 0.6% of those are hybrids. Manufacturers have 7+ year product cycle. Manufacturers are having hard time bringing up capacity of hybrids/PHEVs. PHEVs are still really expensive in the category people will even consider them. Sweden (1/40 the size of USA) calculated that on a crash course they could change 50% of the fleet in 15 years.
So, there are many, many IFs and most of them push PHEVs a couple of decades away in any meaningful fleet replacement number.
What about in-between? What about until we get to that PHEV paradise?
Let's assume for the sake of discussion that production AND exports AND crude quality starts to take a nose dive in 2015? What then?
This is not to say PHEVs may not play an important role. However, it remains somewhat unlikely they will magically replace 850 million ICE cars in the next 10 years in any significant number.
I'm not agains PHEVs, I just think that they are a one silver BB on a long run and concern mainly the personal auto fleet. There's lots of other issues from PO that hybrid's don't solve (AG, petrochem, boats, planes, power generation, etc).
You are making the mistake of applying historical data to a new set of circumstances. There have always been alternatives to oil (and ICE's), it's just that oil has always been more economical. Not anymore. The economy is fluid, humans have always adapted. "Peak Oil" is not the end of the world that many are making it out to be.
What will happen in 2015?
The auto fleet will consist of PHEV's, ICE vehicles converted to electric, and fuel efficient small ICE vehicles.
Fewer cars will be on the road because many will not be able to afford them. (Yay no traffic!)
Air travel will decrease dramatically. Only the wealthy will be able to travel long distances by air.
Food and other commodities will become more expensive because of increased transportation costs.
Worldwide Ethanol, and Methanol production will have increased dramatically.
You're a doomer. You only need a PHEV if you are committed to driving 20000 miles per annum. A high percentage of North Americans can do just fine driving 5000 miles per annum which at $4.00 per gallon costs about $800 a year in fuel-even $10 a gallon is no big deal, and not worth buying one of these overpriced PHEVs just for fuel saving.
Well, the thing is... they didn't change from 9mpg vehicles to even 25mpg vehicles, so why would they change from 9mpg to 100mpg? How big does the difference have to be before they all change over?
People haven't stopped buying gas guzzlers, they're just buying less than before. "Less" is not "zero". And anyway, the sales of the guzzlers are increasing in China and India...
That's right! Creating a new paradigm where farmers grow food for machines is nothing less than miraculous. Well done all those involved (including politicians). They should be awarded a gold medal along with those other notables for innovative new ways for population reduction.
It's so important that people realise that the right of machines to roam the land for no particularly good reason is inalienable and supersedes any not-so-inalienable rights of humans or Nature.
Long live BAU!
OPEC says it's producing 1M bpd too much. Demand for OPEC oil is projected to slip another 900k bpd next year.
http://tinyurl.com/6osolf
Iran's producing over their quota and has signed contracts to increase production another 500k bpd. Iraq has plans to double production to 5M bpd. Nigeria is trying to get 500k bpd back online. Saudi Arabia says it can produce 12.5M bpd next year,and 15M bpd in coming years. And they claim they can produce that for 30 years to come. The big question is,will KSA be happy cutting production as all the other OPEC capacity comes online? Because it looks like they'll up capacity by 6M bpd and have to cut production by 3 or 4M bpd anyway. That ain't gonna make for happy campers imo.
Btw,thanks to tar sands and ethanol,North American production of liquid fuels is expected to increase next year. The tables are set for some serious oil price declines. I'm thinking $80 oil is weeks away. $50 sometime next year.
15 mbpd is light-KSA has got to be good for 30 mbpd easy.
Great article.
I like to share some of my own experiences. As I had previously told here at tod I had shifted to a farm full time and began to live off on it. This farm is at a place which used to be a desert before tube wells came. The tube wells have a diesel engine that pump water out of ground. This water had gone in ground by the little rains the desert gets. What the tube well do is that it pump this ground water, store it in a pond then we feed it to crops. Part of it get evaporated or run off to neighbouring land and part of it get absorbed in ground again. This part that is absorbed in ground can again be pumped and feed to crops. My calculations tell that at maximum the evaporation and run off is 20% of the water feed to crops so we can at maximum increase the water supply 5 times than what is naturally available by rain. That is if we are pumping water out at a sustainable rate. In indian punjab water is being pumped out at 10 times the rate of delivery by natural sources or twice the sustainable rate, that is why their ground water level is going down each year and at some places they have to quit using tube wells altogether because water level is too down. It would take many decades, may be even centuries for water level to reach levels high enough to be pumped again.
So, we can increase water supply by 5 times sustainably atleast where I live. This usually means 5 times increase in crops especially in deserts like the one I am living in where the limiting factor at hand in crop yields is water. The problem is how to power the diesel engine to pump water out of ground. I had worked on a solution using ethanol in place of diesel but still have to use 15% diesel to keep out of trouble of stinks and engine damage. Here are my calculations on the amount of ethanol produced and water gain etc that I like to share with tod readers:
To get ethanol the best way is to plant sugar cane. Luckily where I live the climate and soil also supports this. To get one ton of sugarcane you have to give it 175 cubic meters water. This one ton sugar cane contains 145 kg bagass (dry fiber) and 138 kg sucrose. You have the option of converting sugar cane juice either in sugar OR in ethanol since they are separate processes. If you want to get sugar you can get 112 kg sugar and 23 kg molasses. If you want to get ethanol you can get 72 liters ethanol. Since 1.5 liters ethanol contains as much energy as one liter petrol therefore that is equivalent of 48 liters petrol.
From a calories point of view, each kg of sugar contains 4000 Calories as its pure carbohydgrates, each liter ethanol contains 6000 Calories and each liter petrol like all oils contains 9000 Calories. Interesting thing is that the energy contained in one liter petrol is same as the energy contained in one liter edible oil.
The energy needed by the process of getting ethanol from sugar cane comes by burning the bagass, still you get a surplus of energy that can be used to create enough electricity that could be provided by 2.7 liters petrol.
Therefore altogether you can get equivalent of 50.7 liters petrol from one ton sugarcane.
Now the question is how much cubic meters of water can be extracted from ground by burning one liter petrol. That ofcourse depends on the ground water level and soil structure etc but I can share my own data for starters. I had consumed 150 liters petrol for the winter crop to extract ground water and I was able to grow 3400 kg wheat. Amount of water needed per kg wheat varies between 0.9 to 1.3 cubic meters so I take the middle figure of 1.1. That means my crop of wheat has consumed 3400 x 1.1 = 3740 cubic meters water. That particular winter last year was not totally dry, there was some rain which I think provide a quarter of the water consumed by wheat but since it has other effects too like increasing ground water level making it easier to pump out water and humidifying the atmosphere which reduce evaporation rate therefore I generously assume that half of the water comes from rain. So, atleast 1870 cubic water comes from diesel engine's effort and since I consumed 150 liters diesel so its safe to say that one liter of petrol put in diesel engine run tube well pump out atleast 12.5 cubic meter water.
So, to get 175 cubic meter water to grow one ton sugar cane you have to consume 175/12.5 = 14 liters petrol. You can get equivalent of 50.7 liters petrol per ton sugar cane grown therefore by each acre on which sugar cane is planted you can support four such acres.
In other words you can increase water supply by 5 times using ground water but you have to use 25% of this water to grow sugar cane to make ethanol to run tube well to pump this water. Therefore the net increase in water amount is 3.75 times. I would say it is 4 times because I have a feeling that I had over estimated the effects of last year's winter's rain.
My previous calculations shows that at a land that I call 1k which receives 1000 cubic meters of water coming naturally per year you need 0.8 acres to support one person. This 1000 cubic meters water land may be one that has 10 inches rain or one that has one acre ft canal water. One acre ft canal water is actually 1200 cubic meters water per acre but I assume the top 200 cubic meters to be evaporated, absorbed or get run off on its way from the canal to the farm.
A land that get 1000 cubic meters water not get all of it when its needed. Typically in subcontinent 80% of rains and canal water comes in summer so I assume that only 800 cubic meters water per acre at 1k land is used by crops. Since if pressed it takes 640 cubic meters water to grow annual food for one person (100 kg grains, 100 kg fruits, 100 kg milk, 25 kg vegetables, 12.5 kg mutton/beef, 12.5 kg white meat, 12.5 kg spices, 12.5 kg dry fruits, 12.5 kg sugar/honey, 12.5 kg tea/coffee) so from one acre of 1k land you can grow food for 1.25 people or in other words it means each person needs 0.8 acres of 1k land.
Now if you use tube well and power it by your own grown ethanol you get a factor of 4 so now you need only 0.2 acres per person. This way you need only 1.5 billion acres or 10% of world's arable land to support 7.5 billion people.
Two suggestions.
Rather than ethanol for pumps what about windmills.
http://sgp.undp.org/download/SGP_Egypt2.pdf
Here's a video of an ancient stirling motor-water pump(1895) that can be fired with charcoal, twigs, etc. I've even heard that remote solar versions of these used on US farms before replacement with diesel or electric units.
http://www.youtube.com/watch?v=YF--Mrf-6Fk
Here's a rather cool demonstration of a solar 'hot air' motor in operation.
http://www.youtube.com/watch?v=3O1xacAu4jA
I wonder if anyone is manufacturing such devices overseas? ;-)
Excellent Job.
Using liquid fuels for pumping water is almost criminally stupid. Burn the natural gas/coal directly in highly efficient centralized plants and use electrical power to run your pump instead of wasting food, natural gas and coal to produce a less than equivalent amount of work(a small, crappy little ICE is no match even for a coal plant, much less a modern combined cycle gas turbine).
Clean burning liquid fuels are far more expensive than other sources of energy for a reason; don't waste them on a stationary applications.
But it's even worse than that. Water is fairly easy to store; it probably makes more sense to use intermittent wind power rather than wasting reliable grid power.
Ease up. The man is giving a small, localized solution. The options you outline may not be available to him.
That's even worse; don't expect to get anywhere near the efficiency of an industrial scale operation with your basic moonshine still.