Update on US adaptation to higher oil prices
Posted by Stuart Staniford on December 8, 2006 - 12:17pm
We now have VMT (vehicle miles traveled) data through August, and that allows us to see what happened during the summer when oil (and thus gasoline) prices were very high. For context, here's the price history:
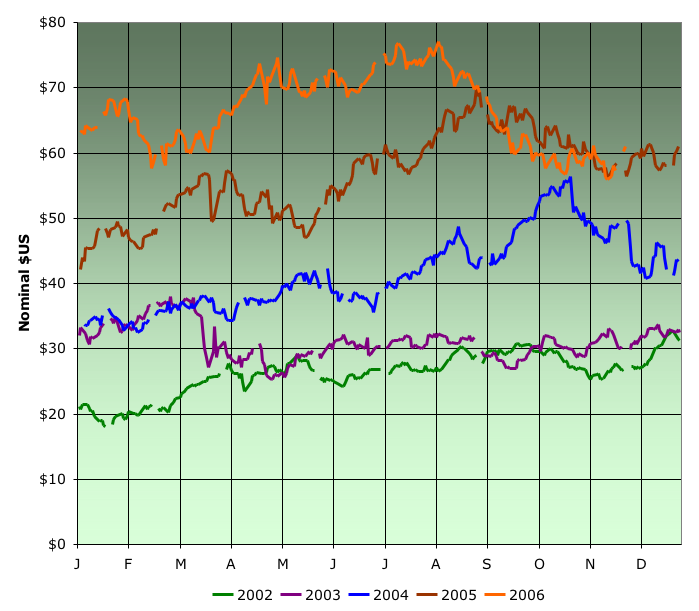
(As an aside, it appears to me that in the last three years, as the market has got tighter and tighter, it has developed an interesting seasonal structure where there is a spring run-up in price, and then a larger summer run-up in price, and then an autumn price drop. However, these features are getting earlier and earlier, and larger and larger, each year. I think the drop in price in September/October fits this narrative, and I expect prices will start to run up again late this year or early next year (though probably not too much higher than they got this year, absent worsened geopolitical problems).
So if we look at what drivers did in response to these prices:
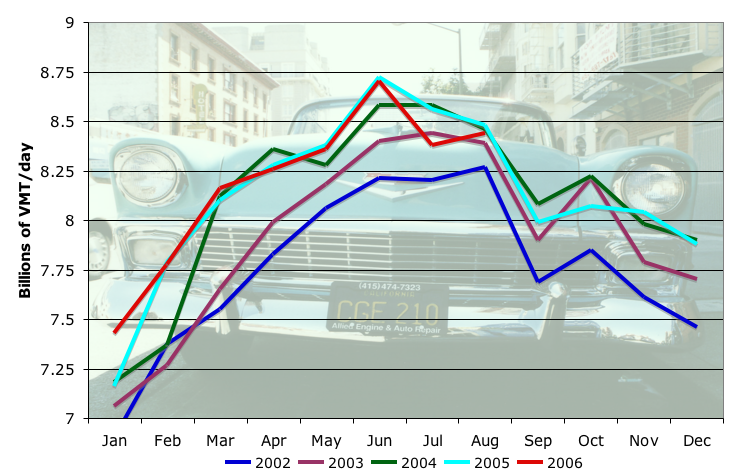
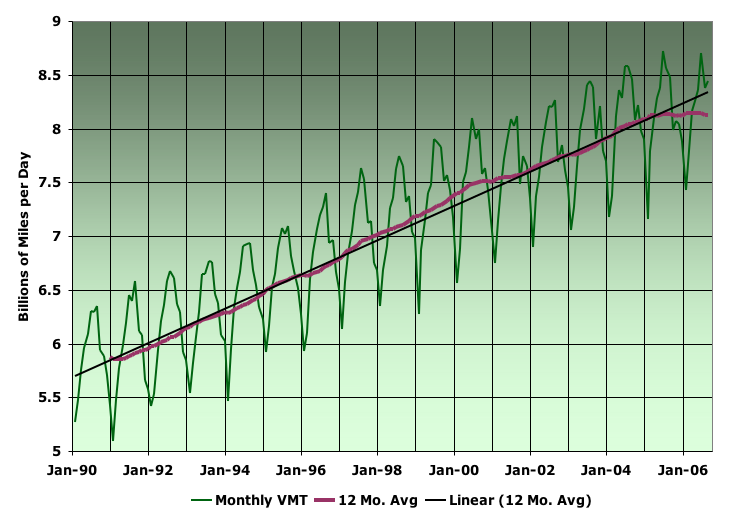
We find that the extra high prices of summer 2006 were enough to cause a slight drop in VMT (against the traditional few percent/year rise and the general flattening of the last couple of years). Looking at the same thing a different way, the following graph shows a longer history of monthly VMT data together with a 12 month trailing average (which erases the seasonal signal), and a linear fit to the latter.
As you can see, US VMT generally rises fairly relentlessly, but the high prices of the last couple of years have been enough to stem the tide, and indeed now cause it to just begin to drop slightly (though it might flutter up again now that prices have eased somewhat).
Last time I discussed this, I developed a method for estimating the fuel economy of the deployed US vehicle fleet (basically by dividing monthly gasoline consumption in the US by monthly VMT with an approximate correction for diesel powered miles). An update on that picture looks as follows:
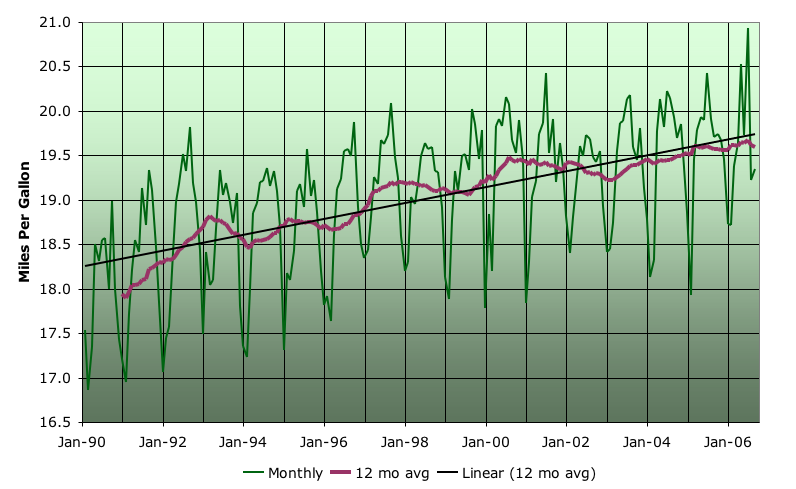
In general, the recent price rise has not caused anything noticeable to happen to the long-term very slow rise in fuel economy. Transportation adaptation to recent high oil prices appears to have come overwhelmingly from curtailment of VMT growth (so far).
Contact
- Content: editors at theoildrum dot com
- Tech support: support at theoildrum dot com
License

This work is licensed under a Creative Commons Attribution-Share Alike 3.0 United States License.
These posts are a lot of work, and the authors appreciate your helping them get more readers for their work however you can. These are charts that many people can understand...send them along to whoever you think can be persuaded by data...
So, is there a time delay effect? Is it possible that current fuel prices will actually impact demand, but it will take time for levels of personal debt to increase to unbearable levels first? Personally, I think not, fuel costs are still nothing compared to vehicle costs, and once people have that sunk cost...
I'm starting to think that a larger war in the ME is more likely to trigger a crisis. Oil supply is just too tight and the whole world knows it, including the people that find GWB to be the threat.
What a mess
16 years ago I bought a 800 watt microwave for $118.00. 4 years ago I bought another one for $29.95.
$29.95- builds it, ships it across the ocean, puts it on a truck, delivers it to the store, puts it on the shelf, pays the wages of the people who work there, thier light bill, heat bill, property taxes etc., How much did the people who built the damn thing get ($.75 HR?).
We can afford higher fuel prices in relation to wages because of this. For how long...?
It takes time for people to buy new cars. Any reasonable oil price doesn't cause people to junk their cars for new ones, it just causes them to consider it more carefully next time they buy a car. If the average car is on the streets 5 years, then you'd expect this whole cycle to flip over in about 5 years, but wait, it's worse than that. First there has to be demand (a year of high gas prices, with no end in sight convinces consumers that they need a more efficient car), then there needs to be redesign, and retooling, and if things keep up, in 3-4 years, new efficient cars are being produced in large numbers. So, all told, I think it takes around 10 years, give or take, and the price has to stay consistently high for all or most of that time. If that were to happen, then VMT would start to fall and efficiency would start to rapidly climb.
Also, GM and Ford would start to rapidly enter chapter 11, as their executives are hell bent on producing gas guzzlers even if it kills them, which it of course has indeed been doing.
US suburbia will see boarded up homes in the coming recession/depression IMHO.
Best Hopes for a better Urban Form,
Alan
Its relentless. How could it be otherwise?
Could it be otherwise? Oh Please. Which scenario did you want? I just spent all night running alternate Hubbert numbers.
I'm afraid not, Nate.
This goes back to a classic conversation that happened with "Old Mossy."
Can the sum be greater than the parts?
Not in this case.
Demand can never be higher than production when every order is filled every day.
Sorry. What are we celebrating?
Even Tertzakian, who avoids the words "peak oil" expects a "break point" as reservoir depletion overrides discovery and produciton.
How could it be otherwise?
Even as a bit of a VMT skeptic (not that confident in the measure) I think this is positive news. The graph shows us what we want to see - a deflection from past patterns in response to new conditions.
We wouldn't want a "trajectory" to stubbornly continue as prices rise past the production peak. We'd want to see responses.
FWIW, I think a similar graph of finished gasoline consumption (and diesel) would be nice. If gasoline consumption does not deflect (from its past increase) at all, something is wrong with the VMT data.
http://tonto.eia.doe.gov/oog/info/twip/twip_gasoline.html
http://tonto.eia.doe.gov/oog/info/twip/twip_distillate.html
One cautionary note is that we have just gone through the transition to ULSD, so the diesel numbers are kind of wacky for the past 6 months or so.
If you download the whole xls, you get consumption data going back many years and even decades (depends on the category of data, and when they started to collect it).
If we look at gasoline:
you don't see much drop in gas consumption over 2005, but in 2005 we had Katrina, so I would almost want to see curves for 2003 and 2004 as well to see how this year compares to more "normal" years.
Unfortunately it shows something the other doesn't, a new high in 2006. Oh well, count our blessings I guess ... and wait to see what next summer's prices bring.
Perhaps some drivers actually did conserve gas and some decided to take the plane instead of driving cross country. Also note that most transit systems, especially rail, are seeing 5 to 15% increases in ridership. So, perhaps some drivers on the lower income scale have switched to transit for their commute to work. Amtrak has also seen ridership & revenue increases on its short corridor ((350 mi or less) trains.
I doubt that gas demand and vehicle miles travelled will decline much until the price is $5/gal or the US economy hits the brakes/growth declines. With higher prices some drivers switch to higher milage vehicle, unless they are out of work and cannot afford a newer higher mile per gallon car. Bad effect of a recession caused by high gas prices is the lower income drivers often lose their jobs and thus do not have the ability to trim their gas bill by getting into a higher mpg vehicle.
If we enter a recession next in year or two oil prices may not fall like in past recessions, unless we drag down China, India, & oil exporting countries with us. If the export market for oil has declining supply, as many on TOD have predicted, the world will see oil prices slowly rise even with demand declines induced by recession.
The pattern in pricing that todays writer has documented, reminds me of the OSB - oriented strand board - price pattern, (it is a cheap alternative to plywood). I saw a similar pattern...that lasted several years. So I jumped on it. I bought a truck load way in advance to when I needed it. I was going to save Thousands!..so I thought. I even had dreams of buying a warehouse full the next year!
You guessed it...I bought at the PEAK! In March of 2005. The price plummeted for months after that...and only came back after hurricane Katrina.
Bottom line: If Patterns held, we'd all be rich.
I know they drive more than Americans, due (I guess) to further distances. Given that Vermont and Wyoming are highest VMT in USA (per your post last summer), and they had sharpest drop post Katrina, I bet there is a correlation.
Then again, there is (like in everything) a differnce between needs and wants. Perhaps Canadians just need to drive more (to get to work and grocery store, etc)
In both countries it appears that higher prices are having an effect on demand, when the problematic is examined from the perspective of registered vehicles.
Transport truck mileage is a separate issue.
I use data from the Bureau of Transportation Statistics and from Statistics Canada.
In 1990 the US population was 246 million. Now its 300 - thats total growth of 21%
In 1990, according to Stuarts graph (roughly)VMT was 5.5 and now is about 8.4 so an increase of 47%
So over 15 years VMT has grown more than double than population. However, on an annual basis they are both in the 1%+ range, so population does explain a good deal of the phenomemon.
Looking at passenger vehicles only, total mileage increased by 37% from 1990 to 2004. The number of registered vehicles increased by nearly 29%. The difference is accounted for by an increase in miles per registered vehicle in that period. The increase in miles per registered vehicle was continual from 1980 to 2001 and then declined in 2003 and 2004. We await data for 2005. It does appear that price is impacting mileage, though only slightly as yet.
Data is available from the Bureau of Transportation Statistics, though I used numbers from the Federal Motor Carrier Safety Administration above.
There is indeed a leveling off going on. I took the annual VMT totals for the USA and divided them by the total number of residents in the country at that same point in time.
Note the last (slight) decline around the time of the Gulf War. Otherwise growth has been steady for the last quarter century as we have collectively moved to increasingly less dense living patterns.
I know in Vermont, prices went from $2.20 to $3.60 and people were freaking out. But then they went back down to $2.80 and it seemed everything was ok. People were breathing easy and didnt seem to realize that prices were still up 25% from 2 months earlier.
Would be an interseting policy trick to put a $2 gasoline tax then fake some controversy and have some politicians take credit for reducing it to only $1, etc. Gradual steps like this - 2 steps forward, 1 step back, giving the consumer perceived plateaus of relative cheapness.
1970- 2.80%
1981- 4.60% (all time high)
1990- 2.40%
1999- 1.75% (all time low)
2002- 1.85%
2004- 2.25%
2006- 3.50%
The rise from the low has been sharp, but so far the impact on consumption is relatively muted as it has come from very low levels and is still well below the highs of the 80's.
I do have a nice chart but I still can't figure out how to upload them here. Any help..please?
First you need to create an image file of your graph on your computer. If you're using Excel, select the outer background of the graph to pick up the whole thing. Copy it to the clipboard, then switch to something like MS Paint to paste and save. Use a file format like jpg to cut down on size.
Next, go online to somewhere like [imageshack.us] and upload the image there. They'll give you the appropriate <img ...> tag format to insert into the text of your comment. To make sure you image fit's in the page, specify the width="100%" parameter inside your img tag.
So your image reference in your comment will look something like this:
<img src="http://imageshack.us/some/file.jpg" width="100%" />
Here's an example I prepared earlier ;-)
Hope this helps.
[IMG]http://img247.imageshack.us/img247/6967/fuelpz0.gif[/IMG]
Try
<img src="http://img247.imageshack.us/img247/6967/fuelpz0.gif">
AHA!!!
Thks very much indeed
Aha is right. We will play with you bitches.. Cuz that's all you are.
Sorry.
Like Paris and Nicole say...
WE LOVE YOU - BITCHES!
Rock 'n' Roll...
He's been doing this all night!
Im writing a post on this now for next week called "Peak Oil, Global Trade, and Liebigs Law"
Brian,
Don't you understand, this is how you make money:
- Take control of a large corporation.
- Pay yourself, senior management, and board members obscene salary's and give outrageous perks like company limo's, birthday parties in Italy, company apartments, etc...
- Cut Costs (usually staff)
- Offer big ticket items for cheap to attract large numbers of customers, and make year over year numbers look good. (Sales $$$, number of customers, etc...)
- Short change corporate pension obligations to make the accounting appear that you are making a profit.
- Borrow as much money as possible through the financial markets insuring you have the cash to continue operations at a loss for years while paying yourself and other board members the above mentioned outrageous salaries.
6a. Repeat as often as posible.7. When the Ponzi scheme finally collapses, put the company in receivership, and walk away with millions (billions?) that you recieved as lawful compensation not to mention your fully insured golden parachute.
Wall Street has sold it's sole to the corporations at the expense of the little guys. If you're investing in Stock - caveat emptor.
Yeah, I'd say this is about right. Perhaps exhibit A should be Carly. She put one of the hottest tech shops in the world in to Chapter 11, got a promotion to another silicon valley empire (HP), killed off most of their tech, sold the rest, sent the company hurtling towards insolvency and irrelevance, got booted, and walked away with $2 billion. What did wall street think of this? They though the company without her as CEO (the next day) was worth $8 billion more than the company with her as CEO.
I wish I could get that job, I can send a company to Chapter 11 for half the cost, or less.
It's not so much wall street, they usually have a decent idea of the truth. It's more the guys serving on the board of directors. It's the same 20 people serving on all the boards, electing each other to other board positions and executive positions, etc...
Seriously, wasn't there a time when serving on a board was a, how do you say it, job? Now it's just a frat, or a raiding party.
Notice that most people will have made their housing location / automobile purchase decisions in the 2% to 3% range. This is of disposable income, too, not gross or even net income. In the spirit of "history rhymes", this puts us mid 70s, but with the early 70's housing mini-crash happening now with a potentially much larger crash. It makes me think we're headed for a bit more "stag" this time with less "flation."
Also, it only took prices at 4-4.5% last time to cause havoc. We aren't too far from that now. In that context and with the recent change in the gas elasticity of demand, the small changes in VMT so far make a lot of sense, but we may need to go higher than 4.5% for people to make serious VMT reductions in the short-term.
The data are quarterly in this case so the chart goes up to Sep.2006. May have turned down a bit since then as gas prices fell.
Another fun statistic would be: B) for each person, compute the ratio of fuel expense to disposable income. Then compute the average of this ratio across the population.
Yet another statistic: C) the median of all those ratios, rather than the average.
A) is of course the easy one to figure. Maybe it's useful though to think about how it isn't the most revealing.
Of course, you would have to manouver around political interest groups like the transportation industry by giving them a sweetheart deal, so they "forget" to keep the tax in the media.
When the cell phone industry was bidding on the spectrum for 3rd generation services (UMTS in German), at price levels large enough to help several European government erase budget deficits, an analyst pointed out that this made no business sense, for a simple reason - the users of these anticipated offerings would have to displace somewhere between 1 1/2 to 2 hours of their time to use them. That is, something else in the customer's life would be replaced for an expensive, untested, and non-revolutionary service which would cost a significant amount of money. The analyst couldn't see this happening, which was essentially correct. There wasn't the free time in consumer's lives waiting to be filled with some new service which cost money.
In terms of the U.S. (as compared to a country like China), the VMT limit of how much time is actually available may have been reached, or is at peak - at some point, even with the attraction of an on-board DVD/satellite/Internet connection, the plethora of opportunities to eat in the presence of the car, and the need to drive to keep living a driving lifestyle (payments mean driving, right?), the time runs out.
And at least in terms of the hell that is Northern Virginia, the time spent in a car has certainly increased due to congestion, but the distance travelled hasn't likely gone up as much.
Seeing the plateau is almost frightening, not that it isn't something surprising - Americans as a group seem completely unable to live differently, even when how they live will lead to problems (obesity comes to mind at the personal level, and cities in the desert at a national level).
But in terms of VMT growth, the natural limit may have been reached at some point in the two decades of ex-urban development.
Of course, the increase of fuel consumption in relation to VMT is another subject - driving large SUVs for hours a day certainly led to higher gasoline consumption, and as these vehicles are driven less and then retired from the U.S. vehicle fleet, the decrease in gasoline use should be a noticeable bulge without necessarily being much of a change in how Americans live - an indication of just how much waste was involved over the last two decades of the American Dream.
And I wonder how car pooling, another one of those late 1970s trends, will show up in such statistics - that is, the amount of time spent in the car remains fairly constant, it is just the number of occupants per vehicle that increases.
I think this is a nightmare, but to use fairly typical American shorthand, YMMV.
Short changes in gas consuption are caused by higher prices and/or travel reductions due to economic declines (lower net income, loss of job, businesses cutting travel costs). Vehicle miles traveled may not increase in certain areas of the country due to congestion, but most drivers will put up with much longer travel times before they change lifestyles or supplant the car for transit.
And it is predictive. Boy, is it predictive!
Of course, there are a lot of people who just don't want to live in the city, period. Further, that might vary a bit depending upon the city and the size of the city.
And don't underestimate the fear factor. Lots of people are simply afraid to live in the city.
The country is not focused on these issues because it is spending all of its time thinking about Iraq.
I have always felt that one's quality of life is inversely proportional to miles traveled. But that's just me, unfortunately.
They might just be naming the silver lining to their cloud.
I have had longer drives and did like the fact that I was "fully decompressed" by time I got home (of course that doesn't work if your drive is stop-and-go).
Right now my drive is 8mi, and I like that better (even though the Prius doesn't warm up enough to get really good mpg).
Decompression can also be effectively had on a train or bus seat with out all that aggrivation/hassle of driving. Doesnt require driving.
Best Hopes for a better Urban form,
Alan
But on top of these real events people seem to generate imagined catastrophies to not get their hopes up too high since that leads to dissapointment, which again can be traumatic.
And then, let's not forget that generating "Angst" centering on the end of ones consumption bilge is by far easier than a rational approach to the consumption bilge in the first place. Confessing to be afraid of "The great depression that will follow the SUV" is still easier by far than to fight the SUV phenomenon itself.
But then... that is just what I think. I don't have a car, and I am not afraid to tell everyone that buying an SUV is a bad, bad thing. So persoanlly I am overcompensating by taking my daily dose of "moraline". :-)
But I am quite fond of one of the quotes listed here, something like: "Most people spend more time and energy going around problems than fixing them."
Instead of going around the Peak Oil problem by trying to force humanity in general to revert to an aristocracy plantation society, perhaps we should try to address the root of the problem: energy generation.
Maybe those among us who are experiencing diffuse, pervasive angst are onto something after all, and it's our cold logic that's failing us, by demanding the "proof that comes in the form of a mushroom cloud."
:-)
Sorry... but your broker's opinnions is nothing but "Angts", again. If you take the time to look at the history of technology, you will see that we went through very similar processes before... human labor/steam engine, freight train/diesel engine driven truck, mechanical age/electronic age/communication age, pre-fertilizer agriculture/post-Haber-Bosch-era. Any one of these takes between 20-40 years to fully develop. So be patient.
It is way more effective to think about what is happening in these terms. We are just beginning to see the end of the hydro-carbon and (thanks to AGW) also the carbon age. Hello, renewables culture!
The past as a predictor for the future? If you think it works for you, well, okay. IMO, that's the real problem, not some shallow reading of pop psychology. Let's hear the Grampas out there tell me what it was like the last time there were sixty three hundred million people on Earth. And half of them in just three countries!
It's the condescending tone that gets my goat. How much courage does it take to "stay the course?" Your incremental improvements in efficiency and generation technology are merely a way to extend your denial as long as possible. So be it; the noble white folks will be the last to go anyway.
And that is exactly what I mean when I say "Angst" in the contest of doom scenarios. It is meant as a (not too painful) mockery of unsubstantiated fears of economic breakdown which would require to actually pull up ones sleeves to get out of the worst of it. Something that modern Americans seem to dread really badly.
To me it is obvious that the US has all the necessary tools in place to deal with the issue of peak oil. It is just too convenient to use them. They fear that opening the toolbox could cost either party half a dozen votes. I can already tell that not opening the toolbox will cost both of them millions.
To keep playing with words a bit, how can it be that the world's greatest superpower is such an Angsthase?
And why is it that the country which extols so many virtues, such as hard work, is incapable of actually performing them?
Like a number of other questions, no answers I have found are well founded enough to feel that they are explanations of something at the core of American society.
This is also why I feel America will fracture - it is a wasteful society which has thrown away decades, and one thing you never get back is time.
Bad stuff can and will happen, but it's not something that can be predicted. We need to focus on preparing for potential problems and avoiding them. But just fretting that the end of the world is going to come (which basically sums up all doomer points of view on Peak Oil, bird flu, etc) achieves nothing.
They all realise on some level that if they can stir up people's irrational emotions the people will be more vulnerable to manipulation. Many people love the titilation of terror. Its a lot easier to worry about the Gulf Stream stopping flowing than where the money to pay the Visa bill is going to come from or to fantasise about shooting your neighbors as they try to siphon your gas than why it is you can't get a date.
All the people who actually experienced the Great Depression are now very old. Do the math, but if you were 20 in 1929 you are now 96. This country has more than doubled in population, gone from 25% rural to about 2% rural, changed from a place where very few women worked outside the home except as a maid, waitress or prostitute to one where women produce as much as men. People who make that kind of projection about a new depression are talking through their hats and not from personal experience. We may have hard times, but they aren't going to be comparable to the Great Depression on any real basis. We are going to have to move away from fossil fuel during your adult life, and its not going to be easy. Your favorite person, WestTexas said to Economise, Localise and Produce in order to prepare, and its great advise. Its a kind of conservatism thats real, not the kind touted by the self-proclaimed conservatives-more like what my grandparents and your great-grandparents practiced during the real, no shit Great Depression and it fundementally changed their lives.They were better people for being frugal, paying their debts, helping their neighbors and using local merchants, learning real marketable skills.
Not much I can add, but that won't stop me from trying....
I think it's actually very closely related to a common human drive, that can be summed up (somewhat quizically) as "information wants to be anthropomorphised". It was meant as a joke, but is instructive nonetheless. Information doesn't want anything, it just is. Governments and countries also don't "want" anything, and they cannot meaningfully be though of as people. I know I do an analogy like this from time to time too, but it's important to know that it doesn't really work like that. A beurocrat wants to keep his job, a president wants to get elected, and maybe, just maybe, someone wants to make the world a better place. If a government has wants or needs, then it's suffering from the worst case of multiple-personality disorder anyone has ever faced. Such entities cannot be understood as an analogy to a sane and in any way decent person.
Similarly, data is often perceived with physical analogies. People like to find patterns in data, and it is well known that people often see patterns that simply do not exist. People think data has inertia as well, because the physical world has inertia, humans have psychological inertia, surely nothing changes quickly. This leads to the fundamental problem of fixating on a batch of data (VMT, for instance) and attempting to project it far into the future, so far that such a scenario becomes totally untenable. Then this is used as a basis from which to argue for societal collapse, or something similar. It is essentially a roundabout way of saying that "because nothing is going to changes, we are in for some big upheavals", which just doesn't make any logical sense. It is forgiveable to have a fairly static view of the world, or a fairly dynamic view, but to have a mixture of the two often causes imaginings of mad max style futures.
A mathematitian and an economist both start with a premise, and then logically deduce a conclusion. When the mathematitian comes to an outlandish conclusion, he thereby concludes that his permise was false, whereas the economist concludes that the outlandish is about to happen.
The world runs (to some significant extent) on oil, I think all parties agree on this.
We cannot indefinitely produce enough (fossil) oil to run this system, I think all parties agree on this.
Therefore, what? Well, we won't have a billion people driving dozens of miles to work each day in gasoline powered cars in the year 2100, that logically follows. That society will break down does not. Something will give, probably many somethings, but an upward trend in a graph is not enough to be convincing that society itself will be the thing that collapses.
Historically, adversity has made us better people, hopefully it will again. Perhaps not, nobody really knows the future.
Arbogast, who wrote that? Do you know when? Deflation that severe within six months seems off the deep end unless the Iraq problems escalate really fast or someone attacks Iran. Stuart's VMT charts will get really interesting fast in that case.
A stat I recall hearing recently (sorry, no link) is that when studying DEPRESSION in AMERICANS (of the U.S. variety), the number 1 correlation to being depressed was...
Length of Commute
This is something else. And whatever it is, America seems to be the society most afflicted.
It is arguable in my view whether what we all consider 'America' will survive it.
No mention of peak oil, although ASPO Australia made a written and public submission. Set up to keep the 'punters' happy as prices soared to about AUS$1.50 per litre, but they are now back to about $1.20. Still about 50% higher than they were in 2002, but punters are not so worried- summer, surf and cricket on the agenda.
900 years ago, the city of london was almost wiped off the map by force5 tornado. Too many pundits and media whores don't know their history.
Cruising for a bruising: Gas prices went up; consumption barely went down
Regards
* In the 70s there were gas lines, rationing, and shortages, so the "penalty" was standing in long lines and money. This time around we're merely seeing a gradual fuel price rise (with the exception of localized Katrina effects).
* Many people currently believe that $3 was just a temporary thing, so figure they can just wait out the prices and continue life as "normal." George keeps assuring us that he'll do everything possible to reduce fuel prices and that we shouldn't worry. What was the situation in the 70s? Was the thinking that high prices would be permanent?
* The domestic manufacturers seem to be cranking out the usual low-MPG cars and trucks, but offering rebates (and free gasoline) to entice buyers. In the 70s the "big 3" actually switched product designs to make new vehicles more efficient.
* Speed-limit reduction in 70s.
We now import 60% vrs ?% in the 70's - 30% +/-.
How many more people are there using oil?
Lines and rationing at $.54 a gallon seems surreal. Not many people can relate to it today. I worked at a gas station at the time. The line went all the way down the street. Odd/even (license plate) days, $10.00 limit, "out of gas" sign was used too. In teh early to mid 70's minumum wage was @ $1.60 gas was $.54. Today minimum wage is $6.80 and gas is at $2.58. makes you wonder....
Big difference in cost of living trends, and cost of money, during those two periods.
But I have a question: How are these national figures for vehicle miles travelled determined?
Are they extrapolated from a sampling of DMV data, from DOT roadway usage data, or exactly what?
Obviously, we cannot actually record the month-to-month odometer readings of every single vehicle in the US. So there must be some sort of extrapolation. If that indeed is the case, then the question that naturally follows is: what is the confidence level of these numbers?
I'm not saying the numbers aren't valid; I just want to know whether say 7.8 billion miles one month and 7.9 billion miles the next month is a real increase or just noise.
Build it into the system so you can sell your miles to others for a market driven fee.
For those who are concerned with the big brother aspect of this, how is it different from monitoring cell phone usage, for example.
In any event, as things now stand, this society has zero interest in cutting miles traveled or cutting fuel consumption so it really doesn't matter what actions are proposed to cut same. We will just party on until the music stops.
It always struck me as odd why people would suggest these outrageously complex schemes, until it hit me: they don't understand what a "consumption tax" is and how it differs from an "income tax"! So here is the explanation:
An income tax is a payment to society for general services like roads, schools, defense, law enforcement etc. which allow citizens to generate income.
A consumption tax is a means to (down-)regulate the consumption of certain accepted but toxic substances like alcohol and tobacco.
Same word, two different meanings. Something to think about.
People automaticall resist evident out-of pocket costs like gas taxes, but somehow are prone to accept them when they are made more subtle. That's why for example most people will avoid a $1.00 toll road, even if they would save much more from gas etc. if they made the calculation. Or like drivers going around for miles for a gas station that would save them couple of cents a gallon.
For similar reasons, IMO gas tax can be made acceptable if it is designed to start low and grow slowly over time, allowing for people to adjust behaviour.
A consumption tax levied on a particular product like alcohol, tobacco or gas diminuishes your ability to buy that particular product but does not stop you from buying something else. Thus, it gives you a choice where income taxes do not.
Moreover, explicit laws can be made to regulate the use of a particular consumption tax which make it much more transparent where the money goes. That is a very valuable tool to sell the tax. A general income tax increase will always be harder to implement in countries where the government can not be trusted to be conservative like the US. After all, the US does not have a conservative party any more.
What about the effect of changes in gasoline blending on national fuel consumption? Reformulated gas in Calif supposedly drops mileage by 2-3%. Then adding 10% ethanol should require buying 3.5% more gas to go the same distance.
Anecdotally, many drivers claim car mileage has droppeda full 10% since they switched to 10% ethanol.
From the link you provided, it appears that most of the data comes from periodic traffic sampling. It states that for main arterial routes the sampling should be expected to provide a 90% probability of having an error of less than plus-or-minus 10%. For the lesser roads, it's an 80% probability of having an error of less than plus-or-minus 10%. I think they more or less rely on projections for the rural roads.
This tells me (admittedly without carefully studying the entire document) that we probably can't expect much better than a 10% error in the data collection. While this is probably more than good enough for DOT planning purposes, it might make it a bit questionable whether a less than 10% month-to-month or year-to-year variation in VMT really means that that is the amount that actually occured, particularly when you try to correlate it with other data that also probably has a not insignificant margin of error.
But on the other hand, I suppose we are dealing with multiple sampling sets that are very large, and the errors probably tend to average out, particularly with regard to long-term trends.
Last spring I mounted my trusty HD LowRider and took a trip to Tulsa,OK for a stockholder meeting.
For the first part I travelled state highways, as I am wont to do for the pleasure aspect, but when I came to the far southwest corner of Missouri I then travelled I-44.
Just inside the Oklahoma border I pulled to the side to check something a take a short break. Thats when I started to observe the traffic I had been fighting and attempting to survive ever since I got on I-44.
As I sat there it seemed that every 10 seconds a semi would careen by. Yes each 10-15 seconds in an unending stream as far as the eye could see were semi tractor trailer rigs hell bent down the highway. Looking over at the other lanes across the divider I saw the same scenario.
I was amazed at the numbers that were out there then I realized it was all traffic from the east to west and west to east coasts.
I had spoken to an old retired 18wheeler driver several months ago about 'over the road' driving. He said "Son there is a river of 18 wheelers going from LA to New Jersey that never ever stops and both ways. A huge river."
I realized the truth of his words. I have a CDL and drive grain trucks(semis) during the harvest for my friend who owns them and does a huge farming operation. I decided then and there that I would never ever want to go 'over the road'.
It is bizarre and not only that very dangerous. Riding a bike in this stream can be daunting. You have to either lag way back or use speed to run ahead. You do NOT EVER want to follow a semi for the exploding rubber of a blown tire can take you down. Then you become a permanent part of the pavement as the oncoming traffic crushes you and your bike to the thickness of a standard thin crust pizza.
I further decided that I would henceforth always travel the 'blue highways'(Book by William Least Heat Moon). Travel is so much better and safer back on the older more gentle highways and byways.
My HD will never again ride upon this carnage, and returning from Tulsa that is exactly how I traveled.I recaptured an old section of Route 66 , that I used to hitchhike on way way back. Stayed in an old once thriving motel from that era. Ate in a genuine boxcar diner as well. All this was not visible out on the maddening freeway. I had to get off it to find parts of the old Amurkah that had seemingly vanished.
I put all this tremendous truck traffic down to the stupidity of JIT inventory the absolute ignorance of corporate Ahmurcahs and the pissants who drive us towards that dropoff cliff looming just ahead.
airdale--your life for a few seconds less of travel time
In many aspects US is much more suitable for rail freight than Europe for example - the distances are longer, the cargo loads much larger, and the interstate highways are more costly to maintain - basicly everything is begging the question why we have not go down that road. My guess is that the reasons revolve around the government not willing to build the infrastructure mostly under the influence of the large oil and automotive corporation. Whatever the reasons, now we are trapped in this arrangement and we are starting to pay ever-growing toll for the consequences from it.
What needs to be done is doubling rail tracks, electrifying them and building terminals for servicing local trucking deliveries. There will also need to be a system coordinating deliveries throughout the country. All of this will need coordinated effort and will take no less than 15-20 years IMO.
One example:
They may have the most aggressive improvement program. But others, like UP, are double tracking Los Angeles to El Paso as an example.
One little noted improvement that opens up a bottleneck affecting quite a bit of trans-con traffic is a 9,000+ foot double track bridge outside Kansas City that grade seperated north-south traffic from east-west traffic. Before is was a "stop light" that limited traffic. A group of railroads paid for this improvement.
Best Hopes,
Alan
I see exactly what you describe every day up in NY too - running North and South though.
The never ending stream of NAFTA (Canada) enabled semi-trucks up here are systematically demolishing the interstates in the area - sections of which probably look more like a road from your farm... They are washboarded and have gigantic potholes (more like sinkholes) due to excessive speed (definitely) and weight (probably).
There is only a very minimal effort at enforcing any kind of traffic laws on these roads - that's a battle the cops knew they lost long ago and now they just stay out of the whole mess altogether. In short it's a complete free-for-all. This is why I too avoid them whenever possible.
We visited a cousin in the LA basin whose 3 children and husband all have asthma - and there's no family history of the disease. Do you think she might consider an alternative to the gargantuan air poisoner - a Ford Excursion - that she owns? No way. Here's a perfect example of a consumer who puts her wants ahead of a basic need - for clean air!
Here, for example, is the EPA's take on this topic:
The trucks being referred to are light trucks, including SUVs and pickups. These now make up close to 50% of new passenger vehicle sales in the USA. The exact figure for the first 11 months of 2006 is 52.8%.
EPA has been saying for some time that fleet fuel economy has been flat since the mid-1990's. This has come about despite improvements in engine technology because of Americans' growing infatuation with with more powerful engines and with light trucks, which are heavier than cars.
When driven for about 16,000 miles, an average car saves about 2 tonnes of greenhouse gas emissions compared to an average light truck or SUV. It costs 42% more for fuel to drive the same distance in an average light truck than in an average car. There is an even greater saving in driving a small, fuel-efficient car.
and Table 4.18 gives
It's not obvious why this is in disagreement with the EPA's graph (but again, neither are trying to measure deployed fleet fuel economy).
The EPA uses estimates that are way too high. People don't actually drive like the EPA "drives," and car companies sometimes optimize specifically for the EPA. The difference between the two graphs can be completely explained by this.
In the 80's, consumers complained loudly enough that the numbers on new-car window stickers were adjusted: the city number is 10% lower than the EPA city estimate and the highway number is 22% lower than the EPA highway estimate.
The 25 MPG figure in the EPA chart could correspond to a car that benchmarked roughly 20 & 30 MPG. However, with a reduction of 10% and 22% the real-world figures would be 20*0.90 = 18 & 30*0.78 = 23 MPG for a grand total of something around 20 MPG. Nearly spot on with respect to the other chart.
Also, the car companies probably use the best-mileage gasoline they legally can use during the tests. Consumers, however, are often stuck with some ethanol in their gasoline or, much worse, California RFG II fuel.
your MPG
which I did based on data in the transportation energy data book. However, yours, although the same shape, is a couple of mpg lower - where did you get it?
At any rate, these aren't measuring the same thing. The EPA graph is the sales weighted average of their estimate of new car fuel economy based on their testing of cars. My graph in the body of my story is attempting to measure the actual achieved fuel economy of all the cars on the road at a given time. The two could be different for several reasons:
However, maybe there are other explanations too...
You're right in noting that these figures are based on model year, (except for some of EPA's data points, which represent 3-yr moving averages). However, the telling note is that fleet fuel economy (by model year) hasn't varied by more than about 1 mpg since 1982. I've lost my reference but seem to recall that the typical vehicle's life is around 20 years. However, the mean fleet age is skewed towards newer model years because the number of registered vehicles has been increasing.
Fuel economy and performance in emissions tests are linked. Manufacturers now have to guarantee the performance of emissions systems for 100,000 miles/ 10 years. As you say, the fuel economy of older vehicles does drop off, though not as quickly for modern engine management systems as it did for the older, pre-engine management system models.
I realize this is not quite the peak oil image, but there is some reality-based limit here.
I do seem to recall seeing notes from some of my stock reports implying that freight railroads are doing rather well these days.
One alteration that might have some effect is to discourage tax policies that encourage businesses to pile up in a center city, rather than dispersing. I am reminded of the inverse. One of the places I once worked did not allow you to have a parking place if you lived close in to the city (iirc Cambridge, and close in was the immediate suburbs), 'to encourage the use of public transport'. The policy became a major incentive to move out into the farther suburbs.