Plateau update
Posted by Stuart Staniford on December 6, 2006 - 11:52am
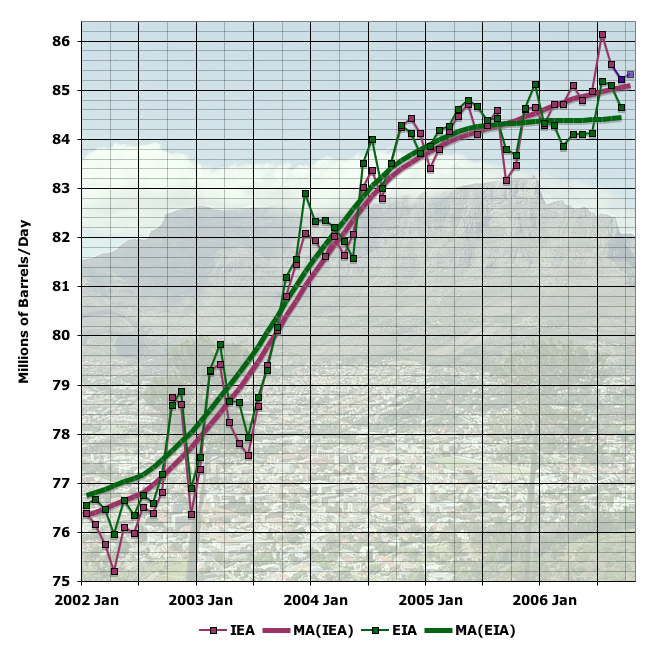
At any rate, there's little doubt that the record month is now July 2006.
Expressed as growth rates, the difference between the two agencies is about half a percentage point. This next graph shows the year on year growth in the two moving average lines above (which themselves are thirteen month centered moving averages recursed once).
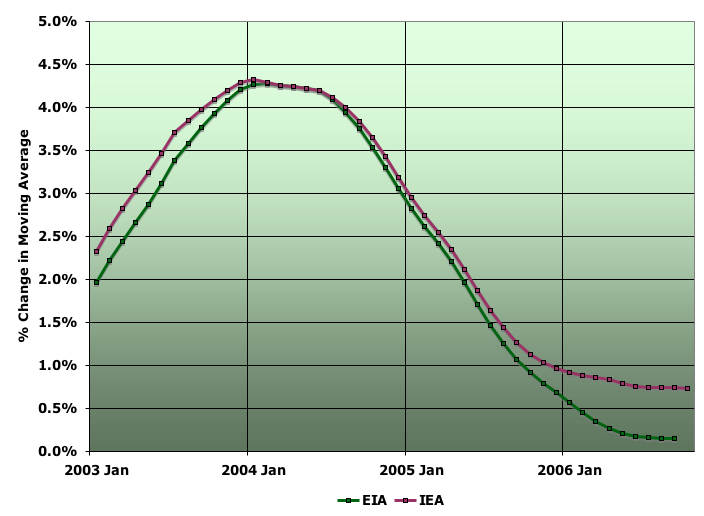
As you can see, the EIA is seeing annual growth of 0.1% - essentially zero - while the IEA is seeing growth at around 0.7% annually. There are two points worth noting about this situation.
Firstly, if it were to continue, even the IEA's growth rate is very low by historical standards. This next graph shows growth rates in production for various data sources. The growth rate here is the average growth over the decade prior to the year in question (for the mathematically oriented, it's (P(n)/P(n-10))^0.1 - 1 ).
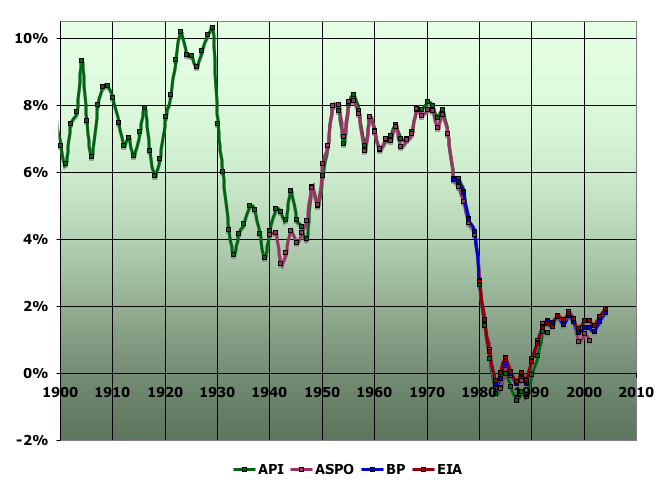
As you can see, in the heyday of world (and US) economic growth in the 1950s and 1960s, annual growth in oil usage ran around 7-8%. Then, following the 1970 peak in US oil production, came the 1970s oil shocks in which oil usage actually contracted. In the last couple of decades, economic growth has been slower, but steadier, and oil usage has been growing at around 1.5% a year. For reasons that aren't clear, both economic and oil usage growth tends to come in "eras" of relatively constant growth marked by sharp "paradigm shifts" between them.
So, if we are now in for an era of sustained zero or sub 1% growth in global production, that would be a new thing, and require more conservation on an ongoing basis. In particular, with growth in consumption in oil exporting countries and high growth Asian economies, it's likely US and European oil usage would need to contract slightly even if there is slight growth in overall production (a point discussed at greater length here.
The other point, is that there's not likely to be too much "sustained" about growth when a huge fraction of production is coming from the Middle East, where the wheels seem to be coming off the truck. Hard to say whether a crisis will come this year, next year, or later, but the odds of, say, a decade of steady Middle Eastern oil production uninterrupted by major shocks seem discouraging at this point. For example, see Andrew Sullivan on the possibility of a major Shiite-Sunni regional war. Such a war would utterly transform the world economy in very short order and in a very brutal manner.
Let me put up two other graphs of interest. The first is OPEC, which in November allegedly cut production. We'll have to await November/December statistics to see if that creates a noticeable step in the production history. However, here's the data available at present (which goes through September or October depending on source) and shows OPEC production already declining ahead of the planned cut).
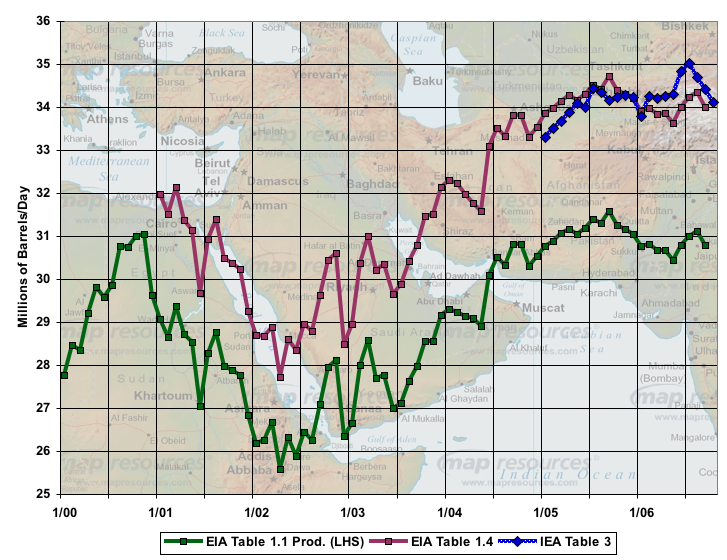
Finally, during 2001-2004, when global production increased healthily, the bulk of that increase came from Saudi Arabia and Russia. With Saudi production declining, at least for the last year, Russia becomes of particular interest. Here's the latest picture:
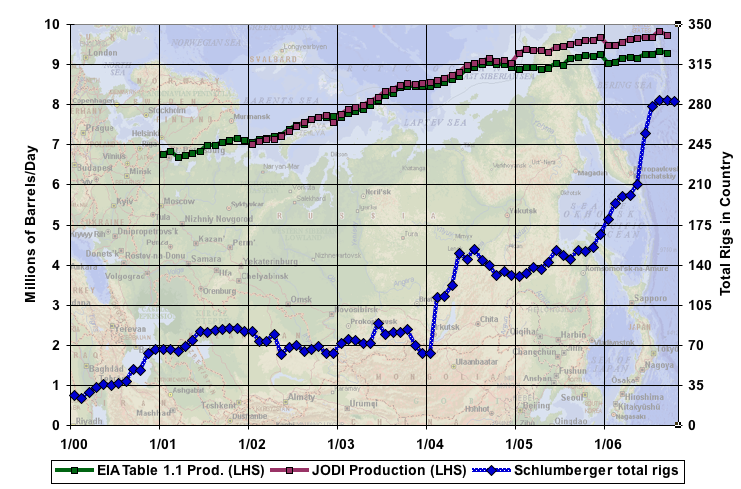
As you can see, the Russian revival has not peaked out yet, though it has slowed to only around 1/2 mbpd in additional production each year over the last two years (about half the pace of production increases in the early part of the decade).
Again, see here, for more background on these plateau posts if you haven't been following them.
Contact
- Content: editors at theoildrum dot com
- Tech support: support at theoildrum dot com
License

This work is licensed under a Creative Commons Attribution-Share Alike 3.0 United States License.
These posts are a lot of work, and the authors appreciate your helping them get more readers for their work however you can.
Also, most people are lazy and don't mind clicking to vote for the article, but don't want to spend the time to create the summary.
I actually think the part of world production you didn't separate out is pretty telling. If you look at global supply ex-former USSR, ex-OPEC, it rose steeply till 1997, and then stopped dead. Still within 1% today of where it was 10 years ago. There just isn't any new source of growth out there on earth.
But in Yergin's case, you would be wrong. Unless he speaks with forked tongue.
Cognitive Dissonance. I predict that the more in error Yergin's predictions turn out to be, the more vigorous his attacks on Peak Oil will probably become, ditto for Michael Lynch, Peter Huber, et al.
As I said the other day, "Who are the true cultists?"
Those who believe that a physical world has physical limits, or those like Peter Huber, who believe that we can essentially increase our rate of consumption forever?
He never said there would be oil for all.
Only for those who truly believe.
You are not a true believer.
No oil for you.
Go ahead and cry Texas boy.
No oil for you.
Boo hoo.
Oil only for those who truly believe in the Power of the Invisible Hand, blessed be its name and praise onto our magnificent priests, Yergin ala Huber. For the true believers, the oils will flow forever and beyond. Over hill. Over dale. Over plateaus that never fail. As the barrels go rolling along.
Still the peak in CO + NGL is probably local; barring world economic recession we'll see major production hikes in the South Atlantic offshore (probably only in 2009) that will adjourn the final peak to circa 2012.
Apart from politics and economic cycles, only a production collapse in KSA or Russia (or a simultaneous mild decline) might make 2005 the final peak epoch.
My prediction for 2007 is confirmed permanent production declines for both KSA and Russia.
Or at least that one of our predictions will be wrong.
Tony
"Just a clarification, here. Biofuels are only potentially renewable."
How true, and only patially renewable. If you count out the imput of natural gas (or coal or bitumen from tar sand, never mind CO2 as nat gas gets too expensive) I have never considered the major bio fuels (ethanol, bio-Diesel) as 'renewable" in the old sense of that word. They are more in the nature of a "fuel switching operation" than a renewable energy program.
The only added "renewable" energy in the bio fuels is the sun that shines on the crop, then has to be converted to bio-mass, which then has to be dehydrated and processed, and then carried to the sale point.....well, you get my point I hope...why not use the sun directly, burn the natural gas in the vehicle, or better yet, work to direct conversion of water to hydrogen by solar...ohh, that's right, it can't be done because it is not efficient enough, somehow it gets efficient when you add a half dozen extra conversion steps, and thousands of pounds of waste matter and CO2 per potential gallon in a centralized plant, so all the raw material and all the waste now and all the final product has to be shipped about....
Never mind. As Virginia Woolf once said, "It's like talking with your face pressed a closed door."
Roger Conner known to you as ThatsItImout
The only reason they appear efficient is because we chuck in a bunch of fossil fuels hidden as part of the process.
If fossil fuel is removed from the equation then logically, due to laws of conservation of energy the most efficient method should be the most direct.
No energy is "renewable".
The sun's fusion output rolls in.
It pauses for a moment here on Earth.
Then it radiates out into space.
Gone forever.
Renewability is a fairy tale.
One way flow is reality.
It has a funny other name: "entropy".
This distinction is made by calling the former power source renewable. No one who uses the term is under any delusion that the sun contravenes the conservation of energy.
Which is the least grown up, to use a common term with a well understood meaning even if not technically precise or to quibble over irrelevant linguistic distinctions that confuse no one?
We use words to define the map, they never truly fully represent that to which we assign them. It is simply common consensus that allows us to agree upon a definition. I believe I used it correctly.
Take a look at Wikipedia:
http://en.wikipedia.org/wiki/Renewable_energy
This is a poor definition. Energy is never "replenished", this is confusing energy and the potential energy inherent in matter. e.g. filling a tank with gasoline does not "replenish" the energy in the tank, but it does provide a liquid which can be involved in an exothermic reaction from which some energy can do things we find useful. Likewise, solar energy is never "replenished", it is simply a continuous source.
Contrast the problematic definition of renewable energy with
http://en.wikipedia.org/wiki/Energy_source
This is a good definition, at least from the point of view of humans.
Having said all the above, it is mostly useless because most people who use the term "renewable energy" understand these distinctions, and we can wave away the whole issue by simply defining the term to mean the right thing. Trying to promote the adoption of a more accurate term is not likely to work - see, for example, "hydro" to mean electricity when in fact it means water (see, e.g. Ontario Hydro, Manitoba Hydro, BC Hydro - all of which are or were electric utilities) or "America" to mean the United States of America.
Please.
Linguistics is vitally important.
One word in place of another does make a difference.
So if we, as supposedly scientific TODder's keep reinforcing the false concept of a "renewable" energy source, what chance does the lay public have to finally come to grasp with the truth of the situation? Suppose they vote to kill R&D in fusion because they believe "we" are instead developing "renewable" energy sources? Makes perfect sense in their mind. Renewable means renewable, doesn't it?
We need to be careful about what false delusions we unwittingly ingrain into the minds of the lay voters. It is their vote that counts, not ours.
With the exception of nuclear and geothermal, every other energy source we talk about here is a solar sourced one.
Wind is solar sourced.
Hydroelectric is solar sourced.
PV is solar sourced.
Oil is solar sourced.
Even "coal" (a.k.a. non-hydrogenated carbon) is solar sourced in the sense that the oxygen used to combust coal is a byproduct of photosynthesis.
Something I was thinking about in regard to KURT COBB's latest post regarding Copernicus, Darwin and .. Autistic Economics
I was less than thrilled with the concept of an "Un-Autisitc Economics" (an oxymoron IMO --no, it's dyslexia when you transpose your letters :-) ).
So I posted the following, linguistically directed comment:
Renewable is a word used to describe those sources of energy for which the amount we may use tomorrow and in the years ahead is not reduced by a significant degree by using that energy source today in the amounts that it is practical to use them and over the future time spans over which it is sensible to plan human activities.
The amount of solar, wind, wave and tide energy that we could practicably use today will not noticeably affect how much we can use tomorrow or over the next 200 years and thus fits within that definition. Oil clearly does not.
Talking about oil as being solar derived may be pedantically true but is likely to cause unwise choices by those of the general public who have not considered the problems and are only too ready to accept ideas that will avoid having to change immediately.
Talking about photovoltaic and wind energy as renewable may be untrue in the strictest pedantic sense but the difference is not going to cause any false decisions.
Fusion energy, if it proves practical, sits on the edge of being renewable by this definition. We cannot noticeably deplete the planet's deuterium by any reasonable future use.
Lithium is rarer but there are thousands of years worth of it that can be extracted using only a small fraction of the energy it will produce. Beryllium, used as a neutron multiplier in the blanket may be a problem in the long term with very heavy use.
The question of whether we can drop nuclear fusion research
because we are developing photovoltaic and wind energy does not rest on whether they are truly renewable or not but whether we can develop them in sufficient quantities and
in the right places and for an acceptable price and overcome such problems as intermittency.
Renewable energy is useful concept and is usually construed
correctly by the public in ways that are meaningful to choices about energy sources
You are assuming that the only time we will "truly" need fusion is when the sun finally runs out of fuel and implodes.
Not true.
What if we have extreme climate change and perpetual clouds ... meaning no sunlight gets to the surface?
Do you ever listen to politicians talking about that there "energy" stuff? Many of them are totally clueless. And they are the ones who cast the important votes --like whether to fund basic R&D or not.
Where do you get this idea from? In fact I support fusion research but the quite the silliest reason for doing so and the silliest reason not to install photovoltaic systems would will be that we might get perpetual cloud cover. If that happens agriculture will collapse and we are dead.
In fact the two do not complete on the medium term. Even the proponents at ITER do not see the first prototype commercial fusion power reactor delivering power for 50 years even with their fast track programme.
It will almost certainly be at least 70 years before fusion has developed to become a major part of the worlds energy supply. Build up cannot be much faster than this because of limitations in tritium supply. Deuterium/tritium fusion reactors use over 55kg per year per GW thermal. Reactors will be designed to breed their own tritium from lithium but will not produce much more than their own needs and the magnitude of the spare tritium will limit the rate of growth of new reactors.
Most of the world`s present supply of tritium is from the CANDU reactor which will have accumulated just 27kG for ITER from now to start-up in 2027.
2076 is well past the point at which all but the most starry eyed optimists think the oil production will have suffered major decline.
It is a major topic of this forum as to how we get over the intervening period. Wind and other renewables will be installed at increasing rates and economy and efficiency will be forced on us. Nuclear fission will see a revival and although they should not be used, filthy tar sand and shale will be used. Coal will be used in horrifying amounts with very little of the CO2 sequestered. Will this see us through? A range of opinions have been expressed here, Will renewables be cost competitive with fusion when it is available? Very difficult to judge at this point. Will fusion be practical even then? Far from certain. Will advanced technology and the budget surpluses to support it survive till then? There are many that doubt it.
However the prospect of generating multi-gigawatt power from one compact site near where the power is needed with fuel available for thousands of years from friendly areas and generating no CO2 in actual running, zero chance of a nuclear explosion and limited short lived radioactive waste is a prize so tempting that even at fairly long odds it is worth the price of research and development costs.
Oh and yes, the sun will swell up as a red giant and engulf this planet before finally settling down. It won't implode.
One could also build more CANDUs (perhaps using burned fuel from LWRs) and produce more tritium that way.
Best Hoeps for fusion,
Alan
According to this source nuclear weapons use about 4g each and it has been suggested that the latest designs do no use any. This makes it unlikely that military tritium production is much more than a kilogram per year.
10's of kilograms of tritium will be needed for each new start up and the only practical commercial way of getting to grow the number of reactors to substantial numbers is from existing reactors. If the tritium breeding blanket produces only 10% to 15% more than it needs for self sufficiency it will take 2 to 3 years to fund a new start up. Given a few months commissioning from delivery of the initial charge to full power, the doubling time will be 3 years or more. This means it will take about 20 years to go from 1 reactor to 100.
Total U.S. tritium production since 1955 has been approximately 225 kilograms, an estimated 150 kilograms of which have decayed into helium-3, leaving a current inventory of approximately 75 kilograms of tritium.
This was almost a half-life ago (12.3 years), so 37 kg or so left today.
Inserting Li6 into existing nuclear reactors for neutron bombardment seems the easiest/best way to produce tritium in quantity. Perhaps, slip one zirconium covered rod of Li6 into a fuel bundle and adjust the control rods slightly (or use slightly more enriched U in the other fuel rods).
IF fusion reactors are seen as our salvation, and tritium is the bottleneck for "more", then "ways will be found".
Best Hopes for Fusion,
Alan
Yes US military tritium production was about 7 or 8 kg per year up to 1988 when they closed down the last of the dedicated reactors but I suspect it it is now about the 1kg/year mark I suggested. It was produced at a staggering cost.
World production of uranium in 2004 was about 40,000 tonnes. Of this 0.7% or 280 tonnes was U235. Enrichment usually leaves about 0.2% of the U235 in the depleted uranium so only 200 tonnes a year of U235 finish up as reactor fuel
The fission of one atom of U235 produces an average of about 2.4 neutrons. To maintain the reaction an average of one of these must cause a new fission event. The others being lost or absorbed naturally or by control rods.
Commercial reactors are built to a fairly tight neutron budget and although there are some spare neutrons that could be released by pulling the control rods out further it is unlikely that, in such reactors, more than 10% of the neutrons could be diverted to tritium production without problems.
This leaves an average of about a quarter of a neutron per fission event or four fission events to produce one spare neutron which can produce one tritium atom. Four uranium 235 atoms weigh 940 atomic mass units and one tritium atom weighs 3 atomic mass units. Thus 313 tonnes of uranium 235 produce 1 tonne of tritium and the world's 40,000 tonne per year production of uranium could ideally produce 630kg of tritium per year if every reactor in the world were switched to maximum tritium production.
At 20kg initial charge for a 2GW(thermal) 1GW(electrical) that is a absolute maximum of 32 reactor start-ups per year if we rely on fission generated tritium. To put this in perspective china is at present installing an equivalent to 50 1GW(electrical) coal fired power station a year
This analysis ignores all sorts of factors that would reduce even that yield much further such as that much of it would decay and leak away in the reactor and the sheer improbability of converting every fission reactor in the world to tritium production.
As to the blind faith "ways will be found", I doubt you would be able to show your face on this forum if you said it about oil.
Tritium is a major bottleneck in the future widespread use of fusion and is widely recognised to be so.
I will not live to see the widespread use of fusion energy but I may, and hope to, see enough to know it will become so after my death.
However, if fission reactor produced tritium were able to seed 10 (not 32) 1 GW fusion reactors/year and each one of these went on to seed another within a decade (relatively conservative #s) AND some tritium reactors were built optimised for tritium production, then we could scale up to fusion power as the dominant energy source within a generation or so.
Tritium from commercial reactors would provide a larger base to start the exponential growth from.
And then there is the possibility of accelerator production of tritium.
Given the other many constraints on fusion reactor build out, even an unlimited source of tritium would result in a generation to "build out". Likley tritium is the "critical path" constraint, but far from the only one.
Best Hopes,
Alan
I think your "not reduced by a significant degree" is meant to make it possible to include geothermal as well, am I right? It's an interesting definition, but the point remains that it doesn't match the normal meaning of the word "renewable". Further, it doesn't match definitions you will typically find, which do focus on the word renewable.
You may understand the real meaning of the phrase, but that doesn't mean others will. Thus, it's a bad phrase, just as "hydro" is a stupid thing to call electricity (whether from hydroelectric sources or not).
An invisible being called God created all this beauty around us with the force of His intelligent Design and then, as he the infinitely powerful one, grew tired, He "rested" on the 7th day and decided to keep his microscope focused on the comings and goings of each of us little microbes as we brayed and prayed to him. And He spent the rest of his time doing nothing but answering our prayers, bringing into being the essence of each wish we make upon a star. Hope is forever renewable. Life is not a spiral. It's a circle, an unbroken hoop that forever renews itself. Ah, to sing again, with all the colors of the wind.
I often picture the Sun as a mighty river of energy flowing past us, and our 3rd little rock here in the river as intercepting the flow for, oh just a brief moment before it leaves our grasp forever.

Yes, indeed. See for instance the production of hydrogen: While it has the potential to be a clean fuel currently is is produced from NG, producing quite some CO2.
"All liquids" is a scam. It's basically double counting!
Clearly, analysts should focus on C + C to get a truer picture of what's going on.
Clearly, analysts should focus on C + C to get a truer picture of what's going on.
I wrote some on this, and thought a lot about it as I was writing my response to Westexas. The really relevant metric would be net total liquids. Not sure if anyone has used this term (its a bit of an oxymoron), but it would capture what is truly relevant. C + C ignores some legitimate contributions toward liquid fuels, and total liquids does do some double-counting. A net total liquids would take total liquids and subtract out any liquid inputs that went into making the finished product.
Now THAT would be a meaningful measure...
All these liquids are in crude form, but what is the conversion rate to gasoline, heating oil etc. Is it similar for all liquids or are some better than others.
What really needs to be measured is: End energy usage from liquids rather than raw quantities. This will tell us more accurately when we are reaching an economic peak rather than crude peak. It is the economic peak that is most important for our everyday lives.
Second - on a more serious technical / terminlogy point - I see your chart as demand, not supply. I have this simple notion that:
Pre peak: production = demand
Post peak: production = supply
± adjustments for stock draws
Would you care to comment?
And a note for investors - there was a correlation between price and demand 2000 to 2006 before the drop (I've not checked this recently) - so increasing demand might be good for oil prices
Below are the EIA last numbers by fuel category:
And we all do remember that this decline corresponded to the highest nominal oil prices in history?
Notice that, as is routine, gmxr recovered to pass ard. btw, gmxr scores 161 at shortsqueeze.com, ard 100, hp 0.
NGLs are in my opinion an integral part of a petroleum system. Oil associated gas wil normally be "wet" and contain a fair amount of NGL. Similarly, "dry gas" fields being developed today tend to have a substantial NGL component, and that is liable to grow going forward - that is if gas production manages to rise in the future.
The "other liquids" I guess I don't understand so well - syn crude, coal liquids, ethanol and refinery gains?
So in terms of peak oil I would pin my colours to crude+condensate+NGL
- and whichever way of measuring this that shows a peak post Dec 05:)
Anyway - Stuart's IEA trend seems to be heading up - so I'd guess that any equivocation will dissappear going forward - barring disasters.
PS - Stuart I'm a bit colour blind and really struggle with the blue and orange symbols used on your chart
He said he was color blind :)
Color blindness is actually a lot more common than people think.
I asked this guy, What about traffic lights? Turns out red is always on the bottom, yellow between, green on top, something like that, no need to look at colors if you can't see them, you just look at the position of the lit-up light.
I imagine profound color blindness would be like at night, when it's a B&W world for all of us, only bright day of course.
It just proves how we take so many things for granted though...I love color charts and graphs because they say so much so fast, and never thought, until this string of posts, about how difficult they would be for someone with color blindness.
RC known to you as ThatsItImout
Regarding the wonderful charts all the folks at TOD provide us, refraining from the use of red, yellow and green in the same graph would really help people like me. If just one of them is used at a time most colorblind people can see all the other colors just like everybody else.
I don't comment much here but I always like to thank the contributors for the wealth of knowledge on TOD.
Thank You,
Rex
If I'm reading Khebab's chart correctly, this peak was in 5/05, and the current value (9/06) is about 900,000 bpd below the 5/05 value (at least for EIA). And again, with the "voluntary" declines, we are almost certainly going to end up with 2006 below 2005.
I think that Khebab defines crude + condensate + NGL's as crude + NGL's.
Those of us (on this site and elsewhere) that offer our time in trying to get the message out that Peak Oil is soon, and serious, have an odd juxtapostion of internal responses to a post like this one by Stuart.
On the one hand, we want to show that our insight and analysis is correct, so we proclaim that so far dec 2005 is the peak! we are right! what a good thing! pat us on the back! Great analysis Stuart!
On the other hand, if Dec 2005 IS the peak, as SS once said, things are about to get a lot less fun. It so far is easy to have an educated, informed, entertaining and civil debate online about these facts, but we all have it in us to be like cats in a sack as well.
Personally, I think peak in C=C plus NGL is soon, but would happily be willing to eat crow for another 5-7 years.
That said, I certainly share the concern that the total liquids number may be distorted by not being a "net" number (eg ethanol may be somewhat double counted both as the final ethanol and also the diesel etc used in growing the corn to make the ethanol). However, there isn't an obvious way to produce a global "net" liquids fuel series with moderate effort.
During spring of 2003 (if memory serves) some NGLs were fed back to the gas stream as NGL obtained a higher price as gas than as liquids.
This is possible to do as long the mixture stays within the specifications (transport and customer) with regard to hydrocarbon dewpoint and Wobbeindex.
EROEI "invested" % net
100:1 1 99 Early oil
50:1 2 98 Mid 20th cent.
33:1 3 97 Late 20th cent.
25:1 4 96 Turn of 21st
20:1 5 95 Century oil
15:1 7 93 Oil now?
10:1 10 90
9:1 11 89 Deep water oil?
8:1 13 88
7:1 14 86 Tar sands?
6:1 17 83
5:1 20 80 Polar oil?
4:1 25 75
3:1 33 67 Biodiesel
2:1 50 50
1.5:1 67 33 Oil shale?
1.33:1 75 25 Ethanol best
1.25:1 80 20
1.1:1 91 9
1:1 100 0
1:.7 143 -43 Ethanol worst
Just a little toy/tool to play with. IMO, the historic decrease in EROEI hasn't hurt too much, as we've still got 90% or so of the gross extraction to use. But from here on out, it starts to matter. Below 7:1, each whole number decrease in EROEI really takes chunks out of the net available. This gets far too little attention, IMHO. Thanks for bringing it up in this context. Consider the confluence of increasing population, decreasing gross extraction post-peak, and declining EROEI. Yikes is one word that comes to my mind...
Nice this is actually the underlying reason I'm concerned about asphalt production and other marginal products that were available when light sweet crude was plentiful. I believe that as the EROI goes up more complex refining procedures will be introduced to maintain the gasoline/diesel supplies at the expense of the lower grade produces.
It would be nice to see EROI combined with refinery product distribution to see if they are leading where I think they are. In my opinion the first shortages and major price hikes will take place in lower end products not gasoline/diesel.
So when we are post peak then the first indicator could be real bunker fuel shortages for example.
As far as bunker fuel goes.
http://www.bunkerworld.com/news/2006/11/66186
Seems that problems are already occuring.
I'm not a full member but it sounds like it was a allocation goof the point is that it shows supplies are very tight in the bunker fuel market.
But I know my customers, shipping companies, have accostumed most of their vessels to run on heavy fuel. ALL new vessels are build to run on heavy fuel. That is not a coincidence.
More and more, specifically in the light of various comments in this thread, I feel we all should define Peak Oil as the peak in light sweet crude, instead of anything else. This proposition is definitely relevant when EROEI is concerned.
And for Leanan and a lot of others: your KROEI is still highly positive (Kudos Returned On Energy Invested)
The links below - as well as recent post by Robert Rapier and I understand a presentation by Marciel? at APSO - indicate much higher returns for sugar-cane based ethanol. The same links below give a slightly higher EROEI for some bio-diesel as well (about 4:1).
None of this is to say that sugar cane-based ethanol, is going to save the world. I prefer Engineer-Poets' recent proposals for that. However, it is inaccurate to lump all sources of ethanol into a single figure.
********
Here are five studies that all cite figures of positive 8-10 EROEI for ethanol from sugar cane. I have given page references for three of them and will find and post the others later.
1) FO Licht presentation to METI,
http://www.meti.go.jp/report/downloadfiles/g30819b40j.pdf
2) IEA Automotive Fuels for the Future
http://www.iea.org/textbase/nppdf/free/1990/autofuel99.pdf
3) IEA: Biofuels for Transport
http://www.iea.org/textbase/nppdf/free/2004/biofuels2004.pdf
4) Worldwatch Institute & Government of Germany: Biofuels for Transport (Link to register - study is free)
http://www.worldwatch.org/node/4078
5) Potential for Biofuels for Transport in Developing Countries
http://www-wds.worldbank.org/external/default/WDSContentServer/IW3P/IB/2006/01/05/000090341_20060105 161036/Rendered/PDF/ESM3120PAPER0Biofuels.pdf
What would be nice and is perhaps impossible to obtain, but maybe someone has some rough figures or maybe they could even model it, is some kind of chart that shows the EROEI as oil production continues into the future based on the current known fields and their estimate current extraction and future EROEIs.
So in the typical chart for global oil production so far from say the 1940s to 2005, we might have another line graph showing the falling average EROEI from the 50:1 to 25:1 which is a figure someone below gave rather than the 15:1 you give above. At some point falling EROEI has to impact the ability to produce in some sense.
I guess what I am trying to say is that the current relatively complex industrial society is only really viable -if that's the word -at say for example EROEI figures above 10:1 or whatever, because of the way it has implications for energy costs and rates of pollution and so on. In other words the current society setup requires cheap energy and more expensive energy would push it into a different structure -hopefully not as bad as the current one, and the change would be relatively abrupt. In a situation, even in the early stages after peak, when production is falling reasonably slow, the effect of the continuing (slower?) fall in EROEI may have some combined effect that is detrimental to the present regime and hence causes an abrupt structural change.
Perhaps the peak of cheap light sweet crude represents for oil at least a sharp turn downwards in EROEI.
There are some diferences between US's corn ethanol from the Brazil's sugarcane ethanol. More sunlight on Brazil, sugarcane is more efficient producing sugar, the refineries burn the sugarcane "bagasso" for destillate the ethanol and they too use the heat from burn the bagasso for produce eletricity. And IMHO bagasso is biomasse and not gas.
Ok, for produce fertilizants they use gas. Well, that ok for any hamburguer you eat.
And it is not sugarcane that is eating the Amazon forest... it is soybean. Sugarcane is being produced at Sao Paulo, Rio de Janeiro, Minas Gerais and the Brazil's Northeast states (Pernambuco, Bahia, Sergipe, and others), that is not amazon basin. But anyway americans are tottally ignorant about geography, they cannot point Iraq on a map and they cannot point where is the Amazon Forest at Brazil.
However, Brazil's sugarcane is not a solution for the world. Brazil problably can produce enough ethanol for help Brazil change to a more viable energy grid. We have a lot of rivers we can use for hidroeletric production (at the Amazon basin, yes, deforestion there) and we can go strongly for wind power and solar power.
But other countries can produce ethanol from sugarcane like Brazil. India is one example. Possibly some African countires too. Other South America and Central america countries can produce it too. Certainly Cuba and Cuba problably will be an ethanol exporter. Can the Third World produce enough ethanol to solve world problems. Problably not, but they can produce enough ethanol for help an energy transition.
But that will not happen if US deide to try protect corn production with fiscal incentives and importation taxes.
Best Hopes for Good Solutions,
Alan
Brazil needs to build electric railroads between cities, Urban rail and electric trolley buses in the cities.
thanks for finding the time for this update - much appreciated. And, hope you can continue, on occasion. Meanwhile, good luck on newco.
We are still suffering from the 1990's, when energy sector investing was on the back burner...as there were far better areas for you to invest your money.
In the long run, higher prices will dampen demand and encourage supply, be it conventional or something new.
Bottom line: The sky is not falling!!!
In a world of plentiful untapped resources, 5 years of consistent price inflation should at least match discoveries to consumption and even bring in some of the petroleum bacon. Where are the post-2000 giant discoveries? Are there even any significant small ones? Please point to some documented reserve growth and increased production from this 5-year boom.
more the product of the financial fantasyland that blows the price of currencies about the tempest of its whims. In the
same time that we saw oil go from $18 to $70, the money supplies of the world's most important currencies have been expanding at rates which in no way correspond to any actual
economic growth. The money's going to go somewhere, and some
of it reflects the glut of currencies in the higher price of oil. Yes, oil costs more in real terms, too, but the change is not nearly as dramatic as it is in nominal terms. Day to day,
the prices of almost anything traded globally are more
affected by hedge funds and currency traders than by the fundamentals. This is not to say that we didn't peak in 12-2005, but it is to say that the prices have been as much
a comment about the supply of dollars as they have been about
the supply of petroleum.
It's not reality, but the perception of reality, that people act on. And every time they're burned by a set of circumstances it takes ever more evidence to convince them to take the same action that contributed to their pain the last time around.
The "human factors" of energy and environmental issues can be incredibly maddening, but we have no choice but to deal with them.
At the end of Y2K, the average of the 16 recognized URR estimates was 2375-Gb. By the end of 2005, it had risen to 3228-Gb ... an increase of 171-Gb/year. Present consumption is 31-Gb/yr. It is this phenomenom of Reserve Growth + Discoveries growing at five time's consumption that leaves the Peakists w/o merit. It is this URR growth that has kept BP's annually produced future reserves graph at approx 40 years for the last two decades.
/sarcasm off
The traditional 40-yr metric by BP is based on their 2244-Gb estimate (less past consumption). The recent growth in URR is mainly due to the economics of $50/barrel oil. And it has mushroomed the R/P ratio to 71 years.
If we look instead at the Avg of growth of the 6 recognized URR estimates between 1980 to Y2K, the Avg annual growth was only 56-Gb (net of consumption). That is why URR stats have risen almost every year since estimates commenced in 1915.
The Avg annual URR growth over the last six years has ranged from 31-Gb to 234-Gb using the present 16 Estimates available.
If so your case is misleading at best.
Also your 56GB/yr prior to Y2K is again misleading.
That increase includes the magical URR increased in the ME during the 1980's.
You are counting tar as oil, now you want to count nothing as oil.
See my post from earlier today about SA reserves.
So SA has at least 100Gb of remaining reserves without counting the URR increases in the '80s.
Your "tar and nothing" comments are inconsequential in the big picture.
Now you are just being dishonest.
Reserve Growth:
Middle east World
80's 295GB 333GB
90's 34GB 114GB
80-2000 329GB 447GB
So you can see in the last 20 years the magical reserve growth in the ME accounts for 66% of the world's reserve growth.
That growth BTW is an average of 22GB a year for 20 years (where did you come up with 56?). Magical ME growth makes up 15GB a year alone or 68% of the average reserve growth of the entire world for the last twenty years.
Your "tar and nothing" comments are inconsequential in the big picture.
Like I said, now you are just being dishonest.
Canada's tar sands depend critically on stranded, or 'free' ng. Now that this is running out we will see reduced growth here. And, ethanol might be peaking, too, as corn prices surge. So, the peak in all liquids might not be far behind po.
But then we will have seen Peak Cold-Winters
I sure as heck won't take you at your word.
I posted my numbers, any one can double check them and verify.
Where are your numbers?
Upon examining tar¬hing with the real world numbers, tar¬hing are reduced to a mere blip. And when looked at in light of the most optimistic URR estimates ... even moreso.
If you have better numbers post them.
But you don't so you can't.
You sir are a liar.
Region BP Oil&Gas Journal World Oil
NAmerica 60.092 213.432 46.135
SAmerica 103.502 103.364 76.497
Europe 17.646 16.381 15.980
Eurasia 122.888 77.832 123.223
MEast 742.711 743.411 711.644
Africa 114.268 102.580 109.759
Asia 40.224 35.936 36.378
World 1,201.332 1,292.936 1,119.615
Would you look at that. BP's numbers match quite nicely with all the other reserve estimates on the EIA page.
(note: Oil and Gas Journal count Canadian tar sands in N America hence the inflated number, an extra 174GB)
I've given you many chances. I will continue to do so. Only because you have a skillset.
Please re-adjust. I admire you taking on Freddy. It's admirable from where you you are coming from. I guess. Just don't let it happen again.
Now start getting serious about life.
Let's not complicate things!
The Oil CEO is loopy. I'm tellin' ya.
The TrendLines URR Estimates are in a graphic format similar to our Depletion Scenarios. While this 17-estimate compilation is commited to a proprietary project at this time, i will resolve to post it a TOD or our website shortly so we can compare our interpretations of "blip"; possibly in Rembrandt's upcoming Part2 discussion of Reserve Growth. Please be patient.
The problem is technology, personnel, and the equipment curves are crossing the demand curve. This causes price increases. In fact the energy required to produce oil is hiding actual net production. Do you have that in your database? This is what we call EROEI. This number is steadily falling.
You keep talking about reserves, but the price doesn't care about reserves it only cares about production.
I realize you are trying your best to obfuscate the facts with reserve data. Do higher prices cause more production or do smaller increases in net production cause increasing costs to reduce production? Every day requires more energy, more effort, and more money to produce a barrel of oil. I believe these three things are going to control the peak oil date, independent of how large our reserves are purported to be.
And yes reserves are related to production just like a third cousin.
to ~260 GB around 1990, these magical increases on paper
of 'reserves' dont mean very much at all. When there's no
way to really verify such numbers, there is no limit to
what financial or political interests might come up with.
The important factor is the profile of production.
that the sky is falling. http://www.realclimate.org/index.php/archives/2006/11/the-sky-is-falling/
I have Nick Rouse to thank for this link.
How do we interpret this?
$340 billion investment leading to only 2% increase in production, or
a 5% real terms increase in investment led to a 2% increase in production?
Well, I did devote some of Investment in Oil Exploration and Production -- An "Above Ground" Factor to this subject. Just like the Globe & Mail, I had looked at the IEA report.
It's always so satisfying to see a fresh discussion of something brought up as new "news" that I talked about so recently here at TOD ... sigh.
But what's the answer to the question?
I think with this accounting trick they are effectively adjusting for reduced EROEI, by calling it "inflation". We would expect reduced EROEI to result in rapidly increasing development costs. They are saying let's assume that the EROEI at 2001 is the reference, and therefore increase in costs above that reference are "inflation".
If energy is the currency, and energy is becoming incrasingly scarce, then all other goods (and money) is deflating in relation to energy. In such an epoch it would be good to be in possession of energy, eg a windmill, or, failing that, shares of oil and gas producing companies.
Well no, that is my argument. Inflation is an across the board increase in prices, it doesn't apply to a specific product. The Energy Cost of driving my car has not increased over 5 years, but the Energy Cost of extracting oil has increased. It literally now takes more barrels of oil to find each get barrel. That equates to more rigs, more people. This cost is expressed in monetary terms, but it's down to the fact that more resources are now required.
Energy cost is not the whole thing of course, there are other factors. But I believe that diminishing returns are what causes the inflection point in the production curve. Oil companies have been giving profits back to shareholders. What they are saying is "we can't make a better rate of return than putting it in a bank, so you take the money".
IMO it's a sign that a peak has been reached.
Stuart
You mention that OPEC output started declining before they announced the cuts. Do you care to expand on this as you see fit. For me this is the smoking gun. Now KSA can claim they started decreasing production in anticipation of cuts but occams razor does not agree.
Next question I think that a reasonable explanation of the error range for these numbers are in order. Personally I think that are about +/- 2mbd I know that's high but just the differences in numbers between agencies suggest a fairly large confidence interval. This would bring up the second half of my question. At what point do you feel that decreased production minus external events results in a clear signal that we are in decline. My wag was 4mbd.
Although we certainly seem to be at or close to peak oil it is a condition that can only be known in retrospect. Thus a discussion of the s/n ratio is in my opinion important now that we are seeing the bumpy plateau effect.
And finally on a related note there is some intrinsic slop in world oil delivery since a lot of oil sets on the high seas in tankers or in storage or pipelines before it is finally consumed.
I'm not sure what the turn around time is for a barrel of oil to be consumed but it would be nice if someone that knows would go through the consumption loop from the time a barrels leaves the well until its burned in Soccer moms SUV. I'd have to guess its at least a month or six weeks for OPEC oil.
And last but not least we tend to do simple static snapshots of oil production without forcing functions. But it not that hard to make a few assumptions about production capacity then enumerate effects that would lead to actual production being reduced from capacity. A initial wag would be that 100% efficiency and max production we could ring 4-5mbpd of production from our current capacity.
The importance of discussing capacity is that peak oil detractors love to talk about capacity as if it was production and they like to mix in potential production as if the oil was already here.
I hope I am not taking people off topic by posting some of the things I found surfing today. It all relates to Peak Oil at some level, of course.
This article from BusinessWeek talks about how Iran's lack of investment in their energy infrastructure and soaring domestic demand means they will import 40% of their gasoline this year. Ethanol is getting incrementally more efficient to make. This ethanol plant will install wind turbines for power.
This group wants to make ethanol from municipal solid waste from wastewater treatment plants.
Better suited to a DrumBeat, IMO.
And most of these have already been posted to the DrumBeats. ;-)
I have a question on the tar sands - is it valid to include this stuff in production? What is included? Is the total boe reported, including the gas and oil (diluent) used in production, or just the net?
On biofuels I have little doubt that gross is being reported, with no account made for the boe in gas and oil used in production.
I agree with one of the postings, we should be looking at C+C only, tar sands and biofuels will hide the peak.
In fact, as mentioned above, even drilling is more energetically costly. It would really be far more meaningful to track the liquid fuel energy available to uses outside the liquid fuel energy industry. I can imagine huge totals of ethanol +crude + condensate while the net energy falls steeply, and CERA still claiming we have no peak and no problem.
"Other biofuels, including ethanol and biodiesel for countries outside the US and Brazil, have been revised upwards by 25 kb/d for 2006 and 82 kb/d for 2007. The main changes have been made to European ethanol and biodiesel, following member countries' rapid expansions aimed at adhering to the European Union's ambitious biofuel-blending targets. Stronger 2007 growth is also now expected in China. Total 'other biofuels' supply is now estimated at 179 kb/d for 2006 and 344 kb/d for 2007. A further discussion and update on biofuels, along with more details, will be published in the report dated 18 January 2007."
We can hope that they cover the double counting issue in that address.
I'm not sure that total reserves or a geologicially constrained peak matters much to the average consumer. What the people want is a steady supply at a price cheap enough to waste. In TOD terms, deliverability and cheap gasoline. It seems extremely clear that this is soon to end from depletion and growth in demand.
I have the same question. Very often, tar sands production numbers are given in term of volume of raw bitumen which is not the final product. The final product is syncrude which is an upgrading of the raw bitumen. The upgrading process is 80-85% efficient.
If you want monthly production numbers check this post.
a) why isn't this being reflected in higher prices for oil?
b) why would opec consider cutting productions? especially given that we are now drawing on oil stocks at 2.2% of production (average of q2,q3 2006, iea data)and considering that on average last year we used drew on stock at 1% of production? (mbpd values for 2003-2006 stock draw are 0.6 0.8 0.9 1.4(average of first 3 quaters) (http://omrpublic.iea.org/World/Table1.xls))
c) (relating to b) does anyone have data for actual oil stocks (ie, production + stock change)?
I've tried to produce the stock changes myself, but (according to the bp statistical review) there is about 154 thousand bpd more consumption than production on average for the last 40 years (so obviously they are counting something other than crude in 'consumption'. (http://www.itee.uq.edu.au/~ahill/prod_consump.bmp))
Most countries have had a 30% windfall by the usd devaluation thus far.
Talk to Amurricans about peak oil and they think you're a bit looney but may be onto something, but talk about the fall of the dollar and they think you're friggin' nuts.
The dollar has sold off the last few weeks, but is still stronger (slightly) than it was two years ago
p.s be careful what you seem to wish for
Our homes supposedly doubled in value the pst 7 years...so why not oil?
Surprise! The hard assets did not double in value. It simply took twice as many paper dollars to purchase those hard assets.
The sky is not falling. And pay no attention to the global warming crowd...they are FAR more hysterical than the peak oil crowd.
The highest inflation estimate I've seen is 10% and thats debatable.
Here is a good link.
http://www.safehaven.com/article-5795.htm
In general they have 5-8% real inflation numbers.
Inflation is not the cause of our current prices.
And here are oil prices adjusted for inflation.
http://inflationdata.com/Inflation/Inflation_Rate/Historical_Oil_Prices_Chart.asp
This information can quicly be found not sure why your making bogus claims.
Your references are for inflation of goods purchased in the U.S. with U.S. dollars.
They don't say anything about the conversion of dollars to other currencies.
WorldWide inflation is not a simple concept. Also the petro dollar rules in the ME so you can discount total inflation.
And finally basked curriences or overall relative inflation has not changed that much over the years. The only real winner has been the Euro so far.
Of more intrest I think would be internal inflation in KSA.
This link shows little inflation.
http://www.pbs.org/wgbh/commandingheights/lo/countries/sa/sa_inf.html
But I'm not sure what you mean and sorry for the scattered post but the price of oil in real terms has risen a lot lately no matter how you measure it. The dollar is still the main fiat currency and yes the amount of dollars produced lately is enourmous but so far its not resulted in massive inflation mainly because of games played by the CB's.
As a final note the oil producing countries will always be at the mercy of to OECD countries since they must use OECD currencies to buy and sell oil. The vast majority of oil revenue is used to purchase goods from China or the OECD countries so in a sense the dollars are eventually recycled back in the end to the US with the oil producing nations gaining nominal weatlh from the purchased goods.
I think this is one reason we favor corrupt regimes over
real nations in oil producing regions. Corrupt regimes are far more likely to recycle the oil money back into OECD countries instead of turning it into exportable goods.
When I look at the chart in Robert Shiller's book Irrational Exuberance (2nd edition) it appears that we have an average US national price increase in real estate of about 80% from 1998 to 2005. Given that the lower real inflation number is at least half of that increase and that the upper real inflation number is almost all of that increase, how do you conclude that inflation is not the primary component of real estate price increases? Of course specific markets that have gone above that can be said to be influenced by other than inflation but nationally as a whole? I find that argument far from compelling and the inflation argument as fitting the facts more closely.
If wages have not increased 71% then we have not had classic inflation. There are plenty of inflation adjusted oil prices.
http://en.wikipedia.org/wiki/Inflation
Now back to the 10% or hidden inflation numbers.
Here is another one.
http://www.safehaven.com/article-1942.htm
Now the trick is to show that your wages and everything else increased by some x% generic inflation amount so the price of oil has not changed.
This is not true real wages have certainly not increased much in 10 years. So the price inflation is if anything understated.
I think your economic assement is incorrect. If you want to persue oil inflation real inflation M3 and the world economy
that would be a great post.
Suffice it to say that M3 has increased 10% last year.
The feds have been printing money like no tomorrow and the world is awash in money. How the price of oil relates to this mess dunno.
from the Post:
It's always been good to be an oil company, there's great profit in theft and not paying your taxes.
and, where are these rigs coming from, anyway? sa is poaching from our gulf to drill in theirs, but what is the source of all these extra land rigs? China?
us ng output declining 8%/year for the next 3 years, oh my. More rigs here, there, everywhere, please.
Danish APM group has announced that they will invest 2-2.5 billion USD in new rigs.
http://borsen.dk/nyhed/99350/ (Danish I'm sorry). APM has ordered 10 new exploration platforms- 3 floating deepwater,6 jackups - 150 meter water depth and 1 FPSO drilling - ship. The rigs should be operational 2010.
inventory of present APM rigs
http://www.maersk-contractors.com/contractors.aspx?itemId=126&fid=26&cid=5
Maersk Contractors is part of the A.P. Moller - Maersk Group and is a leading drilling contractor and supplier of floating production solutions. The fleet counts 29 drilling rigs and four FPSOs including six high efficiency jack-up rigs, three deepwater development semi-submersibles and one Floating Production Storage and Offloading vessel under construction. Maersk Contractors employs an international staff of 3,000 well-trained people.
And not related to rigs- I came across this detailed presentation of the Dan/Halfdan oil field in the North sea. Field history, production, water injection drilling patterns etc.
http://www.maerskoil.com/report/050907_TTA_presentation_Aberdeen.pdf
Regards And1