Hurricane Gustav, Energy Infrastructure, and Updated Damage Models - Thread #3 (updated 23:46 edt)
Posted by nate hagens on August 30, 2008 - 7:00pm
(Welcome: we are now on a later and more updated thread, which can be found here: http://www.theoildrum.com/node/4478 NB: you may want to just go the front page (it will be post #1 or #2) to get to the most recent thread: http://theoildrum.com ...)
Recent track shifts have Gustav consistently hitting near New Orleans, east of the majority of oil and gas rigs; though this could still change in either direction, the models have continued to converge.
There are many resources under the fold (by clicking "there's more" in this post), including details of the latest oil/infra damage estimates from Chuck Watson at KAC/UCF as well as lot of other resources including rig maps, models, google earth maps, and a lot more in the comments. Please help us find things that help convey the energy situation and problems created by this storm. Client-type readers should click on Chuck Watson's links - his long range Katrina forecasts were spot on and he has helped us -a website of volunteers - by volunteering a great deal of time and expertise.
UPDATE! 21:46 EST From Chuck Watson with respect to the LOOP:
Extensive damage and an extended recovery time probably measured in months. The pipelines to shore are probably in a lot of trouble on this trajectory due to scour.
Comment from Matthew Simmons 23:43 8/30:
LOOP is the only facility in the Gulf to unload VLCC tankers which carry over 2 million barrels of crude. They can in theory be "litered" by unloading onto smaller tankers that can make it into the Gulf Coast ports but this is very lenghty timing and the spare capacity of these smaller tankers is slim. We get about 1.2 million b/d of crude imports through Loop. (+/- 10%)
UPDATE: 21:00 EST - Graphic below - shut-in production estimates below fold
Sneak preview of the 11pm runs. This is from LBAR, which has been almost as good as GFDL on track (at 48 hrs, 156mi vs 136mi), and updates much faster.
(GRAPHICS MOVED UNDER THE FOLD FOR BANDWIDTH!)
(Welcome: we are now on a later and more updated thread, which can be found here: http://www.theoildrum.com/node/4478 NB: you may want to just go the front page (it will be post #1 or #2) to get to the most recent thread: http://theoildrum.com ...)
Damage estimates using LBAR 48 hour run 9pm EST-click twice to enlarge
For all graphics: Rigs/Platforms: Blue: evacuated only; Yellow will require inspection before restart; Red: damage requiring repair.
Refineries: Black: operational impact (partial shutdown) Green: Operational impact (full shutdown)
Red: Damage likelyPorts: standard hurricane flags for wind
We are not hurricane experts at theoildrum.com. Neither are we experts on damage forecasts to oil and gas infrastructure from weather events (though thankfully we do have an expert that helps us). What we try to do, and have been doing for over 3 years, is articulate the fragility and urgency of our nations, and our worlds, energy situation. As Hurricane Gustav moves nearer, and professional meteorologists and energy analysts gauge the impact it may have on our energy infrastructure, feel free to browse our archives of hundreds of empirically based analyses and perspectives on the myriad energy issues that are the backdrop not only for this hurricane, but for any exogenous event that disrupts the increasingly uneasy balance between energy supply and demand in our modern interconnected world.
We hope those in the path of this behemoth will get out of the way, prepare, and do everything they can to preserve human life. Let's hope this is all a waste of time and that this is not the human tragedy that it looks to be.
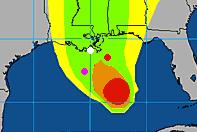
Click map to go to WUnderground
UPDATED: 20:53 EST 8/30
A note on our modeling process: we take the official NHC track, the raw computer model tracks like GFDL, HWRF, LBAR, etc, and even run our own in-house fast cycle track/intensity models. These track and intensity estimates are feed to our main hurricane model (TAOS), which computes the wind, waves, storm surge, currents, etc. at each point in our database of over 50,000 elements in the GoM like rigs, platforms, pipelines, pumping stations, refineries, etc. We then have engineering models for each type of infrastructure that calculates the damage and estimated down time for that element, as well as downstream impacts (eg if a pipeline is down, the upstream elements can't pump and the downstream elements don't get product)
Since the major models are converging on New Orleans, I asked Chuck Watson if his expertise extended to the impacts on the navigation, etc. of the Mississipi River, our nations most important port. His response:
Biggest problem for navigation in the lower river, as I understand it, is debris - trees, boats, houses, superdome parts, etc. If this thing stalls and upriver levees start to bust, then you get silt and more debris. LBAR track (one of the fairly good "quick" models) is now tracking "worst case" for NOLA. We're showing $80 Billion plus on-shore damage on that track just in lower LA.
I'm still skeptical this thing will maintain Cat4 all the way to landfall. Makes sense to plan for it, but the dynamics just don't feel right. More nervous about it than this morning, but still think it's less than 1 in 3 for Armageddon (which is bad enough).
Chuck Watson has created a table for us, showing expected production (vs original) for 14 day, 30 day, 60, 90 day, 6M, and 12M (updated 20:53 EST 8/30)
Early 00z (8pm ET) runs have shifted towards NOLA again. Will be
interesting to see if the big global runs like GFDL and HWRF shift as well.
Forecast GOM Production Estimates based on various track models (updated 21:00 est)
Official Forecast Track
OFCL ATCF Forecast Time: 2008083018
14 day:    6.99 MMBBL ( 43.42% normal), gas   51.21 BCF ( 57.15% normal)
30 day:   19.89 MMBBL ( 57.65% normal), gas  137.55 BCF ( 71.64% normal)
60 day:   44.88 MMBBL ( 65.04% normal), gas  306.38 BCF ( 79.79% normal)
90 day:   70.56 MMBBL ( 68.17% normal), gas  485.33 BCF ( 84.26% normal)
6 mon :  152.45 MMBBL ( 73.65% normal), gas 1040.40 BCF ( 90.31% normal)
1 year:  341.75 MMBBL ( 81.42% normal), gas 2279.55 BCF ( 97.58% normal)
Best Objective Track
BOTR ATCF Forecast Time: 2008083012
14 day:    6.44 MMBBL ( 40.00% normal), gas   48.65 BCF ( 54.29% normal)
30 day:   17.96 MMBBL ( 52.06% normal), gas  127.77 BCF ( 66.55% normal)
60 day:   45.40 MMBBL ( 65.80% normal), gas  290.50 BCF ( 75.65% normal)
90 day:   74.66 MMBBL ( 72.14% normal), gas  461.18 BCF ( 80.07% normal)
6 mon :  166.36 MMBBL ( 80.37% normal), gas 1013.94 BCF ( 88.02% normal)
1 year:  370.11 MMBBL ( 88.17% normal), gas 2275.52 BCF ( 97.41% normal)
Alternate Scenario 1 Track
LBAR ATCF Forecast Time: 2008083100
14 day:    6.50 MMBBL ( 40.37% normal), gas   52.09 BCF ( 58.14% normal)
30 day:   16.97 MMBBL ( 49.19% normal), gas  132.66 BCF ( 69.10% normal)
60 day:   38.89 MMBBL ( 56.36% normal), gas  292.30 BCF ( 76.12% normal)
90 day:   61.88 MMBBL ( 59.79% normal), gas  454.79 BCF ( 78.96% normal)
6 mon :  145.78 MMBBL ( 70.43% normal), gas  974.89 BCF ( 84.63% normal)
1 year:  358.24 MMBBL ( 85.35% normal), gas 2149.43 BCF ( 92.01% normal)
17:15 EST 8/30 Current track has LOOP out for extended period of time as well as some extensive refinery shutdowns.
Chuck comments:
The current tracks, both official and objective, are showing serious damage to the LOOP terminal as well as Southwest Pass. About a dozen refineries, including the big Baton Rouge Refinery (~500,000BPD), are showing at least week-long shutdowns and various levels of damage. Long term power and pipeline disruption is forecast in the target area, with extended rain (due to the storm stalling inland) making repairs difficult. It's not a good forecast - in some ways, worse than Katrina.
However, one thing folks should keep in mind: right now the major track models are abnormally closely clustered in space if not in time. That (obviously!) means that they are either all right or all wrong. I've done this long enough to suspect the former . . .
Chuck Watson update 17:00 EST 8/30: The tables show the expected and forecast cumulative production from the GOM at the end of each period. So according to the runs based on the Official NHC forecast, at the end of 90 days the GOM would have produced only 70 MMBBL as opposed to the normal 103 MMBBL, a 30% cumulative shut in.
Little wobbles matter a lot. It's important to realize just how sensitive losses are to the exact track and geometry of the storm. As you're probably aware, a few leases are responsible for the majority of production (I should do a map of that some time). The critical damage width, even for a strong storm, is really quite small - 30 miles wide or so. So a 10 mile wobble or a 20 degree change of approach can make a huge difference in impacts. The expected shear means greater asymmetry in the storm, which also changes the geometry. As I've said all along, the numbers tend to be all over the place until we get to about 2-3 days out.
Chuck has put together a dynamically updating page that will reflect the latest damage models/forecasts at this link: KAC/UCF models.
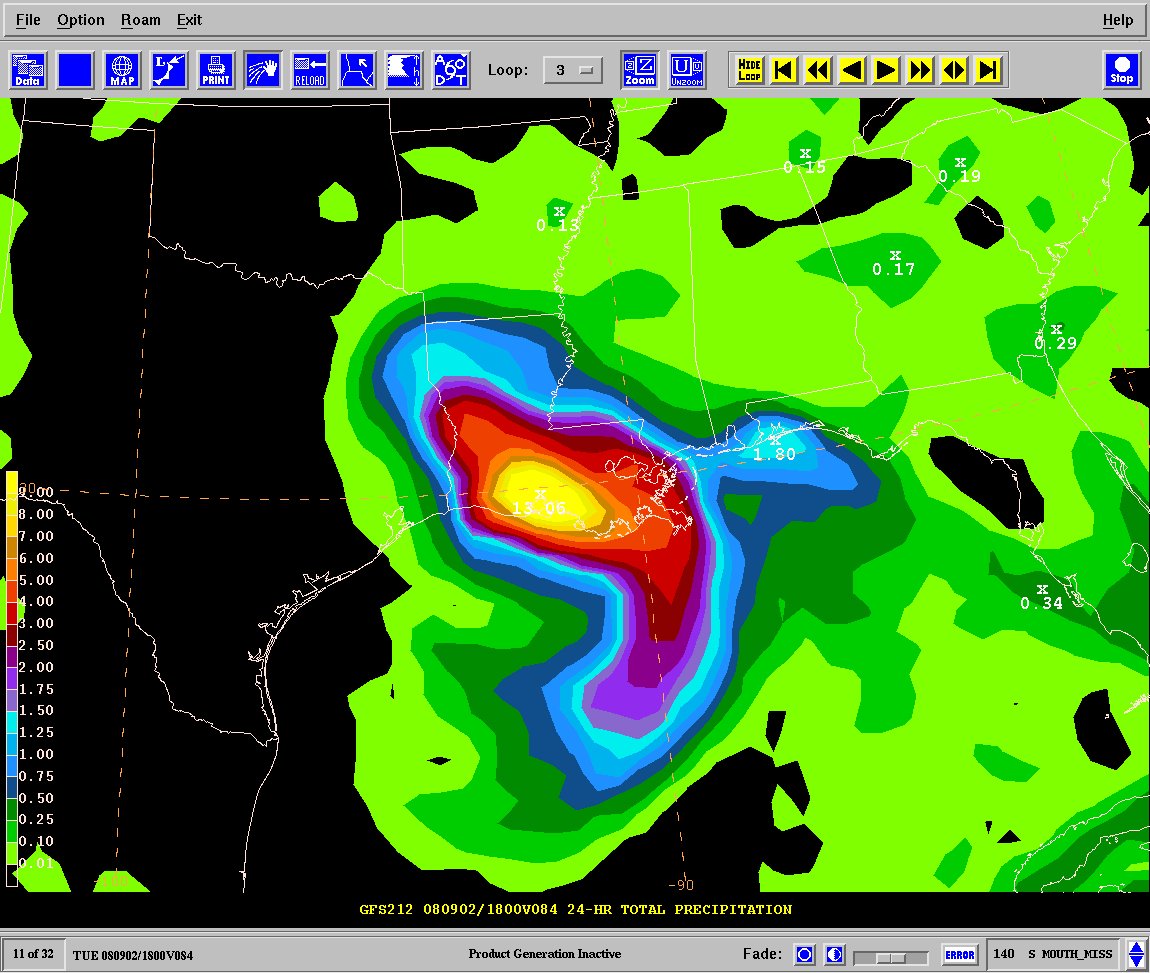
Rain estimates using GFS forecast
Rain forecast from GFS - over 1 foot of rain immediately post storm, another 10" on day 2, 8" day 3. Wow.
UPDATED
PRODUCTION/INFRASTRUCTURE MAPS AND REFINERY INFORMATION
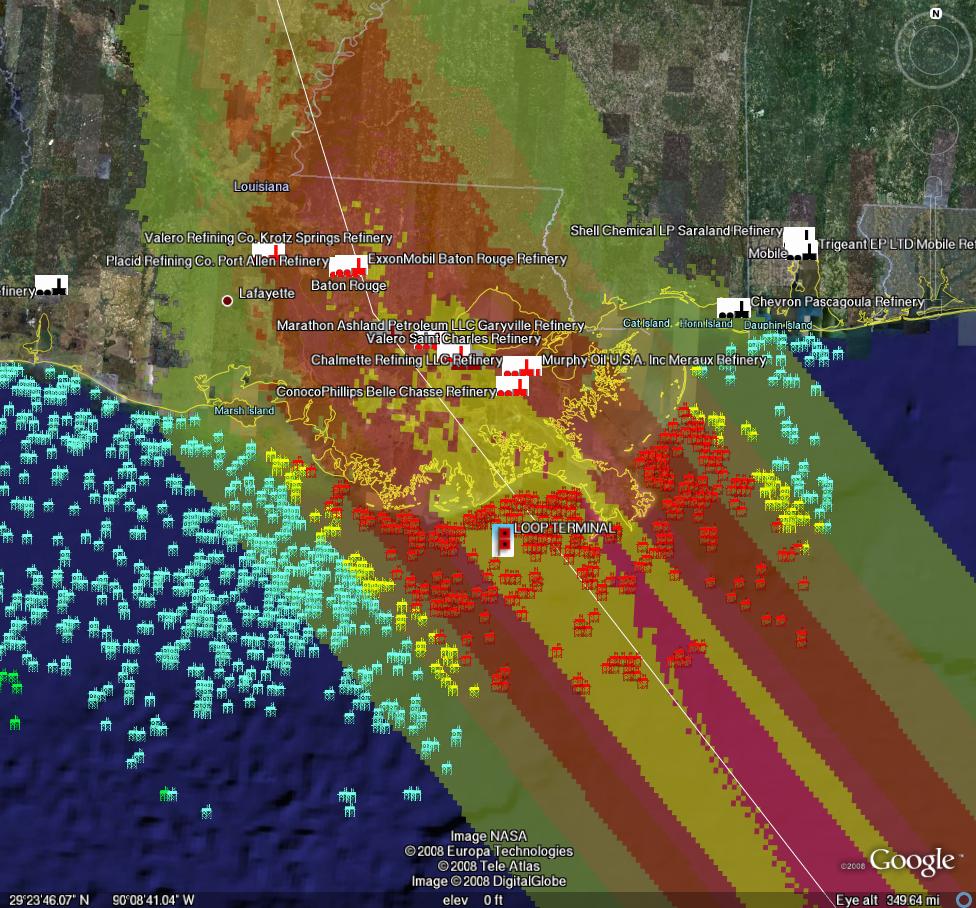
Here's a link to a really good map of oil refining/SPR storage facilities in respect to the path of Katrina (NB: OLD TRACK MAP!) and here is a listing of production and refining capability for the state of LA.
Just to give you a rough idea of where things are, the map above is a probability swath for Katrina (OLD TRACK MAP!) with the Thunder Horse platform as the red dot, and the other purple dot represents the Mad Dog development (100,000 bd); the Holstein development that produces at peak, around 100,000 bd of oil; and the Atlantis field that may have ramped up to around 200,000 bd in all. Put together these projects have the potential of around 650,000 bd, but as can be seen, they were sitting in an uncomfortable spot relative to the track of the Katrina.The white dot is where Port Fourchon is. This is where the Louisiana Offshore Oil Port, or LOOP, is located. Rigzone pointed out that this is where the foreign tankers offload, Google and Terraserve maps you can see that the area is very low-lying. One of the big concerns is that there will be sub-sea landslides or other ground movement that might affect the LOOP. Were this to be disrupted, then foreign tankers would need to be diverted elsewhere, with the likely port being Houston.
We have accumulated resources from previous hurricans below, but we'd like to find updated materials if you know of them. Recent refinery maps, recent rig maps in the gulf, recent gas fields, SPR facilities, the Intercoastal Canal, pipeline stations and transfer points, etc., etc. Leave links in the comments please.
Also, here's the EIA's Alabama, Louisiana, Mississippi, and Texas Resources pages. They will also likely come in handy. Also, here's a link to the national page.
Here's another good resource for infrastructure maps and such. (scroll down a bit)
Here's a map from CNN with large and small refineries laid out. (though it is an old storm track)
Very detailed piece by RIGZONE on rigs and other infrastructure in the area. (thanks mw)
Here's a flash graphic of the oil refineries and rig maps from Hurricane Rita, it emphasizes Beaumont and Galveston's importance. Click on oil production in the tab. Note the many rigs on the east side of the storm that will get the brunt of the damage from the NE quad of the storm...hence the high long-term GOMEX oil production damage estimates below.
Here's a link to Rigzone's coverage of Gustav.
You want a detailed map? Well here's the probably the best MMS map I could find. Very detailed and lots of interesting stuff. (VERY big .pdf warning)
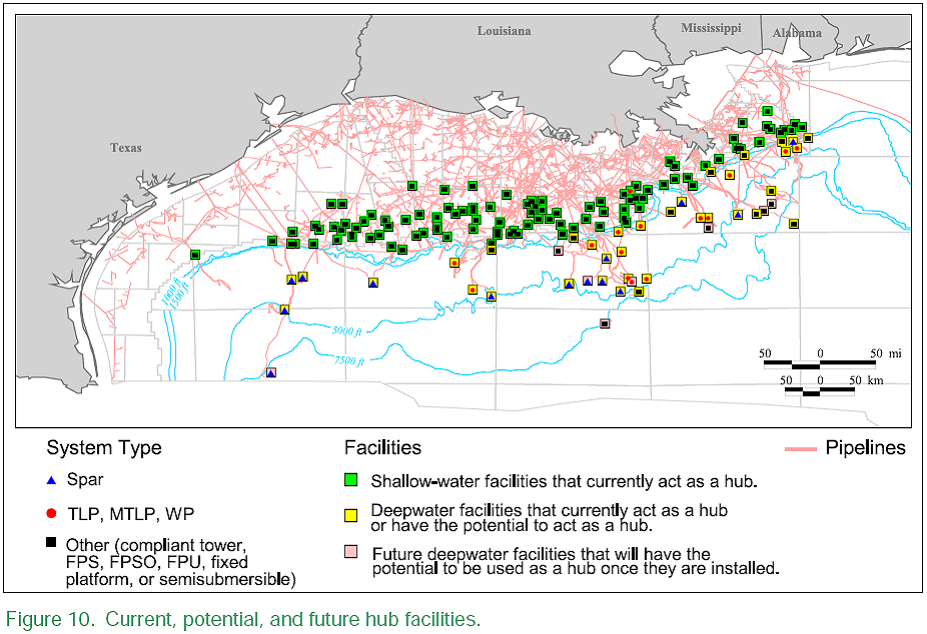
Also, Scott Wilmoth at Simmons & Co was kind enough to send us this map. The map below captures only deepwater infrastructure. For a complete list of deepwater development systems (includes operator, depth, location): http://www.gomr.mms.gov/homepg/offshore/deepwatr/dpstruct.html
(Please deposit new relevant links, graphs, and comments in this new thread...we have updated the resources part of this post with new maps and some more old maps and articles from Katrina on the LOOP and Port Fourchon--important parts of the infrastructure, as we learned about three years ago. We will start a third thread when we get new info or Sat pm)
Hurricane Gustav, Energy Infrastructure, and Updated Damage Models - Thread #3 (updated 23:46 edt)
PDF version
321 comments
Hurricane Gustav, Energy Infrastructure, and Updated Damage Models - Thread #3 (updated 23:46 edt)
PDF version
321 comments
Contact
- Content: editors at theoildrum dot com
- Tech support: support at theoildrum dot com
License

This work is licensed under a Creative Commons Attribution-Share Alike 3.0 United States License.
It's time to leave New Orleans.
Go to I 20 to guarantee electricity.
Some history:
Storm FELIX: Observed by N #0
Storm #06 In Atlantic Ocean
Total Flights For Storm #06: 09
Date/Time of Recon Report: September 02, 2007 23:07 Zulu
Position Of The Center: 13 40 ' N 72 43 ' W (13.67 N 72.72 W)
Minimum Height Measured At Standard Level Of 700 Millibars: 2601 Meters (Normal: 3011 Meters)
Maximum Surface Winds Were Estimated At: 163 Knots (187.45 MPH)
Estimated Surface Winds Were Measured At: 12 Nautical Miles (13.8 miles) From Center At Bearing 45
Maximum Flight Level Winds Near Center Were 152 Knots (174.8 MPH) From 142
Maximum Flight Level Winds Were Measured 12 Nautical Miles (13.8 Miles) From Center At Bearing 056
Minimum Pressure: 936 Millibars (27.639 Inches)
Maxium Flight Level Temperature / Pressure Altitude Outside The Eye: 25 C (77 F) / 2745 Meters
Maximum Flight Level Temperature / Pressure Altitude Inside The Eye: 26 C (78.8 F) / 2806 Meters
Dewpoint Temperature / Sea Surface Temperature Inside The Eye: 4 C (39.2 F) / NA C (NA F)
Eye Wall Was Characterized As Being: CLOSED WALL
Eye Form Was Characterized As Being: C15
Center Fix Established Using: Penetration Radar Wind Pressure Temperature
Center Fix Established At Level(s): 700 Millibars
Navigational Accuracy Measured At: 1 Nautical Miles
Meteorological Accuracy Measured At: 1 Nautical Miles
Other Information:
1: Maximum Flight Level Winds Were 152 KT NE Quadrant at 2252Z
2: Maximum SFC WND 163 FROM SFMR NE QUAD
3: EXTREME TURB NE EYEWALL
This pass was shortly followed by..
REPORTS FROM A NOAA HURRICANE HUNTER AIRCRAFT INDICATE THAT FELIX HAS INTENSIFIED AND IS NOW A CATEGORY FIVE HURRICANE. THE AIRCRAFT REPORTED PEAK FLIGHT-LEVEL WINDS OF 152 KT...WITH PEAK SFMR WINDS OF 142 KT IN THE SOUTHWEST QUADRANT. HIGHER SFMR WINDS WERE FOUND IN THE NORTHEAST QUADRANT...UP TO 163 KT...BUT THESE MAY HAVE BEEN CONTAMINATED BY GROUPEL. A DROPSONDE RELEASED IN THE SOUTHWEST QUADRANT LANDED IN THE NORTHEAST QUADRANT...AND THIS DROP YIELDED A SURFACE ESTIMATE OF 139 KT BASED ON THE LOWEST 150 M LAYER AVERAGE. BASED ON THESE DATA...THE PEAK SURFACE WINDS ARE ESTIMATED TO BE AT LEAST 145 KT. AN EYE SONDE MEASURED A SURFACE PRESSURE OF 936 MB WITH SURFACE WINDS OF 24 KT. BECAUSE OF THE EXTREME TURBULENCE AND GROUPEL THAT THE AIRCRAFT EXPERIENCED...THE MISSION IS BEING ABORTED AND THE AIRCRAFT IS RETURNING TO ST. CROIX
From Sep 2, 2007. The key was 936 MB.
http://www.nco.ncep.noaa.gov/pmb/nwprod/analysis/hur_nested/storm_1/00/i...
GFDL plot resolution: 26N 87 W has Gustav at 936 MB
If Gustav stalls/explodes North of Houma, gasoline will be $5
in a week.
Jeff Masters' advice from yesterday:
A BTW-
If I remember correctly, the first thing Wal Mart in NW AR ran out of in the week after Katrina
was water, limes, tortillas, sugar.
And Shell stations were the first to have plastic bags over the
pump handles.
Good t'hear y'all were prepared in the tequila department! :)
I may buy a bicycle ...
Deeper water means greater wind intensity.
Side by side view of Gustav & Hannah:
http://hurricane.accuweather.com/hurricane/satellite.asp?region=car&anim...
WOW!
One of the models that someone posted showed four storms hitting the Gulf Coast by mid-September.
I think that the big problem nationwide, if we get a succession of storms hitting across a wide area, even if they all don't hit the Gulf Coast, is a very long delay in getting all of the powerlines repaired, which will also of course affect gasoline stations.
Track for Hanna:
http://www.cbs12.com/news/hanna_4709331___article.html/northwest_west.html
Well isn't this just a fine how-do-ya-do. Hanna looks to be 10 to 15 days behind Gus. If she dances her way into the gulf and hooks, she could take out any platforms Gus missed, and keep every thing shut in for quite awhile. If the 2 to 3 storms currently bringing up the rear follow similar paths into the GOM...I shudder to think. Say hello to $4.50-$5.00 gas.
Jeff
Drill, drill, drill?!
RE: "Drill, drill, drill?!"
When, when, when??? Would you like to start on that drilling Monday at about 10 AM? Bring your lunch, and a life vest - I'll be there as soon as I can, just to watch. Bring your rig, of course, since mine's tied up for the next couple of years.
It would seem to me that this group of potential storms would demonstrate the folly of the drill, drill, drill part of our malleable Senator from Arizpona's platform. And likewise the folly of McSame's claim that new leases could be producing within one year, but not those other ones (the 68 million acres under lease.) These leases are different - not like those other leases.
I just don't accept the 1 year claim - I'm not like those other people.
Ummmm...why isn't Hanna turning southwest like they are modelling? If nothing turns her...she is going to hit the upper northeast US. That is a friggin scary thought.
No comments about scary, but certainly within normal limits - the East Coast (mid-Atlantic and up to Nova Scotia) has been spared for a while, but it too is part of a normal hurricane path.
A great link is here - http://www.geocities.com/hurricanene/Majorne.htm (though America-centric - I am pretty certain Nova Scotia has been hit too)
'Since 1900 six major hurricanes have made landfall between Virginia and Massachusetts. No major hurricanes have struck the Atlantic Coast north of southern Massachusetts. There is no record of a category 4 or 5 hurricane landfall in the north Atlantic states. Most of the major hurricanes to strike the northeast coast were moving at greater than 30-mph at landfall. The combination of wind speed and forward motion - increases the destructive potential of the wind and ocean surge on the right hand side of the storm. This is a critical and especially dangerous aspect of hurricanes that strike this region. Eastern Long Island, eastern Connecticut, and Rhode Island have suffered very heavy wind and storm surge damages several times since 1900. The period from 1938 to 1960 were very active in the north Atlantic states - four major hurricanes struck in just 22 years. Since 1991 (Bob) - there has not been a hurricane landfall in the north Atlantic states.'
A bit of local color from Ocean City MD -
'Described in the American Meteorological Society's August 1933 weather review as "one of the most severe storms that has ever visited the Middle Atlantic Coast," the slow-moving weather mass dumped 10 inches of rain a day for nearly a week, even before wind gusts as high as 80 mph and a 7-foot tide arrived.
......................................
The Great Hurricane of 1933, which struck 75 years ago tomorrow, wreaked havoc from Norfolk to Atlantic City and killed 13 people in Maryland. It wrecked Ocean City's boardwalk, flooded the town, demolished whole blocks and cut off its rail and road links to the mainland.'
http://www.baltimoresun.com/news/local/easternshore/bal-75anniversarysto...
Read the whole article - the moral, such as it is, is perfect for TOD.
The models for Hanna are now showing a stall and a turn toward the North. Round and round it goes, where it stops, no one knows.
Yup, just checked out weather underground. All the track forecasters have that big girl taking a right at the Bahamas. Florida getting slapped on both cheeks at virtually the same time. And the Gator State is still under water from Aunt Faye. With luck, if you can call it that, Hanna will have mercy on FLA and save it for further north. I doubt FEMA is ready for that scenario. Blackwater's going to be very busy in Sept. Wow.
Jeff
delay the election?
Hi Expat,
Halifax took a direct hit from Hurricane Juan back in September 2003 (see: http://www.atl.ec.gc.ca/weather/hurricane/juan/#photo). A large sail boat was literally tossed through my neighbour's living room window. I lost thirteen trees on my property but, thankfully, no significant damage to my home. No power for about a week, but others were without electricity for much longer.
We also had a minor run-in with Hurricane Noel in November 2007, but other than localized damage due to the accompanying storm surge and loss of power, nothing too serious.
Cheers,
Paul
Thanks - I simply didn't take the time to search for the information, in part, because 'hurricane' is a bit of an ambiguous term.
We experienced an 'Orkan' where I live in Germany in December 1999, and for all intents and purposes, it was a hurricane. However, technically, it didn't have an eye, didn't involve much in the way of rain or lightning (though the thaw a few days preceding the rain led to very wet soil conditions contributing to the massive number of trees knocked down), and essentially did all its damage over land, more or less intensifying as it went along, not weakening until hundreds of kilometers inland.
For some strange reason, Nova Scotia is never considered by Americans when discussing the Atlantic coast, even though it has the warmest water north of Cape Hatteras, and a maritime tradition as old as any in New England.
I think this is an interesting point. If the projections were actually for a series of storms, each of which could warrant shutting in production, how great would the spacing between storms need to be in order to justify bringing the platforms back on-line, knowing that a new shutdown might be only a few days away? It would seem that there would be costs involved that would have to be balanced against the likelihood of the next storm's impact and current production revenue.
Regardless of any damage, this might stretch the shut-in period to weeks.
That's what I was thinking. A long shut in. I was wondering, if someone more knowledgeable knows, do the warmer surface temps "pull" the storms into the warmer zones, where they then strengthen even more? If so, google "GOM surface temps" and note the warmer temps in the Gulf v. the Atlantic. Even if Hanna runs up the the Atlantic coast, chances are good one of them will visit the Gulf. Either way, Gus is now cat.4 and headed for you know where. That's gonna be bad enough. If you're the praying type, keep NOLA in your thoughts. Could be a last gasp. Good luck Alan FBE. Best hopes.
Jeff
My son just had a pretty decent observation: "If they join together, it'll be like a Category 10!"
I deleted a series of large (old) images below. This comment by Doug Fir was nested in and am copying it here:
"These images of impending doom for Cuba and our discussion remind me of the link on Jeff Masters blog a few days ago.
http://www.theonion.com/content/video/hurricane_bound_for_texas_slowed
What is going on with Cuba with damage projections, how are they prepared?"
Current Key West long range (not large only 40k) live image
Click above for latest loop
Northern eyewall close to clearing Cuba at time of posting.
Cuban weather radar at http://www.insmet.cu/asp/genesis.asp?TB0=PLANTILLAS&TB1=RADARES
The MMS (Minerals Management Service) has started their GOM Newsroom service, which tracks shut in Oil and Gas production before, during, after hurricanes. For those of you who recall previous hurricanes like Ivan and Katrina, the weekly/bi-weekly/daily updates from the MMS after the storm are closely watched by those tracking the GOM's ability to build back production.
MMS Gulf of Mexico Press Releases/Reports Page Page: http://www.gomr.mms.gov/homepg/whatsnew/newsreal/newsreal.html
MMS Tropical Storm Gustav Activity Statistics Update as of Friday, August 29, 2008: http://www.mms.gov/ooc/press/2008/press0829.htm
Bottom line for Oil and NG price movements: after large hurricanes, the weekly/daily MMS report becomes a significant piece of news, in conjunction with the weekly Oil inventory and NG Storage reports.
G
ROCKMAN - in the previous storm thread, you had a comment about the outflow of Hanna appearing to rotate clockwise. I had to go read the Wikipedia Coriolis Effect article about ten times before I got it, but in short, your eyes were not deceiving you. The Coriolis Effect tends to deflect moving air to the right (in our rotating frame of reference here on earth). At the base of the hurricane, air is flowing inwards towards the low pressure, gets deflected right, and thus rotates counterclockwise. It flows up the 'chimney' in the center of the storm, and flows outward in the upper atmosphere, again deflected to the right, but since it's flowing outward from a central point instead of inward towards it, the deflection rightward makes it rotate clockwise. Ain't science wonderful?
Only in the N hemisphere - on the other side of the equator, then everything gets deflected to the left, and so cyclones rotate counter-clockwise.
This indecently is the source of the myth that water goes down a plughole in the opposite direction in the other hemisphere but unfortunately you need a rotating object several (15 iirc) kilometres in size before the Coriolis effect dominates, and not many plug holes are that big (cyclones being the obvoious exception).
You're absolutely correct - the Coriolis Effect works to the left in the southern hemisphere. Based on the Wikipedia article on tornadoes, 99% of tornadoes rotate in compliance with the Coriolis Effect....tornadoes are typically spawned by a rotating supercell thunderstorm.....or "mesocyclone".....so I think we can assume that a scale of a few miles or kilometers is where the Coriolis Effect begins to become significant for atmospheric phenomena.
Thank you for pointing out the Northern-Hemisphere centric fallacy in my original post. This is a great blog, but it is normally dominated by Americans and Europeans. I particularly appreciate contributions from the wider world.
-BK
The current models and myriad track analysis are currently converging on a point of landfall between Houma, LA and Lake Charles, LA. Directly in the center of those two cities is the Henry Hub in Erath, LA , the delivery point for the NG contract that trades on the NYMEX.
Map of Erath, LA
The Henry Hub was flooded in the 2005 hurricane season, but re-opened fairly quickly.
G
So help me understand the engineering and market dynamics of this. IF Henry Hub were to be shut down for a week or longer, what would that do to nat gas flows and prices? (remember force majeure?)
No impact in Texas and points west.
Elsewhere, many users would have to withdraw from their injected reserves.
Alan
Injected reserves?
Could you expand on this? I don't know that I've seen any reporting here on how, and when, and where we keep natgas reserves.
EIA Report:
http://www.eia.doe.gov/oil_gas/natural_gas/ngs/ngs.html
Well, the models are converging on central LA. The storm chasers are all heading there (so fewer updates than usual, because they're on the road).
The 11am update showed the models converging even more, and also showing that hook that could be part of the "nightmare scenario" (depending on where it starts).
The Northwest Hemisphere Hurricane Center thinks it won't start hooking until it's well inland.
The 2pm update is looking pretty nightmarish.
Possibly a Cat 5 (or high end Cat 4) with the eastern eye wall coming very close to BP Thunderhorse...
The 8pm update looks likes the tracks are shifting east a bit.
And the storm's progress has speeded up. Landfall now projected about 2pm Monday. 2am Monday position now very dangerously close to Thunderhorse at Cat 5.
If you are in the storm's projected hurricane warning cone then leave now unless you really understand what's coming and can accurately evaluate your local situation. Don't wait. Of course you will probably survive if you don't but my amateur opinion is better "definitely safe" than "possibly dead".
This is what happened to my faithful little Peugeot (January 2005 in the UK during local winds gusting to 95mph) 10 minutes after I parked it when part of a roof blew off and landed on it. Had I parked it exactly 10 minutes later I would probably have been dead now. Don't take an unnecessary risk.
The 11 pm update shows the models shifting east again.
Looking like the worst case scenario for New Orleans. Derek Ortt says it's like Katrina, only on the west side instead of the east.
Hello TODers,
If Gustav is as big as Katrina when it comes ashore, then significant far inland damage may occur to the power grid and telecommunications [13-page PDF Warning]:
http://www.nsf.gov/nsb/committees/hurricane/3/henry.pdf
-----------------------------
Hurricane Katrina Power & Telecommunication System Failure Modes
-----------------------------
Maybe us TODers can find more weblinks on other areas in Texas. How many windturbines, power towers, genplants, transformers, circuit breakers, etc will get flooded or wind-pretzelled?
If this becomes a significant weather event on up the Mississippi Valley, can we project how many crop acres might get wrecked?
If lots of power lines are blown down, can we project how many hundreds of miles of copper wiring will be stolen to be recycled?
If millions of affected families have emergency household gensets, can we project what % will not be able to get gasoline in an extended grid failure?
In the event of extended failure: should most be forced to ride bicycles or walk, so that maximum fuels can be applied to heavy-duty equipment and repair vehicles to quickly restore the grid?
The water temperatures in the GOM are about 28 to 30 C. That is not as high as Katrina if I recall correctly. Katrina had GOM water at 30 to 33C. However, Katrina was smaller then Gustov when it hit those waters. It was a level 1 when it passed over Florida. Is that right or is my memory bad. I think this will be bad all around.
Yes, Katrina came across South Flordia near Miami as a Cat 1. It caused a lot of flooding in especially South Miami and nocked over an the free-standing under construction overpass West of MIA.
Pete
Katrina was a minimal cat 1 when it entered the gulf. But Katrina had idea conditions, and had several days over the gulf to intensify. Gustav, will have lower water temps, and some shear, in additional to only about two days. It should very probably not be as strong overall (size times intensity), as Katrina.
My last check (2 days ago) of NOAA SSTs showed the path of Gustav to be 29-32 degrees C. Is there a more recent update? If so, I am unable to find it. Could you please show a URL?
Also, note that 26.5 C is the "magic number" for ocean temperatures to feed large tropical cyclone structures. These waters are plenty warm enough as is.
here is the place to go...
http://www.marine.rutgers.edu/mrs/sat_data/?nothumbs=0&product=sst®io...
If the 0200 arrival is correct Gustav will be coming ashore precisely at high tide. Yay for storm surge ... or not :-(
Bob,
Plans are apparently already being made and equipment is being readied to go south to the storm/hurricane area.
I was asked to drive one of our farming semis and hauling our fuel tanker , down to NOLA or close by in Mississippi. This is too ensure fuel supplies to what ever agency is tasked.
We did this for Katrina and it appears they are getting out in front on this one. I am scheduled to pull out this Tuesday or maybe earlier depending on how fast we can rig up the semi and tanker.
Lucky I get to take the tractor with a sleeper cab.
They are asking for a month of duty and it may be more. A nearby heavy equipment company is also tasked to take all their heavy equipment aboard their semis and leave in a day or two.
Speaking of bicycles. I am going to strap my Honda Trail 90 on the catwalk behind the sleeper so I will have some way to get around if the rig is stationary.
Airdale-hoping for the best but glad they are preparing for the worst
this means my garden will grow up in weeds while I am gone and I won't get the last of the produce
Airdale, I am in Logan county, KY right now till Thursday noon. Flying back to Houston TX Thursday evening, would you like me to swing by and pick your produce?
Thanks for the offer. Guess I will let my neighbors take what they wish.
I will pick my ear corn today and store it.
Airdale
Long Live the Trail 90 !
re: crop wreckage
I had similar thoughts. There is a lot of corn that is nearing the
dry stage for harvest. I should think long term rain could ruin a
lot of it still on the stalk. So much for increased ethanol production...
If it's just for ethanol production, I would think wet/moldy corn would be OK. It's the food producers who want it to be at exactly 14% moisture or whatever.
Chuck, (or anyone with similar skills (which is probably < 10)), given what we know now, leaving human and natural ecosystem damage aside for the moment, what would be the worst track for oil and/or gas production? What would be the best? Thanks.
Worst for refineries & infrastructure, up Mississippi River to Baton Rouge, curl south, regain strength, then up Galveston Bay and Houston Ship Channel.
For production, E > W along coast, perhaps 150 miles offshore.
Alan
some of the models are now turning the storm in a uturn fashion towards mexico before it reaches the US, lets hope this trend continues! best hopes alan and take care!
I guess Mexicans are expendable?
http://www.theonion.com/content/video/hurricane_bound_for_texas_slowed
Now we know the Onion goes to the antidoomer to get ideas for their videos!
America's sandbar!
Reminds me of when Pat Robertson had his crowd pray for the hurricane to miss the Carolinas and it veered north to New York!
Nate -Best case is a rightward swerve into the Pensacola or further east area. Then our only losses would be due to precautionary shutdowns. I'd say that's about a 1 in 5 chance of that now.
Worst? Some of our runs based on ECMRF models yesterday were showing Gustav making a direct hit on the LOOP as a Cat 5, paralleling the coast as a fairly strong hurricane, causing damage to a lot of key leases as well as significant onshore damage to multiple refineries, then whacking Houston as a Cat2. That was knocking GOM production down to where it could only recover to 25% production after 6 months, with the LOOP down for 90 days and Houston for 30, and with rain and flooding taking down about 3 million BPD of refinery production a month or two. Odds? Less than 1 in 100, but if you want the nightmare, there it is.
I don't want a nightmare, but thanks for the analysis!
So ceteris paribus (which it never is), stronger, slower and more west = worse impact on oil and gas - weaker, faster and east = lesser impact on oil and gas? Thanks again for continuing to send us all your damage models.... quite a statistical mess until we get closer I guess..
A slight move east (50 to 70 miles ?) would be worse, not better,
Especially for ME !
Alan
Less than 12 hours out, Andrew was moving towards Ft. Lauderdale and we - NW of Ft. Lauderdael - were battened down.
We woke up wondering where's the wind? Well, Andrew did a due West beeline to South of Miami (Homestead). Now Andrew was a very compact storm later upgraded to a Cat 5 at landfall.
So.. Less than 12 hours and a 45 degree track shift - can't remember the forward speed (and too lazy to search for it), but believe it was kind of fast resulted in about an 80 mile lanfall difference. We had gusts up to 60+ in NW Broward, but essentially no damage. Now South of Miami and Homestead, as you know, essentially leveled.
Pete
Andrew was moving at about 17-kt, or 20 mph, due west just before landing south of Miami, FL, according to information from the NHC.
-best,
Wolf
One hurricane - I think it was Charley - had a last-minute change in course and intensity. I think they were expecting a Cat. 2, and it turned into a Cat. 4 and hung a hard right. I was chatting with someone at PeakOil.com and happened to mention that the forecast had changed. She freaked out. She was in the crosshairs with the new course...and hadn't had a clue. (And I didn't even know she was in Florida, or I'd have said something sooner.)
After tracking toward the NNW on a Cuba crossing very similar in location to what Gustav is forecast to do today, Charlie hooked to the NE after about 12:00 UTC on 13 Sep 2004. However, according the Tropical Cyclone Report on Hurricane Charley (PDF) (Pasch et al 2005):
-best,
Wolf
I think it was the jump in intensity that freaked her out more than the course change. She was a long-time Floridian, and a category 2 didn't worry her. When she heard it was going to be more than that, she logged off to nail plywood over her windows.
She was all right, but her neighborhood was without electricity for a long time.
Yes indeed, Charlie underwent incredibly rapid intensification just before landing in Punta Gorda, FL, with a 22 mb central-pressure drop in the six hours 12:00-18:00 UTC on 13 Aug 2004. Sustained winds climbed from 95-kt to 125-kt during that intensification phase. Caught some by surprise, that.
-best,
Wolf
So what's good for our energy infrastructure (or at least not as bad) would be New Orleans' worst nightmare?
A 50 to 70 mile eastward move would, IMHO, be worse for both New Orleans and the energy infrastructure.
Up the Mississippi River is second only yo up the Houston Ship Channel for refineries, and worse for production.
It appears that one of four SPRs will be out for a few days at least.
Alan
If Gustav hits approximately as projected, with NO on the NE side, doesn't this thing have the potential to flood virtually all of the city? I am thinking of the massive storm surge on the NE side of Katrina. Wasn't it something like 30' or more in some places?
Too early for storm surge estimates. Gustav is not that big ATM.
Bob Breck is in t-shirt. Says still LOTS of uncertainty. STRONG recommendation for anyone south of the West Bank to evac. Decision time for daybreak Sunday for New Orleans.
Lafayette and even Baton Rouge "not good places to evac to".
Half of my neighborhood is waiting till tomorrow to decide. Roads likely close mid-day Monday.
Only 22 buses have left train station. People piling up there, post-a-lets being brought in. Contractor that failed to bring in contracted buses causing problems. Many firemen have CDLs, they may keep available buses going out all night (contingency).
Alan
Now officially Cat 4 and still slightly to the east of track.
Alan, are you evacuating? If so, where are you heading?
What about the hit Louisiana, curl back to sea and hit Texas path ?
Alan
Given the dynamics of the situation, I'd think that a direct hit, bounce back off shore, then towards TX would tend to tear up the storm. A gentle offshore curve like some of the models suggested yesterday is worst.
If that happens, we will get a chance to see if 'spare production capacity' in places like KSA actually become production.
I have seen discussion on a slowing that might occur after 48 hours. Where would that place Gustav and what the h#ll will a slowed 4/5 hurricane do to infrastructure if it just sat on it for awhile?
http://www.nhc.noaa.gov/text/refresh/MIATCDAT2+shtml/301500.shtml
Yep, we talked about this yesterday. I honestly don't know. Imagine about 100mi out. just sitting there staring at you.
A stalled hurricane just offshore is NOT a good thing wrt rain and lowland flooding. That was exactly the scenario for Floyd, which ended up putting most of East NC underwater.
Contraflow starts 6 AM Sunday, roads clogged now, but moving (40 mph per reports).
One of 17 pick-up points near me had a crowd (100+ people) at 8 AM, a handful by 9 AM. City buses take them to train station and put on bus or train there. One contractor defaulted on # of inter-city buses and alternative source delivered about half that #.
Official expectation, Cat 4. I suspect Cat 5 in mid-Gulf.
--------
People showing up for "assisted evacuation" are running 30% to 40% above projections which is "stretching resources".
Unsaid is that buses do round trips, once contra-flow goes into effect it will be one last trip out. Low # of buses and increased # of people may require a delay in contraflow, and all night evacs (but CDL drivers have a maximum # of hours/day, 12 I think).
Alan
Hi Alan,
You can see the heavy traffic flow on the I10 here: http://www.dotd.louisiana.gov/press/traffic_cameras/cameras_no.asp?camer...
Best of luck to you and your fellow citizens. Stay safe.
Cheers,
Paul
Traffic appears to be backed up @ Clearview and flowing @ Power. Good resource (during daylight hours).
Alan
DOT regs allow 11 hours driving and a total of 14 hours on duty time in a day. I doubt there will be any DOT truck stops in the area for a few months:(
http://flhurricane.com/cyclone/showflat.php?Cat=0&Number=83405&page=0&vc...
As I posted in flhurricane, the eye is where the hurricane is.
Therefore, according to this LSU gif:
[img]="http://www.esl.lsu.edu/webpics/AOI/00_loop.gif"[/img]
(Don't think I'm using the right code here. Apologees. ;}
Gustav is already to the East of the forecast track.
I may delete that if it slows down server
correct html code is < (nospace)img src="some image">
Yes. Please do it. Didn't know it was loop til
I posted.
Just go here to pick it up if it is deleted.
http://www.esl.lsu.edu/quicklinks/hurricanes/2008/GUSTAV/
Thanx,
James
Errm, you've just hotlinked a 4MB image. Some folks are on dialup you know!
Dial up = poor access to peak oil prep information!!!
(I will take it down after this issue resolves in next hour or two)
I'm fine with it but Leanan would hit Cat 5 never mind the storm if it was posted in a Drumbeat :-) Anyway I'm not seeing image on last couple of refreshes suggesting their server is overloaded. Direct image link is http://www.esl.lsu.edu/webpics/AOI/00_loop.gif if it's not showing up for anyone else.
i took it down - people can go to the link if they choose. thx. (I wonder what % of our readers are on dialup)
SuperG could probably tell you.
About 15% of Americans with Internet access have dialup. We might have more than most, since some peak oilers are living in the boonies, where it can be harder to get broadband. OTOH, a lot of countries have more broadband than us, so our international visitors might bump it up.
I do think we might see a return to dialup as the economy sours. $15/month for dialup vs. $40/month for broadband.
I think coffee, chocolate and alcohol will get pinched before broadband....;-)
Just paid my latest TimeWarner broadband bill ten minutes ago. Increased from $46.95/mo to $49.95/mo!
Fairly 'narrow' broadband is a lot cheaper in the UK.
For 2Mb/sec, phone and cable TV I pay £30/month.
My bill is $29.35/mo in Calgary for wireless broadband.
506 kb/sec download speed as per Pc Pitstop Bandwidth Test
There is a higher speed wireless service at $49/mo, but I find that what I have is enough.
Good time to ask cyberhobbyists this technical/speculative question:
Is there some mild level of societal collapse which would wreck broadband and wireless communication, while leaving dialup standing?
Not sure about the relative costs of maintaining the two systems, I'd imagine it's similar once the technology is in place, might take more energy to produce broadband components though - not sure.
Would electrical grid components be more likely to be stolen, because of higher copper content etc? In that case we might have phone lines but no mains power in certain places... we'd have do get used to using menu-driven telephone systems for accessing our internet information (assuming the exchanges still had power)!
I'm not sure about the relative power consumption of wireless communication, but I get the feeling it's infrastructure might survive better the wired infrastructure - initially at least, as it's more difficult to steal.
Just whimsical speculation though. Any more informed opinion would be very interesting to me!
The opening act of the final war will involve the detonation of a number of airbursts over the target nation.
These airbursts will cause an electro-magentic pulse which will degrade or destroy all unshielded equipment i.e. your computer, your hard drives, your cell phone, the ISPs servers, switches and routers, your bank's servers, switches and routers, the local hospital's servers, switches and routers and so on and so on.
Western society has moved to embrace a digital electronic way of life. Much of that infrastructure will be destroyed at the opening of hostilities. The next wave will be counterforce strikes to degrade the ability of the enemy to respond and the wave after that will bounce the rubble to destroy transport hubs, political centres, and key industries.
If your putative enemy has declared his military strategy to be one of pre-emptive strike then you need to start thinking about how to pre-empt the pre-emption.
My plan involves putting a dottering 72 year old in the White House so that when he gets that 3 am call his immediate response is "Drill! Drill! Drill!"
Don't worry. He would be the one dialing up the Pentagon at 2:59 am to yell "Nuke! Nuke! Nuke!"
It's a fascinating question. One doesn't think of fiber optics and the net as particularly energy intensive, but according to Odum, information is the very most energy intensive task in our society. One would therefore expect it to be among the early casualties of an energy downturn. I suspect that without the various economic worlds to maintain it - entertainment, finance, spurious communications ("Hey I'm in the soft drink aisle...") it is likely on a more tenuous footing than we think. Odum also points out that it's not just the transmission, but the "copy and check" cycle which is very expensive. And if it's not 99.999 then it's not going to be nearly as useful - certainly not for Real ID, medical records and financial transactions. I suspect it will go down sooner than we think because of the 99.999 requirement failing.
Beyond that, lots of the net is paid for with commerce dollars - in my case with clients that ship products by FedEx. When they are gone - and every one is off more than a third in gross sales since last year - then poof, there goes the little bit of the net that my companies maintain.
cfm in Gray, ME
Good point -- the 'net may be more fragile than anyone thinks, and it could be brought down by the failing economy and tottering infrastructure. No need for bombs...
Barring political restrictions, I think the net will be up for a long time yet. We really can run (usable)links over a wet piece of string...
Haha, the most unusual (real) signaling I have heard of is mud-pulse. It's how the ruggedized electronics package in the business end of a modern drill communicates back to the surface.
There won't be many political restrictions on wet noodle signaling, IP over carrier pigeon notwithstanding.
But I could easily imagine the 'net becoming the plaything of an ever-tinier minority, with rapidly declining levels of service for most. If I get in a cashflow-bind, I'll drop my pricy DSL service, for example.
We probably won't go back to town criers until we pass a few more levels of JMG's catabolic collapse.
This is a complex, multifaceted question.
If you look from the user side you have dial up, DSL, cable, and perhaps fixed wireless services, at least at the consumer level of less than $100/month.
If folks cut back on the broadband it makes it harder for the carrier, because those that cut weren't using it all that hard to begin with; the lower volume subscribers go while the relentless file traders remain, using retail bandwidth like a wholesale service, which makes the ISP really cranky.
Staff and bandwidth are the cost centers for the small to medium players with capital coming in a distant third. The capital investment is sunk cost, bandwidth is contractual, so the staff come under the knife first ... then service slides, and if they cut someone key and have an outright outage they end up an acquisition target in short order.
I'm facing an interesting problem in this area right now - got a customer who is multihomed (two upstream providers), one is Sprint, and the other is a not to be named second tier player that just got acquired. The operations of the second tier are being merged into the new parent company and the staff of the two operations do not play well - neither has access to the other side's stuff. We're all but ready to give them the boot. There will be a lot of chaos like this at the peering level as companies discover 1+1 does not equal their salaries + bandwidth costs.
The internet is resilient and a lot of us still remember how to start an ISP from scratch. Speeds will drop but we'll keep it all together ...
If people can't afford access from their homes then they'll either take their laptop to someplace with public wi-fi access, or if they can't afford a laptop then they will go to an internet cafe. There is quite a bit of interest amongst municipal governments in setting up wi-fi networks around town to provide free access to the general public.
A lot of people do that already. If they lose their jobs or are having trouble paying their mortgages, say. They drop their ISP, and instead access the net at the library, or at a job center.
But I think if enough people do that, it will reduce the value of the net. And perhaps lead ISPs to go belly up or pull out of certain neighborhoods.
I also think that a lot of web sites will disappear, or become less valuable. Now, people either pay hosting fees out of their pockets, or depend on ad revenue. Both are very uncertain sources of funding if the economy tanks. Again, this will reduce the value of the net.
The net may survive for quite awhile, but it might end up being more like it was in the early days. More like ham radio than the net as we know it now.
I guess that is unlikely, to have computers you'll need all the (manufacturing) infrastructure needed to broadband, and the investiment for a broadband infrastructre is lower than old voice technology nowadays.
There may be no computers and voice technology, or broadband and VoIP (like we are going into now). I just don't see how we can have computers and only voice technology.
With modern technologies, the networks are increasingly converged. This is a more cost optimised configuration so infrastructure refreshes bring more convergence over time.
With DWDM both data and voice will run on the same fiber over the long haul but on different wavelength. They may or may not separate in metropolitan networks. It is at the local CO I would expect DSL and voice services to split, but they are still colocated in the same building. The only way I could see one service break and not the other is if the telco has to make hard choices on which device they keep powered up. Regular phones are powered remotely by the telco from CO over the phone wires. Broadband modems are powered by the customer at their end. But there are regulations forcing telcos to keep voice services for life critical emergencies like 911. I guess this would be the overriding consideration, but who knows what regulations will look like when things gets there?
Wireless is different. The carrier is a different company and you need to power up transmitter towers on mountain tops and other high places. When the tower is in the boonies, the diesel generator at the foot of the tower is an obvious vulnerability.
Cable modems are also different. The cable company may collapse while the phone company still stands, or vice-versa.
There is also VoIP that runs voice services on top of a data network. Where VoIP is used, you can't shutdown broadband without also shutting down voice and there is no power savings to shutdown VoIP when data is left running. But I don't expect VoIP to be available in the boonies where there is no broadband.
---------------
Update:
I forgot to mention. Dial-up services is data information modulated into an analog voice signal. At the CO, all analog voice is converted to 64Kbps digital signals and fed to a digital network. This is why it is possible to converge voice and data networks. They are all digital except for the "last mile" wire between the CO and your home. Eventually the voice service connects to a modem bank that exchange the dial-up data with the Internet infrastructure.
DSL is digital signal over the same phone wire. It lands on the same CO as voice where it connects to the Internet infrastructure. The differences between dial-ups and DSL are not that great. It is hard to imagine a scenario where the telcos are compelled to shut down one service and not the other unless the power is so constrained at the telco that they need to selectively turn off hardware.
The Australian federal govt is offering free satellite dishes (worth about $A2700) to residents in broadband 'black holes'. The catch is that the ISP deals are lousy and they recommend you keep a fixed landline for emergencies such as severe weather. That works out about $A100 per month for crappy service ie a low use land phone and 1.5Gb limited internet via sat. Some say wireless towers will have diesel backup but severe storms and fires could still take them out.
Not available at time of posting
The best go off first. Socially, politically, economically.
Across the board. Vertical and horizontal.
The proof is in the LSU site "Not available at time of posting".
Just when we need it.
Gustav's a black swan on the track and intensity it's at now.
Don't get too excited about that unless the trend holds. Storms often do a wobble (like a spinning top) around the track, especially when nearing land masses. Contrary to the nice neat lines we show on maps, storm tracks in the real world are very messy. -- Chuck
It's a great animation, thanks.
What are the vulnerabilities of Houston to a hurricane, and how damaging would a hit on that city itself be to the oil and gas industry, as presumably many of the headquarters etc are based there, so perhaps damage might cause difficulties in co-ordinating any recovery to damaged oil infra-structure?
a good map:

IN addition to surge, I wonder if Henry Hub could withstand 30 inches of rain in 3 days?
Just an FYI that my son and others he knows received this email apparently from a list he forgot he was on (long story). I did ask him to verify that it was not SPAM and he claims it is not.
Actual email had fancy BW logos, etc on it.
FWIW,
Pete
Great news that the profit from disaster vultures are flying in. This is sick.
This is the miracle of the marketplace:
Police state on demand!
Of course it goes away when you don't demand it anymore, right?
Toto, methinks we are not in Kansas anymore.
And this is part of how FEMA intends to handle this? I mean really! Alex Jones will have a baby. This is so totally bizarre it's hard to believe. "...now I'm steppin' into the twighlight zone...". Put your arms in the trunk when you leave, and don't come back till the goon squad's gone.
Jeff
What's with the selection of states? "Alaskans need not apply."
It's real.
Haven't changes been made by Bush & Co in the last few year to laws regarding states of emergency in the event of natural disasters? Including the ability of the executive to take control of national guard and/or to deploy federal troops in a state of emergency and making SoE a much easier option for the executive in such a case.
If several hurricanes hit GoM in the next few weeks, hitting oil/gas facilities, will evacuees end up in KBR built camps? will there be an election around the corner?
I don't think these outcomes are probable but under current US law they are very possible.
Here's a link to some maps from Rigzone: http://www.rigzone.com/news/hurricanes/gustav_map.asp?m=All
(updated 21:00 EST 8/30) Forecast GOM Production Estimates based on various track models
Official Forecast Track
Best Objective Track
Alternate Scenario 1 Track
We hope that you will help us spread around this coverage of Gustav to every website and friend that you know. We do not ask you this out of ego, but out of a chance to educate as many people as we can.
Gustav could be another key event in the advent of peak oil. The more people who can understand the tenuous balance between supply and demand, and what an outage like this means to that balance, the better they might be able to understand our situation.
Will Gustav Hide the Real Peak in World Oil Production?
It certainly has the potential! Anyway the spice must flow. And who knows who will be the losing bidder in the following war for gas, US has a lot of dollars in case they don't just print them. IMO the true concern should be about the US economy already unstable.
Who knows, I'll wait for the events to unfold!
Hi everyone. Here's the latest plot of hurricane Gustav's maximum wind speeds and central pressure:
The magnitude of the recent strengthening to Cat-3 is quite evident in the figure. Maximum winds, as of 15:00 UTC 30 Aug 2008 were around 110 knots (~125 mph, ~205 km/h) with gusts in the vicinity of 135 knots (~150 mph, ~250 km/h). Gustav is a truly major storm at this point.
The rapid fall of central pressure seems to have slowed as of the 15:00 UTC report, dropping by a millibar during the previous three hours, as opposed to 1-mb/hr for the 24 hours up to 12:00 UTC. In essence, the rate of Gustav's intensification appears to have slowed for the time being. However, this may be a temporary pause. Once the storm clears Cuba (Gustav is expected over the island within 12 hours), the NHC forecasts Gustav to re-intensify to perhaps sustained winds of 120-knots (~140 mph, ~220 km/h) within 36 hours of present time.
-best,
Wolf in YVR BC
The track for Hanah has been revised as it seems to be heading towards the GOM between Florida and Cuba with 50 mph winds. It has not shown much strengthening this hour as it is yet over the Atlantic and has not hit the high energy warm waters of the Carribean or GOM.
The NHC shows the expected track of Gustav to be towards the Louisiana coast. Too early to publish damage reports.
I'm getting a little busy myself, it seem Hanna is coming to visit.
NHC has it about 35 miles south of me in 96+ hours as a TS and AccuWeather has it as a cat 2.
oh well, let me go put out another anchor
Ed
joybells.posterous.com
if you're staying (?!), tell her we said "Hey" and to work on her size a little bit. She's getting a little big for her britches too.
Be safe.
Yes, I'm staying, not sure if I will stay on the boat or not? If 90mph winds are forcasted for my area then I'll move into a friend's house for the storm.
I normally lose my internet connection during a storm as they turn the power off on Great Exuma but I will still have my Ham E-mail, it's slow but almost always works.
I hope Hanna don't follow Gustav into the Gulf as Katrina did. Katrina formed just to our southeast and passed over on it's trip into the Gulf
Ed
Boat? Hurricane? Sounds like a fine idea. What could possibly go wrong? ;-)
Here is a loop of the GFDL 128 hour loop. Looking like that 'nightmare scenario' might be greater than 1 in 100....?
(Here is the HWRF loop)(EDIT: HWRF....updated. 904 AT LANDFALL -that would be bad. Like old testament bad.
Wow... Looks like the run shows 930 mb minimum, and slowly degrading to about 947 mb at landfall. If this model verifies, Gustav would be, roughly speaking, Cat-3 at LA landfall (batten down, New Orleans), and probably Cat-4 as it "drills" through the offshore FF production facilities.
-best,
Wolf
According to this site Sub 920 is Cat 5.
Yes, indeed, given uncertainties in weather-forecast model runs, it appears that Gustav does have the potential to reach Cat-5 after crossing Cuba (if not before, given the recent rapid intensification!), or at least get quite close.
-best,
Wolf
NHC now projecting officially Cat 5 possibly imminent.
http://www.nhc.noaa.gov/text/refresh/MIATCPAT2+shtml/301805.shtml
Weather Underground tracking graphic (see image at top of this page) now updated with latest info.
Much of the focus above is on production but I wonder about the impact on imports. I have some gaps in my knowledge base, others here will know the answers to my questions.
What percentage of US Oil imports come through the LOOP and through other offloading points in the path of the storm?
Is it primarily Mexican and Venezuelan oil that comes into the LOOP?
Can tankers from Venezuela head to other offloading points on the east coast? (I know Hanna might impact that scenario)
Similarly can Mexican oil be routed up the west coast or through a pipeline with spare capacity?
Thanks
LOOP is the only supertanker oil port on the USA East Coast.
Alan
I think that the big threat from the storm(s) is to the product supply and distribution network.
WT - could you please expand on that?
Assuming that we can move oil from the SPR sites, which might be a short term problem in some areas, we have plenty of oil (for the short to medium term). But we don't have an SPR for refined product (other than a small heating oil reserve in the Northeast I believe). So, any releases of refined product from emergency reserves will have to come from Europe.
Assuming a Minimum Operating Level (MOL) of 170 mb for gasoline, we have about 60 hours of supply in excess of MOL nationwide--some areas have more than 60 hours, some have less. We have already seen some spot shortages at the ends of pipelines. As people rush to refill their cars, as the refineries shut down and as consumption soars in the coastal areas, we are going to very quickly see spreading shortages, with no quick or easy way to bring in product--we will have to wait on shipments from Europe. Now, I would assume that all other operating refineries in the US will go to maximum capacity, which will help to some degree.
As noted above, the really grim scenario is a chain of storms hitting the US--especially if most of them, or all of them, hit the Gulf Goast. I foresee two interrelated problems--widespread damage to the refineries and to distribution systems and widespread damage to the electrical grid, which will have an adverse impact on gasoline distribution, and which will take a very long time to fully repair.
For what it's worth, I'd say there is at least a one in three chance the LA SPR won't be available for upwards of a month, based on inland damage to power supplies and pipelines.
-- Chuck
How will this affect European ability or willinhness to ship refined product?
Russia may cut off oil flow to the West
I think it's just saber-rattling. They've since said that they aren't going to cut off the oil.
BTW, are you the Rumspringa who used to be a news editor at PeakOil.com?
I truly am not a conspiracy theorist - I know too much about our other cognitive shortcomings to have to believe in conspiracies. But...come on.....Russia threatens to restrict oil shipments on the precise day of a Cat 5 storm in the Gulf of Mexico???? Mr. Putin is no Mr. Rogers.
Kinda feels like when I was in 7th grade and a bully 9th grader pinned me to the ground locking my head between his knees, embarrassing me in front of cute girls, and THEN taking all my lunch money....
Pssst! It's not on the same day. That story is the headliner on Thursday's DrumBeat. It's old news. The Russians denied it the next day. Which doesn't mean it wasn't intended as a threat. But it was not made today.
Ok. I didn't know that. But Mr. Rogers would call Mr. Bush now and offer shipments of refined product. I doubt Mr. Putin will make such a call, and davemart below points out the reasons. (however, WE did know about this storm on Wednesday......)
Nate - you say you are not a conspiracy theorist. I can only conclude that you have minimal insider experience of politics/campaigning and the so-called justice system. In the real world (rather than your naive imagination) conspiracies are the norm, just about everything in politics is conspiracy. Just the latest example from the uk, the closure of loads of post offices (which no one actually asked for or was ever in any party manifesto), the final confirmation thereof has been released just now in August, the ever favourite month for such corrupt goings on (because opponents are away on hols).
I could deluge you with a ton of proof of numerous other conspiracies, nothing very fantastic, no need for bilderbergs or illuminati, just plain simple liar-crooks called national leaders, honourable blah-blah etc. You could google "Public fraud initiative" for just one (of the simpler instances, of which the uk prime minister is guilty) if you can spare time from your naive quests! An important part of the media's constant propaganda deceit is its constant portrayal of "conspiracy theories" as the exclusive province of half-wit nutcases.
There's no conspiracy needed. Just a willingness to push for advantage when weaknesses crop up, and Putin knows that they are going to happen more and more as fuel gets tighter.
The game plan has to be to detach Europe from America, and use the new partner of Europe as something of a counterweight to the Muslim populations of central Asia, and of course China.
Longer term, with it's own fuel supplies getting tighter, and it's awful demography for the Slav population from a power point of view, Russia is in a truly lousy strategic position.
It's something of a use it or loose it situation for Russia as well as the US.
And, Putin has claimed that the whole crisis was cooked up by Bush as a means of influencing the election. So this could be electoral payback.
Well see below Russia is doing it all the time see Czech, Estonia in May 2007 not mentioning Ukraine.Of cource never oficially stating it and always using e.g. technical issues as the reson but nevertheless the implication of it all is the very same. Bet we'll start to see significantly recuced flows to Polans early this week due to some "technical" challenges
Please don't post entire articles.
The link to the same article is posted up thread. That's what started the discussion.
After Katrina the US relied heavely on destilate delivery from Europe. Europe certainly then had excess capacity and thus it was able to ship it over to the us. In conjunction to this a coordinated release from the strategic petrolium reserves was orcestrated. I do recall that I have seen articles about this and that for sure Japan, Europe as well as the US opened up their reserves.
1.Any comments on what today is the status regarding possible excess production capacity of destilats ww? Is there any worth mentioning?
2. Has these SPRs releses in conjuction to Katrin been refilled as of now or are we at this point at record lows also regarding ww SPRs? Implications of this then would be to what extent these reseves could be used to limit possible damage cased this time.
Hurricane Katrina made landfall on August 29, 2005, leaving behind considerable
devastation. Some onshore refineries were shut down in advance of the storm; others
remain down now because of the widespread interruption of electric power and flooding.
Assessment of damage to oil and gas production rigs, as well as refineries, continues.
Some operating refineries whose crude supply has been interrupted are borrowing crude
from the Strategic Petroleum Reserve (SPR). On September 2, the International Energy
Agency (IEA) announced a coordinated drawdown of European and Asian stocks
totaling 60 million barrels to be released at the rate of 2 million barrels daily. Some
refineries have resumed operation, but at reduced runs. A number of major refineries
remain shut. The Louisiana Offshore Oil Port (LOOP) resumed operation late
September 1, and is accepting crude oil imports. The Colonial pipeline, which supplies
refined products to regions of the South and Northeast, has resumed operation and is at
100% of pumping capacity. The industry advises that it may be months before the area’s
oil and gas production and refining are fully restored. Spot and futures prices for
gasoline and middle distillates rose sharply in the days following the storm, but prices
began to fall early the week of September 5. This report will be updated."
http://www.fas.org/sgp/crs/misc/RS22233.pdf
Gustav headed for current that fuels big storms: 'I hope this thing doesn't really explode,' says expert after overflight
Cat 4 over Cuba, this bad boy is pretty powered-up now. When the GDFL and the HWRF agree that that bad things are coming, it is time to notice.
So what is located in western Cuba? Is La Habana the same as Havana? If so, Gustav is going to do serious damage there...wow.
BBC just had a live report from Havana. Winds already gusting to about 60mph. Eastern eye wall will come within maybe 30 miles from Havana a few hours from now- likely with winds gusting well over 100mph in Havana itself. I am not a meteorologist but I think that's the general forecast right now.
100,000 people live on the Isle of Youth which has just had the western eye wall of a strengthening Cat 4 smash straight through it.
Thanks for the information.
Checking the weather conditions for Havana International Airport (MUHA):
12:55 PM EDT: NE 24 mph gusting 37
13:39 PM: NE 30 mph gusting 48
13:55 PM: NE 33 mph gusting 55
14:55 PM: NE 36 mph gusting 51
And the latest observation, 15:55, shows:
75ºF with a 72ºF dew point, ENE 33 mph gusting 48, 1.86 miles visibility in heavy rain, with the altimeter at 29.44" (station pressure 29.225"), or 997.0 mb, and falling 0.06", or 2.0 mb, in the last hour.
-best,
Wolf
Here's the graph from Wunderground for Havana Airport
Latest update shows pressure still dropping but not so rapidly. From Google Earth it looks as if the airport is about 50 miles from the eye wall. Probably approaching closest point within next hour.
Thanks for posting the graphs. Looks like Havana had a glancing blow, with maximum gusts around 58 mph. Widespread, but generally light damage, is the likely result of this level of wind. Given Gustav's track, it appears that the hurricane was still relatively compact at the time of closest approach to Havana, at least in terms of the seriously destructive winds.
-best,
Wolf
Latest from BBC live report from Cuba (at 0000 GMT/UTC/Zulu -8pm EDT) . Isle of Youth, virtually all main roads flooded, considerable damage, death toll not yet known. Havana (pop 2 million) however has escaped the worst of the storm.
If nothing else the Cubans are remarkably good at dealing with major hurricanes. When they say move the people move, so no great loss of life.
wow...I was sitting around with my weekend warrior friends this morning and made a comment about cheap rooms available in the N.O. Nary a one of them was aware of this weekend's potential excitement. Point is that I find it hard to believe how far PO is off most people's radar, but then I have an experience like this morning's perspective and wonder what chance we have!
-dr
Regarding the price of crude oil, I've been reading that if the refineries get damaged, there will be less demand for crude and the price would fall. However, isn't crude fungible unlike NG? If the US refineries are shutdown, wouldn't refineries elsewhere around the world need to increase capacity in order to ship finished gas & diesel products to the US? Doesn't that balance out the demand for crude? I thought part of the Peak Oil concept is that we are right at the intersection of supply vs. demand and any disruption in supply would cause prices to jump up. Is this a scenario where both supply and demand drops?
Gustav a Cat 4 at 1:20PM EDT
http://www.nhc.noaa.gov/text/refresh/MIATCUAT2+shtml/301718.shtml?
Wherever you read that, never follow that guy's investment advice.
In any case, the hurricane is expected to take out production as well as refineries. Prices might have fallen short-term if the hurricane had fizzled, but not with production getting taken out along with refineries.
I don't know if its true for crude, but after Katrina prices became pretty distorted in the processing chain dependant upon availability of processing capacity. If no one can process your stuff, price goes down. The customer at the end of the chain will pay more, but not everyone in the chain will be able to raise prices. Things should sort other time, especially as imports will start to come in after the usual shipping delay.
Ok. If this verifies we are missing 35 million barrels from what otherwise would have been produced from now until year end. There are 121 days left in year, so this leaves a shortfall of 290,000 barrels a day at least until year end. Is this a big deal or not? Where is that going to come from? Higher prices? IEA member countries? Strategic Petroleum Reserve?
And 200 BCF gone in NG production is not alot. But if everything else was the same (i.e. weather, weekly injections/withdrawals), it would be enough to take us below the 5 year envelope for least storage at 12/31/2008....makes me root for some sunspots...
In normal times, I think it would be worth an initial jump of $10, plus bonus points for a drop in the dollar, assuming there were no withdrawals from the SPR.
One thing that complicates the calculation is that commercial users really seem to want to get and keep inventory down to the bare minimum--meaning roughly the bottom of the 5-yr average. I wouldn't be surprised at all, even without withdrawals from the SPR, to see them use this drop in production to get inventory down from the middle of the 5-year average to the bottom of the average September/October annual lows.
It depends partly on what's in the import pipeline, and whether we can still offload it reasonably smoothly. Commercials certainly haven't been buying as if they were worried about falling below the bottom of the five year average in the weeks ahead, not even leading up to the hurricane. If we return reasonably quickly to normal offloading of imports, or even if there are headlines assuring everyone that everything will be normal quickly, my gut feeling is that we would see the price firm up and then start moving up slowly.
I haven't really thought through an all-out disaster scenario.
Also, I really don't see conditions as normal--I see the elections having a great deal of influence on prices right now. For example, I wouldn't be surprised at all if Bush was deliberately flicking boogers at the Russians (the whole Georgia hullaballoo) just to churn up a reaction from Putin to prop up the dollar and the stock market and weigh down oil prices.
First of six Amtrak trains left with @ 1,500 people to Memphis. Wheelchair and other special needs passengers.
Alan
Hanna then Isidore followed by Josephine. Seems we're getting busy?
http://www.nhc.noaa.gov/
I love the first week in September better than Christmas. That HWRF model appears to be saying, "Oops--hitting land too fast. Let me go back and get the rigs I missed."
2 pm update:
Just became a cat 5 storm.
Who says?
FYI-it is a Cat5. http://www.cbsnews.com/stories/2008/08/30/national/main4400711.shtml
First time one of my posts has been edited.
just tryin to help.
It was a good upgrade-one of these days I need to learn how to format properly.
Thanks! But I thought Cat. 4 was over 155 mph winds?
A mistake, or are they doing it by pressure or something?
I think that is a typo, and you mean over 155mph is category 5:
http://www.nhc.noaa.gov/aboutsshs.shtml
There seems to be some confusion about as the quotes I have seen are indicating winds of 'only' 145mph, but refer to Category 5.
Perhaps they have not updated their wind-speeds, or alternatively are being leant on to call it a Cat 5 to get people to evacuate.
It's possible that someone read "knots" instead of "mph" for the maximum sustained winds of 145 mph (145 knots would be ~165 mph, well into Cat-5). Just a thought.
-best,
Wolf
That story is incorrect. They have officially projected a Cat 5 but not calling it that just yet (unless in the last few seconds). Although an official upgrade could come any minute.
yeah, I changed the intro to the post...folks over at easternuswx.com agree with you. Not there yet.
This is bizarre. What happened to Nate's post? Now it looks like Brian is replying to me, when he was replying to Nate. I didn't know it was even possible to do that.
Anyways....
Gustav strengthens to a Category 5
Still wondering if he meant the forecast, rather than the current situation.
dunno. weirdness abounds today.
I was replying to you.
wunderground says Cat 5 means >155 mph.
I'm shocked (shocked, I tell you) that one of our major news organizations doesn't know that.
I think there's an announcement from FEMA forthcoming, they jumped the gun. That's over at WUnderground too.
well none of the major news organizations understand something as simple as Peak Oil so you should not be surprised.
I also forgot that 145 wasn't cat 5. It sure sounds big/fast.
From the Houston Chronicle:
Four potential scenarios for the Cat. 4 Gustav
pray for wind shear.
unless you live in Alabama/Missisippi and/or don't believe in prayer.
Shear helps everyone, cause it kills the engine of the storm. But if you ask me he is pumping up the ridge to the north blowing out the upper trough. If that trough can get around and ventilate the storm watch out. Not that I am any more than a monkey with a keyboard.
That's an unusual combination.
Dude,
The ULL is retrograding http://www.ssd.noaa.gov/goes/east/gmex/loop-wv.html. If that guy ends up SW of our friend then shear becomes outflow.
Jeesus! I only went out for a couple of hours and now its a cat 5 already. What they feeding this thing? Is that some kind of a record?
Have they called for a mandatory evacuation of NO?
The link is here somewhere, but there's a hot-spot of deep, warm water that rapidly powers up tropical cyclones. Katrina and Rita hit it and Gustav is on track.
No! He is not cat 5 at the moment, but cat 4 someone somewhere messed up. He does have a 939.4 mb pressure from latest recon.
This is a graph that was posted by ace on thread 2, showing historical oil US oil production in the Gulf of Mexico, and his forecast of future oil production in the Gulf of Mexico. The US total crude oil production is about 5 million barrels a day, so production from the Gulf is about 28% of that total. Some production was offline for several months after Hurricane Katrina.
This is a graph I made of federal offshore natural gas production in the Gulf of Mexico. State offshore natural gas production is not available monthly, but it isn't very much. Adding Texas and Louisiana state offshore natural gas would only increase the total by about 5%. Gulf of Mexico natural gas (federal plus Louisiana and Texas state) currently amounts to about 13% of US natural gas production. When Katrina hit, we lost the equivalent of about one month's natural gas production.
Gail, thanks for these v. informative graphs.
Below is an excerpt from the WSJ Digital Network Marketwatch (in case you've not seen it)
reporting Jeff Rubin's view on climate impacts' advancing the peak of GOM production.
___________________________
"Gulf of Mexico oil production - supply likely never to reach pre-Katrina levels.
NEW YORK, Aug 29, 2008 -
With Tropical Storm Gustav bearing down on the Gulf of Mexico and most weather agencies calling for an active hurricane season, American motorists should brace for gasoline to spike to $5 per gallon as storms threaten to shut down oil production in the region, predicts a new report from CIBC World Markets.
The report notes that oil production in the rig-dotted Gulf, which has been seen as America's best hope for greater energy self-sufficiency, will be increasingly threatened by severe storms that continue to grow in frequency and strength in the region.
"Only three years after hurricanes Katrina and Rita devastated Gulf of Mexico oil and gas production, an emerging hurricane storm is tracking another potentially lethal swath through America's energy heartland," says Jeff Rubin, Chief Economist at CIBC World Markets. "And with both oil and gasoline inventories much lower than when Katrina and Rita hit, the price consequences could be even worse this time. Any replays of the 2005 storm season could see gasoline prices soar to $5 per gallon."
While Mr. Rubin acknowledges that the supply disruptions, and attendant price hikes, will be temporary, he sees lasting impacts from hurricane damage on future supply growth. "Protracted multi-year delays to marquee projects like BP's Thunder Horse have meant that new production has grown at a fraction of earlier projections for the region and has lagged well behind rapid double-digit depletion rates that are characteristic of offshore fields.
"The net result has been a multi-year, and now likely irreversible, decline in oil production from the region. Already down some 300,000 barrels per day from its pre-Katrina peak, Gulf of Mexico production is likely to lose another 200,000 barrels over the next five years. Instead of ramping up production to over 2 million barrels per day as once dreamed by the Departments of the Interior and Energy, Gulf of Mexico production is likely to fall to a low of a million barrels per day by 2013 - almost a third lower than the region's production prior to the 2005 storm season."
http://www.marketwatch.com/news/story/hurricanes-threaten-gulf-mexico-oil/story.aspx?guid={41C86796-C1E0-4118-A532-BF4A00E4D1D5}&dist=hppr
______________________________
If Rubin is right, this would be the clearest evidence to date
of intensifying climatic destabilization of oil & NG supply,
with the unremarked feedback loop of increased coal-power pollution as NG gas price rises.
So how credible is Rubin's perspective in your view ?
Regards,
Backstop
The oil and gas production in the Gulf will be declining in the years ahead, with or without hurricane activity. Hurricanes will only make things worse. In those places where production in declining to the point where extraction is now only barely profitable, the owners are likely not to make repairs. This will hasten the downturn in production.
I think Rubin is probably right in his production forecasts. I wouldn't venture a guess as to whether or not it has anything to do with climatic destabilization. If we look back over history, climate has never been very stable.
Your remark "If we look back over history, climate has never been very stable"
seems surprisingly relaxed for a professional actuary under current circumstances.
No doubt you well aware of the IPCC reports wrt intensifying climate destabilization,
but perhaps you are unaware of the research by Munich Re (the leading global re-insurance service)
showing a clear multi-decadal trend of an exponential rise of global weather-impact losses
at over 6% per year ?
The report to which Rubin refers is unequivocal with regard to extreme weather events
having advanced the peaking of GOM output, i.e., they are not guessing.
Regards,
Backstop
That is reason enough not to continue with our climate experiment of emitting more CO2 into the atmosphere which will kick us into another climate state we did not have in at least the last 500 K years.
However, the last 10,000 years or so of the current warm period - in which our civilisation developed - have been remarkably stable. Climatologists are only now discovering how sensitive climate can be. The CO2 pulse which we humans have injected into the atmosphere has never happened before and will soon destabilize the climate to such an extent that we'll all notice it. Likely flash point will be the disappearance of the Arctic summer sea ice in the next years which will then speed up the disintegration of the Greenland ice sheet.
Arctic sea ice now second-lowest on record
http://nsidc.org/arcticseaicenews/
http://www.livescience.com/environment/080827-greenland-ice.html
NASA climatologist JAMES HANSEN:
http://www.abc.net.au/7.30/content/2007/s1870955.htm
Ace, where did you get the data from? I checked your link (http://tonto.eia.doe.gov/dnav/pet/pet_crd_crpdn_adc_mbblpd_m.htm) but the data there does not match your chart (at least directly).
Khebab,
The production data for the USA Gulf of Mexico is the sum of the following:
http://tonto.eia.doe.gov/dnav/pet/pet_crd_crpdn_adc_mbblpd_m.htm
PADD III - Federal Offshore (PADD 3) Apr 08 was 1,350 kbd
State Offshore Production Louisiana Apr 08 was 26 kbd
State Offshore Production Texas Apr 08 was 2 kbd
Total USA Gulf of Mexico production for Apr 08 was 1,378 kbd which includes shallow and deep water production.
The remaining proved reserves for the above was calculated as follows for Dec 2006:
http://tonto.eia.doe.gov/dnav/pet/pet_crd_pres_a_EPC0_R01_mmbbl_a.htm
Federal Offshore Gulf of Mexico (Lousiana) 3,500 mb
Federal Offshore Gulf of Mexico (Texas) 155 mb
Louisiana State Offshore 48 mb
Texas State Offshore 3 mb
Total remaining proved reserves Gulf of Mexico 3,706 mb or 3.7 Gb which includes shallow and deep water.
The data above is sourced from the EIA. The US Minerals Management Services also provides data and analysis on the Gulf of Mexico oil production.
This report titled "Deepwater Gulf of Mexico 2008: America's Offshore Energy Future" contains some useful information.
http://www.gomr.mms.gov/PDFs/2008/2008-013.pdf
The chart below is from page 68 and separates shallow water and deep water oil production, on an annual basis. The 1985/86 peak of just over 1 mbd, in my forecast chart, was due mainly to shallow water production (less than 1,000 ft or 305m water depth). The June 2002 peak of 1.73 mbd was due mainly to deepwater production increasing sharply from the mid 1990s.
http://www.theoildrum.com/files/gustav.gif
The chart below shows that shallow water production is declining at a high rate and deepwater production is unable to compensate for shallow water decline. As deepwater production is likely to fall, total production continues to decline.
More than 75 percent of Gulf oil cut off as energy companies evacuate because of Gustav
Uh-oh. Thanks for the update.
So much for those "Gustav won't pose a problem for oil production" dismissives I've been reading in the papers for the past two days.
Moral of the story: just like with Peak Oil - it pays to be prepared and not deny reality.
other moral of the story - people won't react until they see a smoking gun (aka steep discount rates)
I'm sure last year a hurricane with Gustav's track would have sent prices soaring. Something weird is going on; it's like the closer our country approaches disaster, the less alarm people exhibit.
For examle, after 5 years of angsting about the mess in Iraq, and several years of growing concern with a possible bombing of Iran, we now are sliding effortlessly into a new Cold War with Russia and not a soul seems to mind. Even if we accept it as necessary (which I do not), why aren't we running around making plans for the enormous costs and military commitments? In 2003 the Bush regime at least bothered to lie about the cost of the invasion of Iraq, and bothered to prepared exile puppets like Chalabi to be installed in power. This time, it's very probably the conflict that will wipe out our last chance of saving much of anything, and no one thinks it's worth any planning, much less protest.
Same for the incoming mortgage resets, the trembling edifice of Fannie Mae and Freddie Mac, and the winter home heating crisis. We are taking our hands off the steering wheel and turning off our brains.
This is called cognitive dissonance - Jared Diamond gave an example in Collapse. I wrote about it as part of our Belief Systems
Or , maybe somethimg weird is going on. Don't forget "confirmation bias" ;-)
I have a friend who is a psychologist who trades in the markets. He calls this cognitive conservatism. Essentially, too much information at a high rate cannot be processed and so the behavioral response comes later, with a delay. You see this as well in the markets when a strong run of very good news takes place. Participants become confused and will often not push prices higher until weeks later. We're seeing the same now with bad news. We have bad financial system news on top of bad energy supply news--the response is to not react to either.
It's fascinating also, to me, that a convergence of fundamental themes--in particular this series of hurricanes and their exposure of our fragile energy supply--are coming together as we roll into September. July and August especially have been times when markets are often pushed in counter-trend fashion. This July and August were classic examples. It has to do with the fact that the trend is followed by many into the end of the first half of the year, and then participants go on holiday. So you get reversals in everything.
There's an incomprehensible amount of capital that is currently hiding in the US treasury bond market. When the lagged effects of this Summer's cognitive conservatism are released, I look to the T-Bond market as the source of capital to get things going.
G
ya this makes sense...!
Regarding the very near future of electrical costs:
I just received my monthly magazine from our Electrical Coop. The front cover had a newer cover pasted over the top of it...it read in huge bold letters: ENERGY CRISIS.
The content inside stated clearly that our rates are going to be increasing very dramatically and appears to me that TPTB as the coop are getting their ducks in a row in order to deflect future cries of anger at the increases.
Most due to the rapidly increase in coal prices as most all , but a bit of hydro, our generation is with coal.
I have never seen them issue such warnings of this magnitude in the past. As I stated earlier...all our power is purchased from TVA. No nukes involved. Two dams...one on the Cumberland and one on the Tennessee to generate some of our power but mainly all the rest is coal. Driving thru the heart of Ky you can see enormous coal shovels , if they aren't hidden out of sight as is usual. In the mountains one can see the results of 'mountain top removal' which is simply rapidly destroy the land and nature. Google Silas House and Mountain Top Removal. He is a writer and environmentalist who lives in the Blue Ridge Mtns.
For the addiction of energy we are quite simply destroying the earth at a rapid pace. In my area the smoke of burning dozer piles of trees is always on the air. All to clear land for more corn and grain crops.
Airdale
From Jeff Lindner, a meteorologist in Houston:
Generic SLOSH forecast for a Cat 4 Hurricane
Yikes. I guess that's what they meant when they said "Baton Rouge isn't far enough."
Speaking of storm surge and damage, we're showing 25ft peak surge and around $15 Billion in onshore damage if the levees hold, $47 Billion if they don't. I'm voting they will if landfall is on the current track, but a few more miles east and unfortunately NOLA will be a bathtub again.
The storm is slightly east of the forecasted track right now.
The Weather Channel reported that some areas along the Interstates in LA are out of gas.
Local stations in New Orleans run out and are resupplied within an hour or two. I topped up with 5 gallons today, no problems. no line.
Alan
Yesterday I thought Nate posted a link to a Cuban Radar map that linked to about 8 different Cuban Radar stations Now I can't find it. Please repost thanks.
http://www.insmet.cu/asp/genesis.asp?TB0=PLANTILLAS&TB1=RADARES
Interesting that Cuban radar feeds have stayed up (including the Isle of Youth station that had 140mph winds over it) with only minor outages.
Thanks: What a senile old fool I had it saved already just didn't recognize the address. That radar staying up surprised me too. I'm about 1.5 miles SW of 30N and 95 W
Things are looking better here by the hour!
Came back from Nebraska for my grandaughters birth today. Quite an eventfull day.
Cuba may not have alot of infrastructure, but what they do have is built to last.
TOD is on twitter and friendfeed: http://twitter.com/theoildrum and http://friendfeed.com/theoildrum
the official reddit link for us now is: http://www.reddit.com/user/MrUniverse/
give us a follow.
Being a data and science nob for over a decade and heavily involved in flight sims which used satellite data I decided to create site to prove the impact of warmer water on storm strength via LIVE data feeds so EVERYONE could see for themselves.
The summer of Katrina months before Katrina was born I created and have always used Http://www.globalboiling.org to be able to very accurately and very long ahead of the forecasts get a good sense of what the strengths of storms will be when they hit the gulf.
The reason is because it combines both outside the gulf up to the minute satellite photography with current water temperatures of the day.
Russian shipping routes: Incidentally you can also see from the live radar ice measurement of the north pole that ships can now as of ***just a few days ago*** navigate the complete northern coast of Russia and the ice isn't finishing melting yet. I have no idea what that shipping route means to oil supplies but perhaps someone here can analyze that particular impact.
Back to the storms -you can easily "eyeball" where the storms are heading and based on the water temperature in their paths see whether on not the storms are likely to be mild or strong. You can also see storms way way out in the Atlantic forming long before they appear on a TV network. For example there are now 4 ***FOUR*** low pressure areas lined up in the Atlantic including the two storms. You can also see storms forming in the Pacific that will impact chip fab plants in Asia and even storms hitting Australia in our winter. You can also easily see that there are a huge number of tropical storms or hurricanes these days that you would never know about from watching the news because the press doesn't talk about them unless they are going to impact USA land.
While watching this since literally just before Katrina hit when I created the site I find that -just as with this storm- the weather service for some reason always tends to predict a lower strength than seems likely by looking at the water temperatures.
At least until the storm gets into the gulf and then they revise upward.
However an observer could have seen two days ago (and I told my brother in Florida) before the Gustav storm crossed the Cuba land mass that the water everywhere in the gulf was near the hottest on the graph and therefore this storm would most likely be a stronger one than 3.
I never predict things but it is unusual to have four low pressure areas lined up in the Atlantic.
Also from watching the reaction of the water temperatures for years be aware that when a hurricane passes over the warm water is actually takes some of the heat out of the water and this is noticeable on the water temperature charts. It then usually takes a couple of days for the water to "Rewarm" so if storms come too close together the second storm won't hit the same hot water the first did. But if there is enough time between them it can hit the same amount of hot water or even hotter as it might be a week later in the heating season and then the second storm can be stronger than the first.
It's an art but you can get pretty good at "eyeballing " future storm strength probabilities without any computer model. Just the loop for the path and then look at the amount of hot water ahead of the path.
It's a free site. I created it to educate people with their own eyes about what seemed to me to be the very obvious correlation between warmer water temperatures and hurricane strengths at a time when it was still being heavily debated which seemed like nonsense to me.
Go for it.
Check the records, George, the decade of the 1930's was the hottest on record and produced just as many hurricanes as this decade. If water temp were the controlling factor then hurricane prediction would be a snap. But it isn't. The experts like Prof Gray are still getting a lot of egg on their faces by making pre season predictions.
It isn't about the numbers of storms and I am not going to argue global warming with you here.
What anyone can see from the page is
1. storms forming way out in the Atlantic.
2. the temperatures of water where the storms may go.
Using that information people can make their own earlier judgment much EARLIER than official warnings that a storm with potential for a lot of strengthening may be forming based on the temperature of the water in its path and seeing storm masses form earlier than they are usually reported.
Many factor affect whether storms will form.
However it is easy to see for yourself that if a formed storm hits hotter water it will grown much greater in strength than if it hits cooler water all else being equal and that is easy to see on the page. If you look at the page regularly you can stay ahead of the forecasts.
This is an important effect, and it has a couple of consequences. One is that the depth of the pool of warm water is important -you won't be able to directly discern this from water temperatures. The second is that if a strong hurricane is traveling too slowly, it can exhaust the oceanic heat content under it, and thus weaken.
But, seriously, I think you are trying to predict too much, using only one of many significant effects. Wind sheer, or slots of dry air sucked into a storm can negatively impact the storm, even if water temperatures are high. It is not yet pinned down what the net effect of global warming on cyclones will be. Most general circulation models predict greater wind sheer (on average) for the Atlantic basin, and this should work to reduce Atlantic hurricanes. OTOH, it could mean that the rare storm that gets a very favorable atmospheric environment will still have warmer water to feed off of, so perhaps the trends for the most powerful cyclones, versus the number of them will respond differently.
I actually include a current wind shear zone graphic on the page as well. I didn't want to get that much into explanations.
I was keeping the explanation as simple as possible but if you load the page you will see most effects are accounted for .
And I clearly said I don't do predictions period.
People can look at everyday's current water temperatures live THEMSELVES and see the storms reactions.
By the way I don't say water temperatures increase the NUMBER of hurricanes that will hit land.
What I do say is that -as anyone will see for themselves when they start regularly watching the page- when a storm is well formed comes into a hotter gulf the storm's strength will be many times stronger than if that area of water is cooler.
I wouldn't presume to distract you from your research. All basic reseach deserves our respect.
However, if you review some of the modeling horspower of epic proportions at http://www.gfdl.noaa.gov/products/vis/gallery/index.html#hpc and still realize how impossibly difficult such as task is even with blank check budgets and your own fleet of satellites, I can only wish you the best of luck in your endeavor.
It's certainly not impossible that you may find a simple solution, in which case, a trip to Stockholm would not be out of the question. Review the models and see what they're missing.
Respectfully,
j
There is something we shouldn't forget.
The human visual system when trained with complex patterns of input (like examples of water temperature plots of the gulf and hurricane reactions) can out perform all modern (known - not top secret) analysis computers.
In fact our brain is several orders of magnitude better.
Anyone looking at the page two days ago just as I did and with a history of watching the page could have predicted the strength of this storm better than the National Weather Service did.
In plain English that means if your brain sees accurate visually dense input it can more correctly deduce a more correct output than any known modern computer.
Your brain is especially better than computers when analyzing things in motion since your brain integrates motion in a parallel process that is incredibly efficient. (That is why I include the gulf satellite real time loop).
It doesn't mean I'm good - it means we are ALL good if we just see the data in a good visual way which is why I devised the site.
Trust your brain. :-)
Thanks for your site and efforts George.
A couple of comments:
A lot of the talk here has been on the lines of 'worse than Katrina' or 'worse than 2005', but from the charts on your iste it looks as though temperatures in 2005 were considerably warmer over a considerably larger area than in 2008.
Would this be a fair conclusion?
Secondly, you have said that you do not do predictions.
However, you are making a few statements here which are eminently testable, and deserve testing.
Your hypothesis is that human's can integrate early data far more efficiently than early computer projection, and that it is not just you that can do this, but anyone with some experience of looking at the data.
This does not strike me as an unreasonable position, and testing this is both trivial to do and important in it's implication.
Published predictions are precisely the way to do this, although of course it would involve people putting their necks on the line! :-)
The potential public benefits of this surely mean that it is w worthwhile effort though.
Regards,
Fujiwhara effect
When the cyclones approach each other, their centers will begin orbiting cyclonically about a point between the two systems. The two vortices will be attracted to each other, and eventually spiral into the center point and merge. When the two vortices are of unequal size, the larger vortex will tend to dominate the interaction, and the smaller vortex will orbit around it.
http://upload.wikimedia.org/wikipedia/commons/b/b2/Fujiwhara_interaction...
The NYMEX has announced that it will open electronic trading 3.5 hours early tomorrow at 2:30pm, Sunday 30 August. The regularly scheduled open would have been at 6pm EST, tomorrow.
http://cmegroup.mediaroom.com/index.php?s=43&item=2700&pagetemplate=article
G
I'd say that means a spike.
Moe -If LOOP is down, I can't imagine the implications...(But Im going to try to start to define them) What % of our imports come through the LOOP facility?
I believe that LOOP pumps 1.2 million b/day.
What is important is that uses tankers that cannot off load elsewhere in USA. Tankers are enroute from Persian Gulf, etc. headed for LOOP. They will have to divert to EU I guess.
Alan
Well I suspect the oil can be transferred to smaller tankers and offloaded elsewhere.
However its not clear what will be left operational in the Gulf after this storm. Probably refining storage etc will be damaged enough that even if you could offload you would have no where to put it.
They pump 1.2 million barrels a day and it has been shut for a while.
However, they also have upwards of 54 million barrels of storage and will be pumping to their customers for quite some time with or without new tankers, presuming the refineries are open. I concede it is not ideal, but it buys time for GWB to get the SPR going which can cover releases of up to 4 million barrels a day. And I'm quite sure GWB will release the oil with a long winded speech entitles, "See, I told you so.".
Regardless, between this confirmed 1.2 million off-line and the MMS confirmation of 998K off line so far, tanks are draining at the rate of 100K barrels an hour.
Here is the source for the LOOP storage. Hang in there Alan. Don't be a hero.
jt
http://www.loopllc.com/f1.cfm?n=1\
Helpful, jteehan, thanks.
I'm thinking don't underestimate our ability to patch something together short-term. A lot of minds are going to be very focused.
As part of thinking through what might happen, look at some charts of oil, gasoline and natural gas right after Katrina. Spike up, spike down (SPR release), and everything back on track to wherever it was going before the hurricane. (Actually natural gas floated around up high for a while before coming back down.)
What if there is a Force majeure on the Oct '08 contracts? Would the front month contracts decline/collapse because they can't be delivered but the Nov, Dec, and Jan contracts spike because there will be delivery, albeit at a reduced supply?
I don't think there's such a thing as force majeure on futures contracts. If a party can't deliver the physical barrels, he has to buy his way out.
NYMEX declares 'Force Majeure' on natural gas contracts - Aug. 29, 2005
Yes, but if you read that closely, it just meant delivery was allowed to be rescheduled, or moved to a different location. It didn't release people from the obligation to deliver or buy their way out. So, it wouldn't have much effect on the price. See what I mean?
the latest (00z) NOGAPS and GFDL show a direct hit to New Orleans.
What happens if Mississipi River is temporarily unnavigable? I.e. does anyone have knowledge or expertise on depth, siltage, crop shipments, supply impacts, etc. This is beyond my ken - but the models have been shifting slightly east and getting slightly stronger all day - this is another angle we need to understand.
Where are you getting the 0z GDFL, the only one I know about is almost a day old? The 18Z GDFL is still currently to the left http://moe.met.fsu.edu/cgi-bin/gfdltc2.cgi?time=2008083018-gustav07l&fie.... The nightmare scenario is if it is more to the right of that path and takes the west hook due to the oncoming continental ridge.
There is a *lot* of confusion about model run times, and a lot of mislabeling. Here's a brief summary - for the mets out there, I know this is over simplified, but hopefully the idea gets across. There are essentially four types of models:
1) "fast" models, like the BAMx, LBAR, and statistical models, that run quickly. They use the big global runs as boundary conditions, and given the latest coordinates they give outputs in minutes (or seconds). So if it's 00z, we have these models normally by 0030z.
2) Global models. These are the big general circulation models that forecast weather, like GFS (aka AVN). I'm lumping in other regional models like NAM here. They take several hours to run. The 00z model usually isn't avalable until 4-5 hours later at the earliest.
3) "complex physics" models. GFDL and HWRF are most well known. They take several hours to run as well, and are not normally available at forecast time.
4) "interpolated" models. You can take a complex model like GFDL, and "shift" it so that the forecast position at some time matches the current position. GFDI and HWRI are the interpolated versions of GFDL and HWRF respectively.
So, at 00z (8pm ET), the position fixes for the storm and synoptic data are fed into computers. The "quick" models churn out new forecasts, the big models start, and the interpolations are run. By 02z, the forecasters are putting together the "package", using the quick models, the raw and interpolated models from the previous run (18z), and
a Ouija boardexpert judgement. In many cases, the "old" complex physics models are more accurate than the "new" quick run models. For Gustav, that hasn't been the case, but for most storms it is.Confused yet?
Chuck
Excellent. I always wondered about the models and why they put what time they were run (started, as I see now) on the maps. Thanks.
That helps clarify a lot of confusion. Thanks.
And thanks for giving TOD a window into your forecasts.
Question: Do any of your models show where an Alan Drake will be at about 0600Z on Sep 1?
Cheers!
Not any more.
Thank you sir,
j
We have three 300' wide 100' deep shipping channels in the Mississippi River by New Orleans. Reduced depths to 80' are possible.
Alan
Please explain
a)what does 80' are possible mean?
b) why in the hell you are still there?
Drifting sediment could fill the bottom 20' of the channel, reducing a 100' channel to 80' clearance. Not much more is likely for the center of the 3 channels.
I am packed but trying to convince some others to go out with me. One agreed so far, hope to get a couple more.
8 PM update went past my decision point. Likely leave Sunday PM.
Best Hopes,
Alan
I remember TV footage of highways jammed and people going nowhere. Gas stations quickly ran out of gas.
Kibitzing Welcome
North Shore (of Lake Pontchartrain) is usually seen as "safe shelter". I assumed not this time, confirmed that storm surge of 12' to 17' is possible.
I had assumed chances of re-entry back into New Orleans was 90+% no later than Tuesday. Now perhaps 50%.
All nearby shelter possibilities from people I know are at risk for prolonged power outages, or worse. Nearest hotels Tennessee & Arkansas.
I am thinking of taking I-59 (towards Meridian) and stopping at Mississippi "Welcome center" (close but far enough away, about 6 miles inside MS). Wait there for Gustav to clear & re-enter New Orleans. Public rest rooms, a/c. If path goes east, head towards Meridian.
If I go Sunday PM, roads still likely clogged. Midnight roads clear, but that may be too late.
Alternative is take Causeway (world longest bridge across lake Pontchartrain). No congestion. They want you to take I-12 West to I-55 North. IMHO, too close to Gustav path.
I am thinking of taking Causeway and then taking I-12 East to I-55. Longer miles, shorter time.
Anyway, trying to figure minimum distance away 9assuming outer edge of tornado belt is OK, hurricane tornadoes are usually small weak F1s).
Anyway, any thoughts ?
Alan
Can't advise on exit strategy... others can provide valuable input.
Just get out of there. We'll hear from you when you reach safety and higher land.
Godspeed & bonne chance!!
No offence Alan but if you are asking for advice from the TOD community regarding evacuating NO then you are fast approaching a FUBAR situation. Just get your a#s outa' there and stop f##king around! : )
Don
P.S. Thanks for the on the scene updates. Reminds me of that news reporter who stood on the buildings in Tel Aviv during the first Iraq war describing incoming scud missiles : )
I would leave at 3 Am this morning if alone, and drive to parents in Kentucky (2 days). But I want to convince one last person (or two) to go with me. One signed on already.
Sunday early PM will still be passable, 3 AM Monday unlikely.
Alan
Alan, if you are cutting it that fine I would try to choose a route which had interim, fairly secure points on it, to cover for mishap, something going wrong with the car or whatever.
Hopefully you will be travelling in convoy?
Best of luck,
Hustle their butts and give yourself extra time.
Don't put old man Murphy - as in Murphy's Law -- to the test.
I don't worry easily and you're starting to make me worry!!
Seriously go at 3 AM if possible. Just get out of there.
My prayers are with you,
Tom
I would drive to Natchez at 3:00 Sun AM-I guess that is way too far. Their forecast is 25 mph winds, 220 ft elevation.
Alan:
Professional Kibitzer here...
I've not had any experience with a hurricane evac, but if you've made the decision to leave, then I'd say get going. Tomorrow morning, early, at the latest. With the storm track apparently (for now, at least) shifting a little eastward, I'd expect you'll see even more evacuees, and if it happens to go any further eastward you've got more distance to cover to get to a safe area...
Shorter time of travel is better, over a little more distance, assuming you've got the fuel range (stop and go traffic plays havoc on fuel economy, as I'm sure you know) for getting out of the congested areas. After that, straight paths are good...
Stay safe,
-S5
My efforts to get one or two more out require a later start (other than more stop & go traffic, not that big a deal). My estimate is that half have left already, and we are just now at the point where we were when the alarm for Katrina was issued.
My car got 30 mpg in 8 hours of stop & go traffic for Katrina and I have about 25 gallons (in tank and cans). Range is not the issue.
BTW, Tangipahoa Parish has issued a mandatory evac order for 10 AM Sunday south of Highway 22. They are in NE corner of Lake Pontchartrain and this is HIGHLY unusual.
Storm surge on North Shore looks very bad apparently.
Levees south of West Bank are short and almost certain to collapse. Core of New Orleans looks much better ATM.
Best Hopes,
Alan
http://www.tangipahoa.org/
Alan, I'm not expert in disasters but as a technical project manager I have prepared for a lot of critical deadlines. My advice is:
Most likely you already know this stuff. Too many times, however, I've seen things go to hell when people allowed enough time, knew no showstoppers, and planned for the best.
Good luck and godspeed!
The Peak Oil Manhattan Project (or whatever it will oneday be called) needs you!@!!
Not to threadjack, but is there any reasonably likely plan for such a thing?
Not yet but Congressman Roscoe Bartlett has been calling for it for at least 2 years, perhaps longer. We may be too far gone (e.g. too much in the talons of economic mantra) for such a focus occur - but it was only 2 generations ago, when inspired people made sacrifices in order to push their country through difficult times. I have a hard time visualizing that now, but people always surprise me - on both the upside and the downside...
Hi Alan,
Here's the data on hurricane Katrina for Mobile Regional Airport, AL (KMOB):
Katrina's center passed about 85 miles west of Mobile. Two-minute average winds of 54-63 mph with gusts of 70 to 83 for about five to six hours is a pretty serious hit... Combine that with saturating rains that weaken soil cohesion, making trees more prone to toppling from root failure. If I were planning on being east of the storm's center, then I'd try to get out beyond about 100 miles.
-best,
Wolf
No help with info, but my brother, his partner and family are apparently heading all the way to Ohio... I'm guessing they are making a vacation of the event.
So far as I know, they are already on the road.
Cheers
Crop impacts due to hurricanes?
With Katrina it caused a hell of a huge backup in barge traffic here. I live near the confluence of the Ohio,Mississippi,Cumberland and Tenessee rivers.
A lot of residents in my county work on the river..thats how close we are.
The nearby grain companies have offload facilities right to the river and barges. If the barges stack up then problems with storage start to occur.
If the river traffic is screwed up then shipping costs start to go up.
And our corn harvest is poised right on the edge of beginning very shortly. Luckily in the concern I work at we didn't plant as much corn this year as we have in previous years.
Yesterday I took a bike ride thru the heartland of Ky. Thru immense fields of corn and soybeans. Huge amounts of new acreage have 'come on line' as of this year due to the runup in grain prices.
A nearby neighbor just finished a 600,000 bushel grain bin install. We are putting up 4 more grain bins at this very minute. This is a result of the big costs of late in storage at the graineries. Bunge,CGB,ADM..et al
However eventually the grain must move and mostly down river. Cost far too much to truck it but it must be trucked to the graineries and this is where the huge price increases in road diesel fuel input their costs to the increase in grain prices. Its a positive feedback loop of its own making,so to speak. A year of so back I spoke to drivers who were making about $500 per day hauling grain as fast as they could. They spent many hours in their sleepers waiting at the grain bins overnite. Sometimes the lines took two hours to get thru.
Right now this nations grain harvest is set to kick off. We are gearing up as fast as we can. Storms in the GOM are a big problem for river traffic. We have to tie up everything here upriver if there is a big halt.
The events in the GOM have effects that ripple upward all the way to the heartland.
Airdale
Mandatory Evacuations
8 AM Sunday West Bank New Orleans
Noon Sunday East Bank New Orleans
8 AM Sunday West Bank Jefferson Parish
Voluntary East Bank Jefferson Parish
NOPD is considering evacing some of the police force.
Airport closes at 6 PM Sunday
Assisted evacs continue till midnight tonight in New Orleans, restart tomorrow from 6 AM till at least noon.
Alan
It is pretty close time to get out. Look at the upper trough http://www.ssd.noaa.gov/goes/east/gmex/loop-wv.html, it is melting away like butter. I can't see the shear coming in.
Since we didn't see any posts from you this afternoon, I had hoped that you were on the road. I would count on your house being under water, so the logical place would be your parents' house. Or you are welcome to stay with us in Dallas if you wish. In any case, I would head out early Sunday morning, especially since contraflow begins at 4:00 A.M. If your friends won't listen to the advice from the mayor at this point, there is not much you can do.
Most of Plaquemines Parish Fire Department evacuated a few minutes ago. Three units left till tomorrow PM and then they will evacuate as well.
Bulk of NOPD may pull back as well.
Alan
Thunderhorse was damaged during Hurricane Dennis, a strong Cat 4 storm that formed during July of 2005. There was a leaky pipe that allowed water into a floatation hull causing it to list. Faulty plumbing was blamed rather than the fury of the storm. It took three years to repair the damaged rig. The Thunderhorse project began pumping oil this summer. It was designed to produce up to 250,000 barrels per day. There are numerous GOM oil discoveries in deep waters that have not been developed yet. The fields were on the order of hundreds of millions of barrels of oil per field.
The post-Katrina rig protection modifications will soon be tested.
Drill here, drill now!
Um, except when a hurricane is approaching.
Think we can get all that on a bumper sticker? (leave off the "um," it makes me look like a redneck)
Put all the current weather information through my personally developed hurricane projection program, and the basic landfall information is as follows, as of 7:14pm PST on 8/30/08:
A. 928 millibars (Camille 905)
B. Cat. 5 (wind 165 mph with 190 gusts)
C. Width: 145 miles (smaller than Katrina)
D. Landfall: 10 miles West of NO
E. Time of landfall: Mon. 10:45 pm EST
F. Est. Damage: 28.3 Billion
Note: Levees will be breached, but surge will only be approx. 40% of Katrina.
I don't understand:
"D. Landfall: 10 miles West of NO"
On my map that is 50 miles north of the coast.
What am I missing?
But thanks for the info.
Mandatory evacuations to begin Sunday morning in New Orleans
As I said up the thread, it seems possible to me that we could see most of New Orleans under water, when one considers the storm surge on the NE side of Katrina.
At this point it is an absolute disaster for coastal communities, and almost certainly for West Bank (spared in Katrina, they shot at New Orleanians trying to walk to bus pick-up spot for white Rs), they are likely going to be a mess.
North Shore is becoming alarmed at storm surge.
Levee failure in core of New Orleans is less likely.
It is possible that almost every area will be flooded in either Katrina or Gustav but very few flooded in both.
You will likely see a different demographic on the rooftops.
Alan
As long as we don't see YOU there!
Trust your gut and play it safe.
Get some rest and TLC in Kentucky...
or check out westexas's pad in Dallas.
Best hopes, as always,
Tom
good luck alan...
Alan, it's coming in on the high tide, the moon is new and only about three weeks out from perigee, could be a king tide on top of storm surge. GTF-OUT.
what was the thing in the middle?
Perigee? - moon's orbit elliptical, apogee is when moon is farthest from planet, perigee when moon closest, close moon implies greater tidal pull on oceans, same with new moon - it is conjunct the sun and they both are exerting gravitational pull on the oceans in the same direction increasing the size of tides.
This could be a perfect storm. If it gets over that hot loop current without deflection then the models have got it.
From Matt Simmons:
Shannymara from PeakOil.com created this map.
It shows the forecast path overlaid on oil infrastructure and current weather.
Newer infrastructure is darker gray/black. Only active platforms and pipes are shown. She is planning to update it with current radar, weather plots, and forecast as Gustav approaches.
Edited the link to point to the new, permanent location.
She added a script that auto-updates it every 10 minutes.
The web site is starting to hang, ads.pointroll.com st.blogads.com Not a good time for this. I suspect it is on;ly going to get busier here.
Don
lots of images. lots of viewers. we will start new thread tomorrow and it will run smoother. Unless we get picked up by CNN or some such...
As of midday Saturday, slightly more than three-fourths of the Gulf's oil production and nearly 40 percent of its natural gas output had been shut down, according to the U.S. Minerals Management Service, which oversees offshore activity.
The U.S. Gulf Coast accounts for about 25 percent of domestic oil production and 15 percent of natural gas output, according to the MMS. The Gulf Coast also is home to nearly half the nation's refining capacity.
http://news.yahoo.com/s/ap/20080831/ap_on_bi_ge/gustav_energy;_ylt=Av1uv...
Gustav has now cleared Cuba, and the relatively short trek overland sapped a bit of the hurricane's strength:
Now, the storm moves into the open GOM. Renewed strengthening seems likely in such a conducive environment. At 03:00 UTC 31 Aug 2008, the NHC is going for 135-kt (~155 mph, ~250 km/h) sustained winds at 00:00 UTC 01 Sep 2008 (in a low-confidence forecast).
Best of luck to you, Alan, and for all who are in/have-been in this storm's path.
Wolf
ibiseye.com have got Gustav turning left into the hot loop current a little.
CNN just showed theoildrum twitter comment on the air.
Yeah saw that one. Rick Sanchez of CNN mentioned "TheOilDrum" live on the air as he began to explain the danger that Gustav poses. Obviously some news reporters have heard of TOD.
I hate these "we told you so" moments. It would be much better if there weren't any.
Glad to see you still posting Step back. Your insight here has been educational over the years.
Agree with you on the I told you so's. It seems to be taking an inordinate amount of time for the MSM to sort out where the scientifically valid information can be found when putting a story together.
I just added a side by side Gulf ocean temperature comparison between current gulf temps compared to the temps one day before Katrina hit in Aug of 2005. It's scary!
http://www.globalboiling.org/#Seatemps
(it take a while 20 to 30 secs to load the page even on fast connection so be patient - there is a lot of data on that page!)
Katrina entered the gulf at a much lower strength than Gustav is STARTING to enter the gulf.
Am I right in reading it as slightly cooler than it was when Katrina formed?
At 4:00 A.M, 8/31, Gustav had 125 mph winds, a Cat. 3 storm.
http://en.wikipedia.org/wiki/Saffir-Simpson_Hurricane_Scale
NHC 4:00 AM Advisory:
"...THE LATEST MINIMUM CENTRAL PRESSURE REPORTED BY AN AIR FORCE RESERVE
HURRICANE HUNTER AIRCRAFT IS 958 MB...28.29 INCHES.
AN EXTREMELY DANGEROUS STORM SURGE OF 18 TO 25 FEET ABOVE NORMAL
TIDAL LEVELS IS EXPECTED NEAR AND TO THE EAST OF WHERE THE CENTER
OF GUSTAV CROSSES THE NORTHERN GULF COAST. A STORM SURGE OF 1 TO
3 FEET ABOVE NORMAL TIDE LEVELS IS POSSIBLE IN THE DRY TORTUGAS AS
GUSTAV PASSES TO ITS WEST..."
The central pressure has lowered since it was a Cat. 4 hurricane.
The good news. It looks like Gustav will top out at Cat. 4. Not enough time to strengthen to Cat. 5.
The bad news: it's now headed directly at New Orleans, and is expected to make landfall as a Cat. 4. This could be worse than Katrina, both for New Orleans and for oil production.
Gus might need some Viagara. Down to 120 mph 960 mb
Heading out to Hattiesburg MS mid-afternoon.
I-10 East along coast shut down, but I-59 open.
Mandatory evac for East Bank Jefferson parish.
*IF* Gustav stays @ Cat 2 till 11 AM CDT, likely not to strengthen
Alan
Alan:
Godspeed and good luck :)
I understood from the news that the hurricane is moving rapidly (close to 16 mph)! I have no experience with hurricanes so; I ask the people here can be a cause that is not gaining strength, does anybody know the correlation between the hurricane speed and shore impact/ hurricane speed and wind speed, category etc. Can he gain strength if he will move slower ?
Not an expert but hurricanes go through eye wall replacement cycles as they wobble. The tend to lose intensity, or not strengthen as expected when they do this. An eye wall replacement cycle in combination with going over land (Cuba) could have reduced intensity more than expected but this is likely to be a short term situation.
I interpret that the land magnified a decrease in intensity that might have occurred anyway. I am expecting quick strengthening once over top the warm loop current.
(Welcome: we are now on a later and more updated thread, which can be found here: http://www.theoildrum.com/node/4472 NB: you may want to just go the front page (it will be post #1 or #2) to get to the most recent thread: http://theoildrum.com ...)