Predicting Future Supply from Undiscovered Oil
Posted by Sam Foucher on November 26, 2008 - 10:05am
"Now what is the message there? The message is that there are known "knowns." There are things we know that we know. There are known unknowns. That is to say there are things that we now know we don't know. But there are also unknown unknowns. There are things we don't know we don't know. So when we do the best we can and we pull all this information together, and we then say well that's basically what we see as the situation, that is really only the known knowns and the known unknowns. And each year, we discover a few more of those unknown unknowns."
Optimistic Scenario
The shock model will then smooth out, shift and spread over time the original discovered volume. This transfer function simulates the effect of the necessary extraction infrastucture that has to be planned and built transforming the original discovery strike. An important parameter in this model is the average time delay for each phase (planning, building and maturation). We assumed 3 years for planning and building and 2 years for maturation. With these assumptions, it takes an average of 8 years between first discovery well and the time oil production is mature and reaches a production plateau. In addition, it is very likely that this average time shift will get larger in the future because of the increasing remotness and technical difficulties of new projects as well as the recent hostile investment environment.
Once the
developed discovery volumes are simulated, production can be derived
by assuming a fixed extraction rate. Here, I used the extraction rate
value (0.0466) derived by Andrew
Pickering from an anlaysis of the relationship between proven
reserves and production.

Figure 1. Optimistic scenario with a constant discovery rate of 10.7 Gb. Discovery data from the ASPO.
Discovery data is quite noisy, so we repeat the same procedure several times and take the average (Monte-Carlo procedure):

Figure 2. Results of the Monte-Carlo estimation (500 runs), the dotted red line is the average annual discovery volume (10.7 Gb/year). The extraction rate is K=0.0466. Data for this figure in ascii format here.
We can see that under the optimistic scenario, we can reproduce total extraction over the period close to what the IEA is proposing. The difference may be that their extraction rate is higher and dependent on the producing region.
A More Realistic Scenario
When we look at the pattern of oil discoveries over the previous century, it is obvious that we are in the tail of the discovery curve: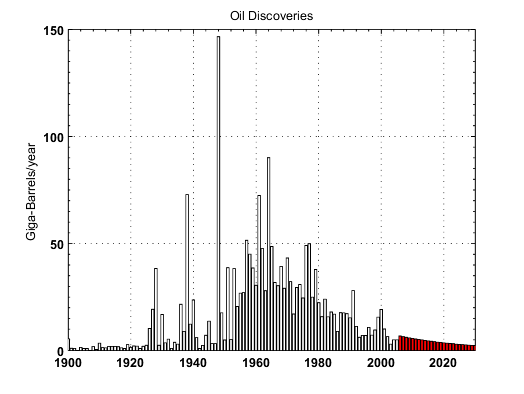
Figure 3. Backdated oil discoveries (conventional crude oil and NGL) according to the ASPO.
Therefore, it seems logical to impose the same decline pattern to future discoveries resulting in much lower flow rates.

Figure 4. Results of the Monte-Carlo estimation (500 runs), the dotted red line is the average annual discovery volume. The extraction rate is K=0.0466. Between 2008 and 2030, a total volume of 144 Gb is discovered, 113 Gb is developed and 44 Gb is produced. Data for this figure in ascii format here.
What are the Extraction Rates?
For most countries, the average extraction rate based on published proven reserves is around 0.05. The extraction rate is the rate at which oil is extracted from reserves. Deepwater fields with highly productive horizontal wells can reach 0.09 and giant fields are around 0.02, based on published reserves (which may be overstated). At the world level, it is unlikely that the extraction rate will go beyond 0.05. Assuming that the IEA forecast is true, what could be the extraction rate values behind this forecast? based on the two discovery scenarios described above, we can retrieve the corresponding extraction rate profiles.
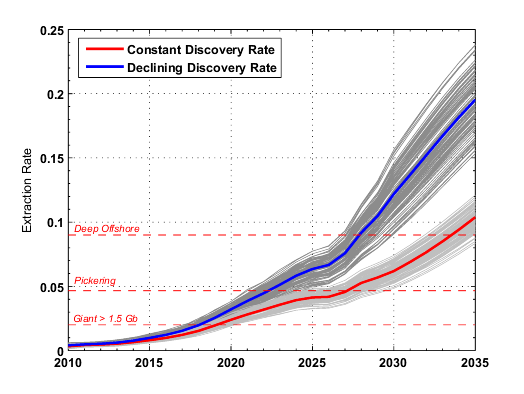
Figure 5. Estimated extraction rate profiles derived from the IEA forecast. The dotted lines are showing typical extraction rates.
Looking at the range of extraction rate values under the discovery decline scenario, it is unlikely that this steep production curve can be achieved.
Potential Impact of Project Delays
In the above simulations, we assumed an average of 8 years between oil discovery and a mature production. The production levels are strongly dependent on this average time, a small average time will result on a fast addition of new reserves and high flow rates can be achieved. On the contrary, large values will constrain production levels. Figure 6 below, is showing the impact of the average build time on the projected 2030 production level. Under the constant discovery rate scenario, the IEA forecast seems to be consistent with short build time around 3 years. When discoveries are declining, the flow rates are already constrained by declining reserve additions so fluctuations in the build time have a lesser impact.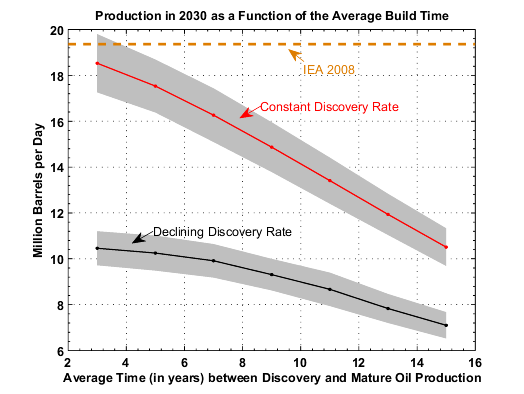
Figure 6. Impact of the average build time value (in years) on the 2030 production level. The gray areas are the 2 standard deviation bands (75% of probability).
In Summary
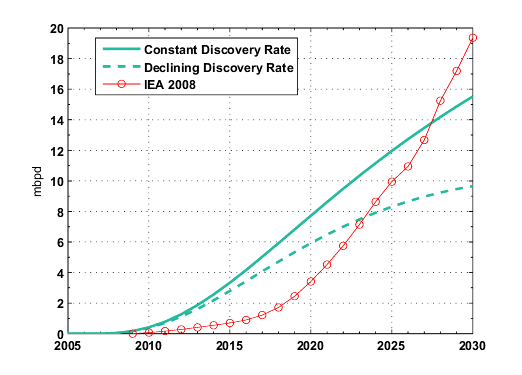
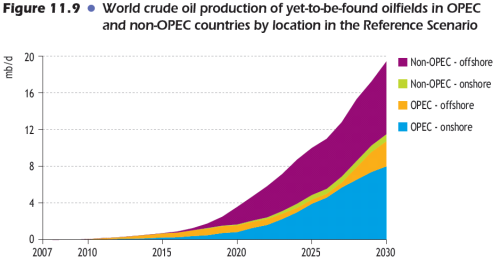
Figure 7. IEA forecast for developed YTF along with our two scenarios.
A few thoughts:
- The IEA report is all about expected production by year, with it being important to their story that production not decline before 2030. The IEO WEO 2008 forecast production for 2030 is 19.4 barrels a day. With the realistic estimate, the expected production in 2030 is only about 9.6 million barrels a day, and with the optimistic estimate it is about 15.5 barrels a day.
- The IEA provides few details about what is behind this forecast.
- A total of 114 Gb given by the IEA for YTF does not make a lot of sense, it suggests a 5 Gb/year discovery rate. The developed amount will even be lower than that around 90 Gb. It is very likely that 114 Gb refers to the total developed YTF for 2008-2030.
- The steepness of the IEA forecast requires high extraction rates (Figure 5) unless it is based on at least a steady rate of new discoveries around 10-11 Gb per year.
- The declining discovery rate scenario (Figure 4) does not support production going beyond 10 mbpd in 2030.
- The combination of the current financial meltdown, collapsing oil prices, technical challenges of new projects is pointing toward higher time lags for the different oil development cycles. This will contribute to further lowering the amount of developed new discoveries.
Contact
- Content: editors at theoildrum dot com
- Tech support: support at theoildrum dot com
License

This work is licensed under a Creative Commons Attribution-Share Alike 3.0 United States License.
Thanks for doing this analysis, Khebab.
Bringing this one step further, given that Pickering calculates his a in the formula below:
(where P is production, R is reserves)
to be:
OPEC: a= 0.0096 mbpd/Gb, b= 0.2323 mbpd
Fringe: a= 0.0466 mbpd/Gb, b= 0.093 mbpd
Small Fringe : a= 0.0435 mbpd/Gb, b= 0.0418 mbpd
we should expect your #6 (increasing difficulty in extracting oil) to show up as a (much) lower a on the other side of the peak. At this point by how much is just a guess, but it could be argued that Pickering's 0.0466 line in Figure 5 should be lowered by 15% to 25% "soon" since his data set was from 1980 through 2002.
Interesting that the shock model typically discards the "b" term in Pickering's formulation. The problem with this term is that doesn't apply any kind of proportionality, in that big reserves produce more and smaller reserves produce proportionately less. When the reserves go to zero and you still have this term, you are left puzzled and shaking your head. Yet the strangeness of this number for OPEC/SA implies that they must be really cooking the books for reserve accounting, otherwise the "a" term would be much stronger for proportional draw. Another way to think about it is that "a" is the capitalist/greed factor and "b" is a socialist/control term. Yet at some point "b" has to disappear as reservoirs deplete.
Perhaps that's a valid way to look at the terms. I would be able to comment on that more easily if I had the paper.
From the abstract (emphasis added as it pertains to b):
There is not much to go on from that to understand how he derives b but a seems to me self-evident.
So the 'b' term looks like a residual of the fitting process, as it essentially determines the y-intercept of a best fit when they plot P against R.
Yes it could be just a "residual" but in the abstract he suggests that in this case b has meaning — something to do with cost and pricing behavior.
Are you comparing like with like?
Your non-zero production in 2012 (say) would have to be due to discoveries made prior to 2008?
The IEA curve on the other hand is explicitly concerning production from fields not yet discovered (thus starts ~2015). Shouldn't your curve be shifted by the 8 years you assume at the beginning?
I'm not sure I fully understand your question.
Re: Your non-zero production in 2012 (say) would have to be due to discoveries made prior to 2008?
no, I assume only YTF from 2008 to 2030. This is a stochastic model, so in average I assumed a 8 years delay but there is a significant level of probability that some delays can occur between 0 and 8 years.
Why new discoveries should start in 2015? we will make significant discoveries in 2009 and the years beyond that.
Your graph shows production prior to 2015. If it takes 8 years to find, plan, develop and bring onstream production then the graph should be essentially zero to that point. Sure you might assume some can be bought to maturity faster, but there is a limit (3-4 years I'd suggest). That goes double because this has to be a totally new field to be compared to the IEA data (red wedge part vs cyan wedge).
Thus the question - are you comparing like with like?
I think to arrive at a comparable set of data you would need to shift your production line to the right - undershooting the IEA graph at all points (I think) and implying the exponential rise shape of the IEA data is very optimistic from your PoV.
Read carefully what I wrote:
... it takes an average of 8 years between first discovery well and the time oil production is mature and reaches a production plateau
Again, this is the average delay between the initial oil discovery and the time you get a mature oil production from it.
Shouldn't there also be a minimum delay?
It could be, you could refined this model and add many more parameters. This model is simply modeling the effect of the oil industry on oil discoveries via a simple linear convolution process by a transfer function. This transfer function can be modified in order to impose a minimal number of years (or months) but there is always the possibility that a shallow onshore field can be brought online fairly quickly.
Yes, it removes one parameter by assuming always that the standard deviation equals the mean, giving a damped exponential PDF. This means that there is less than a 10% chance of having a latency less than 10% of the mean latency.
How about rise discovery rate? Is it impossible? Why?
There is new exploration technology which can triple oil discoveries for same money and time-frame as compared with conventional technologies www.binaryseismoem.weebly.com.
The Dispersive Discovery model assumes an accelerating search space; I started out with a high-order power-law but a rising exponential works as well. So the fact that new and better technology exists for increasing discovery rate, that is well suited to the model. Yet, even though we have these huge increases in search rate per year, we still keep finding fewer and fewer reservoirs on average per year. I keep saying that it is a very conservative predictor in the fact that it assumes large size discoveries are equally likely at any time and that no relenting on the search acceleration is allowed. If you relaxed these considerations, the outlook would be even more grim.
"Yet, even though we have these huge increases in search rate per year, we still keep finding fewer and fewer reservoirs on average per year."
You are right indeed. Situation, when exploration well spudding is based on sisemic data only exists for a long time. Today, as it was decades before, oil companies drill mostly dry exploration wells. Drilling success rate doesn’t overcome 25% on average. It means that three dry wells go to waste from each four drilled. It means also that discovery occurs too slowly today, but there is a highly productive exploration technology (Seismo-electromagnetic - SEM) for detection of hydrocarbon deposits. It provides a success rate close to 75%. In other words, 3 productive wells for each dry well. Obviously with the technology like this world oil industry could make three times more oil discoveries then using conventional technology, and this technology won't need more investment,time-frame and so on compare to a conventional one. It would significantly mitigate world energy problems.
Seismics---Prospects---Drilling---Discoveries: one in four
Funding --------project time-----------------------------------------
SEM--------Prospects---Drilling---Discoveries: three in four
www.binaryseismoem.weebly.com
You have changed the straw's diameter, not the size of the glass.
Further, to the extent that discovery means 'new,' the wells are still going to be concentrated where the oil is - the problem being, the area of the globe where the oil isn't is pretty well known at this point.
Right, and the point is that we have more and more efficient ways of analyzing the smaller and smaller places left to discover oil. This is an example of rapidly exploring diminishing returns. A double-whammy, so to speak.
Take a look at what I wrote.
There is zero chance of finding a new field today and getting production from it next year. I'd suggest there is zero chance of production up to about 3-4 years minimum. If you are predicting future supply from undiscovered fields that delay has to be in there, smoothing functions or not.
It might be mathematical, but its not physical.
The model is reflecting that already, your original comment included the word find where as the build time as nothing to do with discovery timing.
I'd suggest there is zero chance of production up to about 3-4 years minimum
I could add a lower-cutoff value but it won't change the result by much as the value of the transfer function used here (could be interpreted also in terms of probability density function) is very samll for this time range.
The model creates a "dead zone" from the convolution of the fallow, construction, and maturation phases. Since each phase has less than a 10% chance of achieving a latency less than 10% of the mean, the succession of these three reduces that probability even further. It is a neat mathematical trick that happens to match reality. It can also account for the fast decrease in the tails of the normal distribution or Poisson distribution, where you can imagine many of these phases might apply.
It seems to me the distribution of the development and production of resources discovered in a given year would be fairly skewed. There might be a minimum of 4 years, but a maximum of 20 years or more.
Do you have actual data that you are basing your model on? It seems like quite often, fuel has to get scarce from other sources, before it makes sense to put in the infrastructure to develop the oil. We knew about oil in Alaska, but didn't develop it until US-48 started declining. Oil in Iraq has been known for quite a while, but political issues have interfered with development.
The exponential distribution is definitely skewed. There is a finite probability of having delays of 20 years or more. As a matter of fact, the combination of the 4 latencies could conceivably push the peak location to beyond 30 and approaching 40 years. This occurs when you add in the 0.04 proportional extraction rate, which essentially provides a 25 year "shift".
As far as actual data, there is some data that we can infer parameters from:
http://mobjectivist.blogspot.com/2005/10/oil-production-ramp-up-times.html
The reasons for delays in developing the Alaska fields and the pipeline are given here, in a TIME article of 1971 (extracts):
http://www.time.com/time/magazine/article/0,9171,877050,00.html
This is an example of the fallow period.
The way I look at it, the point spread function associated with startup time is decidedly asymmetric, 3-4 years at one end, 20+ at the other. Convolve that with the expected discovery curve and you should see something that has a sharp 'kick' at the 3-4 year mark, with a reducing power law shape thereafter. It probably possible to graph with a hour and a suitable package.
However there is another question. Where are these new discoveries likely to be made? Its certainly not going to be a random event - many of the likely spots have been well surveyed - particularly if it were cheap to do so. Even if you take the plot of previous discovery rates, you need to take into account that discoveries in the tail are harder and more expensive, reducing the rate that might be expected.
Thus we should expect oil to be preferentially found in the difficult to reach and expensive spots - pushing out discovery -> exploitation times even further still. Rates will also be less as smaller fields are addressed. All that would tend to flatten the curve, certainly not the exponential increase of the IEA graph.
The Dispersive Discovery model takes future discoveries into account. By the time that the backside tail is reached, the search space traversal is 100's of times faster than it is on the frontside. I promised a few plots earlier. Here are a few examples of noisy discovery profiles and the smoothened Shock production curve (in red) that follows:


Compare against Khebab's Figure 3.
These are each Monte Carlo runs of 120,000 samples each (corresponding to number of reservoirs tapped) with a maximum reservoir size of 80 billion barrels and a minimum nucleated size of 2 million barrels. The key thing to note is that the amount of fluctuation does not affect the final shape after production convolution with the 3 stages plus the 0.04 proportional extraction rate. Yet these are all still random events in the sense that the DD profile provides a weighting for the sampling space.
I just caution on the interpretation of the IEA concave-up curve. Some of this is justified as it it making up for the concave down shape of previous discoveries. But of course they truncate the data before it reaches an expected maximum.
Khebab -- Great summery of a rather complex tale woven by the IEA. I’ll add a little more complexity by tossing in some of the realities of oil/NG exploration and development.
Given the vast amount of historical data, statistical analysis and forward projections based upon the same are a natural pursuit. But, as most know, statistics require of firm understanding of the data population character. A basic assumption that the data follows closely a normal distribution pattern can often be seen in nature. But the natural distribution of hydrocarbon traps is not what the historic data quantifies. It represents the discovery timing of a subset of the existing reservoirs around the globe. IMO this is a critical distinction when viewing the methodology and projections of the IEA. There are at least two major controls for discovery timing. Geography is obvious to most. Given the industrial revolution had a firm grounding in the US it’s not surprising that much of the early exploration efforts were concentrated here. As the demand for energy grew very fast in the early 20th century it was natural for exploration efforts (as well as the advancement in the technology) to be focused in the US and other industrialized areas of the globe. These demand driven efforts also fostered advances in petroleum geology as the art progressed from locating surface oil seeps to subsurface exploration concepts.
Your chart of oil discoveries clearly shows this effect if you overlay the results with the evolution of exploration technology. The peak in the 1920’s represent, to a large degree, the development of gravity and magnetic exploration techniques. This approach accounted for many of the major US discoveries (typically in the Texas and Louisiana Gulf Coast) as well as other early plays across the globe. This was followed by a second wave of discoveries in the late 30’s with the advent of early seismic exploration. Jumping ahead to the late ‘50’s and early 60’s, this surge in the US was a brought about through the application of continuely improved technology to new plays especially in the offshore arena. This brings me to the heart of my story: oil/NG fields are neither equally nor randomly distributed across the globe. The common termonology in the oil patch is “plays”. The peak discoveries in the 60’s was more than just technology itself. It allowed exploration in regions, such as west Texas and the offshore Gulf of Mexico, which had never been evaluated. These regions held hydrocarbon plays both unique and unknown compared to prior efforts. Even within these two regions there are subsets of plays which were discovered and evaluated as time went on. Offshore La. was found to contain significant oil plays while offshore TX tended to be more NG prone. The Deep Water plays currently being explored in the GOM are not just simply the shallower shelf plays extended into deeper water. They are a separate and unique geologic province which advances in drilling/production technology allow us to pursue today. Even the Deep Water GOM is not a homogeneous target. There at least two major plays which exhibit different characters and potential.
Similarly, the much advertized Deep Water play off Brazil is another new petroleum province being explored. Geologically, it’s a rather simple play which had been easily identified long ago. It was water depth well beyond technical capabilities which prevented exploitation until now. Similarly, highly speculative potential is offered for the Arctic basin. But it is good to remember that while technology might allow exploration into previously unavailable regions, it does not mean those areas contain significant reserves. Hydrocarbon provinces result from a complex combination of factors which cannot be understood or projected without a significant data base. It takes a great deal of time and drilling (i.e. $’s) to identify the potential of a new province. Consider what a boom the development of the North Sea was to our friends across the Big Pond. But it’s also good to note that the first significant field discovery was made by the 93rd exploratory well drilled in this basin. It takes time and a lot of data to clearly identify even in gross terms the potential of a new play.
Though the IEA does not supply support for their estimate of future discoveries, we should probably break their estimate into two categories. First, reserves developed in known plays, such as the Deep Water GOM, offshore Brazil and the Middle East, and, secondly, reserves discovered in yet unproven (or even identified) plays such as the Arctic basin. And this brings me full circle to the difficulty in using historical discovery statistic to predict the future discoveries. The nature and even the possibility of their existence of future petroleum provinces were unknown when these past plays were exploited. To put in a more statistical light, they are not of the same population. Any statistic developed for one population of data cannot be reliably projected upon a separate and independent population. I suppose this could be called the First Commandment of statics: regardless of how clear the odds are historically of pulling a black bean out of a jar of white beans, it tells you nothing about the odds of pulling yellow beans out of a different jar filled with red beans. Major reserves today are being pulled from a different jar then we explored during most of the 20th century. And the beans we may be pursuing 10 to 20 years from today may likely be in another jar. Actually from a number of different jars.
And, of course, this does not include the added dimensions of economics and geopolitics. I’ll stick with the rocks and leave the balance of that discussion to those more knowledgeable in such matters.
Thanks for a great comment.
This is a very simple macro-analysis.
Of course, there is always the possibility that a new significant producing region that has not been thoroughly explored (Iraq?) will increase the YTF however it is very likely that it will be remote regions with a challenging environment (e.g. Artic) implying large build time.
I agree with you Khebab. "Remote" is the key word. Be it in relatively unexplored areas like Iraq or a tough environment like the Arctic. Web also has a valid point about how the large discoveries skew the numbers. The same will likely be true for future discoveries though perhaps at a smaller scale. Consider going back 10 years or so and consider estimating the statistical potential for the development of billions of bbls of oil in the Deep Water GOM or offshore Brazil. I suppose folks like Web could expand on the stepwise nature of such reserve additions. I'm not too knowledgeable of the lesser explored onshore regions around the world but I would guess most large fields will be found in Deep Water plays both known and yet to be defined.
Rockman, I sense that your favorite football play is the punt.
I have a huge disagreement with anybody that thinks that the only way that we can analyze the situation is through reactionary accounting -- in other words only reacting to what we see and then adjusting to how things evolve. Your whole commentary is essentially about the temporal evolution of technology, but you couch it in terms of stumbling across different areas of the earth that haven't been accounted for yet. The punting comes in because you have no quantitative model or extrapolation for how fast you can pull those beans out of the jar. Since I am not involved in the oil industry, I don't give up or give in so easily to what traditional geology attempts to teach us.
So yes in fact the declining tails of the discovery curve can be easily allowed for by technology advances with fresh approaches such as the Dispersive Discovery model
http://www.theoildrum.com/node/3287
This model basically assumes that the search space volume accelerates either exponentially or through a power law to try to cover the entire earth. This is a super aggressive and a quite conservative model that defies one to generate exceptions and pull things out of a hat in an attempt to react to the latest discovery here and there. The model assumes an ever widening scope of exploration, yet it predicts and we continue to see decreases in discovery. You marginalize this by saying the statistics is somehow more involved with economics or geopolitics than with physical reality. No, this is a basic search and discovery word problem that has finite constraints and well defined statistics. Accelerating exponential growth in search rates outguns apples and oranges arguments on what different colored beans that we are searching for.
Face it, plain old probability and statistics can trump all the individual bean-counting exercises in the world, if it can ever get accepted on its own merits. Khebab, I wouldn't short-change this by calling it a very simple macro-analysis. After all, statistical mechanics and thermodynamics are also a very simple macro-analysis and they explain quite a bit. Nowhere in the analysis of statistical mechanics do practitioners focus on individual atoms, the equivalent "rocks" and yellow and brown beans of geology. I will just as soon let Rockman and the rest of the oil industry keep on missing the forest for the trees. Sure Rockman can applaud Khebab's summary but his criticism of the particulars and the exceptions do not marginilize the entire macro thesis, which basically puts to shame all that the conventional wisdom of oil exploration has taught us through the years.
I don't know, somehow Rockman's comment sounds more like a back-handed compliment than anything else, and a bit condescending to boot.
Wow Web...I didn't realize my simple words conveyed so much about me. No left -handed compliment for Khebab...an honest appreciation for explaining the complex in terms most of us can appreciate. I find many here toss around nomenclature as a tool to impress and convince. I always appreciate efforts to boil the complex down to more easily digested portions. As far as being condescending ...not at all…not my style. Perhaps I wasn't clear in my distinction between Khebab's comments and the IEA analysis. I absolute condemn the IEA's analysis for being, at best, misleading and, at worst, dishonest.
As far as punting goes, there are times when it is the wise course of action. Then there are times to roll the dice. Wisdom is knowing the difference. In my experiences missteps in the process are as likely to be due to ego as ignorance.
Come on ... you said that the use of statistical analysis are a "natural pursuit" and that it "require of firm understanding". If that quote of yours I block-quoted is not a tad condescending and an appeal to authority I don't know what is. And I can be as condescending as the best of them, just read my blog. And not to say that I didn't partake in another sin, that of hyperbole.
I don't see any of this in R's post, not even on a second reading.
To me the "statistician's" view makes sense as well as the "rockmens'" view. How about simply adding a certain range of error to the calculation that represents the range of "unknown unknowns"?
The thing about model-based statistics is that the figure that usually gets published is the best bet estimate. Putting error bars on this is pretty pointless. You end up getting some excursions that are more optimistic with some possibility and excursions in the other direction that are pessimistic with an equal possibility. What you basically seek out is the mode or most probable output. That is with the analytical result; with a Monte Carlo result such as some of the stuff that Khebab shows, you necessarily have to build up some statistics to know that you are honing in on some most probable estimate by doing many sample runs. A person with a Bayesian bent will then keep on using his best model-based estimate from before and continue to hone in on a better predictor as more data comes in.
The analogy to this is that you will get a weather forecast saying that there is a 20% chance of rain tomorrow. The fact that weathermen don't put "error bars" on the 20% prediction is pretty well taken for granted. It is pretty much meaningless to say that the 20% has a 50% probability and the 25% upside and 15% downside have each a 25% probability. The 20% estimate basically subsumes all the "spread" in the possible outputs, and all Bayesian inferences that went into this estimate over the years.
But of course if you don't deal with a model basis, you end up using classical statistics with confidence limits, since that is pure extrapolation and you aren't evaluating the results to any particular model. On the other hand, the geologist point of view is that of sticking their hand out the window when they find a new discovery to determine whether it will rain :)
We can do so much better than either of those two extremes.
What about oil in Antarctica? It is a huge continent that seems invisible to the thinking of most people. But surely it has huge resources. Oil?
I agree that discovery data is extremely noisy. This has to do with the random occurrence of supergiants in the mix which lead to the occasional large spikes.
To demonstrate this, the noise characteristics of a curve such as Khebab's Figure 3 can be modelled with an appropriate reservoir size probability distribution function. I spent some time last night generating various Monte Carlo runs which combine the Dispersive Discovery profile with a Dispersive Size aggregation model. The critical parameters needed to reproduce the behavior are a maximum reservoir size, a minimum nucleated (or producable) size, and the number of reservoirs tapped (i.e. the maximum rank). The fact that even though the world has produced from at least 40,000 reservoirs, the finite statistics and wide dispersion in field sizes leads to the huge fluctuations we see. The insight we can glean from this approach is what effect that a few more undiscovered super-giants will have on future productions. From what I can see from both the analytical stochastic results and the Monte Carlo runs, that it won't be significant.
I will post some of the runs later on tonight so you can get a feel for how the shock model smooths out the production profiles and that the fluctuations don't really matter all that much. The caveat is that we don't really have a certainty on what the maximum size reservoir could be, as the assumption is that the Ghawars of the world have pretty much pre-determined this through Bayesian inference. (Please discuss how a Black Swan super-super-super-super-giant fits into all this)
A fine point in this discussion is the impact of reserve growth additions. I feel that these are best accomodated by using the Dispersive Discovery model to generate a complete profile and then increasing the maturation phase time to account for a slower ramp-up on production levels. Khebab, correct me if I am wrong, but I think you prefer to add in the reserve growth term as post-discovery additions. I think they basically amount to the same thing but the math complexity differs.
That is about the only place that we differ in approaches. Otherwise I think we are getting close to a unified model of oil discovery and production. This is fascinating stuff, and the lurking "unaccounted for" max-size in reservoirs is the wild-card. Hard to believe though how IEA could predict this with any certainty.
http://mobjectivist.blogspot.com/2008/10/estimating-urr-from-dispersive-...
http://mobjectivist.blogspot.com/2008/10/dispersive-discovery-field-size...
My analysis is a simple reverse engineering of what the IEA did using the shock model toolbox. I didn't get into the reserve growth forecast yet but it looks like they followed the USGS prediction. I wish the IEA could provide uncertainty intervals on their forecast also, they should be quite large.
Although they don't give details I'd think and alternative explanation is that extraction rates in the OPEC countries start approaching the same values as in the rest of the world. If you believe there reserve numbers then OPEC and esp the ME could readily boost production. How they square this with discovery I don't know but my guess is they would consider unproduced extensive OPEC reserves as discovery when they are finally brought online.
So by taking OPEC purported reserves and assuming they are "discovered" when these fallow fields are brought online I think you can readily replicate the curve. In fact its actually conservative given the potential for additional discovered over the almost doubling of known reserves found by OPEC.
The fact that the extrapolated production curve for the undiscovered oil has an extremely dished-out concave-up quality seems to support this idea. Something must be sitting off-line for quite a while for this curve to accelerate so slowly. It could be that their book-keeping is considering some of those off-line OPEC reserves as undiscovered. Otherwise, the only way to account for this curvature is to increase the fallow or maturation times for recent discoveries.
I'm guessing that they are guessing a 3-5 year ramp up or less for OPEC.
If you take KSA's claim of 12 mbpd of real capacity then you can throw on several mbpd with effectively zero ramp up time.
Iran for example only needs investment to ramp production and basically same for Iraq. And this is actually real i.e the truth both countries could given the investment ramp production by quite a bit say 2-4mbd between them.
I'd suggest that political issues make this doubtful but its pretty easy if you want to be optimistic to throw in almost 8mbd of production thats theoretically possible to bring online over a very short time period.
Thus if you wish you could pretty much take any non-pessimistic set of assumptions you wish about the ME and generate just about any curve you want.
Given the number of dubious assumptions they could use to generate practically any number they want the fact that they are fairly conservative in the report is telling in and of itself.
Why is this so Mike? Peter Wells is just such a person who anticipates this dramatic and near-term growth in Iraqi oil production:
Is it simply because the oil is: a) light and sweet b) onshore and c) already discovered?
Peter Wells' production forecasts and remaining reserves seem very optimistic. Both Colin Campbell and Jean Laherrere would disagree.
Some of the key constraints to increase Iraq production are the lack of peace in the Middle East and also the lack of stable Iraq petroleum legislation including long term legal agreements with Kurdistan.
Here is a paper on Iraq by Laherrere.
http://www.hubbertpeak.com/IQ/iraqLaherrere.pdf
Laherrere's creaming curve indicates Iraq total URR of 128 Gb. If 31 Gb has been produced to end 2007 that leaves only 97 Gb remaining, far below Wells' number of 177 Gb remaining.
Campbell only shows a peak plateau of 2.65 mbd for Iraq, also far below Wells' forecast. I think that Iraq might reach 4.5 mbd, but 8 mbd appears unlikely.
click to enlarge
I did not say I agreed I'm simply offering what I think is a input that might have been used in the keyposts graph. My only opinion is that some fairly optimistic assumptions about ME are included.
Thanks Ace and Mike. It seemed high...but the difference got me wondering: does he know something we don't know?
Read the new post thats up.
http://anz.theoildrum.com/node/4675
I believe the consensus would be that Iraq probably has the greatest potential to be a long term oil production / exporter on the planet.
How much is actually true is anyones guess but I think its a safe bet that its the biggest prize left.
Makes you want to send in and invading army to control it.
You would also think the Brits who have the real data would want a piece of the pie.
But back on track I think the global estimates are obviously highly dependent on how you treat ME resources the rest of the world is secondary and basically not all that important.
So far in theory. But here even the IEA seems to be very vary about their own predictions. At "Potential barriers to upstream investment" they write:
"...Nonetheless, the opportunities and incentives for private and publicly
owned companies actually to undertake all of this investment are still very uncertain.
In reality, investment in particular regions may fall short of that required to meet the
projected level of supply — not least because prices and costs could turn out to be
markedly different from those assumed. Host government policies, including licensing
and fiscal arrangements, could shift and the overall investment and business climate
may deteriorate, making upstream investments riskier and less attractive. Uncertainty
about future climate-change and other environmental policies adds to investment risk..."
Further down their text almost looks like a copy & paste job from TOD:
"...in this way, a vicious circle might emerge of lower investment leading to tighter supply,
which could in turn push up prices and revenues even more and further reduce the
incentive to invest, eventually forcing the world to shift the pattern of consumption
away from oil."
I have the increasing impression that the IEA is now in a dialectical dilemma between working seriously on the looming energy issues - and selling the somber messages to BAU policymakers on this planet of apes.
Andre - excellent PDF from Peter Wells, hadn't noticed that one. He was a speaker at Sacramento ASPO too, I see. Hmm, tar sands production in Canada will decline and Orinoco increase?
I notice this comment from Alan Drake about Peter responding to Alan's question about the status of North Ghawar by quietly admitting it would water out within two years, as if it were a plea for help or the like. Actually in the PDF he clearly shows Ghawar in toto declining ca. 2011, with minor assistance from EOR down the road. The decline is wholly offset by their new production from Khurais etc.
Here you're discussing geology and the relevant technology. On that I must remain silent. But the meltdown is convincing me that the financial and economic resources for further discovery and development are under severe threat. Even if there's a mini-recovery, I doubt that the oil companies will ever dare go so far out on a limb again, given the scale of investment required. Far safer to just rely on higher prices and therefore returns from existing production. So I'm a lot more pessimistic than even the geology would indicate.
The one possible exception is in the case of de facto nationalization of the majors, which could happen under prodding from the Pentagon. In other words, risk removal. War to-the-death scenario over remaining oil scenario, in other words.
I don't think this is even specifically talking geology. We could just as easily be discussing the search for new species. That is part of my kick in trying to open up the entrance criteria for understanding oil depletion. The minute we start to appeal to a higher authority on understanding this stuff, we start to lose the battle. Not to make it sound too melodramatic, but I don't think we have to appeal to complex geology or complex economics.
I am trying to understand why bootstrapping doesn't produce the same mean as the underlying data. I had thought that the central limit theorem would assure that they were fairly close, but that doesn't seem to be the case.
Based on the data you posted with the "optimistic" or "constant" discovery rate model, the annual discoveries forecast using this method are fairly tightly bunched around 10.66 Gb (standard deviation = .16). The single lowest year is 10.41. You indicated the underlying mean of the data you were sampling from was 10.0.
I probably don't have the same discovery data you have. I am working with an ASPO 2005 discovery chart that shows the following numbers:
1995 7.47
1996 6.70
1997 8.29
1998 7.72
1999 17.89
2000 7.94
2001 8.19
2002 7.92
2003 6.66
2004 5.38
2005 4.64
Mean = 8.07
You indicate that your data shows a mean of 10.0 Gb so it is perhaps more recent information, or includes some expected "development" on recent years. When you sample, you do you choose your sample? Is it by country? Is there a way the one very high year can impact the data excessively? Iran had a big find that year (6.51 Gb) as did Canada (2.92 Gb).
I don't think all of this makes any difference to your findings since this only relates to the optimistic scenario, and it is just a question of how optimistic the optimistic scenario is. The "declining" or "realistic" scenario isn't arrived at using the bootstrapping technique, so it isn't an issue there.
My Sample is the following (the average is 10.7 Gb):
1995 7.05
1996 10.85
1997 7.25
1998 9.60
1999 15.67
2000 19.22
2001 10.10
2002 11
2003 8
2004 10
2005 9
which is similar to this one published by Rembrandt:
My understanding is that your sample contains early discovery estimates for 2002-2005 (probably because it was produced by Campbell in 2005) which have been revised upwardly since.
Thanks!
How're the latest finds from pre-salt etc affecting the tally?
Could we take two points in time for each year's estimates of discoveries to get a sense of how much discoveries get adjusted upward? Then apply that estimate to recent years to get an idea of how much at most was discovered in recent years?
I looked at the large outlier years of discovery and how they show a declining curve. The years in question are 1947, 1964, 1977, and 2000. Each of these year's discoveries are 1/2 to 2/3 the size of the previous peak. According to this curve there will be a major discovery of around 10 to 13 Gbbl in the middle years of the next decade which the right wing cornucopians will rejoice over and declare our peak oil claims are bogus. Be prepared!
You are so correct. By the same token, fluctuations in climate warming and cooling are taken as evidence that global warming may not be happening.
These new large discoveries aren't anywhere near black swan events but the expected outcome of having tens of thousands of oil discoveries spread out over over a 100 years. By my estimate, it would take several million significant discoveries for the discovery envelope to start smoothing out on its own.
The only thing that will prevent mini-bursts of positive hysteria from breaking out is that any new discoveries have to go through the extraction filter before consumers see any effect. On the other hand, temperature fluctuations have no such latency and so when people feel cooler than normal they immediately get vocal about it and denounce the global warming hysteria with their own hysterics.
Some simple observations on Rembrandt's Oil Report
World Liquids production seems to be stabilized at about 86
World Total exports seems to be stabilized at about 47
If world liquids decline at 6% a year, this will be taken directly out of the hide of world exports. Exports will be first to be cut.
Therefore when the 6% kicks in, in 3 years, you go from 86 -> 71 or a decline of 15
But in reality you go from exports 47 minus 15 = 32
Or a decline of 32% in exports in 3 years.
Matt Simmons was right
Yes, he is. Which is why I'm scouting farm land almost as I type. In Oregon, to be precise.
"Which is why I'm scouting farm land almost as I type. In Oregon, to be precise."
You and the rest of the world too it seems.
I am currently connecting acerage close in to town owned by folks I know who live in town or who have stopped working the land for one reason or another, with young growers/grad students future farmers of America types. Got two serious producing farms in the works.
Let me know if you are interested in some gung-ho, unbelieveably knowledgeable young talent to get involved.
Located in the Heart of the Valley.
That's generous of you, I think I'd like to take you up on your offer.
I will be up your way on a scouting road trip with two others from December 16 through the 21st. The current plan looks something like this:
December 16
Leave Marin County
Arrive Eugene 6pm
Sleep Eugene
December 17
Tour Eugene and surrounding area
- University
- wineries (might be excellent farm land)
- existing farm land
Travel to Corvallis (63 min from Eugene to Corvallis)
Sleep in Corvallis
December 18
Morning check out area around Corvallis
Leave in afternoon to Monmouth (40 min from Corvallis)
Monmouth to Salem (30 min from Corvallis)
Sleep in Salem
December 19
Morning check out Salem and surrounding area
Leave for Portland afternoon (Salem to Portland is 56 min)
Sleep in Portland
December 20
Check out Portland and surrounding area
Sleep Portland December 20
December 21
Drive Portland to California
It sounds like you are somewhere along that route, yes? Perhaps we should stop by your shop?
-André
You bastard ! Can I suggest Southern Cali :)
I love artesian wells they don't seem to be common in Oregon. I'd think the water table would support it. I'm sure it more me having problems finding the info.
Here is one link.
http://olyblog.net/are-we-running-out-time-public-artesian-well-updated
If you have info on the water table in Oregon and Artesian wells please send me a ling my email address is in my bio.
Hi, Mike.
I'll certainly send it your way if I discover it. I haven't started working on my understanding of the below ground water situation yet. I'm still working on getting a handle on temperatures and climate change right now. But understanding below ground water is definitely going to be part of my research. Perhaps one of my colleagues has some info on that.
And I think I'll pass on Southern California, but thanks for the offer!
Here is what's been happening to the temperature of the Northwest in the meantime:
Yeah I've read some stuff on the climate. Dryer in summer more rain less snow in winter. This means less snow pack in the mountains and more forest fires.
I've never found any info on climate if the Arctic ice cap melted each summer.
This could actually lead to more rain/snow in the winter instead of less.
The reason I'd think this is that you would be picking up more moisture from the the regions that are now ice free.
Check the bottom of this page.
http://cses.washington.edu/cig/pnwc/pnwc.shtml
Overall the PNW should remain a rich agriculture region for some time.
The climate will change but generally it should remain reasonably well watered and fertile.
EDIT:
And opps thanks on any artesian well info you dig up ( pun intended )
Hi Andre, I'm SW of Portland in Yamhill County and if you want to try and hook up contact me, email's in my profile.
Mike - if you're serious about moving to Orygun you might want to pick up a copy of the Atlas of Oregon,which has charts of drainage, streamflows, soil water holding capacity; also some climate change forecasts; also maps of pre-Holocene glacial extent, to chart the opposite situation, and of course lovely maps of everything else imaginable. Beautiful book altogether.
I notice the State of Oregon Water Resources Department has what looks like a quite sophisticated tool for accessing well logs. If you're really serious about collecting data for a locale that should do it for you.
Caveat: the property taxes here really sting, just paid $2750 for my 28 year old split level.
Thanks for the offer, Dude. I've got a couple invitations out right now that I need to follow up on but I might circle back :-).
I hadn't come across that link yet, thank you!
Khebab, excellent analysis.
One remark:
If I understand this right the WEO does not expect that the discoveries will stay at the same level as in the past but only at half of it: Between 1995 and 2005 each year 11 Gb of conventional oil and NGL have been discovered, whereas the WE0 is forecasting 5,2 Gb of new discoveries per year. So the WE0 discovery rate might be in fact quite close to the realistic scenario.
I don't think the IEA is expecting a huge drop in discoveries. It takes a while for discoveries to translate into known barrels. The IEA report seems to line up fine, if you look at how much you expect to actually be "developed". It is just that the WEO isn't expecting those discovering the oil to be immediately clairvoyant as the ultimate amount of oil. Some of it will come later as reserve development. The important part of the statement in the post is the last part, "It is very likely that 114 Gb refers to the total developed YTF for 2008-2030." since that is what they would report if they were not clairvoyant.
Thanks, Khebab!
Your Figures 4 & 5 should be emailed to the IEA employee who developed Fig 11.9 from the WEO IEA 2008, asking about IEA assumptions on extraction rates and the IEA source for future discoveries.
Fig 11.9 is a very good example of the continuing overoptimism from the IEA. In the case of yet to find oil, the IEA is overoptimistic on both the forecast discovery rates and the forecast extraction rates.
The chart below shows cumulative discovery of oil, excluding unconventional extra heavy oil and NGLs, consistent with the IEA definition of oil used in Fig 11.9.
As oil has become harder to find, the search has extended to deepwater, shown as the last cycle in the chart below.
source: http://aspofrance.viabloga.com/files/ASPO7_2008_Laherrere_Wingert.pdf
Since many of the large oil fields have already been discovered, smaller discoveries have become the norm. There are occasional big deepwater discoveries like Tupi in Brazil, but these are also rare. Consequently, the average annual discovery rate has been trending downwards, as shown below.
(Laherrere is also forecasting peak oil, excluding extra heavy, in the past in 2005, shown in the chart, which agrees with Colin Campbell's forecast.)
source: http://aspofrance.viabloga.com/files/ASPO7_2008_Laherrere_Wingert.pdf
Page 259 of the IEA WEO 2008 projects discovery of 114 Gb from 2008 to 2030, or an average of almost 5 Gb/yr. Laherrere's discovery chart forecasts an average discovery rate of 4 Gb/yr, equivalent to a discovery forecast of 92 Gb from 2008 to 2030. The IEA's projected discoveries are about 22 Gb greater than Laherrere's forecast.
If it's assumed that the upper limit to the future production rate from undiscovered oil is approximately equal to the average discovery rate of 4 Gb/yr, then the upper production limit is 4 Gb/yr or about 11 mbd, probably reached by 2030 (similar to Fig 4). The IEA's forecast 2030 oil production (Fig 11.9) is 19 mbd, probably overstated by 8 mbd.
Also note that the IEA's 2030 19 mbd production rate is equal to an annual production rate of almost 7 Gb/yr, which is much higher than both Laherrere's average discovery rate of 4 Gb/yr and the IEA's average of 5 Gb/yr. The only way that the IEA could project such a high 2030 production rate is to use unusually high extraction rates, as shown in Fig 5. I don't believe the IEA's forecast.
Lest we forget about Shell Oil's discovery profile, which best that we can tell has the misleading moniker "BOE" signifying barrel of oil equivalent. This means that they basically can count anything as discoveries. For example, the spike at 1990 below might be some tar sands area of questionable merit.
That is the problem with non-public data, as we waste so much time getting side-tracked into deciphering its meaning.
The "average"-line looks a bit strange to me, as if it was shifted towards the right. There is much air below the curve after 1970.
Or is it a special type of average I didn't know yet?
It's a moving average filter, which will shift the curve to the right quite a bit.
Wouldn't it be better to use a moving average centred on the year in question? ie the average of say three years either side, rather than the previous six years, which of course will tend to shift it sideways.
It kind of makes sense to do that but in terms of theory doing this breaks the law of causality. You are therefore left with the current data points where you cannot peek into the future by the same amount you are averaging over the past. Doing the lag moving average, you don't have to explain any of that apart from the points near T=0 which lack precursor data.
In the energy resource business, there's always going to be surprises, which makes it exciting.
Perhaps 20 years from now, we'll look back at these projections, and have a good laugh.
Khebab,
you wrote:
"Unfortunately, they offer few details on how this result was obtained "
Maybe there is a hint in the "Architecture of Oil Supply Model (Figure 11.2, page 254) as it has the following sequence:
Number of exploration wells -->
Creaming curves based on USGS estimates of ultimately recoverable resources -->
New discoveries
They probably mean the USGS 2000 report, possibly adjusted by more recent findings.
Thanks, I just noticed that also.