| DrumBeat: February 25, 2009 | The Oil Drum | Facing Forward Together: Four Models for Organizing a Community for an Uncertain Future |
Analysis of Decline Rates
Posted by Sam Foucher on February 25, 2009 - 10:23am
This post offers a kind of reverse engineering of what numbers
could be behind the long and detailed IEA decline analysis in their
last report (2008 IEA WEO). A tentative decline
structure for the post-peak
Super-Giant and Giants oilfields is offered as well as a possible
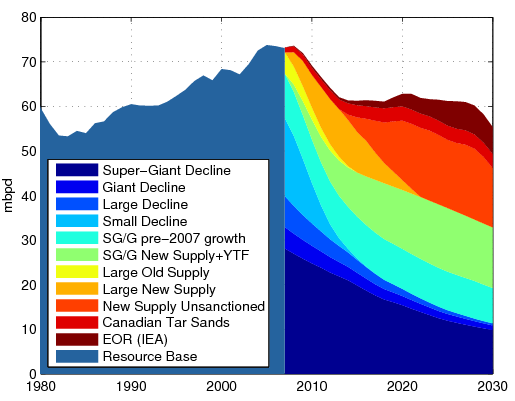
scenario for future production. The conclusions are:
- It seems that the yearly decline rate of the post-peak resource base may accelerate to 10% until 2011 and then stabilize back toward 4.35%. This acceleration is due to the rapid decline rates for Large and Small oil fields (around 10%). Coincidentally, this value is the total decline rate value implicitly used by the IEA in their final forecast (see discussion here).
- 83.0% of the 2007 conventional oil resource base (69.8 mbpd in 2007) is coming from post-peak fields.
- The contribution from Super-Giants, Giants may have reached a broad plateau around 41 mbpd.
- Production may slide rapidly over 3-4 years past 2009 due to a short bust in decline of the resource base then reach a gentler decline regime past 2012.
Warning, It's a long post with a lot of charts.
The IEA based its analysis of decline rates on a database of 780 world largest oil fields among which 580 are past their peak production. Fields where categorized according to their size (Super-giants > 5 Gb, Giants > 1.5 Gb and Large) and decline intensity. Three phases are considered for the decline:
- Phase 1: field is in a production plateau above 85% of peak annual production.
- Phase 2: field is past plateau and above 50% of peak production.
- Phase 3: production is below 50% of peak production.
Decline rate averages are computed for each size and decline category which give the following table:
| Decline Phase 1 | Decline Phase 2 | Decline Phase 3 | Total | |
| Super-Giants | 0.8%
|
3.0% |
4.9% |
3.4% |
| Giants | 3.0% |
3.7% |
7.6% |
6.5% |
| Large | 5.5% |
7.2% |
11.8% |
10.4% |
| World | 1.4% | 3.6% | 6.7% | 5.1% |
In addition, the following information is given for the 580 fields dataset:
- The production-weighted average annual observed for 2007 is decline rate is 5.1% (table above).
- They have a total initial reserves of 1,241 Giga-barrels, 101 are in a production plateau, 117 in decline phase 2, 362 in decline phase 3.
- The total production was 40.5 mbpd in 2007 or 58% of 2007 production.
where x is the unknown production from small fields not in the 580 fields database with the following value
which means that 40.5 + 17.5= 58 mbpd of 69.8 mbpd are coming from post-peak fields (i.e. 83.0%). Note that if 69.8 mbpd is the total production considered for 2007, then 69.8-58= 11.8 mbpd must come from fields that are not in decline. On their final forecast, they implicitly assumed a decline rate around 4.35% (see post here) which means that taking 81.0 mbpd for C+C+NGL in 2007 (EIA):
which means that 23 mbpd of crude oil + NGL that is not post peak must grow at least by 1.58% in order to get a global 4.35% decline for total production. That seems reasonable.
A Detailed View of the Decline Structure
On table I, average decline rates are given for each category.
Unfortunately, the amounts used for the various production-weighted
averages are not given. I propose an estimation of the 3x3 production
matrix P
behind the decline rates using the following constraints:
- P must give the same average decline rates per decline phase or by size category. In all, it gives 8 equations.
- The total production is equal to 40.5 mbpd.
- From the list of top 20 oil fields (20 of the 45 known super-giants), we know that at least 1 field is in decline phase 1 (Ghawar), 9 are in decline phase 2 (for a total production of 7.747 mbpd in 2007) and 5 in decline phase 3 (or 3.505 mbpd).
| Decline Phase 1 | Decline Phase 2 | Decline Phase 3 | Total | |
| Super-Giants | 6.204 | 8.794 | 14.400 | 29.398 |
| Giants | 0.257 | 0.822 | 2.838 | 3.917 |
| Large | 0.725 | 1.255 | 5.205 | 7.185 |
| World | 7.186 | 10.871 | 22.443 | 40.5 |
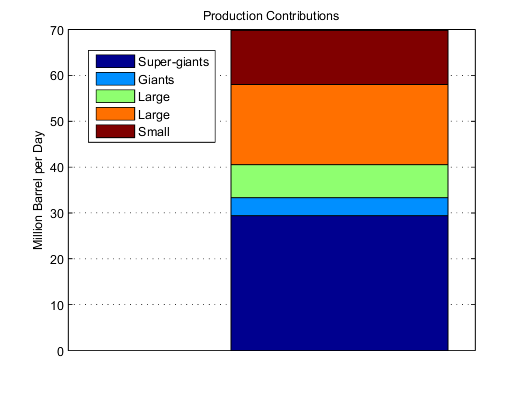
Figure 1. Amounts of post-peak production by field category used for the global decline rate calculation.
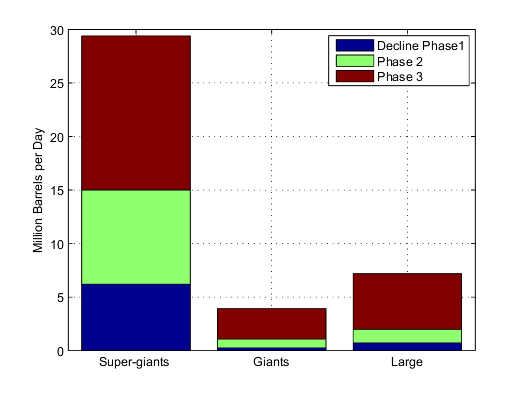
Figure 2. Repartition of decline phase per field size.
The Fate of the Super-Giants
Production from the super-giant and giant fields is the cornerstone of modern oil production. In the top 20, 16 of them are in decline.
| Field | Peak Production (mbpd) | 2007 Production (mbpd) | Production to Peak Ratio (%) | Decline Phase |
|---|---|---|---|---|
| Ghawar | 5.588 | 5.100 | 91.27 | 1 |
| Cantarell | 2.100 | 1.675 | 79.76 | 2 |
| Safaniyah | 2.128 | 1.408 | 66.17 | 2 |
| Rumaila N & S | 1.493 | 1.250 | 83.72 | 2 |
| Greater Burgan | 2.415 | 1.170 | 48.45 | 3 |
| Samotlor | 3.435 | 0.903 | 26.29 | 3 |
| Ahwaz | 1.082 | 0.770 | 71.16 | 2 |
| Zakum | 0.795 | 0.674 | 84.78 | 2 |
| Bu Hasa | 0.794 | 0.550 | 69.27 | 2 |
| Marun | 1.345 | 0.510 | 37.92 | 3 |
| Gachsaran | 0.921 | 0.500 | 54.29 | 2 |
| Shaybah | 0.520 | 0.500 | 96.15 | 1 |
| Daqing | 0.633 | 0.470 | 105.85 | 2 |
| Samotlor (Main) | 3.027 | 0.464 | 15.33 | 3 |
| Fedorovo-Surguts | 1.022 | 0.458 | 44.81 | 3 |
| Zuluf | 0.677 | 0.450 | 66.47 | 2 |
Using IEA decline rates (Table I), we get the following production profile for the top 16 in decline:
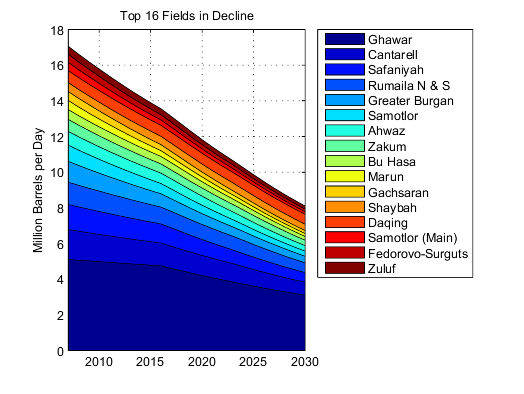
Figure 4. Field-by-field modeling for the top 16 fields using IEA average decline rates for super-giants.
We can substitute more realistic decline scenarios for Ghawar and Cantarell (see posts here and here):
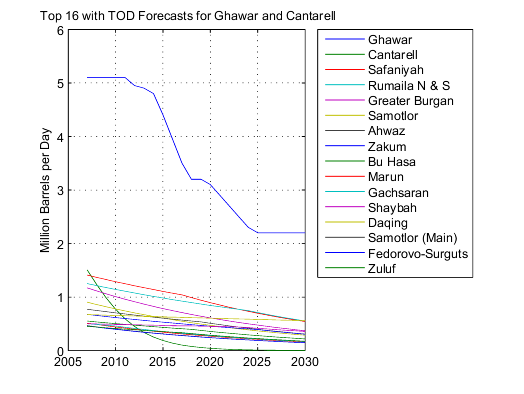
Figure 5. Field models for the top 16 in decline.
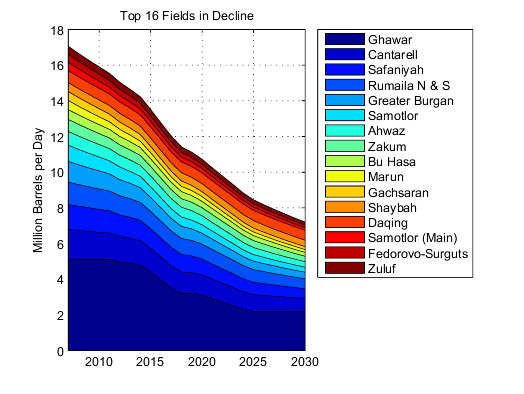
Figure 6. Field-by-field modeling for the top 16 fields and Mearns forecast for Ghawar.
The official Ultimate Recoverable Resource for the super-giants and giants is around 1.306 Tb, looking at a logistic projection we get an URR around 1.181 Tb with the official number being in the upper range.
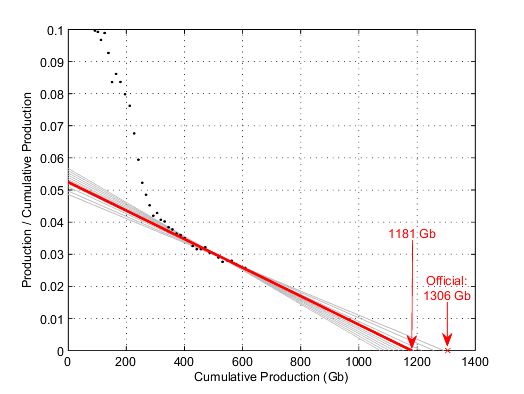
Figure 7. Hubbert Linearization technique applied on the SG/G production. Only the points between 1982 and 2007 are used for the linear fit calculation, the gray lines are the results for various starting year and the thick red line is the average.
With a cumulative production of around 600 Gb in 2007, it is likely that we have reached a kind of production plateau

Figure 8. Logistic model for the Super-Giants\Giant group for a total recoverable resource of 1.181 Tb, production from pre-2007 fields (light green) is assuming that those fields are entering production plateau in 2007.
A Sum of Exponentials is not an Exponential
What I mean by that is the equivalent decline rate for a sum of exponentials is not the average of the individual decline rates. The resulting curve from a sum of exponentials is not necessarely an exponential with a constant decline rate.
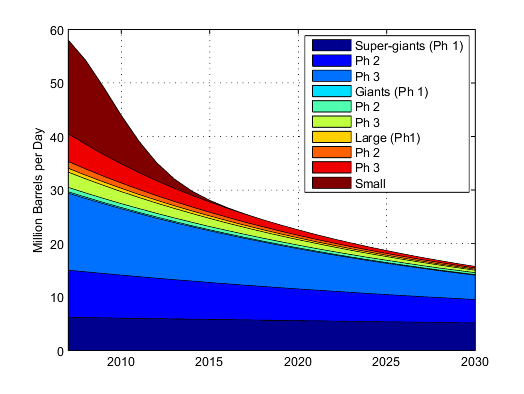
Figure 9. Projected production from post-peak fields in the resource base (derived from Table I and II).
However, the figure above offers a static view of the decline rate. Field in phase 1 will go in Phase 2 as soon as they pass the 85% threshold and then in Phase 3 as they go below 50% of peak production.
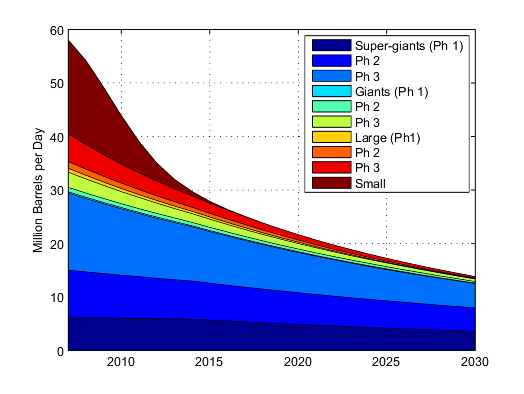
Figure 10. Post-peak components of the resource base decline with field-by-field modeling for the top 16 fields.
The resulting total decline rate has a complex behavior as shown on Figure 6, it accelerates for a few years before declining toward 4%. Interestingly, the asymptotic value for the blue curve is 4.35% which is exactly the value used by the IEA for their forecast.
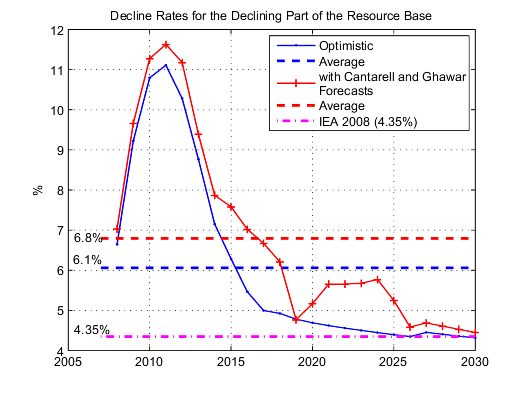
Figure 11. Decline rates for the declining portion of the resource base estimated from Figures 9 and 10.
The apparent decline rate peak in 2010 can be understood by looking at the relative contribution of each component to the total. We can see the small field component decline will have more weight at first.
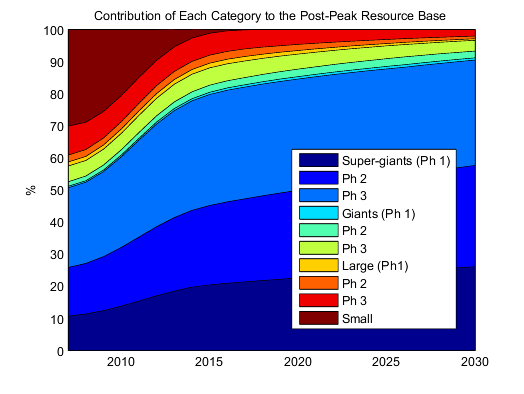
Figure 12. Contribution of each field category to post-peak resource base.
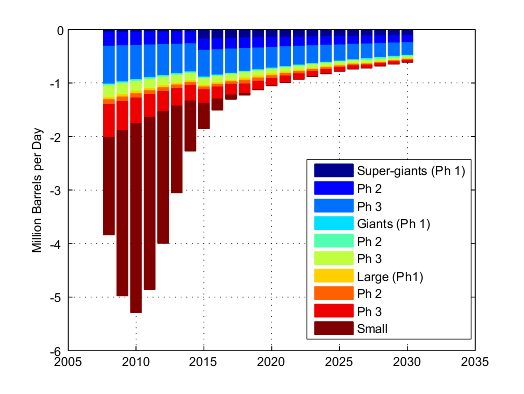
Figure 13. Annual production losses.
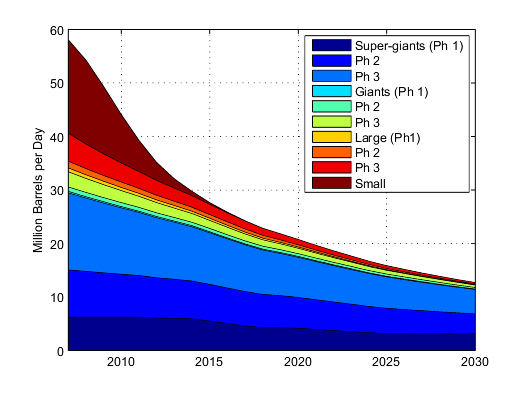
Figure 10. Post-peak components of the resource base decline with field-by-field modeling for the top 16 fields and Mearns forecast for Ghawar.
What's Missing?
Past this point, we will get even more speculative so bear with me. Figure 11 shows so project contributions from the Wikipedia database.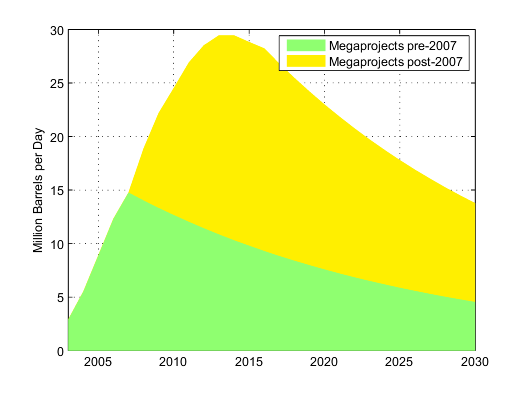
Figure 11. New supply from megaprojects derived from the Wikipedia database.
Strangely, if we use the pre-2007 portion of the Wikipedia database, it fills exactly the gap between the 2007 production level and the total amount in decline (69.8 mbpd). However, the resulting decline profile is far more bleak than the one used by the IEA for their final oil production forecast.
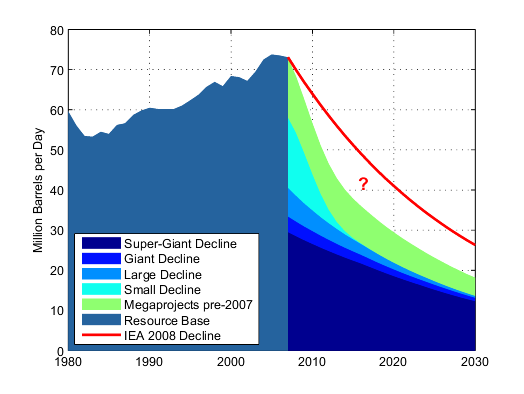
Figure 12. Potential Decline for the resource base using pre-2007 (inclusive) megaprojects from the Wikipedia database. The thick red line is the implicit decline (4.35%/year) used by the IEA.
Based on this decline profile and the logistic modeling for the SG/G category shown on Figure we can make an attempt to fill in the gap. I make the following 2 bold assumptions:
- Because the Wikipedia megaproject database collect mainly projects that have been sanctioned (i.e. financially approved) and press release are available, we can reasonably assume that the difference with the IEA new supply additions is the unsanctioned project portion.
- In
addition, the green area is a coarse estimation of total new supply
additions (including Yet-To-be-Found) that could come from the SG/G
category, we
can assume that the difference with the Wikipedia and IEA forecasts is
due to contributions from Large fields and YTF.
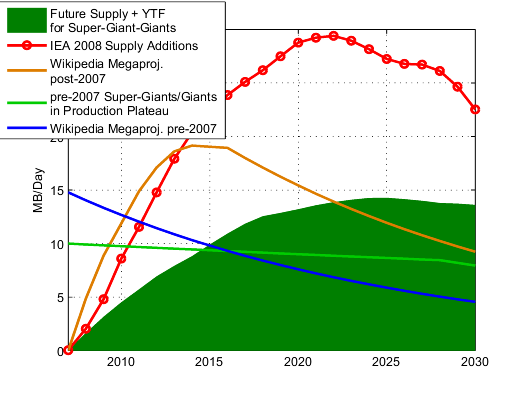
Figure 13. Potential contributions coming from new project additions.
- Declines for Super-Giants/Giants, Large and small fields of the resource based on the IEA analysis of decline rates as shown on Figure 10.
- Pre-2007 contribution from Super-Giants/Giants not in decline is assuming that they are entering decline phase 1 in 2008 (green line on Figure 13).
- SG/G New Supply+YTF: this portion includes potential future supply from megaprojects and new discoveries in this field category. It is based on a logistic modeling as shown on Figure 10 and shown as the green area on Figure 13.
- Large Old Supply: contribution from Large field is based on the Wikipedia megaproject database based on fields online before 2007.
- Large New Supply: contribution from Large fields based on the wikipedia megaproject database for sanctioned projects online after 2007 (in orange on Figure 13).
- New supply unsanctioned: estimate of the unsanctioned portion of the IEA forecast for new supply by taking the difference betwen their new supply forecast and the Wikipedia megaproject forecast.
- Canadian tar sands production reaching 3 mbpd in 2020.
- Enhanced Oil Recovery (aka Reserve growth) as predicted by the IEA.
| 'Super-Giant Decline' | 'Giant Decline' | 'Large Decline' | 'Small Decline' | 'SG/G pre-2007 growth' | 'SG/G New Supply+YTF' | 'Large Old Supply' | 'Large New Supply' | 'New Supply Unsanctioned' | 'Tar Sands' | 'EOR (IEA)' | Total | Overall Decline Rate (%) |
|
| 2007 | 28.11 | 4.81 | 6.96 | 17.5 | 9.98 | 0 | 4.78 | 0 | 0 | 1.0 | 0.000 | 73.20 | |
| 2008 | 26.93 | 4.50 | 6.24 | 15.68 | 9.90 | 1.64 | 4.05 | 3.21 | 0 | 1.3 | 0.2 | 73.44 | 0.33 |
| 2009 | 25.81 | 4.21 | 5.59 | 12.59 | 9.82 | 3.15 | 3.34 | 5.71 | 0 | 1.4 | 0.3 | 71.61 | -2.5 |
| 2010 | 24.77 | 3.93 | 5.00 | 9.06 | 9.74 | 4.4998 | 2.68 | 7.36 | 0 | 1.6 | 0.5 | 68.62 | -4.2 |
| 2011 | 23.79 | 3.68 | 4.48 | 5.84 | 9.67 | 5.7134 | 2.04 | 9.16 | 0 | 1.7 | 0.5 | 66.08 | -3.7 |
| 2012 | 22.74 | 3.44 | 4.02 | 3.37 | 9.59 | 6.9317 | 1.44 | 10.16 | 0 | 2.0 | 0.5 | 63.66 | -3.7 |
| 2013 | 21.84 | 3.22 | 3.61 | 1.74 | 9.51 | 7.9128 | 0.87 | 10.69 | 0 | 2.2 | 0.5 | 61.55 | -3.3 |
| 2014 | 20.96 | 3.02 | 3.24 | 0.81 | 9.44 | 8.8156 | 0.33 | 10.32 | 1.22 | 2.5 | 0.7 | 60.66 | -1.5 |
| 2015 | 19.83 | 2.83 | 2.91 | 0.34 | 9.36 | 9.8992 | 0.0 | 9.13 | 3.24 | 2.7 | 1.0 | 60.24 | -0.7 |
| 2020 | 15.37 | 2.05 | 1.61 | 0 | 8.99 | 13.202 | 0.0 | 2.21 | 13.35 | 3.2 | 2.8 | 59.99 | 0.3 |
| 2025 | 11.91 | 1.51 | 0.86 | 0 | 8.64 | 14.273 | 0.0 | 0.00 | 15.31 | 3.2 | 5.5 | 55.69 | -2.0 |
| 2030 | 9.81 | 1.03 | 0.459 | 0 | 7.93 | 13.607 | 0.0 | 0.00 | 13.3 | 3.2 | 6.0 | 49.33 | -4.9 |
Figure 14. Production scenario based on the Wikipedia megaproject database for sanctioned project, the difference with the IEA new supply is supposed to come from unsanctioned projects (in orange).
Some important caveats:
- There is a portion of YTF in the large/small fields category that is not included and could add a few mbpd by 2030 (see here for a discussion).
- Reserve growth is also not included but it`s a long term and diffuse supply addition.
- Some growth in production from small fields is not included (no data available).
- It is hard to predict growth in the not-in-decline portion of SG/G fields, my assumption (point 2 above) is probably too pessimistic.
Contact
- Content: editors at theoildrum dot com
- Tech support: support at theoildrum dot com
License

This work is licensed under a Creative Commons Attribution-Share Alike 3.0 United States License.
Khebab: I am simply blown away by the caliber of your post(s). Ironically, your analysis provides a bit of cold comfort, suggesting that after the initial hit from the more rapidly-declining smaller fields, the world will enter a more gradual decline phase.
Has the CIA contacted you with an employment offer?
I wonder if this 60 mbpd plateau represents a constant state of energy profit given that a growing percentage of its maintenance is oil sand and EOR dependent. Is not the reverse side of peak fraught with growing energy costs? Perhaps a adjusted energy profit curve would paint a harder future.
Conversely the inability to track small field startups may mean the analysis is slightly pessimistic in the short to medium term?
The analysis is fine. Within it's self accepted limits.
Sorry, I just don't think this stuff is linear and "projectable". I suspect the margin of error, the possible deviations, the wild deviations - those are much more likely than any smooth projection. So while an analysis like this is useful, it is deceptive absent discussion of the margin of error.
I tore off a tag this morning from a flyer posted at Maine Coffee Roasters - "Ever Dreamed of Playing the Violin?" Yeah, that's just the ticket I was thinking.
cfm in Gray, ME
Superb analysis Khebab. If I summarise well your analysis suggests that we will peak in 2008/2009, decline for a couple of years rapidly until we hit a new plateau around 2013 as new supply kicks in. Under the assumption that decline rates decrease significantly around 2012/2013.
I think that the effect of increasing number of deepwater fields going into decline between 2012-2016 also should be weighed within the equation as this would spur decline rates to deeper levels.
The plateau exists only if further investement is done and if new oil is found. If those two conditions are not met, the cliff will be much higher.
There is a very good editorial by Hugh Ebbutt a consultant in the UK that discusses what happens if your annalysis is correct.
"Those companies and people who eventually pull through this severe economic recession, after two or three years as the stronger parts of the world start growing again, may find themselves running straight into energy shortages that will have been made much worse by lower and slower investment now."
http://www.worldenergysource.com/wes/stores/1/Defining-Times-A-Chance-to...
Assuming those investments are not made, recovering from the decline rates may be impossible.
The trouble seems to come from thousands of small-large and small fields that are composing 30% of the post-peak resource base (Figure 12). This category decline at 10+%, twice as fast as the Super-Giant/Giant category. Unfortunately, it is impossible to keep track of new projects in this category and I don`t know how much supply we can expect.
According to CERA, quite a bit:
How OPEC can claim 8 mb/d spare after only cutting 4.2 mb/d is one of those deep mysteries, I guess. RIGZONE - Oil Cos' Bet on Swift Price Rebound Has Its Risks
http://www.energybulletin.net/node/48160
And right on cue: "Archived Feb 24 2009." Original should be on the ASPO site tomorrow - can't find it now - perhaps it has some additional graphic content. Will post at JD's blog as well, which has, of late, become a bit of a support group for those not enjoying all this bad news, complete with crude ad hominems.
Did you catch a posting of mine recently regarding a statement from peakoil.com member rockdoc123, Jeff? He says he's a petroleum geologist with 3 decades on his resume, and gives every impression of being who he says he is - talks the talk, with exceedingly detailed answers to very technical subjects. Also claims to have access to the IHS database in addition to the Wood Mac and others. Previously he was seeing a 2015 peak, but a few months back said it looks more like 2012. Check out some of his postings in THE OPEC Thread pt 3 (merged) Archived (formerly "Saudi Production: Collecting the Data," now renamed for archival purposes) for some examples of his work, if you haven't already. Interesting too that he has nothing negative to relate to the people working for IHS; I always wonder what prompts or motivates CERA. Are they just the bad apple in the bunch? Strictly a vehicle for the mandates of the top brass? I assume not everyone in the DOE is a bribe taking coke sniffer like those crazy nuts in the RIK division of the MMS, after all.
They are not 'bad apples' as far as I can tell. Their motivations and training were 'appropriate' for economic growth conditions of previous generation - starting a few years ago (as much as a decade ago) the game began to have different (ecology/sociology as opposed to economic based) rules. Post hoc ergo propter hoc reasoning reined when world economy was growing using high energy profit ratio to suppress necessity of lateral thinking, and that business would always parse the right decisions. The rules have permanently changed now and CERA/IHS methodology will in time prove to be too narrow in scope (to many it already has). This has happened often in history. These are not bad people - just outdated boundaries.
As the article noted, if CERA is that wrong about a province as transparent as the North Sea, why would we expect them to be any better regarding more difficult to evaluate areas?
However, the overall North Sea decline is proceeding exactly as the logistic (HL) model would have suggested (in 1999, the North Sea was about 50% depleted, based on HL, EIA C+C).
And Saudi Arabia is going to show three years of annual production below their 2005 production rate at about the same stage of depletion at which the prior swing producer, Texas, peaked (again based on HL).
Regarding CERA's motivation, I suspect that they are paid to generate optimistic production scenarios, so they generate optimistic production scenarios--in much the same way that the nice ladies working at the Bunny Ranch in Nevada are paid to provide a service.
I do think that the pronouncements by ExxonMobil, CERA, and OPEC that Peak Oil is decades away are doing a lot of damage to ordinary people--by encouraging them, in effect, to "Party On," by maintaining their auto-centric suburban way of life.
In any case, judge for yourself. If you had to put your money on CERA or the logistic model, which one would you pick?
North Sea & Texas plots:
http://www.theoildrum.com/files/TexasAndNorthSea.png
I had detailed "discussions" with rockdoc123 a few years ago. I argued quite a bit with him over reserve growth. I learned a bit but he is gung-ho about drilling. For one he liked the idea about global warming as it will open up spots in the Arctic for oil exploration. Oh no :0
Overall though, like many of the geologists, they have a pretty thick skin and they get over insults.
Russian oil production fell by 50% within approximately a decade due to economic collapse. Seems like a fairly good estimate for the world over the next 10 years?
Stupid Question: Has anyone figured out projected decline rates due to new project delays in this period of lack of credit?
It seems to me, as well, that the credit crisis and resulting low oil prices would make decline rates worse.
For example, when I visited the Chevron heavy oil installation at Kern River, there were more challenging locations (difficult to heat, more water issues, deeper), that had not been drilled in the past, but might have been drilled, if prices were high enough to justify their higher cost.
Chevron carefully evaluates each decision regarding additional investment. If prices are too low, they are likely to do less infill drilling, and production will drop more quickly. Isn't this going to happen in quite a few places?
Exactly the small fields have complex economics if you will. For example under the current economic conditions small offshore fields probably won't be redeveloped with secondary gas/water injection once primary production declines. Stripper wells have their on economic pattern and contribute 2mbd to US production for example. In many cases decisions to not continue production or move to more extreme extraction measures in many fields means they won't be developed again in the near future. As and example a lot of the oil production in Texas is from fields that where capped back in the 1980's and not developed again until thirty years later.
I estimated using the WAG method :) that about 15% of the worlds oil production was in this high risk category.
This fits well with Kehbab's estimate of 30% of the worlds oil production coming from small fields. Some of the high risk oil is in larger fields on the edge of steeper declines so given that 15% seems to be a very good ballpark estimate.
The only positive is that we are probably not doing a very good job of counting the contribution of smaller fields to the worlds oil supply in the first places I'd not be surprised if we are not underestimating the contribution of these fields by several mbd say 2mbd or so. So we could very well not even see the decline in the official numbers for some time. The WAG method indicated we would enter steep decline in 2008 this is in rough agreement with Kehbab's more realistic results but I think both approaches suffer from using the official totals since they should start from some "real" production level thats probably higher then the official numbers or better simply outside of the official numbers.
What this means is official production numbers will probably be high for a while even though real production is falling rapidly. In fact you get a sort of strange result in that as smaller production fails more oil will be sourced from monitored production and storage resulting in even higher initial estimates of both the oil supply and the amount in storage. Whats happening is some small tank storage associated with some small fields is drained as the field declines and its being replaced with "official" storage thats actually counted coming from larger producers.
I wonder if Kehbab can come up with a guesstimate of the amount of oil thats both in this high risk group and also not in the official estimates this is oil we need to adjust for.
Also of course for the same reason we probably have consistently underestimated the contribution of smaller fields so we probably also underestimate how many are approaching steep decline. All of this will serve to make the initial fall from the decline of small fields difficult to predict since I believe that we are missing enough data to make the initial error on the same order of magnitude as the decline rate. I've got no idea if the various potential sources of error tend to cancel or not. So the big question is is there any systematic bias thats skewing results for small fields.
And fantastic work Kehbab ! I've been concerned about this for some time its great to see some real work done on the problem.
Henry Groppe's firm audits official data for oil production; according to him, the EIA/IEA numbers are off by a variable that can be as high as 2 mb/d, due to Iranian double counting etc., perhaps this is where some of the discrepancies come from. As for microprojects, there was the review of the Wiki Megaprojects work that suggested that small fields were going unaccounted for.
Maybe the Baker Hughes rig count gives a hint.
During the last few months drilling activities slumped considerably in the USA, whereas there is (almost) no downturn on the international level.
Maybe this difference is partly due to the fact that in the USA oil production is run by private owners (often small ones), which may be hit hard by the credit crisis, whereas almost everywhere else oil production is run by the state.
The international numbers don't make much sense to me. Baker-Hughes states that they do not have data for Russian or onshore China, however, they have zero for rigs in Iran and many other countries. The number of active rigs is considerably lower for the rest of the world when compared to U.S. and Canada. Maybe Rockman or somebody else can explain why that would be possible.
I don't know gogh. I don't follow overseas activity even though I may be heading over "there" later this year. Just a WAG but I can imagine the numbers are understated to a degree. Those operations aren't as transparent as they are in N. America. But as far as US activity, as someone else mentioned, we are the land of small operators. Most don't realize that the small US operators collectively produce more then all the major oils combined. Exxon is big but last ime i saw the numbers they owned less then 5% of US reserves.
Although it's exclusively offshore, the North Sea case history is interesting. The overall decline rate from 1999 to 2008 (through November, C+C, EIA) has been -4.5%/year, but the initial three year decline rate was only -0.6%/year, from 5.9 mbpd to 5.8 mbpd, while the decline rate over the following six years was close to 7%/year. The initial three year North Sea decline (2000 to 2002) looks a lot like world crude production in the 2006 to 2008 time frame.
BTW, in my opinion, the real news from ASPO-USA was Peter Wells' comment in the Q&A that North Ghawar would be effectively watered out by the end of 2010. Therefore, both North Ghawar and Cantarell both may be effectively watered out by the end of 2010. Wells' comment was especially interesting since he gave an optimistic assessment of world oil production using the IHS data base.
In any case, great work, as usual.
WT -- did Wells define "watered out"? We both know that Ghawar will still be producing oil 100 years from today. Maybe only a few 100 bbls/ day at a 99.5% water cut. Is he perhaps using some specific water cut as a definition of "watered out"? Or perhaps a sudden rate change in w/c? Not a critical point really but undefined terms tend to bug me.
More important though: your decline numbers for the N Sea - are those declines for just previous drilled up fields or does that include any new production along the way? I'm guess it's gross production from all wells at anyone point in time.
I believe that the southern portion of Ghawar is showing increasing production, but I understand that the reservoir quality degrades significantly as one goes south.
The North Sea decline rates are what Simmons defines as "Net," i.e., older production + new production. I just used the EIA annual crude production data.
The assumption that Ghawar will be producing some oil a century from now is based purely on a technical assumption and fails to account for the reality that the political situation in the kingdom is dominated by the largesse that comes from oil sales. In fact, the collapse of oil prices in the 1990s is partly what led competing princes to fund potentially revolutionary groups like Al'Qaeda, since those princes were cut off from the centuries old tradition of simply seizing the throne. Instead they began to go around the United States, which acts as guardian to the Saudi throne, funding forces which might allow them to topple the existing regime.
With the onset of a price collapse that may be just as bad or even far worse, the stability of Saudi Arabia cannot be assured. Lack of political stability can cause lack of investment which can lead to a total cessation of Saudi production in far less than 100 years.
While technical discussions are important because they define the physical boundaries in which solutions can exist, those discussions cannot be considered realistic unless or until they include economic and political considerations. The political situation in Saudi Arabia does not look good in a world of steep price declines. Khebab's work is useful in that it helps establish realistic upper bounds to the question of oil production in the near future. The lower bound, of course, is always zero, dependent on political stability.
No GZ. Ghawar will be still producing 100 years from now. An insignificant amount but will still be producing. Just as some fields I've mananged that have been producing for over 60 years are are still generating small but nice cash flow. and those fields will be producing for another 40 years or so.
Maybe the KSA will turn into a glass parking lot in the next 20 years. There may not be any Saudis alive let alone the great grandsons of princes. Doesn't matter. When the radioactive cloud settles someone will poke a few more holes and get some more juice out. Of course this whole conversation is of little importance. You put too much importance (actually any is too much) to my statement. But I still stand by my statement. And if I'm wrong I'll pay you $100 million when proved so in 2109.
Hey, I want in on that action!
Something I'd be keen on having is statements from BP/Statoil/etc from the late or mid 90s saying that the North Sea won't peak until some faroff date, like, er, 2009. I've heard of such statements but never seen them. Something like that states your case rather forcefully.
"While technical discussions are important because they define the physical boundaries in which solutions can exist, those discussions cannot be considered realistic unless or until they include economic and political considerations. The political situation in Saudi Arabia does not look good in a world of steep price declines. Khebab's work is useful in that it helps establish realistic upper bounds to the question of oil production in the near future. The lower bound, of course, is always zero, dependent on political stability".
Yes Greyzone. I think that given the chaos that global warming/climate change, combined with resource depletion and damage, is going to precipitate for 7 billion people upwards, one should plan for a worst case scenerio. That there will be no oil available, or if there is, intermittent and rapidly declining supplies. The U.S. and, global response, to the economic crisis has only reinforced my faith that I have no faith in human systems now, let alone when the S really HF. Guess that puts me in the doomers basket on this one.
I would think that it would mean the well has gone up the steep portion of the sigmoid fractional-flow curve. Hence probably in the 90%+ range of water cut.
I have a serious problem with "New Supply Unsanctioned". This seems to be; this is the IEA's guess as to what new oil will come on line. I have no doubt that some new supply will come on line but how do we arrive at such a huge amount? This seems to be just a wild guess, similar to the ones we have seen before by the IEA as well as the EIA. And in the past, these guesses have always been way too high. What assurance do we have that this guess will be any better.
Ron Patterson
I share the same concern, unfortunately there is no way to cross-verified their numbers as they are coming from a private database (the same CERA is using). My own intuition tells me that only half this supply will actually show up.
Thanks for the very good work. One might ask why such an important topic has not been dealt with in the open by all the major energy institutions who have detailed data at their disposal (I hope). We have done private client work on more than 1500 fields and their production profiles over a 30 year period to track the moving rates of decline, recovery factors, their variation over time, field size, country and operating environment. Decline rates on individual fields vary widely but 20% annually is not uncommon, depending on field size and development cost and regulatory regime: Brazil has much better performance than the USA for example for deep water fields. These results are not captured by the IEA and they know that and neither are they captured by Megaprojects. Decline rates get bigger as fields get smaller, roughly speaking, but are very high for many large deep water fields. It is money not geology here. To complicate matters, decline rates can be measured in several quite different ways for regions, fields and over time.
The short answer to the question about future fields and their projected contribution is that the number of discoveries and fields left undeveloped is very large indeed and that only perhaps one third of visible potential field projects actually go into production within their expected timespan for development. Very broadly, there is still a fair amount of oil identified that can be produced given the right balance between cost, commodity price and an acceptable rate of return (far more at a modest 10% return on capital). Exploration has been at a very low level for more than 25 years so what is left to find remains just that, potential. The real clue to why we are at this critical point is that a) most barrels discovered or not are left behind in the ground and b) that we use at least twice as much of the stuff in the OECD when we do get it to market as is necessary. The reason on both counts is money: the profit desired for production and the price we pay at the pump or elsewhere. Sustained high prices does raise supply (of all liquids) and does reduce demand. Of course both these factors are always out of balance and so we stagger from crisis to crisis. Too late now to fix the supply side, but the market crash does provide a breathing space of sorts since demand will probably not return to 2007 levels before 2012 and if and when it does the supply is unlikely to be there. Result: price spike starting any time from late this year onwards.
I won't argue with you on the production side but on the demand side I suspect that world demand has already turned the corner and is now increasing slowly. Historically oil demand declines stop and reverse early in the economic downturn cycle. Globally we could be back to 2007 as early as the end of 2009. Declining demand at least in the US has actually been going on since 2005 using VMT it did not start in 2008.
You can look here and the change vs 2007 seems to have already declined in a statistically significant manner.
http://www.fhwa.dot.gov/ohim/tvtw/08dectvt/index.cfm
My opinion is one of the main driving forces behind our ability to return to growth from past recessions is that we begin to burn more energy for less marginal return. Eventually this helps turn around the economy. Energy usage thus actually increases well before the economy actually returns to growth. A simple example is a plumber driving long distances to do small jobs for a marginal profit that he would have turned down in better times. Basically everyone that can trade using more energy for making money can and will.
On top of this a good part of the initial energy decline is in the discretionary part of the economy so it tends to inflate the decline trend on the way down. Despite the fact that most people dismiss the argument that energy usage is inelastic it is. Whats probably a better model is you have a small precentage of energy usage thats discretionary and highly elastic on top of a base usage level that effectively inelastic. Think of jello sitting on a plate you can readily push your finger through the jello but not the plate. As people attempt to burn more energy to make money the usage is actually in the inelastic portion not the discretionary portion so if I'm right and energy usage has/is/will soon bottom and start to grow this new demand is itself inelastic since its driven by basic economics not discretionary spending.
Are you familiar with the IEA's excellent document Saving Oil in a Hurry, memmel? Fairly exhaustive work, and much sound advice on how governments can motivate people to reduce their consumption.
I don't think memmel's argument was that we don't know ways to conserve expensive oil.
I think his argument was that, cheap oil in a bad economy doesn't remain cheap for long - people who are desperate for money will gladly trade cheap oil for expensive money.
Exactly !
My entire monologue replaced with one simple sentence :)
But, did you know that oil price declined only in 1930, continuously rose thereafter? And note we did not get to PO in those days.
That is not correct. As you can see here, oil prices have declined many times, including four straight years in the early 90s.
memmel,
If you look back on Stuart Stanifords post( 11Feb2007), VMT bounced back, but fuel economy improved by a massive 6.5%, in 1980 and gains continued for a decade.
So it might be more accurate to say there is a rapid and temporary reduction in VMT( giving a reduction in fuel use), and a change in vehicle use that gives an immediate improvement in fuel economy, followed by a much slower response as improved CAFE standards impact on new vehicles, and a bounce back in VMT.
Since their are now 220Million vehicles for 110 Million households many have 2 cars so can choose the higher mpg vehicle for more or longer trips. People who travel a lot of miles may trade in a low mpg vehicle and buy a new or used high mpg vehicle, and more of the short trips that have very poor fuel economy may be combined with longer trips( same VMT but better mpg).
If oil becomes expensive then of course people will go back to conserving if they can. Generally however these two cars are driven by two people employed in different areas.
As far as the 1980's goes your mixing apples and oranges. First and foremost this was the period when significant numbers of jobs where moved outside the US so declining US consumption does not mean world consumption declined at the same rate. I'd also suggest that the collection of both consumption and production data at a global level was not as refined.
Next even with this we also had a large switch to NG internally and away from fuel oil.
The trend actually started in 1969.
http://www.eia.doe.gov/oil_gas/natural_gas/data_publications/historical_...
But by even the early 1970's natural gas supplies where plentiful. Combine continued strong natural gas demand with the movement of manufacturing out of the US in the late 1970's onward and we have a country that was already well positioned to move away from fuel oil in the manufacturing area.
http://www.eia.doe.gov/oil_gas/natural_gas/data_publications/historical_...
The 55mph speed limit also had a big effect.
http://www.drive55.org/
This has the savings at 3% I'd argue could well have been higher back in the 1980's because of the poor aerodynamics for cars of that time period.
We don't know compliance but one would guess it increased substantially following the oil price increases in the 1980's.
So I'd suggest that a combination of factors unique to the 1980's could easily be responsible for 3% of your 6.5% change.
Next going off of historical recessions changes in the 2-3% range are routine at the start of each recession. This leaves for the 1980's about 0.5 -1.5% change in fuel consumption from true conservation.
Our cars are more efficient today and one can guess going forward the change in the fleet fuel efficiency mix will be slow as people loose access to long term credit. But the best case scenario for conservation is the same 0.5-1.5% increase in efficiency but this is questionable.
I agree that a return of the 55mph speed limit will probably give us a 3% boost if its politically feasible. Eventually of course it will return.
Overall at least until oil prices increase significantly I've argued we can expect US oil consumption to remain flat neither increasing dramatically from where it is today nor falling dramatically. I expect it to initially trend upwards approaching the same levels we had in 2007 then higher oil prices will slow this upward trend then finally flatten or reverse it slightly. My best guess is once we have sustained high oil prices that we will see US consumption trend downward at 0.5-1% annually generally for the same reasons your giving. But this is under a high price scenario not a low price scenario. If the changes in consumption are not capable of causing significant changes in price in the future then I'd argue that they are not that important economically.
People will be forced to spend a significant and increasing amount of their salaries for oil this will ensure we cannot expand the economy to cover expansion of our debt based currencies. Attempts to inflate will be swallowed if you will by higher commodity prices and probably continued and persistent defaults on long term debt.
Finally you hit the real problem at some point regardless of what happens long term lending will be permanently crippled esp for the consumer access to cheap long term debt will become a thing of the past.
Credit will only be available to the most credit worthy and I suspect even then interest rates will be relatively high.
For the US at least this is what will kill our civilization once people no longer have access to cheap 30 year loans with minimal down payments for houses and similar loans for cars the game is up.
This situation is actually already in the past but it was hidden by cheap money from the Feds and the housing bubble. My best guess is the "real" end of cheap credit actually happened back in 1995-2000 this was the point at which the US consumer was obviously on a downward trend as far as the amount of money they had to service their debts.
A very good paper.
http://www.csa.com/discoveryguides/debt/review.php
You can see the consumer hitting the wall during 1995-2000 with a final deby orgy fueled primarily by government policies over the last few years.
This is a pdf but so I can't easily extract the graph but another excellent paper.
http://repository.upenn.edu/cgi/viewcontent.cgi?article=1000&context=pen...
The short version is most of the explosive growth in debt since 2000 has been mortgage debt.
Now back to oil and your premise.
The consumer has to decide how to spend his dwindling salary over the next several years. Lets assume that oil prices go back on their upward trend.
He can choose to continue to pay the mortgage even though he is underwater on his house and drive more efficiently or he can default on his mortgage debt and rent dramatically reducing his expenses and freeing plenty of money up to continue to drive as needed.
Given that we have and excess of housing we can assume that rents will also fall over this period and of course in general most people are willing to rent a lesser property then they would buy to conserve cash.
Thus my scenario is that conservation of oil will continue to not be a major factor in the future instead as gasoline prices increase it will simply put more and more pressure on people to default on their mortgage. Certainly the stigma of having a foreclosure on your record is dwindling and we can expect this to continue thus you won't be a social outcast if you default on your mortgage over the next several years. In fact you will be considered a smart money manager living within your means.
Sorry to approach this topic sideways but its important since at least for the foreseeable future the best way a consumer can increase cash flow will be to default on long term debt and also credit card debt. Only after the American consumer has exhausted this source of cash flow will they finally be forced to seriously conserve money. And of course at this point their horrible credit record will make buying a more fuel efficient car difficult. Many will probably opt to purchase cheaper gas guzzlers unwanted by the few remaining people with credit. We have seen that these are heavily discounted to cover the differential in gasoline costs. Thus you have a choice of spending 20-30k you don't have for a fuel efficient car and a long payback period or 5k for a used gas hog.
Many will have no choice but take the latter route.
Given the level of mortgage debt and the runnup in housing prices and looking at the graph in the PDF we have Mortgage debt from about 1986 or so that can be defaulted on.
What I mean by this is that as housing prices fall I think we can readily expect them to fallback to 2000 levels. Someone who bought a house in 2000 should by now have some equity built up in their home so as home values start eating into this equity these people can and will sell to extract their equity from housing. From 2000 back your in a tight downward spiral with more and more people that had significant equity choosing to sell while they still can. This takes even further back in time for house prices till you finally hit the 1980's where people who bought then either have their homes paid off or close to paid off. Only at this point do you reach a level that elimination of mortgage debt no longer makes sense.
My opinion is this will take at least 10-15 years to play out by itself.
The fall back to 1995-2000 level prices will be rapid I'd not be surprised to see most of the country back at this level within four years. The decision to default however happens at a slower pace as people are forced into default.
I find it compelling that my argument results in us only conserving like we did in the 1980's once we reach both the debt level of the 1980's and basically the credit availability levels of the 1980's.
All kinds of cool charts here.
http://www.creditslips.org/creditslips/2009/02/the-folks-who-write-credi...
With this picture you can literally see your American consumer cave in and choose the path of ever increasing debt vs its initial conservation response in the 1980's. Paul Volcker can probably single handily be given responsibility for keeping the consumer inline during this period.
I'll just close this long winded post off but I hope that the argument makes sense that only after we eliminate this large overhang of debt primarily via mortgage default will the consumer actually and finally conserve as long as they can readily double our triple their cash flow via defaulting on debt esp mortgage debt we can expect that this will be chosen by enough people that conservation won't become important even as oil prices increase.
(off original topic but worth highlighting)
Being able to 'walk away' from a home loan seems unique to the US -unless you go bankrupt it is not possible here in the UK.
The upshot of this is that the US Banks will have bad-debts on their books for years -someone will have to pay for this. If the banks are nationalized the US Tax payer will pay. Of course you could always try and package these things up in some sort of new 'Junk-Bond' and sell it to the Chinese but I doubt anyone will trust the US Financial system after the MBS fiasco.
Nick.
Memmel,
Stuart Stanford's post was only looking at gasoline consumption and VMT, not oil consumption. Raising CAFE by 50% is a proven method to slowly raise fleet mpg, but the new CAFE standards could be higher than 35mpg and come in earlier, if PHEV's getting 150mpg are built and sold in significant numbers. 50mpg by 2020(increasing 2.5 mpg /year) would seem a better target.
No argument that mortgage debt has been a factor in 2007 recession, but not the size of debt, but the cost of servicing 30 year mortgages. Larger mortgages and higher interest rates especially re-setting rates were deadly. If the Fed can engineer a low mortgage interest rate environment, households will be able to reset down, greatly reducing payments. In Australia, we still have gasoline >$US3.50 a gallon, but mortgage rates have dropped from 9.5% to 5.5%(most people have a variable rate, 30 year fixed rates are not available) so the 60% of households with mortgages have had an immediate increase in disposable income. Low income families have also had an increase in income, and most high income people here actually pay higher income tax.
I don't see how the commodity price spike in early 2008, including increased gasoline caused the recession,( it was bank real estate losses). Many countries have experienced gasoline prices much higher than $4/gallon without going into recession. Moving from a period of declining commodity prices to rising prices triggered the higher interest rates is what finally stopped house price increases, in combination with sub-prime mortgages re-setting.
How does any recession end?
Well for one thing Australia is not America and your dollar is not the reserve currency. Your central bank is playing printing games like the US but it will blow up in your face at some point. You can't keep interest rates low for ever without eventually causing inflation.
I'm not trying to be and ass with this statement just pointing out that the
Australian dollar will be massively depreciated if you try and force rates low like this for too long.
The mighty US dollar itself probably does not have long before our ridiculous spending forces interest rates back up and or the dollar to devalue or most likely both.
My bet is that one of the big currencies in the world is going to collapse this year or the governments associated bond market is going to collapse. Two of the top contenders are Japan and Australia actually.
Someone much larger is going to pull a Iceland. Next I suspect that when the US tries to sell the trillions of dollars worth of treasuries it needs to sell to fund its monster bailout that this will trigger the collapse. I don't think that the US bond market will collapse but I think you will see the dollar dive vs other currencies then I really think we will pull back and allow our interest rate to rise.
Regardless of how it plays out someone large is going to get the rug pulled out from under them another obvious candidate is Britain. Other possible scenarios are a mix of smaller currencies say Mexico, Argentina or your pick of any country in south east Asia. Once one freely traded currency collapsed or a government defaults on its bonds this game of low interest rates are over. Turkey or Egypt are other likely targets.
Switzerland is no longer immune either.
I bring this up because low interest rates are in my opinion important for allowing the fiat game to continue but the entire system is simply to unstable to support them for much longer.
Bottom line to be extreme is the US is getting ready to literally suck basically all the money in existence out of the rest of the world in order to save itself their will be casualties. There is absolutely no way we can flood the world with debt without some serious side effects.
And yes I fully expect Australians to get smacked hard and soon and there is a good chance it will be hard enough to destroy your currency.
My Honda, that used to get not-quite 40MPG is now down into the low 30MPG range. All the pumps here in Maine have been sporting "at least 10% ethanol" as I notice that change. Might as well be 10% water for the results I'm seeing. It's colder, yes, but the oil is new and all synthetic - EROI on that???? All the empty coffee cups in the car don't add up to enough mass to make a difference. Tires are properly overinflated.
Somehow this all seems like the epicycles of Galileo's time. I look at all the roads and the snowbanks and wonder just how is that going to work once the first roads and driveways are no longer plowed. Lovelock is talking about deserts in 50 years, climate change tells us the seacoast will reconfigure. Meanwhile the Obambis are preaching more prosperity. Michelle is going to get a dog, the news media tell us. [Actually, I think that's a good idea - she only has to learn to listen to it.] Carbon credits, where if industry exceeds their quota, they have to pay more - and we'll be down to 2005 limits by 2050 (or was it 2080).
Mortgage debts people cannot pay in their lifetimes. Let alone national debt. Or credit cards. And still, Nature never gets paid. Add another epicycle. The paradigm is wrong and we're stuck in it so everything we do in the wrong paradigm makes it worse.
cfm in Gray, ME
Evidence suggests that oil demand declines are erased only after the end of a recession. Looking at US petroleum consumption (EIA), we can compare year-over-year consumption for past recessions.
- The recession in the early 80s went from Jul81 to Nov82, and year-over-year consumption for Jul-Nov was down an average of 0.7Mb/d, and it was not until Aug83 that oil consumption first went above its 1981 level.
- The recession in the early 90s went from Jul90 to Mar91, and year-over-year consumption did not surpass its 1990 level until September, six months after the end of the recession.
- The recession in the early 00s went from Mar01 to Nov01, making it hard to see consumption trends.
Based on recent US history, oil consumption seems to recover only after the technical end of the recession. Based on this, and based on the assumption that the current recession will continue until late this year, history would suggest that oil demand is unlikely to recover until at least next year.
As you point out, though, demand has been declining in the west for several years, suggesting that even after an economic recovery oil demand may be very sluggish. Moreover, current economic conditions have lowered oil exploration, especially by smaller companies, which suggests that supply and price may also retard the recovery of demand. Personally, I wouldn't be surprised to see 2007 demand remain the high until 2011 or later, especially considering the most recent IEA OMR forecasts that 4Q09 demand will be 2.3Mb/d lower than 4Q07. Oil demand is probably going to be down for a while.
Maybe they're adding up all those quietly capped monsters of oil patch lore.
Can you correct my math, or tell me where I am going wrong.
From the last column in the final table you report yearly decline rates varying from +0.33 to -4.9%. I tried to estimate what the overall (2007 to 2030) decline rate was and got around 1.8% (using a simple exponential (a=b^c) where a = amount remaining (as a decimal), b = rate of decline (as a decimal) and b = time, solving for b and subtracting it from 1. Thus 73.2- 49.3 = 23.9 and a = 1-0.239 = .673(the proportion remaining in 2030); time = 23, and c = 0.982 and thus the rate of decline over the 23 years is 1-0.982 = 0.018 or 1.8% (since it is a decline, the rate would be -1.8%).
This is generally less than the figures provided in the table and is less than the 5 to 9% often quoted as the estimated rate of decline for the rate of production. Where have I gone wrong?
For the 'Super Giant" decline I looked at the first 3 years and got annual decline rates of around 4%. Where does the 10% you mention come from?
Please understand, these are NOT criticisms. They are just the questions that I have to answer to myself so that when I do talk/write about it, I feel confident in the numbers.
Don
-1.8% seems about right:
exp(log(49.3/73.2)/23)-1= -0.0170
Also if I take the average of the last column: -1.7 +/- 1.5 %
this is the equivalent decline rate for the total production, the 5 to 9% figure often quoted is for the resource base only (i.e. not including new projects, YTF, etc.).
Re: For the 'Super Giant" decline I looked at the first 3 years and got annual decline rates of around 4%. Where does the 10% you mention come from?
the 10% is from the small field components (see Table I), for Super-Giants the average is now around 3.4% but it is likely to accelerate toward 4-5% as more fields go to the next decline phase.
Thanks, that makes me feel better (and a bit more confident in my math)
Don
Very detailed and useful post. The road ahead looks pretty rocky.
In Table III, there appears to be an error in the math for
Daqing 0.633 0.470 105.85. I obtain a ratio which yields 74.85% rather than 105.85%.
Yeah, all those pesky and irrelevant "above ground" boulder fields. Leaving aside how trustworthy the data might be, this smooth decline only works if everything stays peaceful and calm. Seems to me we've already seen that is not the case.
cfm in Gray, ME
How I have missed the colourful graphs...
Regarding the first bit of Fig. 14. -This is looking awfully like the sort of profile I would expect due to credit crunch induced demand destruction / supply shut-in.
The real test will come when / IF? the worlds economies begin to recover and the taps get turned on again and ... well, won't there be a brief up-blip at that point before another decline to this plataue??
A decline not during a recession or while prices continue to soar would be a sure sign of trouble ahead but I wonder whether it will not get constantly masked by economic turmoil in the decade ahead...
Still , I am strangely relieved that it does not look like a cliff to 2030 (more time to adapt).
Nick.
Is that correct?
A*exp(x) + B*exp(y)=A(exp(x)*(1 +k*exp(y-x)), where k=B/A.
Even if you stagger the fields coming on line(in time) I doubt that it would be true either as Laplace transforms are all exponentials.
Also the increases in unconventional oil are pitifully small and I would guess they will be much larger once conventional starts to be exhausted.
Hitler ramped up erzatz gasoline from coal in the midst of WW2 to 124000 bpd from nothing in the 1930s.
South Africa ramped up to over 100000 bpd in about a decade. Sasol says CTL is economic at $35 per barrel so it would appear that a shift from +$35 per barrel oil to $35 per barrel CTL would be possible technically.
http://www.caer.uky.edu/podcast/Gibson-KESummitOct2007r.pdf
Most optimistic projections require big amounts of unconventional oil and even CTL.
Hope I don't ruffle too many feathers :-<
Feather ruffling is required every day please. We get it wrong because we become convinced that one view is always true regardless. The fact is that given enough pain and high energy values we can deliver very large volumes of liquid fuels of many kinds as long as the price is there. Technology and scale can deliver but not at the prices that have prevailed for 25 years or so of the last 30. The customer does not care if he is using methanol or CTL or whatever. He cares about availability and when he has to pay its price he will care too about how much he uses. We are ingenious as well as greedy, so ruffle on please.
RE: Is that correct?
A*exp(x) + B*exp(y)=A(exp(x)*(1 +k*exp(y-x)), where k=B/A.
What I meant is "A sum of exponentials is not an exponential with a constant decline rate" because the instantaneous decline rate is not stationary anymore and becomes time dependent (as shown on Figure 11).
...I would guess they will be much larger once conventional starts to be exhausted.
Maybe or maybe not, opposition to Canadian tar sands because of its environmental impact is growing steadily and we are producing only one third of the projected 2020 production. Reserves are huge but flow rates will probably remain mediocre compared to conventional oil sources.
A dispersed range of exponentials with a variate that itself is exponential gives a 1/x dependence in the tails.
It may be interesting to recall that for a simple exponential decay, the decay rate is simply the inverse of the R/P ratio : for example , with 40 years of reserves, the expected decline rate is around -2,5 %/yr.
However, the logistic (Hubbert ) curve does not obey exactly this rule, because it is flat around the top, and then the decline rates grows with time. The exact expression is P=Pmax/cosh^2(t*Pmax/Qmax), where Qmax=Q0/2 is the reserve at the maximum, so the asymptotic decline rate is actually twice the peak R/P ratio. It may be worthwhile to compare these very simple estimates with the more detailed Khebab's calculations ?
Under a specific condition, the decline rate can actually stay more or less constant yet it looks like it varies quite a bit. That condition is where you have reserve growth involved in the maturation of a reservoir. As the decline rate acts on the proportion of reserves left (as inferred from the exponential), then you can have an apparent low decline rate at first which then increases and reaches an asymptote as the reserve growth dissipates. I believe Khebab is well aware of this behavior but chose to break this out piecewise, perhaps because he wanted to show the effect on different reservoir sizes.
The effect of reservoir sizes actually doesn't bother me to much because I don't think it is that strong a bias. As the reservoirs get smaller, as in stripper wells, the decline rates may actually get smaller. So, over a large range it makes a lot of sense just to keep that decline rate a constant and you then get a simpler approximation. The following describes a two parameter curve, one parameter describing reserve growth and the other parameter giving the extraction/decline parameter.
ASPO's latest revision (Dec '08) shows an all liquids decline from 80 Mbpd to 55 Mbpd from 2010 to 2030. This is 1.25 Mbpd/year, or 1.56%(of original value)/year.
A decline rate of 1.56% doesn't worry me.
It depends on how we respond, and the key is not all liquids but crude oil. A 1% decline in world supply would require the U.S. to build 7 million plug-in hybrids or about 5 million electric vehilces/year to make up the difference. And yes, we can also make that up through conservation, after you get down about 5 to 10%, your going to have to so some serious planning to reduce consumption more. This is the rub, we are going at the problem right now like the free market will take care of it. It won't. The scale and speed are too great.
Actually just under 2% as a continuous percentage decline. And note that we have been used to a nearly 2%/y increase, so the delta is almost 4%... this will cause some changes.
And our model, recent histories and current data suggest a long term accelerating rate of decline in net oil export--with countries like Mexico, our #3 source of imported oil, on the express train to zero net oil exports.
Hi Kehbab,
Great analysis. Three questions
1) Do you have any idea of what EROEI will do to the production curves if they are modified to show the actual oil available, vs. raw produced?
2) At what point will resource nationalism come into play, further constraining the supply?
3) What software tools did you use to do the analysis and charting?
I'm also worried about a kind of negative perfect storm in 3 years:
1) All of the industrial nations collectively make a rush for the exit and try to simultaneously build sustainable energy systems,
2) Production from delayed mega-projects is unable to meet the sudden demand increase,
3) Resource nationalism and opportunism kicks in reducing production, and,
4) Crude prices spike.
Very impressive work, Khebab.
However I still have my general doubts about the long-term usability of the Wikipedia Megaprojects Database, which haven't been responded yet:
This database may be helpful to anticipate the production capacity for the next few years. But as the database is based on the announcement of new project it cannot tell anything about years for which projects usually aren't announced yet.
So according to the database the number of projects seems to peter out considerably from 2012...2013 onwards. But this doesn't necessarily mean that no more projects will come, as some still may be announced on shorter notice.
You could have same experience with projects for roads, houses or power plants. We may count quite a few for the next few years but almost none for 2020 or even 2030 - which doesn't necessarily mean that these won't come. Or were all projects that were realized last year already announced 20 years ago?
(Apart from this of course any long term projects are due to siginificant uncertainty: Who really knows how much and how long they will be affected by the current crisis - or if there will be a miraculous boost as the IEA expects.
Furthermore there may be impredictable effects of mutual feedbacks between the downward spirals of economy and oil production. For example the oil decline may trigger phases of economical collapse, which curb the oil price, leading to subsequent recovery phases etc, like in the former Soviet Union.)
Hi Drillo,
One of the things that is going to make future oil project predictions very difficult are the feedback loops you mentioned. If the price of oil spikes again, then, yes more marginal production becomes possible, but it would also increases production costs. Once that happens, many sustainable systems become cost competitive, and as a result, may supplant the oil projects. Wild oscillations may be a continuing state as we swing from stalled economies to government desperately funding sustainable energy infrastructure. I hope those who are in the driver seat think of this and ways to dampen such oscillations.
But with low priced oil and hard to get credit we are seeing projects cancelled/delayed rather than new ones announced. Furthermore, the larger projects already took six years or more to bring on stream before the credit crisis hit, Brazil's sub-salt will likely longer, maybe much longer. This means that not much new stuff will happen before 2015, more likely 2016 if oil does not recover before mid year.
Yes, you are correct, there is a project horizon window in the Wikipedia database around +5 years in the future. However, I completed my scenario using an estimate of the IEA forecast for unsanctioned project that is creating the big bump of supply past 2012.
wow. What a post. Thanks!
One thing that I do find missing from your post, and most analyses I read of this nature is the question of Net Petroleum Production. Your last chart seems to indicate something like 62mbpd in 2013. However, it looks to be 60-ish mbpd out to 2025.
Which says to the immediate observer, if we're at 72mbpd now, then a drop to 60mbpd would suck, but conservation could ameliorate a lot of that. What is missing is the sense of how much oil we will actually have flowing through the system. So, if we have (on average) 10:1 ERoEI for contemporary oil, that puts 60mbpd into play. what will the ERoEI be in 2020? We might be humming along with 60mbpd production in 2019, but will the market see even 10mbpd in useful petroleum? Or 5 mbpd?
To me, that's kind of the more interesting number than the total, and is one area where serious innovation will either have a big payoff permitting more oil getting into use, or have little effect at all and result in effort wasted. Personally, from my research I don't see much "new" or "breakthroughs" in the world of oil production happening now or soon, hence my question regarding net production.
again, thanks for your article!
best,
S2
In November of 2005 there were rumors about Burgan being published:
"The plateau in output from the Burgan field will be about 1.7 million barrels a day, rather than as much as the 2 million a day that engineers had forecast could be maintained for the rest of the field's 30 to 40 years of life, said Farouk al-Zanki, the chairman of state-owned Kuwait Oil Co..."
(energybulletin.net)
If you list Greater Burgan production in 2007 as 1.170 and they listed 1.7 million barrels a day in late 2005 someone has wrong information. Who is to be believed? I know that figure of 30-40 years of life at 1.7 mbod does not correlate with Croft publication that the main reservoir layers should not last more than ten years before they have to switch to completions in less productive strata of the reservoir, even the Croft presentation gave only a little information and was subject to ambiguous interpretation.
There appears to be an error in table III re:
"Daqing 0.633 0.470 105.85"
If the first two figures are correct, then the last column should be 74.25 (.47/.633), but the reader cannot tell from the information presented exactly what is wrong, nor whether it had an influence on any other calculations.
yes it should be 74.25, my mistake
I feel like we are at the top of a huge rollercoaster ride and just starting down. I'm already gripping the seat. My stomach is bracing for the drop.
Are you the guy in the front seat?

Yes, I like to be in the lead. So I'm up front. I figure I'll start on the uphill slope sooner that way.
According to a recent IEA report about OPEC, "Effective OPEC spare capacity is 4.4 mb/d..."
In my opinion this may not be counted as a decline due to depletion. There are also a number of LNG projects under construction and the Chinese use of natural gas was reported up 10% for 2008 while some of the world was heading into recession. With all this switching to natural gas there may be increased NGL production displacing some of the oilfield declines. There have been statements from OPEC countries indicating an expansion of production capacity was underway in the summer of 2008 after at least four years of an oil bull market. The EIA (USA) did a recent article about Iran. Iran has numerous projects in the 100,000-250,000 barrel per day capacity being planned or under construction. The ELM theories posted in TOD indicate historical trends for increases in production being offset by increases in national internal consumption. There was yet oil in the Persian Gulf area and at times the production rose faster than consumption.
Typically there was a drop off of home heating oil use and a switch to using more gasoline for driving with the end of the northern hemisphere winter. In spite of increased driving, there was a history of drop in oil usage in the spring. Peak oil demand usually occured during the winter.
Awesome!
How is reserve capacity handled in this model? And how is the creation of reserve capacity distinguished from decline?
€
My understanding is that all the quantities are production capacity forecasts (especially the new supply forecasts).
Re: how is the creation of reserve capacity distinguished from decline?
Are you talking about reserve growth in the resource base? the reserve growth scenario is taken directly from the IEA.
The Obama Budget announced today may accellerate the decline in US crude production. There are many tax changes that will reduce the cash flow available to US oil producers, which will mean less drilling and less production. Maybe not a big deal, but perhaps a few hundred thousand barrel a day by the end of BO's 1st term.
It's fascinating how the idea of Peak Oil only caught the media's interest when the price of a barrel was headed skyward. As soon as dropped, the story got dropped and back to our gas guzzling ways we went. After my wife was finally starting to see the peak oil light, the price dropped and she too scoffed at the very notion that we may some day suffer from lack of supply.
But price makes no difference in reserve quantity. So I'm not sure why the public went back into denial so fast. Have to also wonder where all this is headed. The world economy is declining at an alarming rate, the arctic and antarctic are melting faster than scientists thought and oil is headed for decline in the post peak coming years. Were the Mayans right about that 12/21/2012 date? Seems like the closer we get to it, the worse things get.
These are not bad people - just outdated boundaries.
Breckenridge