| Impact of Credit Crisis on the Energy Industry - Where Are We Now? | The Oil Drum | DrumBeat: December 2, 2008 |
IEA WEO 2008 - World Oil Forecasts using Wikipedia Megaprojects, Dec 2008
Posted by ace on December 1, 2008 - 10:05am
In this analysis, Samuel Foucher (“Khebab”) and I (Tony Eriksen or “ace”) present an update of Wikipedia Megaprojects data. We also provide forecasts of future oil production, reflecting the Megaprojects data. The IEA uses megaprojects in its analysis and we reconcile our Megaprojects information to the data they provide in their report.
A wide variety of methods can be used to forecast future oil production. Each will provide different indications. Sam and I each make projections with megaprojects data, using somewhat different methods. Sam’s projections are shown in Figure 6. My forecasts are shown in Figures 8, 9, and 10. Despite our differing methods, the indications we produce are all substantially lower than the indications of the IEA.
Until quality data about production history, reserves and future development plans including capacities are obtained for fields in secretive OPEC countries, forecasts beyond 2012 are highly uncertain, regardless of the source. While quality data remain unavailable, the world's future energy security, in particular liquid fuels supply security, remains an extremely high risk.
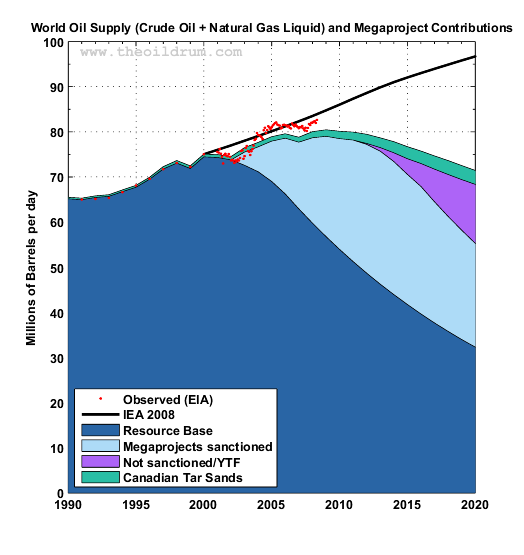
This chart shows the IEA WEO 2008 forecast together with Sam's forecast derived from using Megaprojects sanctioned capacities and yet to be sanctioned capacities (including yet to find oil - YTF). By 2020, the IEA's forecast is significantly greater than Sam's forecast.
1. Background
This is a special update on the Wikipedia Oil Megaprojects Database, maintained by the Oil Megaprojects task force, to coincide with the release of the IEA WEO 2008.
Wikipedia Megaprojects was developed in late 2007. Data about each project includes country, production capacity, reserves and most importantly, project references. There are difficulties with forecasting production rates using referenced production capacities. The production capacity, provided by references, is usually the capacity of the production platform and associated infrastructure. The future production from a field is often significantly less than the capacity.
A very good example of production additions falling short of capacity additions is Brazil, for which there was almost 1,000 kbd of capacity additions in 2006 and 2007. The average crude and condensate production for the first quarter of 2006, prior to 2006 capacity addition, was 1.69 mbd. The average production for the first eight months of 2008 was 1.80 mbd, an increase of 0.11 mbd. This means that only about 10% of the almost 1,000 kbd of capacity additions became net production additions. Probable causes of this small net increase is that Brazil's existing offshore field decline rates are incredibly high and production, from new fields and expansions, is well below production targets.
Capacity Addition versus Production Addition – Pyrenees Project
An example of forecast production addition being lower than the capacity addition is the Pyrenees project, scheduled for first oil in 2010. The operator, BHP Billiton states that the capacity of the Pyrenees FPSO is 96 kbd which is much higher than the forecast 55 kbd addition, estimated using data supplied by Apache, the other Pyrenees partner.
Apache presented this chart from their October 2008 presentation. The chart shows the forecast production growth by project, net to Apache. The peak production addition from Pyrenees is 7 million barrels of oil equivalent (mboe) in 2010 which is the same as 19 kboed, slightly less than Apache’s press release figure of 20 kboed. Apache has a 29% interest in Pyrenees which means the forecast total Pyrenees production is about 65 kboed.
As the forecast oil production addition is needed, an estimate of gas production is needed. Fortunately, BHP Billiton states that gas production capacity is 60 million cubic feet of gas per day which is equal to about 10 kboed. Consequently, the forecast oil production addition is about 55 kbd, the peak in 2010, much less that the FPSO capacity of 96 kbd.
Apache’s forecast production from Pyrenees also shows a high decline rate, a common characteristic of many small offshore field developments. In 2010, annual production is forecast to be 55 kbd and in 2014, only 15 kbd. This corresponds to an average annual production decline rate of 28%. The Pyrenees decline rate from 2010 to 2011 is almost the same at 29%.
Since Apache gave a production forecast for Pyrenees, the more accurate 55 kbd oil production addition for Pyrenees is shown in Megaprojects 2010, rather than the higher 96 kbd capacity. Unfortunately, for almost all other Megaprojects supply additions including Brazil's, the higher, less accurate, project capacity additions are shown due to a lack of data on forecast project production additions. If this important issue is not considered then oil production forecasts are likely to be too high using unadjusted Megaprojects annual supply additions data.
Megaprojects data can be used to forecast production using two methods. The first is to add up the capacity additions for each year and apply decline rates, as in the chart above. The second is to forecast production by each megaproject, then aggregate these forecasts to derive a world forecast, discussed later.
The chart below shows how capacity addition profiles have evolved since December 2007. Many of the large capacity reductions from May 2008 to November 2008 are due to excluding projects which have not yet been sanctioned, from countries such as Iraq and Iran. The latest November 2008 profile is also a result of updating from the IEA WEO 2008, oil company reports and project delays due to the current credit crisis and low oil prices.
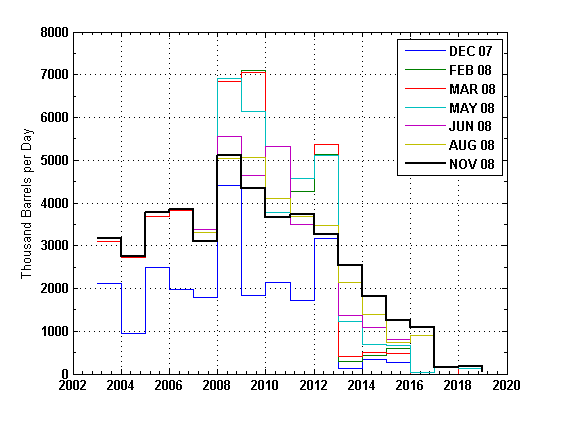
Fig 2 - Previous Megaprojects Annual Capacity Addition Profiles
2. IEA WEO 2008 Project Data
The Wikipedia Megaproject data have been reconciled to the IEA WEO 2008 project data and corresponding revisions have been made to the Wikipedia Megaprojects. Project/field names and data from WEO pages 263, 268-276, 299, 312, 313, and 314 were used for this reconciliation.
The Wiki Oil tables show capacity additions, excluding bio-fuels and including GTL/CTL, of 25.7 mbd from 2008 to 2015, inclusive. These capacity additions, unlikely to all become future production, are based on additions from projects which are likely to start. The project names and associated data contained in the WEO relate to about 16.3 mbd from 2008 to 2015. Consequently, there is about 9.4 mbd of project capacity not referred to in the WEO 2008. It would have been much better if the IEA included a full sanctioned project list, from 2008 to 2015, as an appendix to their WEO.
From 2016 to 2030, the projects the WEO considers are mainly unsanctioned projects. The WEO forecasts that all of these projects will be successful in the timeframe provided. It is doubtful that anyone can forecast individual projects accurately so far in the future. This 2030 forecast is based on hope and the validity of the WEO forecast beyond 2015 needs to be seriously questioned.
There were some differences in project capacities between Megaprojects and the IEA, but fortunately the degree of consistency was good. One of the bigger differences was for Project Kuwait. Megaprojects included only 50 kbd for Project Kuwait, since no formal development plan has been accepted by the Kuwaiti parliament, and the WEO has 450 kbd. Offsetting this difference is the Wiki forecast for Vankor at 420 kbd compared to WEO at 200 kbd. WEO has a BS500 Urugua project at 175 kbd whereas Wiki excludes this project because it was not on Petrobras project schedule from their June 2008 presentation. In contrast, Wiki has a greater project capacity for Petrobras' large Tupi discovery (300 kbd), as compared to only 100 kbd from the WEO. The WEO has a 120 kbd Burgan expansion but Wiki excludes this because no internet reference could be located. WEO has two oil sands projects of 180 kbd (Northern Lights and Muskeg River ph 2); Wiki excludes these because of indefinite delays.
3. Sanctioned Capacity Additions from MegaProjects and Yet to be Sanctioned Projects
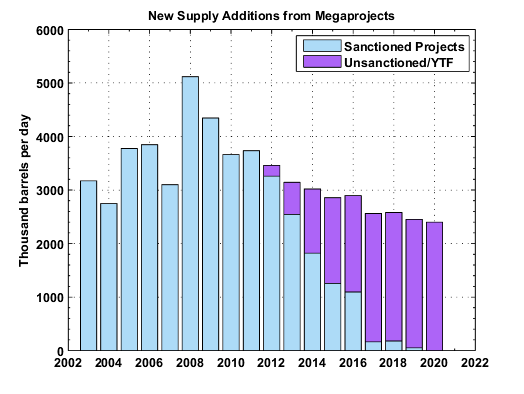
The updated Megaprojects world supply additions are shown below. A decline in annual project capacity additions from 2008 and on is evident. In addition to the Megaprojects supply additions, the chart also includes a future capacity estimate of a total of 15 mbd for yet to be sanctioned projects, including yet to find oil. This unsanctioned/YTF capacity is expected to start in 2012 and increase to 2020.
Yet to be sanctioned capacity of 10 mbd includes capacity from discovered fields mainly located in the countries of Iraq, Brazil, USA (deepwater Gulf of Mexico), Saudi Arabia, Canada (oil sands) and Russia. In addition, there is another 5 mbd of yet to be sanctioned capacity from fields yet to be found (YTF), which is consistent with Figure 11.5 of the IEA WEO 2008. These yet to be sanctioned projects can be expected to help slow the decline of oil production in the future.
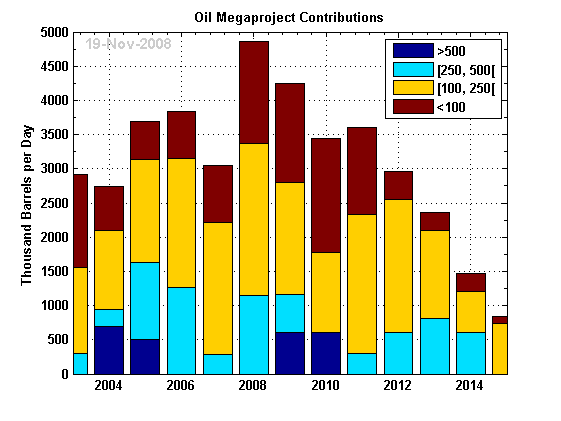
The chart below shows the project contributions ranked by size. From 2008 to 2011, note the large capacity additions from projects under 100 kbd. Many of the larger projects, greater than 250 kbd capacity, are from Saudi Arabia. In 2008, there are two large NGL projects, about 300 kbd each, due to start. In addition, two other large projects are Khursaniyah, split into 300 kbd for 2008 and 200 kbd in 2009, and Shaybah, 250 kbd in 2009.
The problem of capacity additions being greater than production additions for projects was previously discussed for Brazil. This problem also applies to Saudi Arabia, as data about field reserves and production are state secrets. In the chart below, Saudi Aramco claims that Khurais will add capacity of 1,200 kbd, split into 600 kbd for 2008 and another 600 kbd for 2009. As the data quality about Khurais is poor, there is a high degree of uncertainty about Khurais true capacity additions. Instead of adding 1,200 kbd, it might add only 800 kbd.
Wikipedia Megaprojects also includes other useful charts about sanctioned capacity additions. This chart shows the estimated percentage of new supply additions from 2003 to 2020, by country. The top three contributing countries are Saudi Arabia, Brazil, Angola, Canada and Iran. An additional chart splits the annual capacity additions into the categories of crude oil/lease condensate, NGL and unconventional. Starting in 2008, capacity additions from NGL and unconventional oil gain importance. This third chart shows the annual capacity additions split between OPEC and Non-OPEC. Finally, this fourth chart shows the capacity additions from each year since 2002.
4. Production Forecast, using Annual Supply Additions
Below is a scenario for future supply growth based on the Megaproject database and a 5% decline rate for the resource base. The last monthly numbers from the EIA seem to confirm an increase in supply of about 1 mbpd, shown by the Net New Capacity additions below. 2008 should see a small supply growth from 2007. However, 2009 appears very small and given that field production additions are usually below the corresponding field capacity additions, it is highly likely the net new production addition for 2009 will be negative.
Negative additions are forecast for 2010 and 2011. Biofuels are not included in these forecasts. Increases from biofuels production should partially offset these negative additions. 2012 and beyond show further negative additions which should be partially offset by yet to sanctioned/YTF capacity additions. Nevertheless, when all these sources of capacity additions are aggregated, the total liquids production is likely to remain on peak plateau, perhaps for another two years, discussed later and shown by Fig 9.
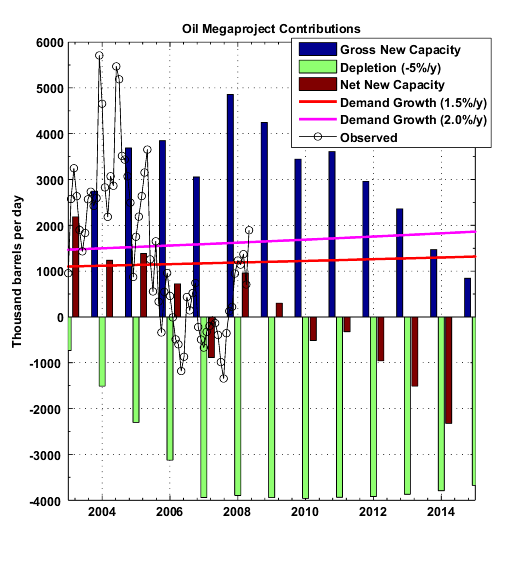
The decline rates applied to the existing resource base and annual supply additions give the forecast in the chart below. A 5% decline rate for the existing resource base is assumed partly because this decline rate was already used by the IEA in its Medium Term Oil Market Report, July 2008. This decline rate of 5% is higher than the 4.5% decline rate used by CERA. However, considering that past forecasts of both the IEA and especially CERA have been extremely optimistic, a higher 5% decline rate is thought to be more realistic. This decline rate is higher than the least squares fit of 4.35% from the IEA WEO 2008 as discussed in the Oil Drum's recent story on The 2008 IEA WEO - Production Decline Rates. Note also that the assumption of one decline rate applying to the resource base for all years is very simplistic. Ideally, separate decline rates should be applied to each country and to each year. Note also that the assumed decline rate of 5% for the resource base is much lower than the IEA WEO's natural, or underlying, decline rate of 9% for post peak fields, from page 43 of the IEA WEO 2008 Executive Summary.
A peak plateau of just over 80 mbd is forecast for 2007 to 2011. Unfortunately, this forecast is about 25 mbd below that of the IEA in 2020. The IEA forecast is optimistic and expects that the supply should be able to increase sufficiently to meet demand, if there is sufficient investment.
An important feature of the chart above is that the forecast from 2004 using Megaprojects has been about 1 mbd below the actual production from the EIA and the IEA. This difference is to be expected as Megaprojects project data does not include data about every capacity addition in the world. Megaprojects focuses mainly on project capacity additions, from new fields, workovers and enhanced oil recovery programs, greater than 20 kbd.
The most likely explanation for most of the 1 mbd difference between actual production data and the Megaprojects forecast are production capacity increases from maintenance programs. These programs are excluded from Megaprojects and can be significant. It is commonplace to do annual maintenance on fields, for example in the North Sea and Middle East. Saudi Arabia has a Maintain Production Potential (MPP) Program. This program is not considered as a separate project to add capacity, but if this program were not done, then production declines from some of Saudi Arabia's fields would have occurred.
One of the risks of these types of MPP programs is that keeping production rates higher may cause overproduction from the reservoirs due to higher extraction rates. If the extraction rates are too high and recovery factors are not increased, then future production decline could become high as it becomes equal to the high extraction rate. Colin Campbell summarises this effect, except that he uses the term "depletion rate" instead of "extraction rate".
Depletion Rate is defined as annual production as a percentage of the amount Yet-to-Produce at the end of the preceding year. It tends to increase in a country until the midpoint of depletion, when it stabilises and equates to the Decline Rate, the percentage change in production from one year to the next. The reason is that in practice it is mainly controlled by the large early fields, which are already in decline, giving a composite Depletion Rate, which effectively masks the impact of any late stage small discoveries.
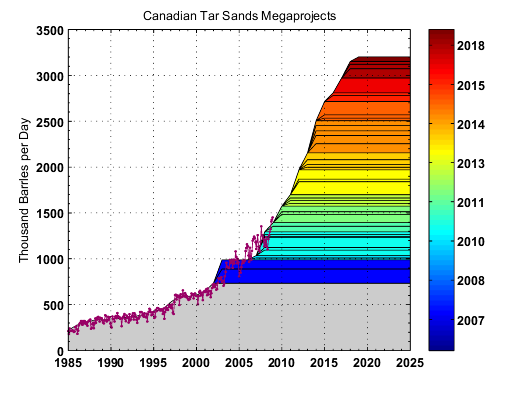
The supply addition forecast from Canadian tar sands does not assume any depletion nor does it ramp up over time. Nonetheless, we get a reasonable forecast as shown on Figure 6.b below.
5. Production Forecasts, using Megaproject Supply Additions
The Megaprojects capacity additions can also be used to forecast oil production, based on a bottom up project basis rather than using an annual capacity basis as above. In the case of the project being a new field start-up, the field production profile takes the generic form shown in the chart below. There is a ramp up to a peak plateau, followed by sustained production, and next a production rate decline until the field is abandoned. For a small offshore field, the ramp up time can be quick in months with a very short plateau. Larger onshore fields can have peak plateau production periods lasting decades.
The 2009 Megaprojects data table has about 50 projects, a combination of new start-ups and expansions, each of which will have its own forecast production profile. The forecast production of projects from this year and all the other years are aggregated to produce a world oil forecast. If only the crude, condensate and oil sands projects are selected from Megaprojects then the crude, condensate and oil sands forecast to Dec 2012 can be calculated, and is as shown below.
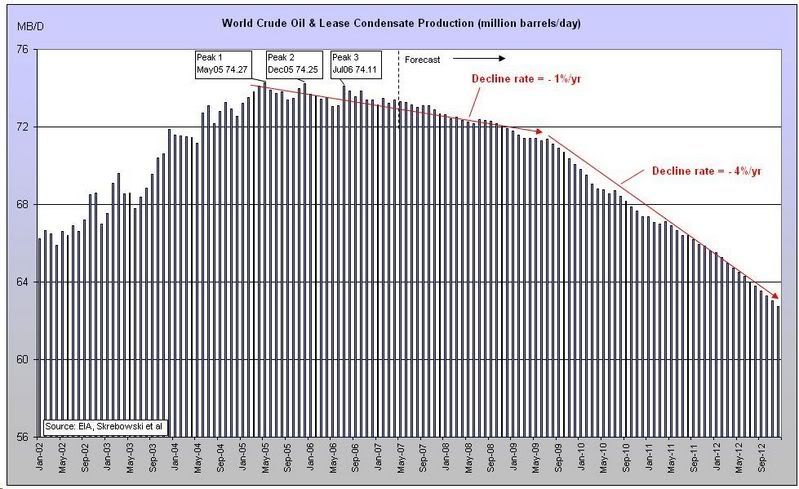
The peak production month has probably occurred in the past, on July 2008, at 74.94 mbd. The production decline rate, an output of the forecasting model, is about 3%/year, starting within the next year.
The same procedure for crude oil and lease condensate projects can be repeated for the other project data from Megaprojects which includes data for capacity additions from natural gas liquids (NGL), gas to liquids (GTL) and coal to liquids (CTL). If bio-fuels production data and processing gains are included, then forecast total liquids can be estimated, shown in the chart below.
The peak month of July 2008 for total liquids is 87.9 mbd. This is the same as the peak month for crude oil and lease condensate. The peak year for total liquids is forecast to be 2008 at 86.7 mbd, including bio-fuels. Colin Campbell has also forecast the peak year for total liquids to be 2008 at 85.3 mbd, which is lower because bio-fuels are excluded.
The total world supply additions of crude and condensate (C&C), including the yet to be sanctioned capacities, are unlikely to be sufficient to produce a rebound in the C&C production. Consequently the C&C production is forecast to continue declining beyond December 2012, possibly to the end of this century as shown below. The forecast to 2012 is from the chart above and from 2013 to 2100 is an exponential fit to the ultimate recoverable reserves (URR). The URR is a bottom up aggregation of the URRs of all of the oil producing countries.
In Figure 10, there are two forecast scenarios shown. The first, represented by a URR of 1.92 trillion barrels is shown by the red line. This scenario, up to 2020, is consistent with the sanctioned and yet to be sanctioned capacities. The second, represents a URR of 2.20 trillion barrels which is the amount estimated by Colin Campbell, from his ASPO monthly newsletter. This second scenario is possible, but less likely. Colin Campbell may use a slightly more optimistic URR but his forecast predicts peak total liquids in 2008, excluding bio-fuels, which is consistent with the forecast below.
The dark blue line shows the production profile for OPEC countries of Saudi Arabia, Kuwait and the UAE. It's an interesting coincidence that the world C&C production 74 mbd plateau occurs during the same years, 2005 to 2008, as the OPEC Core 14 mbd plateau. If further project delays occur, as a result of low oil prices and funding constraints due to the current credit crisis, then forecast C&C production could fall below the red line, after 2012.
The IEA WEO 2008 report is a start in the right direction, as it has begun its bottom up field analysis. However, for the bottom up field analysis to have meaning, third party audited data on many of the OPEC fields must be acquired. For example, in the IEA WEO 2005, an estimate of oil initially in place for the world's largest field, Ghawar in Saudi Arabia, was 300 billion barrels (Gb). In the IEA WEO 2008 it decreased down to 250 Gb. Other analysts estimate OIIP of 200 Gb. Recovery factors can only be guessed as Saudi Arabia keeps reservoir data as a state secret.
Until quality data are obtained from fields in secretive OPEC countries, forecasts beyond 2012 are highly uncertain. The forecast range in Figure 10 for 2030 is between 37 and 44 mbd, including oil sands. The IEA WEO 2008 crude and condensate forecast for 2030, from Figure 11.1 and Figure 11.12, is about 83 mbd, including oil sands. This massive forecasting difference of potentially more than 40 mbd is an extremely high risk to future energy security and will only be resolved through acquiring quality data on all of the world's fields.

6. Comparison of the IEA WEO Forecasting Method to the Two Forecasting Methods using Megaprojects Data
The IEA WEO forecasting method assumes very low decline rates and very high remaining resources which can be changed into increased production if there is enough investment. The IEA's forecast assumes that there are almost 2.5 trillion barrels remaining conventional oil and NGLs. In reality, this number is probably closer to 1.4 trillion, an overstatement of about 1.1 trillion as discussed in the Oil Drum's recent story on The 2008 IEA WEO - Oil Reserves and Resources. Since 2000, the IEA has consistently produced optimistic supply forecasts which easily meet demand. The IEA's forecasting method leads to an overoptimistic supply forecast.
The last year that the IEA gave somewhat realistic forecasts was in their IEA WEO 1998. In this report, page 100, Fig 7.7, the IEA's forecast for 2030 was about 55 mbd, using ultimate conventional oil reserves of 2.3 trillion barrels. This number is 20 mbd less than the forecast in the IEA WEO 2008 and deserves a full explanation from the IEA.
In stark contrast to the WEO forecasting method, the two forecasting methods discussed here are based on robust project data from Megaprojects. Nevertheless, even these two methods have differences.
The first forecast method, using annual supply additions, shown in Fig 6, indicates a crude oil, lease condensate and NGL production rate of about 71 mbd in 2020. The second forecast method, using project supply additions, shown in Fig 10, indicates 56 mbd for crude oil and lease condensate in 2020, using the higher URR of 2.2 trillion barrels. A reasonable forecast for NGLs in 2020 is that from Sadad Al Husseini, at about 8 mbd, which is also similar to the number used to generate Fig 9. This gives a total of 64 mbd crude oil, lease condensate and NGL for 2020.
The first forecast method indicates 71 mbd crude oil, lease condensate and NGL in 2020, while the second gives 64 mbd, a significant difference of 7 mbd. How can two methods both using the same Megaprojects data give different forecasts? The first forecast in Fig 6 assumes that 100% of the total annual capacity addition from the Megaprojects data becomes a production addition in that year. In reality, projects can be delayed or cancelled which has a negative impact on production additions. However, the main reason for the different forecasts is that the first method uses decline rates for global annual capacity. The second method uses decline rates for individual fields which are aggregated to give country forecasts, which are in turn aggregated to give a global forecast.
A good example to illustrate the difference is Brazil. The first method would take Brazil's capacity additions and sum them together with capacity additions from other countries to get a global capacity addition. Next a single global decline rate would be applied to the capacity additions. Megaprojects shows Brazil's capacity additions of 1.53 mbd from 2004 to 2007. The production for Brazil for 2003 was an average of 1.50 mbd (EIA). The year to date average to August 2008 was 1.80 mbd. Brazil's net production additions since 2003 was 0.27 mbd based on a capacity addition of 1.53 mbd. This means that the capacity additions are not becoming production additions.
The second forecast method uses decline rates specific to Brazil, which in deepwater can be as high as 20%. In addition, almost all of Brazil's capacity additions are the nameplate capacities of the FPSOs, not the production capacities of the underlying fields. For example, a 100 kbd FPSO might be connected to a field but perhaps only 50 kbd, on an annual average, might be produced through the FPSO. Individual country forecasts can take these factors into account, which cannot be done by a forecast using global data. Colin Campbell also does country forecasts first, before doing a global forecast. His forecast for Brazil takes into account the nature of Brazil's fields and is currently showing a peak production plateau of just over 2 mbd, despite all of Brazil's claimed capacity additions.
Another example of Megaprojects capacity additions being possibly overstated is Mexico. The first forecasting method would include Mexico's capacity additions of 483 kbd, from Megaprojects 2008 and 2009, in the global annual capacity additions for those years. However, some of these Mexican project supply additions are heavy oil, requiring huge numbers of production wells, and are expected to take over ten years to ramp up to peak production. In contrast, the second method would forecast Mexico's production taking into account the long ramp up period, giving less production additions for 2008 and 2009 than the first method.
Forecasting global oil production is difficult. A project by project basis can be used to produce country forecasts. The second method aggregates these country forecasts to produce a global forecast. Jean Laherrere and Colin Campbell have been doing global forecasts for several years but using mainly a logistic curve fitted to ultimate recoverable reserves for the world. This method ignores the reality of projects needed to produce oil. Laherrere has acknowledged the importance of projects in his latest world forecast as he states that this is why, for the short term, it is better to rely on the study of already planned large oil developments = megaprojects. Megaprojects data can be used to forecast until 2012, with some accuracy. Afterwards, a mathematical production rate fit to remaining recoverable reserves can be performed to give a long term forecast, as in Fig 10.
7. Summary
The Wikipedia Megaprojects database contains extensive information about past and future projects to 2020, including many useful summary charts. The projects listed are mainly those that have been sanctioned.
Consequently, estimates are made for capacity additions from yet to be sanctioned projects and additions from yet to find oil. When all of these sources of capacity additions are aggregated then production forecasts can be made.
Both forecasting methods use Megaprojects data, annual supply additions and project supply additions, and show significantly lower forecasts than those from the IEA WEO 2008.
The IEA forecast for crude oil and natural gas liquids is just over 95 mbd in 2020, about 25 mbd greater than the 70 mbd forecast by the annual supply addition method shown in Fig 6. The forecasts, using the project capacity addition method, show lower results for the reasons discussed in Section 6. Fig 9 shows total liquids forecast below the IEA forecast. The crude oil, lease condensate and tar sands forecast in Fig 10 shows a huge gap of at least 40 mbd between the IEA forecast and the forecast assuming the higher remaining URR.
Until quality data are obtained from fields in secretive OPEC countries, forecasts beyond 2012 are highly uncertain. The IEA WEO 2008 does not have quality data on the critical OPEC countries. The huge forecasting differences between the IEA WEO 2008 and the results from the two methods discussed here represents an extremely high risk to future energy security and will only be resolved through acquiring quality data about production and reserves on all of the world's fields.
Related Stories:
Wikipedia Megaproject Update (August 2008)
Oil Megaproject Update (July 2008)
World Oil Forecasts Including Saudi Arabia, Kuwait and the UAE (February 2008)
Update on Megaproject (December 2007)
Contact
- Content: editors at theoildrum dot com
- Tech support: support at theoildrum dot com
License

This work is licensed under a Creative Commons Attribution-Share Alike 3.0 United States License.
An additional chart that is showing only the additional supply from the Wikipedia list + YTF from Tony compared to the new supply forecast by the IEA (Figure 11.6, no YTF).
On decline rates
My current reading of the tea leaves is that an initial decline rate of 4.3 to 4.5% should be applied to the discovered developed stack and this encompasses fields in build up and post-peak fields. As your excellent Figure 7 illustrates the fields in build-up will after a number of years (5±3?) pass into the post-peak domain where according to the IEA a decline of 6.7% should apply. As Rockman pointed out earlier, in decline phase 3 (essentially stripper wells) decline rates may decline to around 3%. In summary:
4.3% for 5 years
6.7% for 6 to 25 (?) years
3% thereafter
Applying 5% to the whole is probably a good approximation.
On DUD and YTF
I find it a bit confusing the way you have combined Discovered Undeveloped and Yet to Find - makes it hard to compare with IEA. Any reason for doing this?
DUD and YTF forecast capacity additions were combined because it was simpler to represent and forecast the unsanctioned/YTF supply additions as in Figs 3 and 6.
In a similar analysis that I conducted, I assumed that new open deep water and redrilled existing oil fields would decrease in oil output by 18% and 10%, respectively, 5 years after they are put into service.
Thus, if a deepwater oil field was put into service in 2005, I assumed that in 2010 that the oil field would begin an 18% decline.
Did you assume something similar which is adequately and justifyably pessimistic (realistic)?
Retsel
Some of the decline rates that I use for deepwater oil fields are very high.
Doing bottom up forecasting, country by country, sometimes requires the use of other factors. For example, Angola has many deepwater fields but Angola is subject to an OPEC quota. In addition, many of future projects in Angola may be delayed because they are uneconomic at current low oil prices.
I also place some importance on statements from state owned oil companies. In Mar 2008, Syanga Abilio, a VP of Sonangol, said that "We are doing our best to maintain our plateau of 2 million barrels, probably until 2014. Our production profile does indicate normal decline (after 2014)".
http://www.reuters.com/article/rbssEnergyNews/idUSL1883291720080318
In addition, an estimate of a country's ultimate recoverable reserves (URR) and appropriate extraction rates are used to construct a forecast. In the case of Angola, a URR of 20 Gb is used which is from Colin Campbell's Dec 2003 newsletter.
http://www.energiekrise.de/e/aspo_news/aspo/Newsletter036.pdf
Taking everything above into account, the forecast for Angola, mostly deep water now, should have a production profile similar to the chart below.
Another deep water region of significance is USA Gulf of Mexico (GoM). While it is not subject to quota, bad weather plays a role in production. In addition the majority of the remaining proved reserves of USA GoM are located in offshore Louisiana and have been in decline since 2003 at 4.25 Gb to only 3.32 Gb in 2007.
http://tonto.eia.doe.gov/dnav/pet/pet_crd_pres_dcu_R1901F_a.htm
The chart below shows of US GoM including deep water and shallow water, representing total remaining proved reserves of 3.5 Gb. Taking into account probable reserves, a remaining URR of 6.7 Gb is used for forecasting purposes.
click to enlarge
Perhaps I'm missing something, but why aren't the new IEA decline numbers being used in this update? Those would change your charts considerably, no?
Cheers
If a 4.5% decline rate is used, then Sam's 2020 forecast would increase from about 58.5 mbd to just over 61 mbd, excluding yet to be sanctioned projects, shown below.
source: http://en.wikipedia.org/wiki/Oil_Megaprojects
As is explained in the story itself, the rational for utilizing 4.35% is detailed in the TOD article The 2008 IEA WEO - Production Decline Rates.
Eeery how the observed data is roughly tracking your forecasts. Great work as always, I'd wondered about that ca. 1 mb/d gap before, from simply eyeballing charts.
Minor editorial quibble: there's a big chunk of text in the story which is blocked out, I assume it's your own words though.
Nice analysis! Thanks for all of your work and Khebab's work on this.I know that a huge amount of effort is going into keeping up the database.
You have been doing these forecasts for a while now. Are your results staying fairly much the same, or are they changing in one direction or the other? How has the information in the last year changed your thinking about future oil production?
The results are staying pretty much the same.
Due to the recent credit crisis and low oil prices many oil projects have been suspended. Fig 8 includes the impact of these suspended projects.
However, if there are further suspended oil projects then the decline rate in Fig 8 could be more volatile. Nevertheless, the long term forecast in Fig 10 should not be affected by the current economic crisis.
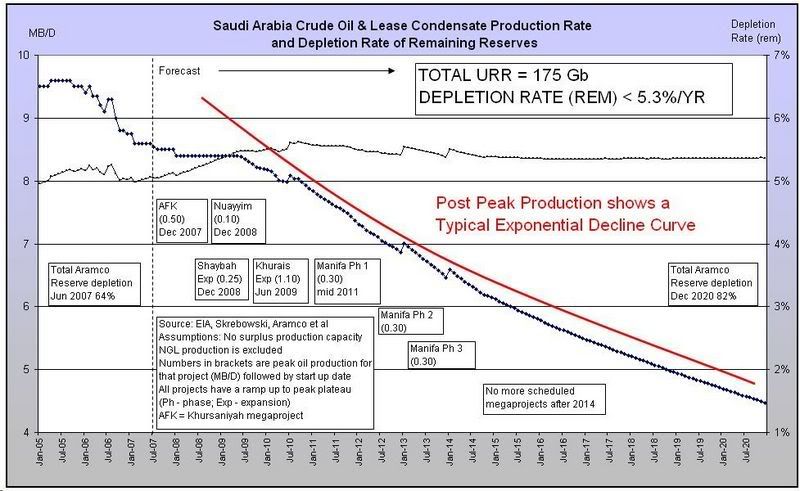
A key uncertainty of the forecasts in Figs 8, 9 and 10 remains Saudi Arabia. If my assumption about Saudi Arabia's ultimate recoverable reserves (URR) is too low then the decline rate in Fig 8 could be much less. The updated long term forecast for Saudi Arabia (including half of Neutral Zone) is below. Even though Saudi Arabia has added new capacity, annual production has not exceeded the peak production in 2005.
click to enlarge, for a forecast to 2020 (including depletion rates) click here
The assumed URR of 185 Gb for crude only is predicted by the HL method shown below. The HL method only gives a rough approximation, but until Saudi Arabia allows its fields to be audited there remains great uncertainty over Saudi Arabia's true reserves.
click to enlarge, for an annual HL plot click here
Tony, I don't think it is right to use monthly figures in HL that we know for sure are affected by KSA withholding production. I still think my stretch HL using annual data from years KSA was producing at capacity is a better indication of reserves in their discovered developed resource. To this needs to be added the discovered undeveloped:
It also needs to be pointed out that your reserves estimates are way lower than those of ASPO stalwarts Campbell and Hart.
Euan,
How can you be sure that the "Dog Leg Up" from 2003 to 2005, caused by ramping to capacity, is sustainable?
Perhaps the "Dog Leg Up" was temporary, made possible by Aramco's increased use of smart wells/multiple branched horizontal maximum reservoir contact(MRC) wells, creating "intelligent fields".
http://www.saudiaramco.com/irj/go/km/docs/SaudiAramcoPublic/ExternalFile...
These smart wells/MRC wells probably increased the production rate by temporarily increasing the extraction rate of the fields. Once this temporary period of high extraction rates is over, the predicted URR for C+C+NGL could possibly be closer to that indicated by the blue line in your first chart, about 180 Gb.
Saudi Arabia includes condensate production and excludes ethane in their NGL production numbers, probably because condensate production is not subject to OPEC quotas as stated in page 33 of http://www.saudiaramco.com/irj/go/km/docs/SaudiAramcoPublic/FactsAndFigu...
Consequently, the EIA also reports Saudi condensate as part of Saudi NGL, but includes ethane.
My assumed URR of 185 Gb is for crude only, excluding condensate. You have 63 Gb remaining for my estimate in your second chart. My estimated remaining crude URR as of Dec 2008 is 68 Gb.
Tony - it seems quite clear that each time Saudi cuts production it is in response to global over supply and that the ramping up is to meet supply shortfall.
The crude - condensate thing is a bit more complex - I'm using BP C+C+NGL - which as you point put includes a healthy slug of ethane.
I still think its poor practice to regress data that we know are affected by political production cuts. And you (and I) need to add in the DUD fraction not embedded in the production data.
On the flip side Saudi Arabia is claiming a 7.2% increase in internal consumption. I doubt this is physically possible esp in a country where half the population is not allowed to drive.
http://www.theoildrum.com/node/4764#comment-435327
A more realistic 3-4% growth rate in consumption with a 3-4% real decline rate makes a lot more sense.
At 7.2% using any reasonable metric for oil use to economic growth results in a growth rate like 20-30%.
Of course this means that KSA's total production numbers are not trustworthy.
In fact there reported numbers are quite flat while production was controlled by the US Saudi production went up and down by about 1mbd on a month on month basis.
GIGO.
Euan,
What about the "Dog Leg"?
Surely, there is a possibility that this "Dog Leg" could be the result of increased extraction rates by using "super straw" MRC wells. The oil is sucked out faster but the corresponding production rates would falsely overestimate the HL URR prediction.
I know that the HL method only gives a rough URR indication but it's still a useful tool. I carefully selected monthly data points which indicated realistic production rates for Saudi Arabia's fields which were close to capacity. For example, the Apr 2003 data point was used because it represented a high production rate, with little surplus capacity, during the invasion of Iraq. Also note that the monthly HL line goes through the months of Jun 2004 to Aug 2006 which many analysts believe that Saudi had little spare capacity.
Here is an annual crude only HL plot showing a "Dog Leg" starting in 2003. If this "Dog Leg" is sustainable, then the HL URR would be about 185 Gb. To this, another say 25 Gb could be added for discovered undeveloped fields, yet to find oil and possible enhanced oil recovery methods.
However, I believe there is a strong possibility that this "Dog Leg" is only temporary. In this case the data points for 2009 and 2010 could fall back to the HL URR 160 Gb trend line. This would imply that the HL URR for existing producing fields is 160 Gb, adding another 25 Gb gives 185 Gb.
click to enlarge
hey Tony
great stuff. i love what you and sam have done with the megaprojects analysis.
on Saudi, i have to agree with euan (which is not always the case :-)
We know that Saudi Arabia have been conservative in the pace of development of their resources, so HL must under-estimate URR. It's not just about choosing years when they were at 'capacity', because that still ignores the fields which lay dormant (undeveloped) at the time. Given the low-angle extrapolation HL is trying to make from such limited data, tiny changes in production over the last few years make an enormous difference to the x-intercept (much different than just adding 25 billion after doing HL).
24 Saudi fields as assessed by western oil companies were reported in the Carmalt and St John paper and totalled 220 billion barrels. The 1979 Senate Committee hauled the US companies in and they said URR around 212 billion barrels at the time. These estimates are from diligent oil company geologists/engineers just doing their job. Stuart/Euan/Joules all agree Ghawar has more potential than as assessed pre-1980 and Euan also the same for Abqaiq. It's still very rough, but that suggests a URR well over 220 billion barrels (but still ridiculously short of Saudi claims!!).
I did a lot my own HL analysis a while back, but for Saudi Arabia I came to the conclusion that it was almost meaningless. Tiny changes in recent years production, possible under a whole host of scenarios, completely change the answer (especially so because of the low-angle of the intercept). I don't believe that extrapolating a handful of dots on a production graph provides a better case than the reserves analysis (eg Oil Reserves: Where Ghawar goes, the rest of OPEC follows). But then I would say that :-)
I think you've put a lot of great work into the megaprojects wiki and your model, but for my two cents worth, I think it would be more robust if you took other Saudi reserves evidence into hand.
All of this just confirms that what we desperately need is some transparency. We shouldn't have to debate plus/minus 100 billion barrels of oil for any country. How did we get ourselves into this mess!?
Until there is some more consensus from geologists and consulting companies about Saudi field URRs, I'm going to be stubborn and assume URR 185 Gb for crude only, excluding condensate and NGLs. It's not that I don't think that Saudi URR crude could be more say 200 Gb, there still remains little consensus among experts. Laherreres Saudi HL indicated 180 Gb URR crude oil.
Your Table 1 from your well referenced story gives 221 Gb for 24 Saudi fields. First, I presume that this 221 Gb is URR for crude only, based on the Carmalt and St John 1986 study.
http://anz.theoildrum.com/node/4033
This 2007 article published in the Oil and Gas Journal by M Horn listed URR of some of the world's largest fields by "linking estimates of ultimate recoverable oil and gas made by industry experts over the last 60 years with current data on 945 giant fields".
http://www.searchanddiscovery.net/documents/2007/07032horn/images/horn.pdf
Guess what Ghawar URR is from Horn's paper? 66 Gb. Since then I've emailed him and he's revised it up to 75 Gb. Do I think it's higher? Probably but Horn doesn't.
Horn's estimate for Safaniya is URR 21 Gb.
If these two numbers are substituted into your Table 1 then the 221 Gb is reduced down to URR 199 Gb.
Here are some Wood Mackenzie (WM) URRs from Laherrere's paper
http://www.peak-oil-crisis.com/Laherrere_PeakOilReportMay2005.pdf
WM 2005 URRs
Manifa 4 Gb
Berri, 8 Gb
If these numbers are also substituted into your Table 1 then the 221 Gb becomes 184 Gb. There are some 75 other fields in Saudi Arabia so that should increase Saudi URR.
WM 2004 URR for Saudi was 236 Gb but with Ghawar at 108 Gb. Horn's estimate is 75 Gb. If that's substituted for WM's Ghawar URR then WM 2004 URR is revised down to 203 Gb.
Next year, perhaps I'll think about increasing my assumption for Saudi crude only URR to 200 Gb. The approximate potential effect of this 15 Gb URR increase in the forecasting model is that the world forecast in Fig 8 would be revised upward to about 67 mbd in Dec 2012 from the current 65.5 mbd. The annual production decline rate would be revised downwards from 3% to about 2.5%, from now until Dec 2012. The forecast in Fig 9 would also be revised upwards to about 81 mbd in Dec 2012. The forecast in Fig 10 would change slightly as it incorporates the Fig 8 forecast.
This chart is for C+C only and uses initial cumulative production at the end of 1959 from the opec website and uses EIA data from 1960 to the present (August 2008 being the most recent data point.) The result is a URR of 198 GB with a 95 % confidence interval of 179 to 218 GB. I think it is best to use all the monthly data from 1991 on. Using monthly rather than annual data gives a tighter confidence interval.
Nice response Tony.. sounds fair enough. I'd concentrate on referencing the field size estimates as the basis for your estimate rather than HL (but that's just my view).
Agree that it doesn't make a big difference in the global picture and that what we must have is better data!
Euan,
Can you highlight (or add) the data points for 2006 and 2007 in your HL plot for Saudi Arabia? I'm curious if the new methods are holding up over time.
Realist - fair request. Neither 2006 or 2007 were capacity years. So my interpretation is that this model still holds - though no doubt others may not agree.
One thing I'm keen to see is the depth of the current round of swing production cuts. I think there's every reason to believe with the global recession that the up trend of shallower cuts may be broken - but if it isn't then we are on a crash course some time post 2011 where KSA will no longer have to cut production to support prices and the 50K$ question will be if they can raise production to keep prices down.
Note that iea chart is to oct 2008 and doesn't include most recent OPEC cuts made on 1 nov.
How do you know that? This was the period of a boom time economy when Saudi Arabia could not deliver and global production went down almost at the same rate as Saudi Arabia itself. This suggests that Saudi Arabia has lost its traditional swing role. It's a negative swing producer now. It's actually exactly as Matthew Simmons predicted: "the coming Saudi oil shock and the world economy". Apparently many cannot connect the dots as there are time delays involved.
Awesome analysis. After two years on the oil drum, there is stuff to learn.
What is very clear to me from your two HL graphs is that Ace's estimate represents a lower bound on Saudi Arabia's URR and yours (Euan) represents an upper bound on said URR. Since S.A. is likely going to govern when the world peaks, it seems relatively easy to construct two estimates for world oil based on these two bounds, no? And you could call them "our most pessimistic estimate for peak oil" and "our most optimistic estimate for peak oil." Just my two cents. Also might save you guys a bunch of time arguing over nothing.
A key uncertainty of the forecasts in Figs 8, 9 and 10 remains Saudi Arabia. If my assumption about Saudi Arabia's ultimate recoverable reserves (URR) is too low then the decline rate in Fig 8 could be much less.
It's probably helpful to point out that your previous predictions of Saudi production have been very poor, i.e.:
ace's April 11, 2007 forecast:

Source
ace's Aug. 6, 2007 forecast:
Source
Compare your predictions against the actual Saudi C&C stats for 2008 from the EIA:
Jan: 9,200kbd
Feb: 9,200
Mar: 9,200
April: 9,100
May: 9,400
June: 9,450
July: 9,700
Aug: 9,600
Note that the figure for July (9,700kbd) is a historic high, last attained almost 30 years ago in 1981.
It's also interesting that your post peak decline rates are steadily decreasing.
This from Aug. 6, 2007:
Morphed into this from Dec. 1, 2008:

Your prediction of a 1% decline followed by a 4% decline... turned into a new peak followed by a 3% decline, with a caveat about how that 3% might be too high if you get Saudi Arabia wrong (which is not unlikely, see above).
Here's hoping you include honest information on your past flubs in your next series of predictions.
what was your forecast jd ? and what is your forecast for the future ?
Ace and Khebab and the others working the megaoil projects tracking are doing a lot of good work.
However, Ace has been very wrong on many forecasts. [As have others, but Ace has been more high profile with his predictions on oil price]
http://www.theoildrum.com/node/4397#comment-392132
Ace Aug 9, 2008: My guess is that oil price will "hit $126 before it hits $102". My forecast indicates that average monthly oil prices will never go back down to $102.
I had indicated back then to remind Ace of this prediction the day after he made those predictions. It was obviously going to be wrong and it was wrong.
The price polling has stopped now that prices have tracked back from triple digits.
to preempt Elwoodelmore:
My own public predictions relate to technology:
http://www.nanotech-now.com/products/nanonewsnow/issues/033/033.htm#Wang
http://nextbigfuture.com/2007/09/reviewing-some-of-my-predictions-no.html
My main forecasts on oil and energy are that there will be enough for a non-disasterous transition from oil to nuclear power, biofuels, greater efficiency and renewables.
There will be more enhanced oil recovery, biofuels (from waste, seaweed, jotrapha, algae, miscanthus and conventional crops) which will ease the transition.
I thought it was well accepted that wild swings in price are expected in the event of a constrained resource. The swings are so wild in fact that it might not be worth predicting anything but a long term trend.
I don't think anyone expects month by month production for one country to match up. In this analysis, Tony is not showing a separate Saudi Arabian forecast, so I don't see that your comment is particularly relevant. Tony is forecasting long run production, across many countries and many years. His model at this point seems stable to me. We won't really know the long-run result for many years,
Can you give examples of anyone who has given better month by month forecasts of Saudi production? What helpful can you add to the discussion? We don't need people who just throw stones for the sake of throwing stones.
Here is an alternative forecast and a list of some other sources.
Apparently Sadad Al Husseini has been more accurate on monthly Saudi oil production (even if the projections are for whole year averages) and some of the Aramco supply targets have not been that far off.
http://www.trendlines.ca/ksa.htm
It would seem that the saudi oil monthly production is in between Ace's numbers and the supply targets, but a lot closer to the supply targets.
There is also a larger list of projected world oil forecasts, charted.
http://www.trendlines.ca/scenarios.htm
Note: I consider projections past 2030 and especially those past 2050 to be meaningless because of likely technological changes.
Jean Laherrere also has some excellent forecasts.
Jean's paper from ASPO 7, Oct 2008, is a good read:
Forecast of liquids production assuming strong economic constraints
http://aspofrance.viabloga.com/files/ASPO7_2008_Laherrere_Wingert.pdf
Similarly, Jean's older 2005 paper also has lots of useful information
Forecasting production from discovery
http://www.peak-oil-crisis.com/Laherrere_PeakOilReportMay2005.pdf
The two charts below are from the 2005 paper. The first chart indicates a URR of 180 Gb for Saudi Arabia.
The second chart shows production forecasts for URR= 200 Gb, 250 Gb and 400 Gb. Note that in both cases of 200 and 250 Gb, production does not exceed 10 mbd. My long term forecast is just below Jean's 200 Gb forecast, as I assume a URR of 185 Gb.
We don't need people who just throw stones for the sake of throwing stones.
I'm not throwing stones. I'm simply stating the raw, unvarnished facts, as anyone can see. When a person is making predictions, that person's past track record is fair game, and in fact the most relevant information there is. You can run a million numbers through the spreadsheet blender, and talk up a good game, but at the end of the day, your predictions don't mean much if your track record is poor.
The thing about JD is that he is evidently much too wary to attack someone that doesn't necessarily just make predictions, but that instead lays down a detailed model of oil discovery and depletion mechanisms. He understands that if he does try to go after such an analysis, he will get whipped and his adversary will learn something to make that particular model even better.
And just what am I implying?
We still need someone like JD, but it doesn't help if the attacks are always something of a strawman.
I dream/dread the day when someone exposes some big holes in these models. On the one hand, it means that I can put this to rest and get on to other things. On the other, ... well, at least it was interesting while it lasted.
show us your track record, jd.
Hi Elwood,
don't waste your breath. JD doesn't have a track record. JD hasn't made predictions. His response is, (you can read his many posts at peakoildebunked) that Peak Oil will eventually happen but that it will be a "non event". His answer to whatever predictions, etc.. from anybody else was "NOT" or "WON'T".
Like, debating him about a housing bubble and collapse of the Dollar and a financial crisis in 2004 (PO.com), his answer was basically "won't happen".
Well, the dollar slid, but didn't collapse, and is miraculously back to where it was in 2004. The housing bubble has let off a bit of air but hardly burst all at once, especially not in 2005. The financial system has likewise been remarkably healthy - at least until summer 2007.
Would he admit that the finanzial system has "collapsed", that the crisis we were talking about way back when has come, that any recovery from it might be short lived, etc..? Probably not.
I think it was 2005 when I tried to make a bet on oil production and/or oil price - á la Ehrlich and Simon.
No takers. He won't.
He won't make predictions and he will nail you to the wall for yours.
JD, I'll make a prediction.
Peak Oil will be an "event". Please don't bother me with the where and when and how. Time scale? Who cares.
Are we at PEAK? Yes. Since about 2005.
Falloff? Soon: Last year, next year, in five years...
Greetings from Munich, Dom
Hi PeakPlus,
You write: “Are we at PEAK? Yes. Since about 2005.
Falloff? Soon: Last year, next year, in five years...”
This estimate was made by the USGS WPA 2000: “Approximately 800 billion barrels are awaiting discovery in the coming 25 years. Implying a tripling of current annual discovery for a period of 25 years”.
Unlike many of geologists and geophysicists, I believe that the USGS forecast for the near future is correct, because there is a great possibility to improve discovery rate as a result of technological progress in exploration methods.
Today, as it was decades before, oil companies drill mostly dry exploration wells. Drilling success rate doesn’t overcome 25% on average. It means that three dry wells go to waste from each four drilled. It means also that discovery occurs too slowly today, but there is a highly productive exploration technologies (for example Seismo-electromagnetic - SEM) for detection of hydrocarbon deposits. It provides a success rate close to 75%. In other words, 3 productive wells for each dry well. Obviously with the technology like this world oil industry could make three times more oil discoveries then using conventional technology, and this technology won't need more investment,time-frame and so on compare to a conventional one. It would significantly mitigate world energy problems. (www.binaryseismoem.weebly.com)
It might not be affected by the current crisis but it will be affected by a declining industrial infrastructure. Moreover the decline could be quite precipitous at some point. Not all the oil in the ground that could, with current infrastructure and technology, be gotten at will be gotten at -- it will remain in the ground.
On days when I'm feeling particularly frisky, I calculate that at my current rate of decline, I could make it to 140 -- using more or less the same methods you use. :)
The current economic crisis will unfortunately become permanent. As Gail pointed out earlier, peak oil will mean that we cannot pay back our debt. We also now know that oil above a certain threshold, say $80 to $90 (other proposals are more than welcome) will result in banks failing, companies collapsing and a world economy going into recession.
The methodology "global decline rates plus megaprojects" does not work. I tried it before. The results are not realistic as the above example from Brazil shows. This has to be done country by country. A new oil field in country A will not necessarily offset decline in country B. Rather, a new oil field in country A will be used to offset decline in country A itself. This could mean that production in aging fields there is reduced either to "rest" the fields (e.g. to allow pressure to build up again) or to install enhanced oil recovery, new hubs, new wells etc. all of which means that production in old fields is disturbed and decline rates are higher than expected.
deleted
d
OPEC have just indicated a cut in December production by "a good amount".
Voluntary.........Or they can't maintain production???
A couple of weeks ago on my blog, luisdias was actually willing to bet hard cash that "Voluntary.........Or they can't maintain production???" would be the next fad in peak oiler rhetoric. LMAO. He's got your number Cliff.
Over the last 2 years the Saudis announced that they will increase, then the next week, decrease oil production. As I commented previously, the only thing certain was that they were making announcements, and surely for the political need of the day.
The same is now true for OPEC.
The elusive 4th law of thermodynamics states that all oil producers are pirates, and with high oil prices all pirates are all producing as much as they possibly can.
If you believe otherwise, I have bridge over in Brooklyn for sale, interested???
Yeah JD, when can we expect some of that VAT-GROWN MEATto make it to market? Let's see you stick your neck out for once.
Khebab has detailed the EIA's habit of revising production figures after the fact, too: A Look at the EIA Revision Pattern. Do the honorable thing yourself and include this fact next time you clutter up a thread with another useless snipe.
Dude,
VAT-GROWN MEAT is small potatoes, or is it potatos?
I have a technique, that I will soon patent, that will extract the energy from discarded chewing gum, providing enough energy to avert the Peak Oil crisis.
And I have another invention, soon to be patented, for collecting the methane from cow burps that will power the globe for hundreds of years.
Ronald Reagan was right -- not to worry :).
Maybe some people think I'm serious :)
No, it's just that through your sarcasm you are attacking a straw man.
No, sorry the Dude got a minus 5 when he was right on target.
IEA WEO projects that the US, China and Russia will produce as much oil in 2030 as they do today. Surely this is extremely unrealistic? They dont expect any development of the huge heavy oil deposits in Venezuela though which to me sounds strange. Surely, Venezuela would want to reap the benefit of that resource?
Waterpump,
The officials at the IEA and EIA have discovered abiotic oil and greasing the skids.
The more oil they project in the future, the higher the salaries, stock options, and retirement pensions of all in the oil industry. It wouldn't be good for company investments if folks knew oil was running out.
And some of this largess could find it's way to officials at IEA and EIA -- a raise for being a good boy, or once back in the industry a big salary.
Lies, manipulation, greed, greasing the skids, greasing palms, money, power, prestige, status, wine, whiskey, cigars, and screwing everyone for my benefit -- that is what it is all about.
The IEA forecast to 2030 for Russia do seem extremely unrealistic, and probably should be reduced by about half.
Fig 11.14 of the IEA WEO forecasts Russian crude oil production to drop by about only 0.7 mbd from 2007 to 2030. The IEA also shows this chart from page 23 of the IEA OMR Nov 2008 report. This chart shows crude oil dropping by almost 0.4 mbd from 2007 to 2009. That means the IEA wants us to believe that Russian crude production will only drop by another 0.3 mbd from 2010 to 2030. I don't believe it.
Chris Weafer, chief strategist at Uralsib, probably doesn't believe the IEA forecasts as he sees Russian output falling 2% to 5%, or as much as 400 kbd, next year.
http://www.theoildrum.com/node/4809/437846
My forecast for Russia is shown below and predicts a drop from 2007 production of 9.4 mbd to 5.8 mbd in 2020, markedly different to the IEA WEO forecast.
click to enlarge
Colin Campbell's forecast for Russia shows about 1.5 Gb/yr in 2030, or 4.1 mbd, from his Sep 2008 newsletter.
http://www.aspo-ireland.org/index.cfm/page/newsletter
what is the criteria for a project being included as a megaproject ? iow what is significant new production addition (in bpd)?
Double counting (or 1.5 counting)
As we ramp up biofuels, tar sands and GTL, I see a two types of double counting problem cropping up.
1) Should a full gallon of biofuels be counted if 0.5 gallons of diesel was used in its production and delivery?
2) Should a full gallon of biofuels or tar sands be counted if the equivalent amount (or fraction) of natural gas was used in its production?
For tar sands in particular, aren't we just burning Natural gas to make oil? It would be interesting to see a graph of total natural gas and oil production in Canada - before and after tar sands. I wonder if there was any change in total useful energy produced.
This also raises the issue of energy used to run oil refineries. Shouldn't we reduce that from our "bottom line"?
Perhaps accounting rules can be applied to reporting on energy "profit". Has anyone produced a balance sheet or P&L statement for oil.
Wall Street:
Are there any unemployed financial analysts looking for a job? Seems like this is a good place to start. Another idea is to start looking at companies energy use when doing valuations.
Newer extraction technolgies use NG only during the initial phases of production - they use little or no NG once production is established.
1) THAI (Toe to Heel Air Injection)
THAI is an underground combustion technique that has been in operation at the Whitesands project since 2006. There is a 100,000 bpd THAI oilsands project (May River) scheduled to start construction in 2009. Also, THAI will be tested for retrieving heavy oil from the Kerrobert field in Saskatchewan in 2009.
2) Syngas
The Nexen "Long Lake" project is now entering production using synthetic gas derived from bitumen residues. Initial production is scheduled to reach 70,000 bpd.
3) Geothermal energy could be used in some future projects. In particular, "hot dry rock" geothermal seems to be a potential heat source for a "cyclic steam stimulation" extraction project.
The two driving factors for replacing NG are reducing cost and reducing GHG emissions. Current extraction techniques emit about 15% more GHG on a "well-to-wheels" basis than conventional petrol. Reducing this will require new technologies to replace NG.
Shell Oilsands Presentation
Hi Calgarydude,
It is my understanding that these "technologies" are yet to be implemented, not to mention polluting the air and water for vast areas of Canada.
And not to worry, I have 2 new technologies above that will save the globe: extracting energy from discarded chewing gum, and collecting methane from cow burps :)
There are a bunch of issues with double counting that. First, if natural gas is an input, that still wouldn't be measured in liquids production, so there's that. Plus, you'd have to discount consumption for their production, so it's not really a matter of double counting because you're either contributing the inputs to lower supply or higher demand. So a gallon of biofuels that took .5 gallons of liquid fuel to produce (and then you get into the question of crude vs refined products) would still count as 1 gallon of liquid fuel production, but only .5 gallons worth of net liquids (although you'd need to calculate the energy value of the inputs, and less than .5 worth of net energy (calculating in non-liquid energy inputs).
I agree, we should be reporting net oil production in addition to gross. Any financial analyst that looks only at gross sales would not be employed very long.
What about Microprojects? Jim Kingsdale brought up the topic of minor production fields playing a part in Megaprojects Predict Decline of Oil Production, which covers the work being done here. Lynch says in Crop Circles in the Desert: The Strange Controversy over Saudi Oil Production, his critique of Simmons's book (TWITD?), that KSA "drilling density" is only 14 wells per 1000 sq miles, vs. ca. 900/sq mile for the US in 1970. My immediate reaction to that was that it was irrelevant, given that the whole country has in all likelihood been thoroughly been covered with seismic surveys, and any medium size reservoirs have been identified already, precluding the need for additional rigs. But in that case the possibility exists that a not insignificant amount of production from marginal sources could be on tap when the need comes. 19.9% of US production comes from wells producing <15 bbl/d, after all. That's 302,000 wells, which might seem a staggering number; but consider that the US drilled 31k NG wells last year using ca. 1500 rigs. Perhaps this is an unspoken assumption behind huge OPEC reserves claims, that the KSA etc. experience will be in a sense that of the US in reverse - largest wells constitute all of initial production, with hundreds of thousands of stripper wells waiting in the wings. After all, consider if Colonel Drake's career included opening up Spindletop, East Texas, Yates, Wilmington, Prudhoe Bay...
I also happened across this remark from Khebab while looking for the USGS 2000 assessment:
From the GraphOilogy blog. Certainly low yield wells like these are uneconomical from the POV of the IOCs, but to a national entity with bottomlessly deep pockets like Saudi Aramco, facing the perspective of losing its only source of revenue, it wouldn't be farfetched at all, IMO. Costs for exploratory crude wells in the US were cheaper than NG in 2007, as well; some 12k of those were drilled, too.
This was something I'd considered when I first read about the Bakken, and the URR was up in the air. Relying purely on market considerations turning the Williston Basin into a pincushion seems unlikely, but a supply shortage would turn BAU E&P rules upside down. Hirsch didn't include mass production of minor fields in his report, but then again that card has already been played in the US. For KSA and possibly other OPEC membergs it would be a different matter, I think.
".... given that the whole country has in all likelihood been thoroughly been covered with seismic surveys,..."
that is just not true. seismic surveys continue.
but as to your main question, the miniprojects are absorbed into the overall decline rate so they are already accounted for. many if not most publically traded companies struggle to replace reserves on an annual basis.
Some good points Dude but guesstamating future "micro-reserves" from the KSA and elsewhere may be nearly impossible. Beyond predicting the unpredictable, the biggest obstacle to gaining hope from these smaller reservoirs may not be geologic. True, the average production rate from US wells is very low but, as you say, we make up for it in the number of wells. But consider who drills these wells. It's the small independents that generate this segment of the industry. Most folks don't understand that all the major oil companies combined produce less than these small companies. In the late 1980's I drilled over 20 successful ONE WELL gas fields in south Texas. Not that ExxonMobil wasn't capable of doing the same but they couldn't afford to do it. Their huge overhead doesn't allow them to allocate manpower to such low yield efforts. Yet this drilling program yielded the highest return of any project I’ve generated in the last 33 years (despite NG prices below $1/mcf). There may be many billions of bbls of oil in very small fields in the KSA but I suspect ARAMCO's size will greatly inhibit their development. Now if the KSA bought the entire town of Midland, Texas, and moved it and all the folks over to the Persian Gulf AND allowed free enterprise to take its course then maybe these fields would be exploited. Until then, I see the problem as more structural then geologic IMHO.
elwood - yeah, I generalized in a big way, obviously real exploration is ongoing, RS/D etc searching for gas in the Empty Quarter for instance. But no doubt they've detected a lot of dinky traps in the Eastern Province. Simmons had that chapter about the small fry in Twilight, too. Just blue skying. Thanks for sketching out the economics of the situation, ROCK. Maybe they'll do a Standard Oil trust bust on themselves? I have dim memories of reading about similar situations in economic history, medieval freeholders or the like. Oil patch sharecropping? Something of that nature. Would give all those millions of seething youth jobs, too.
DUDE/ELWOOD -- Your thoughts provoked another idea. We all know how PEMEX has been begging for years to roll more of their revenue back into development projects. I know it can only be a rough guess as best given the secrecy of the KSA, but can anyone offer some sense of magnitude to Aramco's budget over the years compared to their income? We hear about big buck projects on the books one day and now delayed. I'm curious if they've been as hamstrung as PEMEX. If so, it may offer even more skepticism regarding future KSA reserve development.
This is why I don't like assuming that the US decline rate is representative of the world decline rate.
Its fairly obvious that if you removed the contribution of the independents that the US would have declined much faster.
Also its obvious given that half the oil wells in the world are in the US that the rest of the world is not following the same production path as the US regardless of the age of the basins fields.
Russia for example has a number of old producing regions and I seriously doubt it will ever develop a large independent drilling community.
And last but not least this highlights the problem of looking at average decline rates. The US decline rate on average is not that bad but about 2mbd is coming from stripper wells while the rest of the oil is coming from fairly rapidly depleting sources. This is what I call fast oil.
Globally about 15% of the worlds oil supply is coming from rapidly depleting sources these have to be continuously replaced. When the rate that new small fields are brought into production declines significantly we will see a rapid decline from these "fast oil" sources.
To get short term decline rates one needs to identify how much of the worlds oil is being extracted from rapidly depleting sources and how fast we are replacing these sources. Generally these consist of smaller fields that are hard to identify but in aggregate they represent the fields most likely to contribute to a short term drop in production.
Next given that deep water offshore fields are now being put into production one can conclude that replacement fields that are easier to get have been for the most part discovered and put into production. The bulk of these fields are probably shallow offshore jack up production. With the end of the expansion into shallower offshore areas we can expect a sharp contraction in the number of small fast depleting fields developed.
To give you and example these overall projections are very similar to looking at the prime borrowers in the housing market if you focused on prime borrowers you would conclude that the housing market is just now experiencing some stress. However the real driver is the marginal borrower or the subprime group. For oil this is marginal production from rapidly depleting small fields. The driver is WHT's shock model applied to smaller fields in aggregate with the inclusion of advances such as horizontal wells. This group is the largest member of the "fast oil" group.
Excellent points memmel. Got me thinking of categorizing via your nomenclature. At first glance I would offer: new fast oil (NFO), old fast oil (OFO), new slow oil (NSO) and old slow oil (OSO). The Deep Water plays you mention are obviously NFO: the best technology with rapid payout requirements. OFO could easily contain Ghawar and Cantarell. Decades old but enhanced recovery methods (water and N2 injection) has abated rapid decline rates to a degree so far. NSO can be any of the heavy crude plays such as Venezuela and even the tar sands perhaps. OSO is very familiar to me: hundreds of decades old water drive reservoirs in Texas easily qualify. Cumulative production in the many billions of bbls but now in a high water cut phase (only several % oil). Granted this is a generalization, but each category has a somewhat unique decline character.
The easiest is OSO: very low decline rates of less than 5%. The most predictable of all remaining recoverable reserve categories. But they also represent 1000’s of wells you and the Dude described earlier: the heritage properties nurtured and maintained by the small independents. Not very sexy but a very vital and long lived component to US production.
NSO: huge reserve numbers but typically low economic value given the slow recovery rate and pricing. Huge in place proven reserves but very difficult to predict future recoveries given the fluctuating economies of such efforts. But once developed could represent long lived production but risky should there be a price collapse (i.e. Canadian tar sands).
NFO, in addition to the Deep Water fields, could include many resource plays such as the Bakken. But more complicated in that individual wells are NFO but the play, if it sustains itself economically, could mimic OFO. Once enough wells are drilled (and continue to be drilled as the earlier ones rapidly deplete) such a play could deliver significant volumes with little decline for decades. But only till the play is drilled up or the economics turn sour. Again, difficult to predict too far into the future without making specific economic assumptions. The Deep Water producing fields are much easier to predict given early and obvious decline rates. Of course, this doesn’t include reserves from yet undiscovered fields. Such fields, as Deep Water Brazil, could ultimately produce many billions of bbls but I still follow the same rule: if it ain’t drilled it ain’t proved.
And now the tough nut: OFO. Thanks to enhanced recovery efforts many of these fields don’t offer the natural decline predictability had they been left to their original drive mechanisms. As such they maintain a relatively low decline rate UNTIL that day when the injection methods which once helped moderate decline will suddenly do just the opposite. It appears Cantarell may be quickly approaching that phase where the up dip wells are quickly gassing out. Maybe rumors we hear of increasing water cuts at Ghawar may be such a precursor. What ever the time frame, such OFO will turn into OSO. This is not debatable. Every oil field that has ever had enhanced recovery techniques applied has followed this path. Oddly, the more effective the ERT have been, typically the quicker the transition to OSO. Very tricky when estimating ultimate recovery. Ghawar may produce many billions of bbls more than some of the more optimistic estimates. But those bbls will come during the OSO phase and take a century to recover.
Any thoughts on other categories?
Good idea! And as we are at it I'd like to repeat my proposal to add price tags (or ranges) to these resources, as is traditional practice in uranium mining. This would make it easier to see how much of these oil resources has a chance to be added at a certain oil price level.
The obvious idea is to gather many extraction rates from various sources, scaled to the available remaining reserves for that particular site, and see what the probability density function or histogram looks like. You likely won't be able to categorize the data but you can come up with the average rate and how much it varies about the average. Memmel in the past has thought that this varies more than I do. I think a "sweet spot" exists for the most technically viable and economical extraction rate independent on the size of the reservoir. The bigger find, the more taps you put in place, each sucking up a similar relative rate. In the end this average rate is the one that we use because it gives the most likely rate.
Did something indirectly like this for the North Sea data:

Web if this is true then we are in a lot more trouble then I'm saying and I don't think this is true.
Lets see if you agree with this if we added more wells in the larger reservoirs then the depletion rate would
be a constant. Say 5% a year this would imply that reservior lifetimes where a constant i.e 25 years.
This is not true therefore we don't extract reservoirs at a constant rate. The reason is pretty simple.
A large reservoir either has a very deep layer of oil or covers a large area in either case the number of
wells you can drill is limited. Get them to close and you get cross talk. For thin layers regardless of size
your looking at horizontal wells which are limited. The completion at the end of the well that in contact
with the reservoir is itself fairly constant. Leaving aside the latest most complex wells. The complexity
is itself only because the oil column is thinning. As you get into high water cuts and other older production
you have other limits such as water handling.
Now for a given basin and class of field the extraction rates are probably fairly constant but what holds for the North Sea does not hold for some other class of field. The argument is you can do a rough classification like what Rockman suggested and that they are valid. I.e if you did group like Rockman suggested you would find that indeed depletion rates, extraction rates etc where homogeneous within the group and that overlap outside the groups was minimal.
Furthermore this impacts dispersive discovery in the sense that the large slowly declining fields are less influenced by the discovery date Ghawar for example has been in production for a good precentage of the oil age. The East Texas field and others in the US for practically the entire time oil age.
In addition in some areas you also have the stripper wells these also represent a slowly declining base source if you will. Now a lot of our oil production comes from these sources lets say without and extensive look at least 50%.
But these fields cause problems when you aggregate your data they are like a star hiding the light from planets. You have this huge baseline effect the effectively drowns out potential issues with smaller sources.
Another way of looking at it is discerning the patter of a bunch of flashlights around a floodlight. Aggregating everything together tells you nothing about the flashlights they are washed out. In the case of oil its a few floodlights and a lot of flashlights the flashlights are battery powered and winking out and everyone is not paying attention.
Dispersive discovery is far more important and interesting for the smaller sources esp over the short term i.e after the discovery rate drops substantially. For the most part we could readily treat the oil production from stripper wells and large fields as constant over the next few decades. The question is whats happening above the baseline ?
OK with everything you say. I counter with the fact that an extraction rate set at 4% of currently predicted reserve on average will give pretty much the same results (per the shock model) of a 4% that varies about this number by a couple of percent on each side. The average value is what is important and the +/- excursions don't make a lot of difference. However, if the excursions are severe such that the standard deviation is +/- 4% corresponding to a finite probability of some population having a close to 0% extraction rate then the tails on a delta discovery will not be a damped exponential but will actually go as 1/(1/k+time)^2 (instead of exp(-kt)). I think.
So the slow extraction rates contribute to a heavier tail but the faster rates needed to maintain the same average as the non-dispersed cause a faster drop-off. See the following figure. This actually could make the outlook more pessimistic depending on how you look at these things.
What is interesting about the severe excursions is that it is a dispersive perturbation on the shock model so I think I have all the math ready to solve for this kind of behavior. Overall, very interesting.
The caveat is that it adds an extra layer of complexity, yet on the other hand it does provide a different error bound which might add some insight to how uncertainty of extraction dispersion can play into the model.
Thats about what I expected its actually a extinction event. As discovery moves well into the past the fields that are extracted at a fast rate become extinct without replacement ala the shallow GOM on field Texas etc. This extinction of classes of oil fields at different rates after the end of discovery is not captured in simple combinations.
Its probably enough to influence that decline curve around the peak however predicting a steeper decline as we pass peak.
Not all of our oil sources would follow this curve my current estimate is about 15% or so of the worlds oil is extracted at depletion rates between 10-20% and not all of these are at the end of the discovery curve for that type i.e Deep Water is still early in its per type discovery.
However small onshore fields and small shallow offshore fields are in general at the end of their discovery curve and should experience a steep decline.
But again all your really doing is noting that as overall discovery moves into the past certain types of fields decline faster than other types. Obviously the shallow offshore GOM will be effectively abandoned before Gawhar.
This is important not for how it changes the overall curve but because it does have and effect around the peak.
As long as discovery is in progress these fast sources of oil act as a steady or slightly growing source of oil depending on the replacement rate for the small fields. Until discovery falls off.
For sources such as deep water you can give the group a realistic discovery, ramp up, peak and decline phase.
I suspect you will find what the paper I linked above ignored that for deep water the rate we bring new wells online is equal or less than the decline rate of existing deepwater wells. Very little can be done to ramp production in deep water once the honeymoon period passes and the initial population starts into decline.
In my opinion this is very important because if its correct then we can expect declines to be fairly steep as we pass into the time shifted tail of the discovery curve until we hit a baseline of our long lasting sources. These sources are only providing about 40mbd or so of our oil supply. How steep needs good data but a transition off of oil will probably be done in a society that lost a significant portion of its oil supply over a fairly rapid period of time.
The gentle decline model is almost certainly wrong and this can be shown by combining fields by population type and using dispersive discovery over a particular population. By this I mean that shallow water GOM for example has been searched and its discovery profile peaked well before deepwater. Same of course for the on land texas fields.
And of course many of these fields show a fast production profile.
And just to repeat one more time what this means is that as we pass the end of overall discovery we face and early extinction events for certain sources. The obvious poster child for early extinction is the US which as discovered and developed first. Thats a regional extinction event obviously but more important is the per type extinction. The movement into shallow and then deep water GOM was unable to reverse the overall decline of the US simply because of the production profile of the well types. I suggest that binning by type produces a different result than simply treating the region as homogeneous. Methods such as HL implicitly capture this expansion this is why they work so well for the US and for Russia which generally where able to expand the search region over time. Other areas such as the ME did not have the same search profile therefore its probably wrong to expect them to decline in the same manner.
Another example is the North Sea as a region it was fairly rapidly searched and put into production and thence into decline. What interesting is that using the type approach offshore Nigeria would be classified in the same group as the North Sea which means that it should be in rapid decline right now. Generally production problems in Nigeria are attributed to instability but with this grouping approach once realizes that real production declines are highly probable.
Sure its a secondary effect but around the peak it implies the potential for a fast decline of anywhere from 4-15mbd
this has social implications. Its not small given that our society prices goods on the marginal supply and demand equation.
DRILLO -- ARE YOU TALKING ABOUT ESTIMATING A NEEDED PRICE RANGE FOR DEVELOPMENT/CONTINUED PRODUCTION OF THE VARIOUS CATEGORIES/PLAYS? MAKES SENSE.
Rockman,
what I mean is a classification according to cost categories like in uranium mining (<40 US$/kg U, 40-80 US$/kg U, 80-130 US$/kg U). So as soon as the price rises for example from 40 US$ to 80 US$ one can see easily how much of the resources has converted to an economically minable reserve.
Right I like your concepts.
I'm not excited about NFO like deepwater because this is restricted to the size of the field that can be exploited
it simply only works with larger fields since dispersive discovery indicates field size is random and the cost of exploration is high the rate we bring deepwater fields online will be low and they probably will decline faster then they can be found and brought into production. Basically a complete waste of time with a minimal long term contribution to the oil supply. God only knows what the EROEI for them are anyway.
The real problem is OFO and its not just the field decline but the effect of end of discovery once the discovery rate drops substantially as OFO fields enter decline they will not be replaced.
Lets take your Bakken example the can drill the field at some rate eventually this rate will determine the production rate of the field as older wells decline and newer wells are created as long as you can keep drilling new wells then the decline rate is basically zero OFO works this way as long as new replacement fields are brought online everything is peachy.
The problem comes as you approach the end of the discovery period and the number of new fields drops dramatically.
Then your decline rate goes from effectively zero to the average decline rate of a individual field. For OFO this means it goes from zero to about 14% or more over a period of a few years.
Think about the Bakken once the last well is drilled then the minimum decline rate is suddenly the rate the individual wells are declining for the Bakken that 25-50% per year.
The same problem exists for the NG shale plays for that matter once the best parts are extracted and drilling slows you basically go from a 8% annual increase in production to say a 20% annual decline.
If you did this bin process for Texas onshore, offshore and deepwater its obvious that the production from the shallow GOM has collapsed. Only the deep water plays are offering a temporary reprieve.
This is exactly the approach taken in this paper.
https://www.gomr.mms.gov/PDFs/2007/2007-020.pdf
However they miss the effect of the end of dispersive discovery and are in my opinion WAY to optimistic about the decline rate in the shallow GOM.
Also you can see on page 19 that the confidently predict a double peak for deepwater while the chances are deepwater production has already peaked using my first argument and will now be in decline. The chances of a second peak is minimal.
In any case you have a real example of a very reasonable classification of fields similar to what your proposing.
And it highlights the dangers we face. If they are wrong in there assumptions for the bins then the real production will be much lower then they forecast and also much lower then what a aggregate forecast would predict.
In fact the error in the aggregate is almost the same as what they make with a rosy forecast.
In fact you can see the "wall" of oil effect of rosy assumptions about near term production that does not fit historical production levels.
The approach of segregating oil fields based on some simple classification scheme and focusing on discovery and production profiles for that type along with decline rates is in my opinion the approach most likely to yield the correct decline profile as we move well past the end of the discovery curve. Lack of replacement of the fast depleting fields will I suspect swamp other reasons for production decline. The fact that each new survey of oil production seems to raise the average decline rate tends to imply that something is changing. We can reasonably expect that the slow resources have not undergone major changes which lends at least a suspicion that the OFO could be a problem.
for the parshall field, the flagship of the current bakken developement, the decline rate averages about 60% and the discovery well is still declining at about that 60% after nearly 2 1/2 yrs although that well is essentially on 320 acres vs 640 or 1280 for later wells. new wells are being added at the rate of about 6 wells per month and production is increasing.
parshall is an overpressured fractured reservoir producing above the bubble point. i.e. the decline rate is dominated by pressure depletion. studies done in the '90's concluded that the natural fractures close up as pressure is depleted, reducing the effective permeability.
i beleive that 25 - 50% decline relates to older hz wells completed without the benifit of hydraulic fracturing. now the debate is whether 20 frac stages is better than 12 (at $200k per frac stage). i am reasonably certain halliburton is making a profit on this play.
A small point memmel. The MMS may not be overly optimistic about the shallow GOM decline rates. As you pointed out the shallow GOM has collapsed to a large degree. Many of the fields have passed the high flow rate/high decline rate phases and are now more similar to OSO. In water drive reservoirs (as most of these fields are classified) we could be looking at decline rates well below 10%. But there's a significant factor I didn't see addressed: economic limit. You can't produce offshore fields down to very low oil cuts. The fixed operating costs are just too high. Onshore you can make a profit at a 1 or 2% oil cut even at $25/bbl. But not offshore. The recent drop in oil prices has pushed an unknown number of shallow GOM fields close to unprofitability. And probably a number well into the red. Operators won't necessarily rush to abandon such fields for a couple of reasons: it takes time and a significant expanse to decommission a field and, secondly, someone might have ideas about new drilling opportunities. But low oil/NG prices also discourage such efforts.
The MMS seems to be focused solely on the physical ability to continue depleting the shallow water GOM but doesn’t seem address the economic life of such fields. This also appears to be a weakness in their projection for future development and even more so for future undiscovered projects. Their estimate of the volumes contained in such undiscovered DW fields may be a reasonable approximation but the timing may be very flawed. DW project development plans can't be altered very quickly. We've been waiting over two years just for rig availability to continue our DW plays. The recent drop in oil prices won’t affect or current schedule. But a prolonged down turn in economics will eventually alter the time lines. And once altered it can take a long time to reactivate when prices do rebound. Just a WAG but if oil stays below $60 - $70 (on average) for the next 18 months or so we'll start see a significant delay or abandonment of most DW plays. Operators will pay large cancellation penalties (as high as $10 million per rig) if the economics fall apart. And will take oil prices peaking for a lot longer than a few quarters to rejuvenate these efforts.
I wonder how good the infrastructure development is in Saudi Arabia for the small 'stripper' wells. I figure that while Saudi Arabia has plenty of manpower, technology, capital, and land, they might not have roads, power lines, local hardware stores, fast food joints, etc. I would like someone who has actually been to Saudi Arabia to clue me in on what kind of ability they have to economically produce one hundred barrel per day wells, let alone ten barrel per day wells.
Saudi Arabia is pretty big and it may have some pretty empty areas that aren't going to be cheap to drill in if you have to build all the roads for an oil rig every kilometer.
Is it really cheaper to drill someplace like Kentucky compared to someplace like Wyoming? America is more densely populated and far more densely roaded than Saudi Arabia. The minimum economic production of an oil well might be considerably higher. Or, if the wage rates are low enough, they might be lower.
Any people here that can tell me about the way that area works?
Excellent work! You should be nominated for the WikiNobel Prize (to be founded) :-)
Maybe with the economical crisis you may soon be pressed to extend the Megaproject project beyond 2020.
This may include for example projects in Brazil:
According to aBloomberg news report Petrobras' CEO Jose Sergio Gabrielli announced that his company may extend investments in the pre-salt oil area investments planned for between 2009 and 2013 to a date closer to 2020.
Did you consider this in your updates?
On the other hand: How can you be sure that on the longer run there won't be any megaprojects that are not yet announced and that you didn't expect?
And as for your extremely long projections to 2100: Such outlooks are supposed to be extremely insecure, if not improbable. For example nobody knows the effects of mutual feedbacks between the downward spirals of economy and oil production. For example there could be phases of economical collapse and subsequent recovery phases, like in the former Soviet Union.
So I'd rather draw a dotted long term line, if any.
This article has many references to the lack of hard data from the OPEC countries.
I have two simple questions.
1. What reasons do the OPEC countries have to keep their critical oil data from the world?
2. Why should we continue to allow them to keep their critical oil data a secret?
The consequences of being unable to correctly estimate future OPEC production rates and reserves are enormous. The next twenty years will be the most challenging the human species has ever faced. Does my family's future, indeed the future of every family in the world, depend on "winging" it?
Two possibilities I can think of off the top of my head:
A. They want us to stay hooked on the black drug as long as possible to milk as much money out of us as possible. Transparency might allow us to have the foresight to plan ahead and actually make the transition away from oil earlier, leaving them with black goo that is worth much less than if we continue our addiction.
B. They don't want their OPEC quota to diminish relative to other OPEC countries.
Because they are sovereign nations, and we have to continue to butter them up because we are addicted? How is the druggie going to demand that the pusher tell him how much of the good stuff is left?
Verifiable oil data are needed from OPEC countries, especially Saudi Arabia, Kuwait, Iran and the UAE. Saudi Arabia's remaining proved reserves have stayed the same at about 260 Gb, year on year, since 1990. The world does not know how these proved remaining reserves are split among Saudi Arabia's fields.
Without a split of remaining proven reserves by field, capacity additions claimed by Saudi Arabia could easily be overstated. Saudi Aramco claims that Khursaniyah project has 500 kbd capacity. Perhaps it will only produce at 300 kbd. We don't know. Aramco claims that Khurais has 1,200 kbd capacity. It could produce at much lower rate, say 800 kbd. We don't know. How much did Khursaniyah produce last month? We don't know.
One thing that is known is data on Saudi oil received and measured at the import terminals of the IEA member countries (OECD). Since the beginning of 2004, OECD crude imports from Saudi Arabia have trended down from just over 4.5 mbd to about 4.0 mbd in Aug 2008. Given the cuts made by Saudi Arabia, after August, OECD imports from Saudi Arabia could fall to 3.5 mbd, perhaps lower.
click to enlarge
source IEA OMR Table 6
http://omrpublic.iea.org/omrarchive/13nov08tab.pdf
Perhaps, Ali Al Naimi, Saudi Arabia's Oil Minister and Chair of Saudi Aramco, will tell the truth about Saudi Arabia's remaining reserves. The true figure would have to be much lower than the 260 Gb "official" number. Naimi has said he wants a higher oil price. If he states Saudi Arabia's true lower remaining reserves, then this should help the oil price increase. If necessary, Kuwait and the UAE could state their true remaining reserves. However, I remain doubtful that any of the key OPEC countries will release true verifiable data.
I hoped my two questions would have sparked more interest. The peak oil community can't effectively influence political policy if the data set we use if incomplete. The reason is simple. The special interests and competing interests will continue to use the excuse that peak oil is irrelevant because "other data" indicates their is plenty of oil left and to be discovered.
No one predicted when the economy would fail this year, the speed at which it failed, and the extent of that failure. Worldwide, trillions of dollars have been spent to bail out the rich. All the major countries in the world had the same problem. The rich, along with political support, created a false economy to serve their self-interests. It was just a matter of time before financial tragedy struck.
Likewise with oil, it is just a matter of time before the crash begins. Except this time, it won't be paper money which is lost. It will be lives. We are too far removed from the agrarian societies that existed during the great depression to maintain the vastly larger population of the world today.
New York city relies on two tunnels for water. If one tunnel fails, the effect on New York city will be staggering. If both were to fail, most of the population would be forced to leave the city. That is 8 million people!!! One earthquake or terrorist attack is all it takes for this to happen. It will be impossible to import enough water each day into New York city during the time it takes to repair the tunnels. We could not handle Katrina in New Orleans with a population or 450,000 people. New York city without water for even a week or two would be catastrophic.
Los Angeles has 3.8 million people and it is just a matter of time before a major earthquake devastates the city. We know this, yet have decided to live with the consequences. Consequences that go far beyond property damage.
A sudden tragedy in New York city or Los Angeles is insignificant compared to not doing everything possible to mitigate the effects of oil decline. We can't correctly deal with oil decline without knowing the scope of the problem. The estimates of deaths due to our inability to prepare for oil decline run from millions to billions. I find it incomprehensible that the OPEC countries can continue to control critical oil data and determine the commitment the world needs to minimize the number of deaths which will result from oil decline.
Why should a few dozen of some of the wealthiest people of the world be allowed to decide the fate of billions? Does the belief of the world's rich and their politicians that they will be immune from the effects of declining oil trump the death and suffering of the middle and lower classes which will inevitably result?
The famous quote, "let them eat cake" often attributed to the queen of France is likely not true. http://en.wikipedia.org/wiki/Let_them_eat_cake
What is true, is we are now approaching the point where that phrase will have meaning and the results from being at that point will likely be just as horrific as the French revolution. Payback's a bitch. Perhaps that point needs to be made clear to those who ignore their responsibility to the world.
Ace looking at table 6 in your link I noticed that Mexican Maya production was still quite high in the table.
From here
http://netoilexports.blogspot.com/2007/10/cantarell.html
I'd say that actual Maya exports should be lower.
They have lost about 500kb but exports are only down about 240kbd ?
Certainly other sources for Maya exist according to Pemex but its a number that we can check
from multiple sources and it seems high to me. Mybe only a few hundred kb's but still.
Khebab and Ace - fantastic work. They don't pay you enough.
the key thing obviously is the global surplus capacity - thats what keeps us all going. Today it is rated at about 47 MBD. Your analysis above leads people to think that it will decline at an "orderly" and manageable 5% or 6%. I think we cold have a "tipping point" scenario as follows
To understand what affects the surplus pool, We need to divide the worlds countries into four types:
1 large and ongoing surplus - KSA, Russia etc (WT's ELM)
2 surplus about to end, and tipping into deficit - UK Indonesia
3 oil producer but importer - China
4 no production oil importer - Japan
My point is when there is ample surplus (currently), normal economics apply but if the surplus was to shrink rapidly, you get into shock and hoarding.
What could cause this sudden rapid shrinking?
Category 2 - Countries that were exporters, but suddenly become importers are the key. If a country goes from exporting 1MBD to suddenly importing 1MBD, this does not contribute to a 6% decline in surplus, but double that. As more and more countries reach that tipping point, the ample surplus will shrink much more rapidly than expected.
Your mission - should you choose to accept it, (and I don't know why you would) - is to take the megaprojects to the next level. Just as you have done country by country new production forcast, you need to do country by country export analysis. Actually not even all of them - just the ones that will tip from exporters to importers in the next 4 years, which is the critical period.
In this way we will get a more accurate read on the "decline of the surplus pool" and the potential for a panic hoarding and freeze up.
this is mapping the collapse scenario
Excellent suggestion.
1) I wonder, also, about the effects of what might be termed "non-market" or "out-of-the-market" (separate) contracts are and would be on these categories?
Example, China's contracts w. Sudan.
What are the total number and amounts of these? Are they increasing and if so, at what rate? Any expectations or predictions concerning their impact on the categories you list?
2) re: "just the ones that will tip from exporters to importers in the next 4 years, which is the critical period."
Is there any separate (or additional) qualitative effect of the credit (or financial) crises on the ability of a country to make the change? I guess another way to say this is, is it really the case that a country will be able to go from 1mbpd export to import of same amount? (What are the factors that go into the ability to import?) (Will every importer be increasing debt and/or deficit?)
Actually the largest short term effect is probably US and UK production. If the US production goes into a steep decline like I think its doing then we have a problem same to a lesser extent UK and potentially China.
People forget that the US produces 5mbd and is heavily depleted and a large importer.
Also you can add in Mexico and Canada and talk about North American production.
So far for the last several years the US has managed to maintain and effective plateau in production.
But if it begins to decline and you throw in the UK you can easily get up to 1mbd of new import demand
from importing producers. The point is that internal declines in importing produces immediately translate
into increases in import demand. You don't need to go to zero net exports.
The chart below shows the non OPEC 13 component of Fig 10, from 1997 to 2011.
Peak non OPEC crude, condensate and oil sands has most likely passed in 2004 at 41 mbd.
click to enlarge
Nice work.
Before I try to create one, does anyone have a chart, with consistent numbers like:
1) Fig 10, but just with one world production line, no OPEC line.
2) US production, to date and out to 2100.
3) US Net imports to date, so that 2) +3) = US consumption
and maybe:
4) US Net imports projected to 2100 (or ending earlier) assuming:
a) US usage stays flat at current [looks like US would use all oil in world by 2050-2070], i.e., Won't Happen.
b) US continues to import same fraction of (world-US) production that it does now, which looks like ~17% (?)
c) Any other import scenario that makes sense.
I'm sure I've seen something like this, but I can't seem to find it quickly, so any pointers appreciated.
Here is an attempt to forecast a weighted average oil price to 2012. The actual prices are from EIA and the forecast demand is based on the IEA's recent OMR Nov 2008.
EIA "Weekly All Countries Spot Price FOB Weighted by Estimated Export Volume" http://tonto.eia.doe.gov/dnav/pet/xls/pet_pri_wco_k_w.xls
IEA OMR Nov 2008 http://omrpublic.iea.org/archiveresults.asp?formsection=full+issue&formd...
There is great uncertainty in forecasting price, so this time I've added a dashed green line, indicative of a long term oil price trend. Some uncertainties are the level of demand destruction in the next year, the amount of OPEC's production cut in two weeks, and whether non OPEC countries like Russia will also cut production further.
Another uncertainty is value of the USD Index. Since Jul 2008, even with the US recession, massive deleveraging has caused a massive demand for the US dollar, which has caused a USD rally as shown in the chart below. The rate of deleveraging will probably slow in the next few months. This could reduce the demand for the USD and decrease its value. Some funds could leave the USD and move into oil, helping the oil price return to its long term trend.
Source http://quotes.ino.com/chart/?s=NYBOT_DX&v=dmax
The current low oil price may be a temporary benefit to consumers but unfortunately many conventional and non-conventional oil projects are being suspended. In addition, the motivation to explore for oil in deep water has probably dropped because deep water projects require a minimum of $60 oil to be economically viable. A low oil price deters critical investment required for security of future oil supply. If investment decreases too much then future oil supply may also decrease too much, causing another unexpected price spike similar to the one which occurred in July 2008.
The July 2008 price exceeded the long term trend due partly to leveraged oil positions. The price now is under the long term trend due to deleveraging and demand destruction. When deleveraging slows and credit markets return to normal, the oil price should return to its long term trend.
click to enlarge
I am a firm believer in long term trend lines for most assets, including houses and equities. However, most commodities are more tricky - a little higher price makes many reserves more economical. And oil is trickier still, demand is extremely inelastic while few suitable substitutes exist, explaining the large volatility. Further, unlike gold, oil is expensive and difficult to store. OTOH, oil has OPEC, and for all its failings, the cartel has been reasonably effective in providing a floor on price, usefully reducing past demand and thereby boosting future supply.
This year we saw OPEC completely lose control as prices responded to high demand and flat supply. Then, higher world production and reduced demand on account of high price, not least in the US, caused price to quickly crash, once again reminding us of inelasticity. OPEC is just beginning to rein in production, so far a modest 1mb/d but may be another 1mb/d fairly soon. This, plus maybe 500k/d reduced supply plus another 500k/d or so reduced exports should firm price by mid 09.
I agree that the near term will see modest prices, after all SA is only looking for 75/b (just a coincidence that this price is under tar sands break even), and IMO they will achieve this target albeit with the usual wrangling. It is not so clear that, further along, price will stay tethered to the long term trend... OPEC will once again lose control to the upside...
We have for a few years, and for the first time, seen price affected by flat supply. We have yet to see what happens to price when supply consistently declines. I see higher prices but also higher volatility... lots of big swings, and lots of opportunities for investment. As an aside, current price is an excellent entry point for some small US e&p's. The chart probably does not adequately predict future swings, but it is a reminder that big swings occur as the world reaches PO.
As scientastic said on the today's DrumBeat,
"In the back of our minds we all knew that "gap" could never exist. That is, actual demand (actual use) can never exceed actual supply."
Why do I continue to see people forecasting demand to continue ever upwards, oblivous to actual supply declines? We can't buy more than is being delivered to the gas stations...
I think this should really be clarified. Scientastic is right, it really doesn't make any sense.
AshtonW,
I've had this same question almost every time my demand forecast is posted. I can't forecast price without a forecast demand.
Forecasting demand is very common in economics. The IEA, EIA and OPEC all do it. It's done for apples, coffee, beans, wine and water.
Please read this previous comprehensive answer the last time I posted the forecast.
http://www.theoildrum.com/node/4419/397187
Tony
ace:
I think this illustrates the folly of making long-term price forecasts on the basis of short-term price movements. It is clear now that the run up earlier this year was a case of speculative overshoot. What we are now seeing is over-reaction the other way. Neither extreme is sustainable or indicative of long-term trends. It is your green dotted line upon which we should remain focused, and just understand that there is going to be unpredictabile volatility around that trend line.
Ace
I guess I have a fundamental problem with the global supply demand curve,
and delta
The delta gap that matters is not based on the total 85 MBD.
It is only on the global export capacity - which is 47MBD
The whole concept of global supply demand, in the case of oil, is flawed.
The export countries are not affected by the delta, only the import countries.
If the world were one country where there is one supply and all share, then it makes sense to show it this way
In a global economy with individual countries, and no global central governing power, it does not make sense. It is misleading to show it this way.
Countries care about their own interests, period. They only care about other countries insofar as it affects them. Devil take the hindmost. This is especially true wrt oil
As there has been much discussion about deep water oil above, I thought I would attempt a forecast, excluding deepwater from Fig 10. First, historic and forecast deepwater production profiles need to be estimated.
I don't have deep water oil production data, but Colin Campbell provides some data in his newsletters.
http://www.aspo-ireland.org/index.cfm/page/newsletter
In Oct 2007, Wood MacKenzie and Bank of America estimated that deep water production would reach over 8 mbd by 2011.
page 6 of http://icma.eprospectus.edgar-online.com/EFX_dll/EDGARpro.dll?FetchFilin...
Given the current credit crisis, low oil prices and high decline rates of existing deep water production, an estimate of a 7 mbd peak plateau seems reasonable. Other reasons for this 7 mbd peak plateau are that key deep water regions are having trouble increasing production. As discussed above, the USA Gulf of Mexico is in decline. Similarly, Brazil is having trouble increasing offshore production. Angola is on a peak plateau and now subject to OPEC quotas. Nigeria does have potential but it has militant attacks on its oil infrastructure and is also subject to OPEC quotas.
Historic production is from Colin Campbell's newsletters and future production is a mathematical fit, of a 7 mbd plateau and the following decline, to an estimated total URR of 80 Gb.
The chart below shows the deep water oil forecast by the red line. Only in April 2007, Colin Campbell was forecasting an uneconomically constrained peak of 12.4 mbd. In October 2008, he dropped that forecast peak by almost 4 mbd, down to 8.6 mbd. There are enormous engineering and economic challenges in producing deep water oil which must be taken into account.
click to enlarge
Next, the annual deep water production and URR numbers from the above chart were excluded from Fig 10 to give the revised chart below. Excluding deepwater production, peak world crude, condensate and oil sands occurred in 2005 at 70.5 mbd as compared to an estimated 68.1 mbd in 2008.
click to enlarge
Note: The ramp up time to 7 mbd has been slower than forecast in the older first chart and consequently adjusted in the second chart for Colin Campbell's Dec 2008 newsletter.
http://www.aspo-ireland.org/contentFiles/newsletterPDFs/newsletter96_200...
Deep water production for 2007 is now 5.2 mbd. Forecast deep water production is now revised: 2008, 5.7 mbd; 2009, 6.2 mbd; 2010, 6.6 mbd and finally reaching the 7 mbd peak plateau in 2011.
In my opinion this is a perfect example of how partitioning the oil supply into various natural sources makes a lot of sense.
In the case of deepwater the project start timelines are generally long and the production profile falls off sharply.
Deepwater production is not the same as what it replaces and should lead to steeper final decline rates as deepwater production growth stalls.
Regardless its obvious that to maintain our current production rate requires more exploitation "fragile" oil sources.
I wonder if peak oil would be accepted now if Saudi Arabia had never allowed oil exploration?
It doesn't mater where the oil comes from, peak oil will only be accepted once we have passed the peak. Then new plans will be made based on a new reality.